disain eksperimentalkimia.ft.unsri.ac.id/s1/wp-content/uploads/2018/03/modul-desain-e... ·...
TRANSCRIPT

DISAIN EKSPERIMENTAL
STATISTIKA TEKNIK KIMIA LNK@2017

REFERENCE#1 • GEORGE E. P. BOX, PhD, DSc, is Ronald
Aylmer Fisher Professor Emeritus of Statistics and Industrial Engineering at the University of Wisconsin–Madison
• J. STUART HUNTER, PhD, DSc, is Professor Emeritus of Civil Engineering at Princeton University. Dr. Hunter is a member of the National Academy of Engineering and has served as consultant to many industries and government agencies.

DESIGN OF EXPERIMENTS • DOE begins with determining the objectives of an
experiment and selecting the process factors for the study.
• An Experimental Design is the laying out of a detailed experimental plan in advance of doing the experiment.
• Well chosen experimental designs maximize the amount of "information" that can be obtained for a given amount of experimental effort.
• The statistical theory underlying DOE generally begins with the concept of process models.


• The most common empirical models fit to the experimental data take either a linear form or quadratic form.

• A linear model with two factors, X1 and X2, can be written as Y=β0+β1X1+β2X2+β12X1X2+experimental error
• Here, Y is the response for given levels of the main effects X1 and X2 and the X1X2 term is included to account for a possible interaction effect between X1 and X2. The constant β0 is the response of Y when both main effects are 0.

• For a more complicated example, a linear model with three factors X1, X2, X3 and one response, Y, would look like (if all possible terms were included in the model)
• Y=β0+β1X1+β2X2+β3X3+β12X1X2+β13X1X3+β23X2X3+β123X1X2X3+experimental error

• The three terms with single "X's" are the main effects terms. There are k(k-1)/2 = 3*2/2 = 3 two-way interaction terms and 1 three-way interaction term (which is often omitted, for simplicity). When the experimental data are analyzed, all the unknown "β" parameters are estimated and the coefficients of the "X" terms are tested to see which ones are significantly different from 0.

SUMBER KESULITAN PENELITIAN 1. EXPERIMENTAL ERROR
Dapat timbul akibat salah pengukuran, tidak presisi terhadap alat ukur
2. KESULITAN MENUNJUKKAN KORELASI SEBAB AKIBAT
3. KOMPLEKSITAS PENGARUH-2 YANG DITELITI (mengakibatkan penyebaran lebih luas atas experimental error

PERAN DESIAN EKSPERIMENTAL
Memutuskan pola disain kerja eksperimen yang tepat
Menentukan jumlah tempuhan (run) yang efektif
Memprediksi keterkaitan antara variabel satu dnegan yang lain
Memfasilitasi peneuan similaritas perlakuan
Memungkinkan penyederhanaan langkah kerja
Mengarahkan pada pembentukan model/persamaan matematis/empiris

FRACTIONAL FACTORIAL DESIGN • SALAH SATU METODA EFEKTIF DALAM DISAIN
EKSPERIMENTAL TUJUAN MEREDUKSI JUMLAH TEMPUHAN
(MENGHEMAT KONSUMSI BAHAN/METARIAL, ENERGI DAN WAKTU KERJA)
MEMPREDIKSI INTERAKSI ANTAR VARIABEL PENELITIAN UNTUK ANTISIPASI ATAU PENGERUCUTAN MASALAH
MEMUDAHKAN PEMBAHASAN DAN PERUMUSAN KESIMPULAN

CONTOH FACTORIAL DESIGN • SUATU PENELITIAN LABORATORIUM MENETAPKAN TERDAPAT 4 VARIABEL OPERASI, MAKA MENENTUKAN JUMLAH RUN (TEMPUHAN) ADALAH: • Jumlah tempuhan = 2k
• k= jumlah variabel
• Contoh : k = 4
• Run = 2 k = 2^4= 16 run
Penelitian sekurang-2nya melaksanakan 16 tempuhan (asumsi tanpa replikasi) untuk mendapatkan kesimpulan data yang representatif

Langkah Operasional Factorial Design
ANALISIS
MENENTUKAN EFEK UTAMA
OPERASI MATRIKS
MEMBUAT MATRIKS DISAIN (HITUNG JLH TEMPUHAN)
INVENTARISASI FAKTOR-FAKTOR YANG MEMPENGARUHI

CONTOH #1 • SEBUAH EKSPERIMEN D I LABORATORIUM
BERTUJUAN MEMPELAJARI PEMBUATAN LARUTAN R. BERDASARKAN L ITERATUR DAN HASIL PENELITIAN SEBELUMNYA FAKTOR-FAKTOR YANG BERPENGARUH ADALAH TEMPERATUR REAKSI, KONSENTRASI REAKTAN P DAN BERAT KATALIS.
RANCANGLAH LANGKAH PENELITIAN DAN ANALISIS DATA MENGGUNAKAN DISIAN EKSPERIMENTAL
METODE FAKTORIAL DISAIN
ASUMSI REAKSI homogen (fasa liquid) MENGIKUTI PERSAMAAN : P + Q à R + S . Konsentrasi Produk
dianalisa dengan metode titrasi (gram/L)

1. MENGHITUNG JUMLAH TEMPUHAN • JUMLAH VARIABEL (k) = 3 • JUMLAH TEMPUHAN = 2^k = 2^3 = 8 tempuhan
2. MENETAPKAN BATAS VARIABEL • Batas /interval tiap variabel dipilih berdasarkan
penelusuran literatur (terpercaya) atau penelitian pendahuluan yang dilakukan sendiri/group lain
• Susun batasan variabel dengan menetapkan batas terendah dan tertinggi

• Data Variabel
Variabel - + Temperatur (T) , oC 150 180 Konsentrasi Reaktan Q, C (ppm)
20 60
BERAT Katalis (gram) 1 2

4. Matriks Disain Run T C K 1 - - - 2 + - - 3 - + - 4 + + - 5 - - + 6 + - + 7 - + + 8 + + +

Atau Matriks Disain dapat ditulis Run T C K 1 0 0 0 2 1 0 0 3 0 1 0 4 1 1 0 5 0 0 1 6 1 0 1 7 0 1 1 8 1 1 1

5. Pelaksanaan Penelitian (trial) Run T C K RESPON (berat
produk R, g/L) 1 150 20 1 0,65 2 180 20 1 0,72 3 150 60 1 0,54 4 180 60 1 0,68 5 150 20 2 0,52 6 180 20 2 0,83 7 150 60 2 0,45 8 180 60 2 0,80

6. Operasi Matriks Run T C K RESPON (berat
produk R, g/L) 1 - - - - 0,65 2 + - - + 0,72 3 - + - + 0,54 4 + + - - 0,68 5 - - + + 0,52 6 + - + - 0,83 7 - + + - 0,45 8 + + + + 0,80

7. Menentukan Efek Utama
• A. Variabel Temperatur
Setengah Faktorial f = n/2 = 8/2 = 4 VARIABEL A = (1/f) x JUMLAH TEMPUHAN X ( SIGMA VARIABEL A DALAM MATRIKS SESUAI TANDA)
T = (1/4) x ( -T1+T2-T3+T4-T5+T6-T7+T8) = (1/4) x (-0,65+0,72-0,54+0,68-0,52+0,83-0,45+0,80) = +0,87/4 = + 0,2175
Run T RESPON
1 - 0,65 2 + 0,72 3 - 0,54 4 + 0,68 5 - 0,52 6 + 0,83 7 - 0,45 8 + 0,80

Efek Konsentrasi
C = (1/4)x( -C1-C2+C3+C4-C5-C6+C7+C8) = (1/4)x (-0,65-0,72+0,54+0,68-0,52-0,83+0,45+0,80) = -0,25/4 = -0,0625
Run C RESPON 1 - 0,65 2 - 0,72 3 + 0,54 4 + 0,68 5 - 0,52 6 - 0,83 7 + 0,45 8 + 0,80
Bertanda Negatif dan bernilai lebih kecil
dibanding T

Efek BERAT Katalis
K = (1/4) x ( -K1-K2-K3-K4+K5+K6+K7+C8) = (1/4)x (-0,65-0,72-0,54-0,68+0,52+0,83+0,45+0,80) = +0,01 = +0,0025
Run K RESPON 1 - 0,65 2 - 0,72 3 - 0,54 4 - 0,68 5 + 0,52 6 + 0,83 7 + 0,45 8 + 0,80
Bertanda POSITIF dan bernilai lebih kecil
dibanding T

KESIMPULAN SEMENTARA • TEMPERATUR menunjukkan pengaruh paling
besar terhadap konsentrasi produk dibandingkan KONSENTRASI REAKTAN DAN JENIS KATALIS.
• Karena Positif, Perubahan temperatur berpengaruh terhadap peningkatan konsentrasi produk
• Perubahan KONSENTRASI REAKTAN Q(makin besar C) berpengaruh terhadap konsentrasi produk berkurang (karena bertanda negatif).
• BERAT KATALIS berpengaruh paling kecil terhadap konsentrasi produk yang terbentuk

UJI LANJUT – EFEK INTERAKSI VARIABEL
• UNTUK 3 VARIABEL DALAM RISET • DAPAT DIHITUNG INTERAKSI 2
VARIABEL, CONTOH INTERAKSI VARIABEL T DAN C, T DAN K, C DAN K
• DAPAT DIHITUNG INTERAKSI 3 VARIABEL, TCK
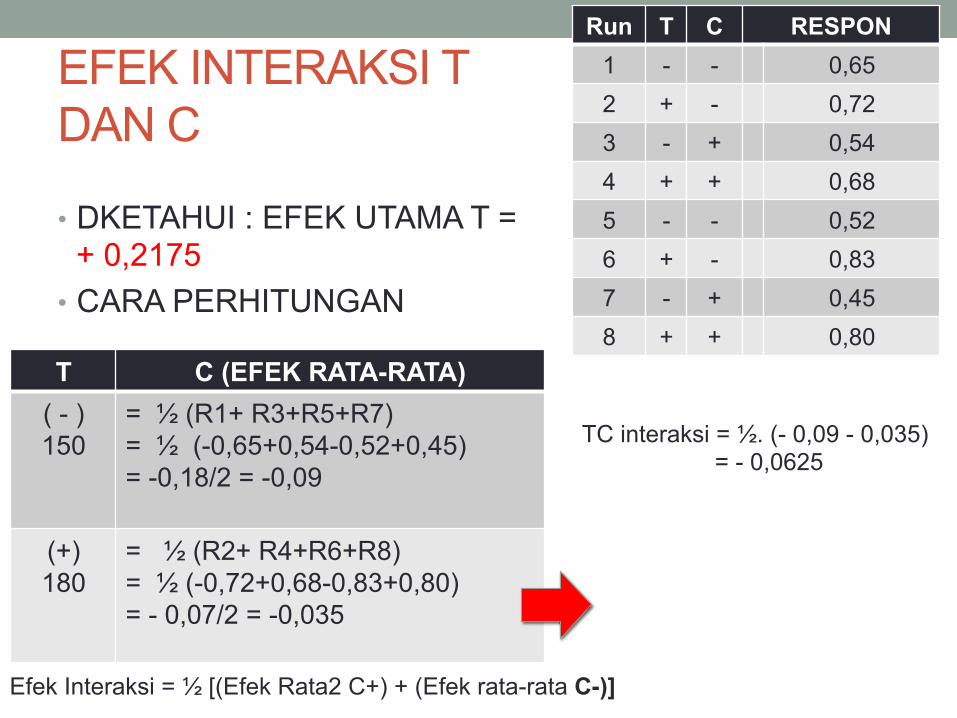
EFEK INTERAKSI T DAN C
• DKETAHUI : EFEK UTAMA T = + 0,2175
• CARA PERHITUNGAN
T C (EFEK RATA-RATA) ( - ) 150
= ½ (R1+ R3+R5+R7) = ½ (-0,65+0,54-0,52+0,45) = -0,18/2 = -0,09
(+) 180
= ½ (R2+ R4+R6+R8) = ½ (-0,72+0,68-0,83+0,80) = - 0,07/2 = -0,035
Run T C RESPON 1 - - 0,65 2 + - 0,72 3 - + 0,54 4 + + 0,68 5 - - 0,52 6 + - 0,83 7 - + 0,45 8 + + 0,80
Efek Interaksi = ½ [(Efek Rata2 C+) + (Efek rata-rata C-)]
TC interaksi = ½. (- 0,09 - 0,035) = - 0,0625

EFEK INTERAKSI T DAN K
• DKETAHUI : EFEK UTAMA T = + 0,2175
• CARA PERHITUNGAN
T K (EFEK RATA-RATA) ( - ) 150
= ½ (R1+ R3+R5+R7) = ½ (-0,65-0,54+0,52+0,45) = -0,18/2 = -0,09
(+) 180
= ½ (R2+ R4+R6+R8) = ½ (-0,72+0,68-0,83+0,80) = - 0,07/2 = -0,035
Run T K RESPON 1 - - 0,65 2 + - 0,72 3 - - 0,54 4 + - 0,68 5 - + 0,52 6 + + 0,83 7 - + 0,45 8 + + 0,80
Efek Interaksi = ½ [(Efek Rata2 C+) + (Efek rata-rata C-)]
TK interaksi = ½. (- 0,555 + 0,19) = - 0,365/2 = - 0,1825

EFEK INTERAKSI C DAN K
• DKETAHUI : EFEK UTAMA T = • CARA PERHITUNGAN
C K (EFEK RATA-RATA) ( - ) 20 = ½ (R1+ R2+R3+R4)
= ½ (-0,65-0,72-0,54-0,68) = -1,295
(+) 60 = ½ (R5+ R6+R7+R8) = ½ (0,52+0,83+0,45+0,80) = 1,3
Run C K RESPON 1 - - 0,65 2 - - 0,72 3 + - 0,54 4 + - 0,68 5 - + 0,52 6 - + 0,83 7 + + 0,45 8 + + 0,80
Efek Interaksi = ½ [(Efek Rata2 C+) + (Efek rata-rata C-)]
CK interaksi = ½. (-1,295+ 1,9) = 0,0050 / 2 = 0,0025

Efek interaksi 3 faktor (TCK)
Run T C K respon TC CK TK TCK
1 - - - 0,65 + + + - 2 + - - 0,72 - + - + 3 - + - 0,54 - - + + 4 + + - 0,68 + - - - 5 - - + 0,52 + - - + 6 + - + 0,83 - - + - 7 - + + 0,45 - + - - 8 + + + 0,80 + + + +
OPERASI MATRIKS, SBB

PERHITUNGAN EFEK INTERAKSI TCK RATA-RATA
TCK = ¼ (R1+ R2+R3+R4+R5+R6+R7+R8) = ¼ (-0,65+0,72+0,54-0,68+0,52-0,83-0,45+0,80) = - 0,0075
respon
0,65 0,72 0,54 0,68 0,52 0,83 0,45 0,80
TCK
-
+
+
-
+
-
-
+

pengertian • Interaksi TK bernilai lebih tinggi, disusul interaksi TC dan
terakhir CK • Artinya perubahan respon (konsentrasi produk)
berpotensi lebih besar dipengaruhi interaksi antara variabel T dan K dibanding variabel lainnya
• Interaksi 3 variabel (TCK) sekaligus memberi pengaruh yang lebih kecil dibanding efek interaksi lainnya. Pengaruhnya negatif terhadap respon.
RENCANA TINDAK LANJUT : Fokus penelitian uatama, fokus pada variasi T dan K Rentang variable T dan K dipilih lebih dekat (aspek
sensitifitas)

Latihan • Penelitian pembuatan bioetanol dari air cucian beras
dilakukan dengan tahap hidrolisis menggunakan katalis X. Konsentrasi glukosa dalam air cucian beras yang di teliti adalah 150 ppm dan 300 ppm. Dalam proses hidrolisis Faktor yang diduga berpengaruh adalah temperatur, waktu hidrolisis dan kecepatan pengadukan.
• Produk hidrolisis dianalisa kadar etanolnya menggunakan Gas Chromatography.
• Anggaplah data ini merupakan hasil uji coba penelitian pendahuluan. Ikuti prosedur Disain eksperimental Factorial Design. Lakukan analisa-analisa statistikal atas data tersebut. Hasilkan beberapa rekomendasi.

data SAMPEL
(KONSENTRASI GLUKOSA (ppm)
WAKTU HIDROLISIS (menit)
SUHU HIDROLISI (oC)
KECEPATAN PENGADUKAN (rpm)
KADAR ETANOL (%)
150
45
100 150 1.18 200 2.33
125 150 3.33 200 3.86
150 150 2.34 200 4.23
60
100 150 3.87 200 5.55
125 150 4.33 200 5.12
150 150 6.18 200 6.65
90
100 150 4.53 200 5.44
125 150 2.15 200 2.86
150 150 2.75 200 3.33
sampel

KONSENTRASI GLUKOSA
(ppm)
WAKTU HIDROLISIS (menit)
SUHU HIDROLISI (oC)
KECEPATAN PENGADUKAN (rpm)
KADAR ETANOL (%)
300
45
100 150 3.17 200 4.15
125 150 3.33 200 4.12
150 150 4.18 200 5.75
60
100 150 7.23 200 8.56
125 150 9.54 200 11.77
150 150 10.56 200 11.05
90
100 150 2.87 200 3.95
125 150 4.33 200 5.39
150 150 2.78 200 4.65
