discount cash flow model of synnex (thailand) public
TRANSCRIPT

DISCOUNT CASH FLOW MODEL OF SYNNEX (THAILAND)
PUBLIC COMPANY LIMITED
KANSASIN WONGSRIUDOMPHORN
A THEMATIC PAPER SUBMITTED IN PARTIAL
FULFILLMENT OF THE REQUIREMENTS FOR
THE DEGREE OF MASTER OF MANAGEMENT
COLLEGE OF MANAGEMENT
MAHIDOL UNIVERSITY
2015
COPYRIGHT OF MAHIDOL UNIVERSITY

Thematic paper
entitled
DISCOUNT CASH FLOW MODEL OF SYNNEX (THAILAND)
PUBLIC COMPANY LIMITED
was submitted to the College of Management, Mahidol University
for the degree of Master of Management
on
December 18, 2015
………………………..…………........
Miss Kansasin Wongsriudomphorn
Candidate
......................................................... ................................................................
Asst. Prof. Nareerat Taechapiroontong, Asst. Prof. Piyapas Tharavanij,
Ph.D. Ph.D.
Advisor Chairperson
......................................................... ................................................................
Assoc. Prof. Annop Tanlamai, Vasan Siraprapasiri,
Ph.D. M.Sc.
Dean Committee member
College of Management
Mahidol University

ii
ACKNOWLEDGEMENTS
It is a great pleasure for me to acknowledge the assistance and contributions
of many individuals in making this thesis a success.
First and foremost, I would like to express my deepest gratitude to my advisor,
Ajarn Vasan Siraprapasiri and Asst.Prof. Nareerat Taechapiroontong for their valuable
advices, ideas, and feedbacks during the process in doing this thesis. I would like to
thank Asst. Prof. Piyapas Tharavanij for suggestions to make this thesis better. Without
their guidance and support, this thesis cannot be completed on time.
Secondly, I would like to thank my partner, Mr. Taradorn Khiewmeesuan
and also like to thank the staff at CMMU for their supports.
Finally, my graduation would not be achieved without the best support
from my parents, who help me for everything and always gives me greatest love and
support. Lastly gratefully special thanks to my relation and my friends for their help
and encouragement.
Kansasin Wongsriudomphorn

iii
DISCOUNT CASH FLOW MODEL OF SYNNEX (THAILAND) PUBLIC
COMPANY LIMITED
KANSASIN WONGSRIUDOMPHORN 5749119
M.M.
THEMATIC PAPER ADVISORY COMMITTEE: ASST. PROF. PIYAPAS
THARAVANIJ, Ph.D., ASST. PROF. NAREERAT TAECHAPIROONTONG, Ph.D.,
VASAN SIRAPRAPASIRI, M.Sc.
ABSTRACT
This thematic paper demonstrated how to value the stock price of Synnex
(Thailand) Public Company Limited (SYNNEX) which applied the concept of the
discount cash-flow models. It reflected the company’s ability whether they can be survive
and grow without equity or long term debt. I applied discount cash-flow model to
express the valuation of the company’s stock price. the valuation from discounted cash
flow method is the most appropriate because it takes into account the fundamental
component of the firm such as net operating profit after-tax, net capital expenditure,
and working capital, and computes these factors to obtain free cash flow to firm, the
free cash flow available to both creditors and shareholders if the firm have no debt
then discounts the value of free cash flow to firm and terminal value to the current
period. The result is the enterprise value of the company. After subtracting EV from
the value of interest bearing debts, non-operating assets, non-controlling interests, and
value of equity, the result will be the value of equity of the firm. Therefore, our calculation
of the stock price by using the discounted cash flow method, we concluded that the
current appropriate price should be around 6.43 baht per share. So the recommendation is
to buy the stock in the market since it is undervalue.
KEY WORDS: SYNNEX / Valuation / Discount cash flow model / Technology
56 pages

iv
CONTENTS
Page
ACKNOWLEDGEMENTS ii
ABSTRACT iii
LIST OF TABLES vi
LIST OF FIGURES vii
CHAPTER I INTRODUCTION 1
1.1 Highlights 1
1.2 Business Description 3
1.3 Business Strategies 5
1.4 Business Goals 6
1.5 Macro-Economic Analysis 7
1.6 Industry Analysis 9
1.6.1 IT & Telecoms 9
1.6.2 Thailand ICT Market 10
1.6.3 Smartphone Vendor Market Share, 2015 Q3 11
1.7 Competition Analysis 11
1.8 Investment Summary 14
CHAPTER II MATERIALS AND METHODS 16
2.1 Valuation 16
2.1.1 Discounted Cash Flow Model: FCFF 16
2.1.2 Projected Cash Flow and Assumptions 17
2.1.3 Summary growth rate 18
2.1.4 Revenue growth rate 18
CHAPTER III DISCUSSION 21
3.1 Financial Statement Analysis 21
3.1.1 Summary figures from financial statements
(Size analysis) 21
3.1.2 Common Size analysis 22

v
CONTENTS (cont.)
Page
3.1.3 Trend analysis 25
3.1.4 Financial ratios: Return 26
3.1.5 Financial ratios: Risk 27
3.2 Investment Risks and Downside Possibilities 29
3.2.1 Risk Matrix 32
3.2.2 Assumption for Investment Risks and Downside
Possibilities 33
REFERENCES 35
APPENDICES 36
Appendix A: The Business Structure of the Company Group 37
Appendix B: Major Shareholders and Free-Float 39
Appendix C: Corporate Governance (CG) 40
Appendix D: SWOT analysis 43
Appendix E: Porter's Five Forces 46
Appendix F: Statement 49
Appendix G: Stock and Price 54
BIOGRAPHY 56

vi
LIST OF TABLES
Table Page
1.1 Overall share summary 2
1.2 Financial Highlight 2
1.3 Their total revenue and their market share are presented in the table below 13
2.1 Key assumption for WACC calculation 17
2.2 The key assumptions in cash flow projection and terminal value 17
2.3 Percentage of revenue 18
2.4 Summary growth rate 18
2.5 Growth rate of Synnex, indstry and sector 18
2.6 FCFF valuation of Synnex 20
3.1 Income Statement 23
3.2 Balance Sheet 24
3.3 Key Financial Ratio in 2014 29
3.4 Risk Matrix 32
3.5 Sensitivity Analysis 33
3.6 Sensitivity Analysis of Downside Possibilities 34

vii
LIST OF FIGURES
Figure Page
1.1 Dividends and Share Information 2
1.2 Income structure 5
1.3 Major product group revenue 7
1.4 Total Revenue based on quarterly period 7
1.5 Economic projection (2015-2016) 8
1.6 Thailand Economy Outlook in Q3/2015 (Source: NESDB 8
1.7 Declining in market share of PC in 2014 11
1.8 Financial data of SVOA, MSC, SIS and Synnex in 2014 13
3.1 Income statement's size analysis 21
3.2 Balance sheet's size analysis 22
3.3 5 years trend of revenue 25
3.4 5 years trend of COGS and SG&A 26
3.5 5 years trend of Gross profit 26
3.6 5 years trend of Profit margin and EBIT margin 27
3.7 5 years trend of ROA and ROE 27
3.8 5 years trend of Current ratio and Quick ratio 28
3.9 5 years trend of Cash Conversion Cycle 28
3.10 5 years trend of D/E ratio and Interest coverage ratio 28

1
CHAPTER I
INTRODUCTION
1.1 Highlights
1. BUY recommendation under expanding of ICT industry in Thailand:
ICT industry is expected to grow by 3.8 at ending of 2015 and up to 4.5% in 2016 while
GDP growth rate was estimated up to 4% in 2016. Current actual revenue for 9 months
in Q3/2015 is Baht 16,184 million (source: www.set.co.th) which above proportion of
forecast revenue for 9 months ending September 30, 2015 at Baht 15,092 million.
2. SYNEX’s business model enables reliable performance: As efficient as
the firm is, SYNEX delivers market price with high service standard and on-time delivery
product, which competes on par in the market of ICT industry. The firm can gain high
amount by smartphone, server, flash memory and network equipment via developed
distribution channels. Smartphone is the best section that can make strong growth in
sales although there is fast changing world of information and communications technology.
Besides, the firm also developed distribution channels in the countries of Indochina
region and its double growth rate from export sales to these countries at 118% in 2014.
3. Network Evolution: Thailand is in network evolution to next generation.
4G is the fourth generation of mobile telecommunications technology. Network Providers
tried to convince the customer to upgrade network from 3G to 4G. The people have to
use the high performance smartphone to support this network.
4. Dividend Policy: Policy of paying a minimum of 40% of net profit after
tax, after reserve required by laws and other reserves.

2
Table 1.1 Overall share summary
Share Summary
Market SET
Industry Technology
Sector ICT
Issued shares (Paid-up) THB 770.3m
Par value THB 1.0
Market Capitalization THB3,466.5 m
52 Weeks price range THB 2.7/5.45
Major shareholder
- TKS. Technologies Plc. 38.51%
- King's Eye Investments Ltd. 34.99%
% Free float 25.48%
Book value per share THB 2.68
Table 1.2 Financial Highlight
Ticker: SET: SYNEX Recommendation: BUY
Price: THB 4.50 Target Price: THB 6.43
Figure 1.1 Dividends and Share Information
Financial Highlight
2012A 2013A 2014A 2015E 2016E 2017E
Total Revenue (Bt,m) 20,650 18,779 19,164 20,123 21,129 22,185
EBITDA (Bt,m) 403 254 250 480 518 545
Net Proft (Bt,m) 362 213 210 326 344 363
EPS (Bt) 0.52 0.28 0.27 0.42 0.45 0.47
EPS Growth (%) -5.5% -46.2% -3.6% 56.9% 5.4% 5.4%
DPS (Bt) 0.32 0.15 0.13 0.17 0.18 0.19
ROA (%) 11.4% 6.1% 5.4% 5.9% 6.2% 6.2%
ROE (%) 20.4% 10.8% 10.1% 14.9% 14.8% 14.7%
D/E (%) 1.55 1.29 1.65 1.39 1.39 1.37
Dividends and Share Information

3
1.2 Business Description
Synnex was established in 1988 in name Compex to import and distribute
computers, computer peripherals, software, and IT system. Its products are distributed
in both Thailand and overseas. In 2002, Compex (Thailand) Company Limited changed
its name to Synnex (Thailand) Company Limited as well as relocating the Company's
Head Office to Sukontasawat where the Company's transport and distribution terminal
was established and managed applying the distribution technology transferred from the
Taiwan's Synnex Group. The company listed on the Stock Exchange of Thailand in
2008..
Synnex (Thailand) Public Company Limited distributes computers, computer
peripherals, software, IT system, computer consumables and Communication Device
of over 50 world-recognized brands whereas the Company’s customer base includes
countrywide computer retailers and wholesalers, major software solutions providers,
local-branded computer manufacturers, department stores, giant superstores, and
stationary shops, and etc.
Owing to the wide and comprehensive assortment of products and credibility
of the Company, partners and customers have confidence in placing orders for products
thanks to the Company’s convenient process in product ordering, after-sale service,
and timely product shipment. Products distributed by the Company can be categorized
into 9 groups with details as follows:
1. Component Product Group: CPG
CPG incorporates computer components comprising of main products
namely Motherboard, Hard Disk Drive, CPU, DRAM, CD-ROM, and Optical Drive.
In responding to the DIY PC market, consumers could selectively buy components to
configure own PCs with specifications answering their needs the most or to replace
certain parts of existing PCs to accelerate the computer performance
2. Consumables & Supply Group: CSG
CSG covers consumables and supplies which constantly need to be purchased
for replacement. Main products include, for example, Ink Cartridge, Toner, Ribbon,
and Office Paper.

4
3. Image & Printing Product Group: IPG
IPG comprises of printing products with major product lines as Inkjet Printer
and Laser Printer categorized by function as all-in-one kind (printer, fax, copier, and
scanner) and single kind (printer only).
4. Network Product Group: NPG
NPG products encompasses network components comprising of major
products such as Switch, Hub, Router, Wireless LAN, UPS, Server, Storage, Network
Cabling System, and Internet Security.
5. Display Product Group: DPG
DPG includes such main products as Display Screen and Projector with
the Company being the authorized distributor of DPG products of several leading
brands with large to largest shares in the market. In addition, the Company is the sole
authorized importer and distributor of the high-quality, EIZO-brand display screens in
Thailand.
6. System Product Group: SPG
SPG includes complete computer sets with such focal products as Portable
Computer (Notebook, UltraBook, Netbook), Desktop Computer, Server, and Configure-
to-Order (CTO) Computer of Lemel, Taiwan’s Synnex Group’s brand. Lemel’s CTO
Computer has been certified by Thai Industrial Standards Institute, Ministry of Industry,
for its standards on safety and radio frequency and by National Electronics and
Computer Technology Center, NECTEC, on its durability towards the environmental
heat that meets the standard.
7. Multimedia Product Group: MPG
MPG covers electronic devices used with applications on computers or
with computers or Smartphones. Main products are, for instance, External Hard Drive,
Media Player, USB Flash Drive, Flash Card, Digital Camera, and Accessories such as
Earphone/Headphone used with computers and Smartphone as well as Input Devices
namely Computer Mouse and Keyboard.
8. Software Product Group: SWG
SWG consists of software products featuring Operating System Software
for PCs, Application Software, Operating System for Server, and Safety Software for
Network, 2D and 3D Program for instance.

5
9. Communication Devices Group: CDG
CDG encompasses communication devices and other gadgets and accessories
namely Smartphone and Tablet PC operated on a variety of systems such as Android
OS, Windows OS, and etc.,
Figure 1.2 Income structure
1.3 Business Strategies
Synnex has strategies to support the Company’s core business and maintain the
position of market leadership of total technology solutions, and to manage the business
with practices in compliance with good corporate governance together with social and
environmental responsibilities as follows.
1. People: To define systematic human resource planning to support the
expansion of business clusters and personnel potential development planning, body of
knowledge transfer, career advancement planning, fair and appropriate compensation
structuring in order to promote and motivate capable personnel to move up to important
positions and earn their loyalty with the organization.
2. Portfolio Restructure: To concentrate on the integrated adjustment of
product selection process to assure that products chosen are of excellent quality with
popular market demand to best respond to potential customers’ needs and to consistently
generate great profit to the organization.

6
3. Productivity: To utilize the information technology system to achieve
speed in competition and to develop innovation for the work process to be modern,
swift, concise, and efficient and to lower organizational costs in different aspects.
4. M&A: To introduce mergers and acquisitions to create business opportunities
with supporting business partners in a step towards the expansion of business clusters
and to maintain the position of market leadership of total technology solutions.
5. Oversea Investment: To invest in overseas countries to support the growth
of the upcoming ASEAN Economic Community with the focus on nations in the
Indochinese region as priorities for thorough business expansion covering both domestic
and foreign investments to be added to the Company’s portfolio and generate returns
for shareholders.
1.4 Business Goals
The Company has established business goals and set up business-to-business
network to support the steady and sustainable growth of the organization while having
successfully maintained as the market leader of information and technology products
through the extensive experience and expertise over the long course of business operations.
The Company's comprehensive range of products distributed are manufactured by vendors
of world-class standards which have trusted and appointed the Company as their authorized
product distributor over 50 product brands.
In the year 2015, the Company's corporate strategies focus on diversifying
the business, growing market share, increasing the distribution ratio of products with
great profitability, adding up distribution channels of products through e-commerce,
networking with business partners more extensively, expanding distribution channels
overseas in Indochina in response to the launch of the ASEAN Economic Community
(AEC), empowering personnel to increase efficiency in job performance, reviewing
employee compensation and remuneration structure for fair practice to sustainably
retain quality employees with the organization, preparing the annual budget and cost
and expense control measures to ensure that all activities of the Company are implemented
in most effective manners.

7
Figure 1.3 Major product group revenue
Figure 1.4 Total Revenue based on quarterly period
1.5 Macro-Economic Analysis
Evaluation of Thailand GDP growth rate
The Gross Domestic Product (GDP) in Thailand was worth 373.80 billion
US dollars in 2014. The GDP value of Thailand represents 0.60 percent of the world
economy. On the 16th of November 2015, NESDB projected that the Thai economy in
2015 will expand by 2.9 percent, improving from 0.9 percent growth in 2014. Private
consumption and total investment is expected to grow by 2.0 and 4.6 percent respectively.
Thai economy in 2016 is forecasted to grow by 3.0 – 4.0 percent. It is expected that
export value will grow by 3.0 percent, private consumption and total investment will
grow by 2.6 and 9.5 percent respectively. Headline inflation is expected to lie between
1.0 – 2.0 percent and the current account balance will be in a surplus of 5.7 percent of
GDP.
Although the country’s political future appeared uncertain in the latter part
of 2013 and into 2014, Thailand has remained vibrant and many of its economic sectors

8
remained unaffected by recent tensions. On the cusp of ASEAN Economic Community
(AEC) integration, due to be completed by the end of 2015, Thailand is in a strategic
position to benefit from increased regional competition and cooperation, and so are
foreign investors. Thailand has competitive strengths to draw on, including a central
geographic location, a regional manufacturing centre for a broad array of goods and a
relatively solid infrastructure base.
Figure 1.5 Economic projection (2015-2016)
Figure 1.6 Thailand Economy Outlook in Q3/2015 (Source: NESDB

9
1.6 Industry Analysis
1.6.1 IT & Telecoms
With the country continuing its telecoms development, Thailand’s internet
connectivity is about to improve exponentially. Wireless speeds are on their way up
and wireless access is expanding rapidly. In 2001 the passing of the Telecommunications
Business Act established three types of licenses: one for internet service providers
without a network, one for those with infrastructure, and one for private networks. In
the second quarter of 2013 Thailand’s broadband adoption rate was up 191% quarter-
on-quarter. In addition, the country ranked 39th in the world in terms of broadband
adoption and 22nd in terms of connection speed. The local data centre business is
forecast to expand by 21% in 2013 to around $56m, due to the adoption of cloud
computing, the need for disaster recovery and the increasing connectivity within the
ASEAN region. The outlook for the telecoms sector is more positive than it has been
in years. Given the 3G auction and the bright prospects for 4G, companies are set to
see their business improve, and customers will likely benefit from better performance.
Interbrand’s 2014 ranking of best global brands saw the top 20 companies
involving with communication and interface technology businesses namely Apple,
Google, IBM, Microsoft, Samsung, Intel, CISCO, Oracle and HP. During the volatile
period of the economy, globally and domestically, the IT industry also experienced
fluctuations resulting in swift adjustments and changes, including the consumer behavior
that readily changed in response to changing technology trends. Results of the survey
by International Data Corporation (IDC) found that the total market value of personal
computers worldwide in 2014 had a declining growth rate when compared to the preceding
year. Number of PCs delivered had a decrease of 6.50 million units, or equal to 2.1%.
Most of consumers switched to using such portable devices as tablets and smart phones,
reflecting changing technology trends, due to the product versatility, portability, and
usage practicality. This was consistent with the market conditions and consumer
behavior that occurred in Thailand.
Worldwide PC shipments totaled nearly 71.0 million units in the third
quarter of 2015 (3Q15), according to the International Data Corporation (IDC) Worldwide

10
Quarterly PC Tracker. This volume represented a year-on-year decline of -10.8% – slightly
worse than projections for a decline of -9.2%.
Although the overall market continued to see double-digit declines, and
even the top vendors saw shipments decline from a year ago, the top 4 vendors performed
much better than the rest of the market. Collectively, the top 4 vendors saw shipments
fall by -4.5% from a year ago compared to a decline of almost -20% for the rest of the
market. The advantages of scale, concentration on portable PCs, deeper penetration of
distribution channels in emerging regions, as well as smaller vendors exiting the market
are all aiding the largest vendors.
1.6.2 Thailand ICT Market
THE ICT (information and communications technology) industry in Thailand
is expected to grow by only 3.8 per cent to Bt677.8 billion this year, while innovation
development will drive the industry in 2016, according to International Data Corporation.
IDC expects that ICT spending next year in 2016 will grow by 4.5 per cent to Bt708.4
billion. The factors driving the IT industry will come with the government, which plans to
lay down hard and soft infrastructure to support its "digital economy" scheme. Meanwhile
small and medium-sized enterprises will utilize new IT solutions and platforms to
make their business more competitive by improving their productivity and efficiency.
Thailand's telecom spending, driven by the high usage of mobile data, is
forecast to grow by 6.2 and 6.5 per cent in 2015 and 2016 respectively. The commercial
launch of 4G networks will be crucial to the growth of not only Thailand's
telecommunications sector but also the overall economy. The sheer speed of 4G can
improve productivity, drive innovation, facilitate new services and eventually create
new businesses.
Regional Highlights: Asia/Pacific (excluding Japan) – Volume was close
to expectations this quarter. The market was softer compared to the previous year due
to currency impact on the region and clearing of channel inventory as the main priority
for many countries. Some big projects were postponed, including an education project
in India. The commercial market was soft and was generally supported by government
projects in many countries.

11
In the global market, concerning brands in the personal computer product
group, Lenovo was ranked number 1, followed by HP, Dell, ACER, and Apple respectively.
1.6.3 Smartphone Vendor Market Share, 2015 Q3
Growth of the smart phones in Q3, 2015 was reflected from a rise in delivery of
more than 355.2 million units, up 6.8% from the 332.6 million units in 3Q14. The
market leaders of smart phones continued to be Samsung, Apple, and Huawei respectively.
Therefore, the market value of the operating systems of smart phones in 2015 was
dominated by Android which maintained market share at most 83 % in Q2, 2015,
followed by iOS, and Windows Phone
Figure 1.7 Declining in market share of PC in 2014
1.7 Competition Analysis
The Company’s business operations concern products related to communication
and interface technology with the TOP 20 world-class brands’ appointing the Company as
the authorized distributor, resulting in the Company’s distributing of products with
high market share and a wide assortment of products such as component product group,
network product group, software product group, communication device product group,
and printing and supplies product group, for instance. The Company employs the strategies

12
of having a broad customer base to extensively cover sales areas and operating branch
offices across all regions to promptly answer the needs of upcountry customers.
In Technology/ Information & Communication Technology industry, there
are more than 10 manufacturers in the country to be related companies. The SYNNEX
(Thailand) PCL (“The Company”) is a biggest of distribution for various IT product
manufacturers cause from the market cap in current position as Baht 3.71 billion. There
are 4 companies that operate in the same business as the Company and they are
considered as the large companies which directly compete with the Company, namely
as follows:
1. MSC: Metro Systems Corporation Public Company Limited
The Company is a distribution agency for computer hardware and software
solutions, including full IT services. The Company operates four business segments,
including computers and equipment, computer software, supplies and office equipment,
rental and other services. The Company divides its product and service lines into categories,
namely enterprise system group (ESG), which distributes hardware products; solutions
integration group (SIG), which delivers software solutions and provides system installation
services, and office supplies group (OSG), which distributes office supplies products,
such as personal printers, cameras and projectors through telemarketing.
2. SIS: SiS Distribution (Thailand) Public Company Limited
The Company is a distributor for various IT product manufacturers, including
Acer, Apple, HP, IBM, Lenovo, Asus, Gateway, MSI, Samsung, Toshiba, Garmin
Asus, HTC, Xerox, OKI, Ricoh, Nikon, Philips, Panasonic, Sanyo, EMC, Iomega,
Black Berry, Promise, QNAP, Western Digital and Fuji-Xerox. The Company operates
four main business segments based on the products, which are commercial product
segment, consumer product segment, value added product segment and phone segment.
Its subsidiaries include SiS Venture Company Limited, which invests in businesses
connected to the Company’s core business, and Qool Distribution (Thailand) Company
Limited, which is involved in smart phone distribution.
3. SVOA: SVOA Public Company Limited
The Company’s principal business is sales of IT products, consulting and
system integration, as well as maintenance of computer systems. It operates four business
segments: IT terminal products strategic business unit, system integration strategic

13
business unit, IT project strategic business unit, and financial services in forms of factoring,
leasing and hire purchase. The products include projectors, desktops and workstations,
scanners, cutting machines, multimedia products, tablets, keyboards and software
products, among others. The Company’s subsidiaries comprise Asys Computer Co., Ltd.
and DataOne Asia (Thailand) Co., Ltd.
Table 1.3 Their total revenue and their market share are presented in the table
below
Overall, SIS is a major direct competitor with the Company. They manage
similar electronics and devices, distribution to the same target group, and providing
business services to expand their business (i.e., software development, after service
center). Besides, SIS have same common size in total asset, total liabilities, total equity,
total revenue, and net profit , thus, SIS and SYNEX have little flexibility in their
business models and have adapted to competing for the same suppliers and customers.
Figure 1.8 Financial data of SVOA, MSC, SIS and Synnex in 2014
Price
4-Dec-15
MSC 5.25 0.61 8.59 1.29 0.27 1.89B
SYNEX 4.82 0.41 11.62 1.75 0.19 3.71B
SIS 4.66 0.5 9.3 1.1 0.09 1.63B
SVOA 1.54 0.12 12.47 0.7 0.18 1.09B
Symbol
Valuation YTD 31/12/2014
Earnings per
shareP/E ratio
Price-to-
book ratio
Price-to-
sales ratioMkt Cap

14
1.8 Investment Summary
1. Manage warehouse and distribution center
The Company’s warehouse and distribution center started implementing a
new warehouse management system called Automatic Storage and Retrieval System
(ASRS) to store and retrieve products in the warehouse using robotic arms and the
conveyor controlled by a computerized system for effective product storage and retrieval,
linking ASRS with the management system effectively. The Company runs a system
on the Company’s website and mobile application for product warranty checking and
product repair and exchange status checking, which can be accessed on one’s own all
the time
2. Expanded distribution channel to E-Commerce & Digital Market
The Company expanded distribution channel to E-Commerce& Digital
Market, for Online and Digital market to increase market share and quick responsiveness
on customer requirement to access products information for purchasing. Besides, the
Company publishes a digital magazine via the Company’s website www.synnex.co.th,
called “Synnex (Thailand) Pricelist” on a monthly basis with dealers and IT shops as
target readers to promote products, inform product details, and provide updates on
technologies of new products. In addition, dealers can ascertain wholesale prices and
price adjustments of products from the magazine. The Company distributes free copies
of magazine, Synnextra, every 45 days to dealers across the country to reach to consumers
patronizing dealers’ shops. Details of various IT technology products together with
retail prices of products are included in the magazine. Consumers and website viewers
can also download the online version of Synnextra.
3. Expand distribution channels oversea in Indochina
The Company has planned and researched on the expansion of distribution
channels to foreign countries in Indochina since the year 2013, targeting to acquire the
market share in three countries namely the Republic of the Union of Myanmar (Myanmar),
the Kingdom of Cambodia. (Cambodia), and the Lao’s People’s Democratic Republic
(Lao PDR), as these three countries have been maintaining diplomatic relations with
Thailand for a long time. Additionally, the market value of Thailand’s border trades
with these countries with neighboring territories is statistically significant with the

15
consumer awareness target from exports to foreign countries targeted at THB 1,000
Million in 2016.
4. Invest in marketing network of AEC country
The Company has collaborated with partners in each country for business
marketing. For instance, in Myanmar, the marketing plan currently lays an emphasis
on product distribution through a single dealer with staff from Thailand sent over to
station at the office in Rangoon to support the dealer with marketing and to transfer the
management knowledge to the dealer in Myanmar. In the meantime, for Cambodia, the
Company has begun penetrating the market since the fourth quarter of 2014 by selling
network devices to a number of system integrators (SIs). For the year 2015, the Company
plans to enter the IT consumer product market and seek more business partners to be
authorized representatives for marketing and distributing products in Cambodia. For
Lao PDR, the Company’s major customers are successful distributors of communication
devices and smart phones in the country which have formed business partnership with
the Company at present. The market expansion plan in 2015 aims at increasing sales
from network devices and system products to partnering system integrators, empowered
by the business capacity of Synnex (Thailand) and benefiting from the geographical
advantage that reduces costs of transportation in order to win the market share from
such trading countries as the Republic of Singapore or the Republic of Vietnam.
5. Social Responsibility Project
The Company continues to focus on giving back to the society by continuously
patronizing several projects to provide access for the youth of the nation to learning
resources together with news and information such as “Library IT by Synnex”; delivered a
series of computers installed with the learning software of electronic books to schools
across the country including Bangkok and 76 upcountry provinces , and the second
project “Chang Nork Krob” (Creative Technician Development) with the purposes to
promote skills of repairing IT equipment among local vocational students nationwide
to help them generating earnings with the Company’s supporting of IT replacement
parts and equipment.

16
CHAPTER II
MATERIALS AND METHODS
2.1 Valuation
In order to find the reasonable value of SYNNEX’s stock price, we applied
two valuation methods. The first method is the discounted cash flow model which is
the type of valuation where appropriate for evaluating the value of the firm that has a
good fundamental. Moreover, the second is the multiples method which reflects the
market perception and interpretation toward the company stock. Therefore, those
methods will combine the firm’s intrinsic value and market attitude, reflected by the
market understanding toward the company’s stock price, together.
2.1.1 Discounted Cash Flow Model: FCFF
From our calculation, the valuation from discounted cash flow method is
the most appropriate because it takes into account the fundamental component of the
firm such as net operating profit after-tax, net capital expenditure, and working capital,
and computes these factors to obtain free cash flow to firm, the free cash flow available
to both creditors and shareholders if the firm have no debt then discounts the value of
free cash flow to firm and terminal value to the current period. The result is the enterprise
value of the company. After subtracting EV from the value of interest bearing debts,
non-operating assets, non-controlling interests, and value of equity, the result will be
the value of equity of the firm. Therefore, our calculation of the stock price by using
the discounted cash flow method, we concluded that the current appropriate price
should be around 6.43 baht per share. So the recommendation is to buy the stock in the
market since it is undervalue.
In calculation, the discounted cash flow approach, as shown in the formula
below

17
EV+ Cash = value of debt + value of equity
Cost of Capital : WACC = (E/V)* [Rf*Beta*(Rm-Rf)] + (D/V)* Rd * (1 – Tc)
2.1.2 Projected Cash Flow and Assumptions
The key assumptions in cash flow projection and terminal value are as
follows:
Table 2.1 Key assumption for WACC calculation
Key Assumption Amount
Cost of Debt (Rd) 0
Risk Free Rate (Rf)* 2.79%
Beta** 1.054
Risk Premium
(Rm-Rf)*** 8.15%
Ke 11.38%
WACC 11.38%
*Thai BMA Zero coupon bond 10 years
** Current Beta from bloomberg (5 Years)
*** Moody's rating Source : Damodaran
Table 2.2 The key assumptions in cash flow projection and terminal value
Key Assumption Year 2015 -1019and
going forward.
Sale growth in Y1-Y5(%) 5.00%
Terminal growth (%) 3.50%
Cost of goods sold (%) 94.90% of sale in each year
Selling and Administrative expenses (%) 2.90% of sale in each year
Depreciation in Y1 (Baht) 41,865.26
Depreciation in Y2-Y5 (Baht) DP in Prior Year+(20%*change in PPE)
Tax rate (%) 20.00%

18
Table 2.3 Percentage of revenue
2.1.3 Summary growth rate
Table 2.4 Summary growth rate
Source: Router
2.1.4 Revenue growth rate
Table 2.5 Growth rate of Synnex, indstry and sector
Source: http://www.reuters.com
Source: Annual Report Synnex 2014 Baht Million
2010 2011 2012 2013 2014 %
Income Income Income Income Income 2014
1. Component Product Group (CPG) 3228 3176 4,039 3,065 3,030 15.87%
2. Consumables & Supply Group (CSG) 2597 2674 2,609 2,236 2,212 11.61%
3. Image & Printing Product Group (IPG) 1698 1802 1,819 1,369 1,513 7.97%
4. Network Product Group (NPG) 1220 1447 2,018 1,635 1,338 7.01%
5. Display Product Group (DPG) 1217 1377 1,054 973 893 4.68%
6. System Product Group (SPG) 3741 4759 3,601 2,525 2,179 11.41%
7. Multimedia Product Group (MPG) 1369 1416 1,789 2,041 2,327 12.19%
8. Software Product Group (SWG) 490 813 959 2,186 2,168 11.35%
9. Communication Devices Group (CDG) 32 2762 2,663 2,678 3,359 17.59%
10. Others 0 2 4 11 37 0.19%
Total income from Sale 15,592 20,228 20,555 18,719 19,056 99.88%
Income from rendering of services 15 16 18 16 23 0.12%
Total income 15,607 20,244 20,573 18,735 19,079 100.00%
ProductTrade-
Sparkinglines
GROWTH FOR SYNNEX THAILAND PCL
3 Year 5 Year
Sales % -1.92 7.29
EPS (TTM) % -22.22 -3.1
Dividend % -19.1 -8.25
Note: Units in Millions of US Dollars
GROWTH
RATES SYNEX
IT ICT
industry sector
Sales (MRQ) vs Qtr. 1 Yr. Ago 15.98 12.27 0.01
Sales (TTM) vs TTM 1 Yr. Ago 14.76 10.36 1.14
Sales - 5 Yr. Growth Rate 7.29 1.14 13.2
EPS (MRQ) vs Qtr. 1 Yr. Ago 52.05 123.64 -22.76
EPS (TTM) vs TTM 1 Yr. Ago 208.7 - -
EPS - 5 Yr. Growth Rate -3.1 -0.35 19.42
Capital Spending - 5 Yr. Growth Rate -2.92 -4.35 15.11

19
Revenue growth rate: As income structure and growth rates above, 59%
of total product was declined in last 5 years (2010 to 2014), while trade of total product
by 41% was raised based on market's demand. The growth rate of IT market is not as
high; average sales 5 yeas growth rare in the global industry as 1.14%. However, we
based the next 5 years sale growth rate on CAGR over the past 5 years, driving the
Company to plan to expand the business overseas (AEC country) and to increase product
variety, and to promote higher product recognition among customers via e-commerce.
Thus, we assume that growth rate of SYNNEX in next 5 years during 2015-2019 as
5% (stable rate) per year. Besides, the terminal growth rate since 2020 onwards as
3.5% effect from average in forecast Thailand GDP growth in 2016 at 3%-4% and
ICT market industry at 4.5% in 2016 (See “Macro-Economic Analysis”).
Proportionated cost of sales and selling and administrative expense to
sales: The forecast figures of cost of sales and selling & administrative expense were
calculated by averaging the percentage of these items to sales over the past 5 years at
the rate around 94.90% and 2.90%, respectively.
Change in net working capital and investment in net fixed assets: Definitely,
inventories, account receivables, bank overdraft and short term borrowing from financial
institutions, and account payable are four main factors defining net working capital.
The Company’s working capital has been funded by the use of short-term loans from
financial institutions for liquidity. Days in inventory are approximately controlled at
33 days while the average collection period takes 50 days as the Company supports
well-rated customers by extending the payment period of their ARs under the circumstance
that the IT industry has faced a smaller growth when compared to the previous year.
As in the historical information, the company has lower in PPE in every year so we
implied there is additional invest in lone term asset like fixed asset within the next 5
years at 2% of net revenue in each year based on 5 years average growth in historical
data.
Weighted average cost of capital: We use the weighted average of the
market value of equity to calculate WACC for Synnex. There is no cost of debt to
determine in cost of capital structure since its long term debt was performed only 1%
of total interest-bearing. In part of the cost of equity, we obtained the risk-free rate at
2.79% from 10 year government bond of Thai BMA as at 31 December 2014, the risk
20
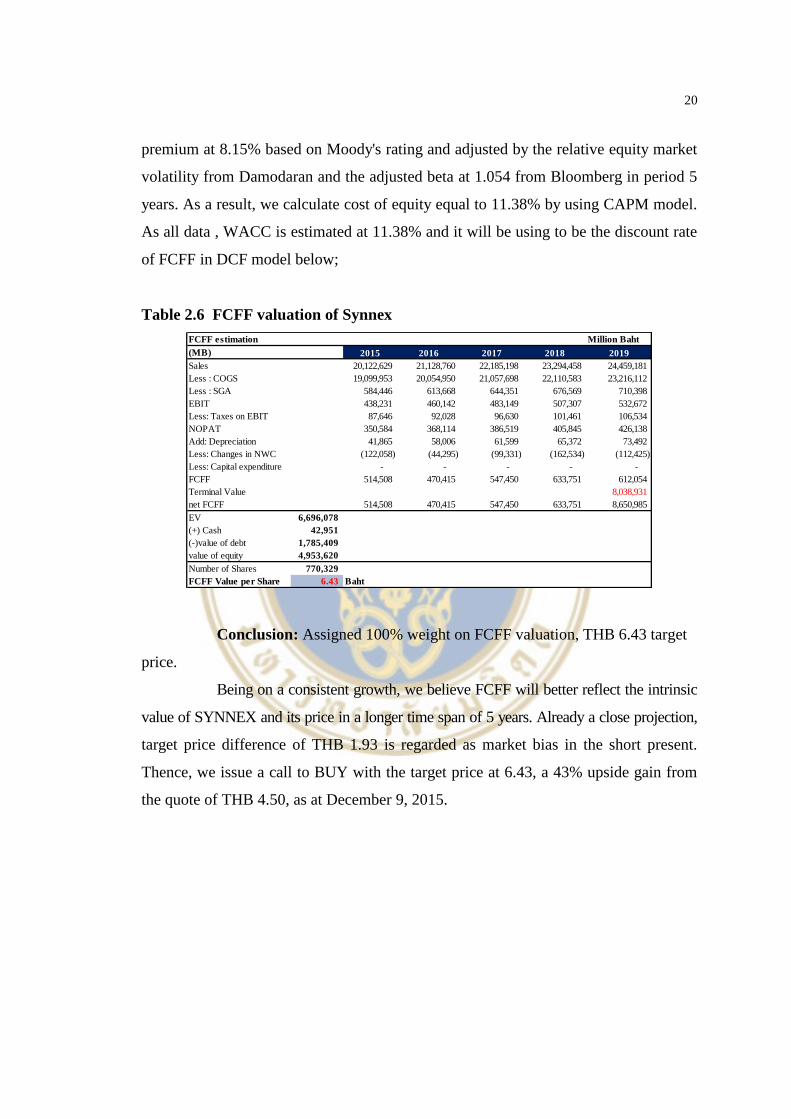
premium at 8.15% based on Moody's rating and adjusted by the relative equity market
volatility from Damodaran and the adjusted beta at 1.054 from Bloomberg in period 5
years. As a result, we calculate cost of equity equal to 11.38% by using CAPM model.
As all data , WACC is estimated at 11.38% and it will be using to be the discount rate
of FCFF in DCF model below;
Table 2.6 FCFF valuation of Synnex
Conclusion: Assigned 100% weight on FCFF valuation, THB 6.43 target
price.
Being on a consistent growth, we believe FCFF will better reflect the intrinsic
value of SYNNEX and its price in a longer time span of 5 years. Already a close projection,
target price difference of THB 1.93 is regarded as market bias in the short present.
Thence, we issue a call to BUY with the target price at 6.43, a 43% upside gain from
the quote of THB 4.50, as at December 9, 2015.
FCFF estimation Million Baht
(MB) 2015 2016 2017 2018 2019
Sales 20,122,629 21,128,760 22,185,198 23,294,458 24,459,181
Less : COGS 19,099,953 20,054,950 21,057,698 22,110,583 23,216,112
Less : SGA 584,446 613,668 644,351 676,569 710,398
EBIT 438,231 460,142 483,149 507,307 532,672
Less: Taxes on EBIT 87,646 92,028 96,630 101,461 106,534
NOPAT 350,584 368,114 386,519 405,845 426,138
Add: Depreciation 41,865 58,006 61,599 65,372 73,492
Less: Changes in NWC (122,058) (44,295) (99,331) (162,534) (112,425)
Less: Capital expenditure - - - - -
FCFF 514,508 470,415 547,450 633,751 612,054
Terminal Value 8,038,931
net FCFF 514,508 470,415 547,450 633,751 8,650,985
EV 6,696,078
(+) Cash 42,951
(-)value of debt 1,785,409
value of equity 4,953,620
Number of Shares 770,329
FCFF Value per Share 6.43 Baht

21
CHAPTER III
DISCUSSION
3.1 Financial Statement Analysis
3.1.1 Summary figures from financial statements (Size analysis)
Income statement: In 2014 and 2013, Synnex’s revenue were 19,056 MB
and 18,720 MB which is about 1.8% growth rate. Synnex had 95.9% proportion of
COGs compared to total sales revenues, which was higher than SIS. Lower proportion
of SG&A than SIS reflected to better in human resource utilization because the company
invested in warehouse management system, Synnex used SG&A cost with only 2.5%
of sales but SIS had to pay 3.7% of sales. Company paid 22 MB (0.1%) for finance
cost while SIS paid 81 MB (0.5%) for business operation. By the end of 2014, Synnex
earned 210 MB with 1.1% by revenue while SIS earned 135 MB with 0.9% by revenue.
Figure 3.1 Income statement's size analysis
Total assets of the company are around 5,633 MB. Main assets is in
current assets portion for about 90% of the total assets. Total assets increased 21.6%
from 2013 because increasing in trade account receivables and inventories. For total
liabilities and equity side, Synnex increased the debt ratio with short-term liability to
support cash flow for operation. Total liabilities composed of current liabilities 3,439
MB and non-current liabilities only 72 MB. The majority of liabilities are bank overdraft

22
and short-term borrowing from financial institution for about 47% of total liabilities.
The company increased 5% in equity by additional retain earning.
Shareholding and dividend: Synnex is 38.5% owned by TKS. Technologies
Plc., and 35.0% owned by King's Eye Investments Ltd. In 2014, the company paid a
dividend of THB 0.13 per share, representing a 48% payout. The company has a policy to
pay dividends at least 40% payout ratio.
Figure 3.2 Balance sheet's size analysis
3.1.2 Common Size analysis
1. Income statement
Overall, Synnex and SIS have managed equally portion in each item of
income statement such as sales, COGS and SG&A. Total revenues compose of sales
income 99%. The remaining revenues from other income, accounted for 1% of total
revenues. Cost of sales and selling and administrative expense represents around
95.9% and 3.1% of sales, respectively. The gross profit and net profit is about 4.1%
and 1.1% of sales.

23
Table 3.1 Income Statement
2. Balance sheet
Total assets compose of current assets 92% and non-current assets 8%.
The major items in assets are inventory and trade accounts and other receivable,
representing 34.4% and 50.2% respectively followed by property, plant and equipment
at 5.7%.
Total liabilities and equities compose of total liabilities 62.3%, of which
61.0% is current liabilities and 1.3% is non-current liabilities, and total equities 37.7%,
of which unappropriated retained earnings are 16.7% followed by issued and paid-up
capital at 13.7% and share premium at 6.2%. The major items in current liabilities are
short-term borrowing and account payable which represents 29.2% and 26.0%,
respectively.

24
Table 3.2 Balance Sheet
Comparing with competitors: For income statement, Synnex has higher
percentage of cost of sales than SIS, it show that SIS might be more efficient than
Synnex in terms of cost management or pricing strategy. On the other hand, SIS has
more proportion of selling expense than Synnex which indicates that SIS spent more
in selling expenses to generate the sales or Synnex can manage better human resource
utilization.
On assets side, Synnex has more proportion of trade accounts and other
receivable inventory, property plant and equipment while less proportion of Long-term
investment than SIS. On liabilities and equities side, Synnex financed its assets with
less proportion of debt than SIS, so it is less risky in terms of financial leverage.
Synnex Synnex Sis Sis
2014 2014 2014 2014
Thousand
Baht%
Thousand
Baht%
CASH AND CASH EQUIVALENTS 42,951 0.8% 89,275 1.8%
TRADE ACCOUNTS AND OTHER
RECEIVABLE 2,829,513 50.2% 1,729,693 35.5%
ADVANCES AND SHORT TERM LOAN 30,000 0.5% 478,137 9.8%
INVENORIES 1,940,389 34.4% 1,579,484 32.4%
OTHER CURRENT ASSETS 338,938 6.0% 433,632 8.9%
TOTAL CURRENT ASSETS 5,181,792 92.0% 4,310,221 88.4%
LT investment 28,619 0.5% 190,329 3.9%
PPE-net 320,434 5.7% 115,925 2.4%
OTHER NON-CURRENTASSETS 101,814 1.8% 257,046 5.3%
TOTAL NON-CURRENT ASSETS 450,867 8.0% 563,300 11.6%
TOTAL ASSETS 5,632,659 100.0% 4,873,521 100.0%
LIABILITIES AND SHAREHOLDERS'
EQUITY
SHORT TERM LOANS 1,646,909 29.2% 2,220,594 45.6%
ACCOUNT PAYABLES 1,466,587 26.0% 1,000,182 20.5%
OTHER CURRENT LIABILITIES 325,069 5.8% 20,976 0.4%
TOTAL CURRENT LIABILITIES 3,438,565 61.0% 3,241,752 66.5%
LONG TERM LOANS 18,500 0.3% - 0.0%
NET OF CURRENT PORTION OF POST
EMPLOYEE BENEFIT OBLIGATIONS 31,685 0.6% 33,076 0.7%
OTHER NON-CURRENT LIABILITIES 21,380 0.4% 3,960 0.1%
TOTAL NON-CURRENT LIABILITIES 71,565 1.3% 37,036 0.8%
TOTAL LIABILITIES 3,510,130 62.3% 3,278,788 67.3%
ISSUED AND PAID-UP 770,329 13.7% 350,199 7.2%
SHARE PREMIUM 350,873 6.2% 435,415 8.9%
RETAINED EARNING 941,772 16.7% 809,119 16.6%
OTHER 59,555 1.1% - 0.0%
TOTAL EQUITY 2,122,529 37.7% 1,594,733 32.7%
TOTAL LIABILITIES AND TOTAL EQUITY 5,632,659 100.0% 4,873,521 100.0%

25
3.1.3 Trend analysis
1. Revenue, COGS and SG&A
Synnex’s revenue was increase from 2010 while SIS’s revenue decreased
significantly. In 2013-2014, Synnex had efficiency to control cost of finance debt and
human resource utilization to reduced SG&A cost. But Synnex used low price strategy
for volume of sales, it impacted to COGS. The gross profit margin trend result showed
decreasing because COGS percentage was increased. The CAGR of sales was
approximately at the rate of 5.18%. While SIS showed negative trend of revenue and
percentage of SG&A even thought they had better in COGS cost than Synnex.
2. Earning
From 2010 to 2014, the trend of Synnex’s profit margin was higher than
SIS. In 2011 Synnex survived in big floods in Thailand with good performance. The
Synnex’s trend is expected to be higher in the future due to better cost control, human
resource utilization and capability of management team to solve the problems in any
situation.
Figure 3.3 5 years trend of revenue
26
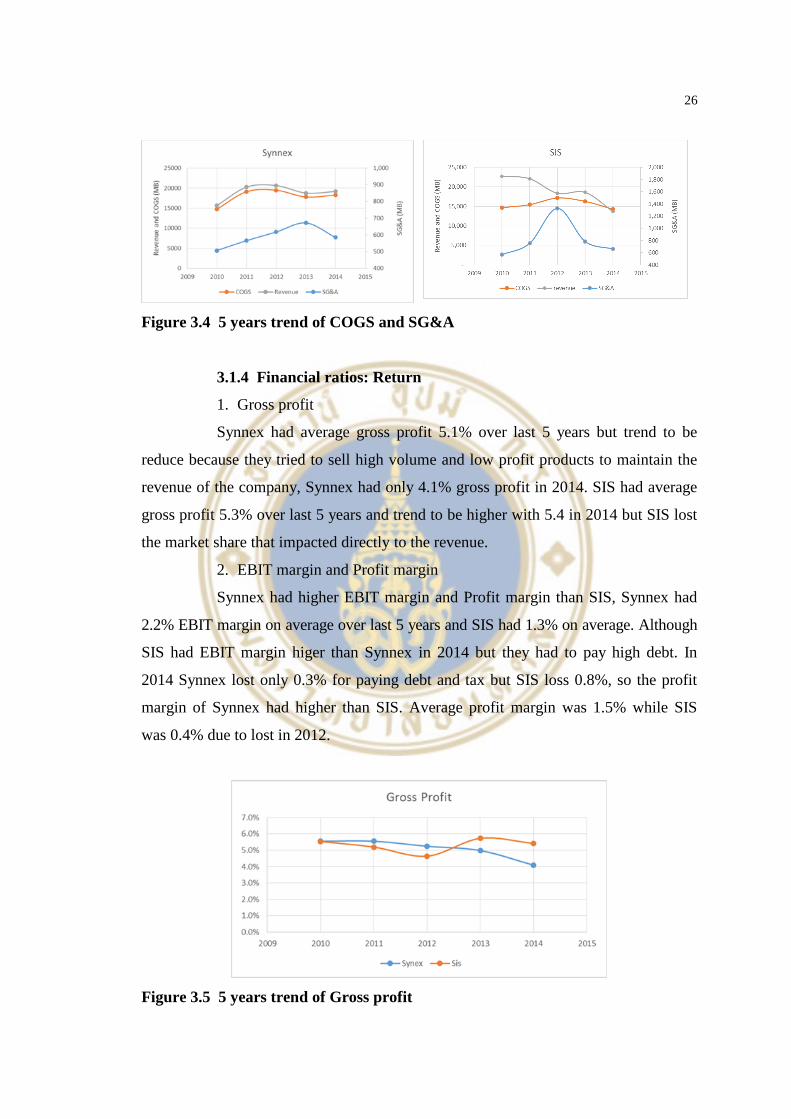
Figure 3.4 5 years trend of COGS and SG&A
3.1.4 Financial ratios: Return
1. Gross profit
Synnex had average gross profit 5.1% over last 5 years but trend to be
reduce because they tried to sell high volume and low profit products to maintain the
revenue of the company, Synnex had only 4.1% gross profit in 2014. SIS had average
gross profit 5.3% over last 5 years and trend to be higher with 5.4 in 2014 but SIS lost
the market share that impacted directly to the revenue.
2. EBIT margin and Profit margin
Synnex had higher EBIT margin and Profit margin than SIS, Synnex had
2.2% EBIT margin on average over last 5 years and SIS had 1.3% on average. Although
SIS had EBIT margin higer than Synnex in 2014 but they had to pay high debt. In
2014 Synnex lost only 0.3% for paying debt and tax but SIS loss 0.8%, so the profit
margin of Synnex had higher than SIS. Average profit margin was 1.5% while SIS
was 0.4% due to lost in 2012.
Figure 3.5 5 years trend of Gross profit

27
Figure 3.6 5 years trend of Profit margin and EBIT margin
3. ROA, ROE and Total Assets Turnover
Average ROA and ROE of Synnex was higher than SIS because over last
5 years Synnex’s return was higher than SIS. Average ROA of Synnex was 9.4% but
in 2014 the company had only 5.4% because increasing on assets with stable on return
while SIS had average ROA only 5.2%. Trend of ROE was similar with ROA,
Synnex had 24.6% on average while SIS’s ROE was only 14.6% on average. Total
assets turnover of Synnex was higher than SIS, it showed Synnex used total assets to
generated revenue better than SIS. The average total assets of Synnex was 4.1 times
while SIS was only 3.7 times.
Figure 3.7 5 years trend of ROA and ROE
3.1.5 Financial ratios: Risk
1. Short-term liquidity risk
Current ratio and quick ratio of Synnex showed that the company does not
have a liquidity problem. Average current ratio of synnex was 1.55 times while SIS
was 1.33 times. Quick ratio of Synnex was higher than SIS, average quick ratio of
Synnex was 1.01 times and SIS’s average quick ratio was 0.90. The results show

28
Synnex was lower risk in liquidity than SIS. In 2014 Synnex’s current ratio was dropped
in liquidity ratio because increasing in inventory and receivable.
Figure 3.8 5 years trend of Current ratio and Quick ratio
Figure 3.9 5 years trend of Cash Conversion Cycle
2. Long-term solvency risk
Average D/E ratio of Synnex was 1.57 times while SIS was 2.66 times, it
showed SIS had higher risk than Synnex. Average interest coverage ratio of Synnex
(11.8 times) showed higher than SIS (4.1times), it showed capability to pay debt of
Synnex was better than SIS.
Figure 3.10 5 years trend of D/E ratio and Interest coverage ratio

29
Summary of Key Financial Ratio (SYNNEX&SIS)
Table 3.3 Key Financial Ratio in 2014
Key Financial Ratio Synnex Sis
2014 2014
Growth (%)
sales 1.8% -12.6%
EBIT -4.9% -16.3%
Net profit -1.7% -19.0%
Profitability ratio (%)
gross profit margin 4.1% 5.4%
EBIT margin 1.4% 1.7%
Net Profit margin 1.1% 0.9%
Efficiency ratios (%)
current ratio 1.51 1.33
quick ratio 0.94 0.84
ROA 5.4% 5.0%
ROE 10.1% 8.6%
Solvency ratios (x)
D/E 1.65 2.06
Interest Coverage Ratio 12.37 3.09
Net debt/EBITDA 11.11 13.14
Ratio
Inventory turnover 32.85 40.46
A/R turnover 49.96 47.45
A/P turnover 31.47 25.79
CCC 51.34 62.12
3.2 Investment Risks and Downside Possibilities
The Company focuses on the management of Company’s risks from industrial
conditions and competitions by systematically monitoring, planning, and managing
risks in different aspects, which may affect the Company’s operations in the future, to
be at an acceptable level. The major risks that might affect the performance of the
Company as well as the decision of investors are as followings:
1. Risk from Reliance on Majority Vendors
The Company’s comprehensive range of products distributed are manufactured
by vendors of world-class standards which have trusted and appointed the Company as
their authorized product distributor over 50 product brands namely Intel, APC, ASUS,
Bitdefender, Canon, EPSON, FujiXerox, Gigabyte, WD, Lemel, Rapoo, and Seagate
which was the high risk of relying on majority vendors. However, SYNNEX is well-
regarded as a major global distributor, particularly in the Asia Pacific region. The

30
“Trusted By SYNNEX” trademark labeled on IT products for the Company’s marketing
of after-sale service and product warranty is widely recognized by consumers in the
market of border trades with neighboring countries.
2. Risk of Changes in Technology and Product Development
As the core business of the Company are distributor computers, computer
peripherals, and IT products of which related technologies and innovations are quickly
developed and their technologies are changed very fast. Inventory can be easily obsolete
and cause business damaged. These reasons were required that the Company keeps a
close watch on those changes and continuously studies trends of products desired in
the market as well as appropriately monitors inventory control and purchasing, as
inventory items become outdated easily as technologies evolve. However, the Company
has been transferred the information and technology from the major stockholder, or
Synnex Group from Taiwan, which runs a highly successful business of distributing
computers, computer peripherals, and IT products and has the expertise in assessing
the needs and trends of the market and owns an advanced, computerized inventory
management system. Moreover, the Company’s Management’s members have
accumulated long working experiences in fields related to the Company’s business.
Owing to such reasons, the Company is able to handle technology changes efficiently.
In addition, as being a giant distributor of computers and IT products in Thailand, the
Company is offered favorable conditions such as special discounts when placing orders in
great quantities, product rotation for obsolete models, and price protection on discounted
models from a variety of giant vendors and manufacturers, relieving the Company off
the inventory’s aging problem. Meanwhile, the Company sets the allowance of diminution
in quality-deteriorating, obsolete, and slow-moving inventories too.
3. Risk from the Advent of AEC
The common goal for the ASEAN Economic Community (AEC) is to
achieve the single market and production bases for the ASEAN community, thus
allowing free movement in 5 areas including product, service, investment, skilled
labor and capital. Such free trade will create both winners and losers, depending upon
their business and competitive potentials relative to that of their competitors. With no
tariffs and tax barriers, tax-free products and services from other countries could come
into Thailand, thus putting Thai entrepreneurs in a more downward pressure, and vice

31
versa. The Company has planned and researched on the expansion of distribution
channels to foreign countries in Indochina since the year 2013, targeting to acquire the
market share in three countries namely the Republic of the Union of Myanmar (Myanmar),
the Kingdom of Cambodia. (Cambodia), and the Lao’s People’s Democratic Republic
(Lao PDR), as these three countries have been maintaining diplomatic relations with
Thailand for a long time. Currently, the Company’s revenue from export sales to the
three neighboring countries is successfully achieved, as SYNNEX is well-regarded as
a major global distributor, particularly in the Asia Pacific region
4. Risk from the Foreign Exchange Rates
The Company imports products from foreign countries with bids and
payments principally calculated in the U.S. dollar currency. Oversea products represent
40% of the total product purchasing orders of the Company. However, the Company
has a policy to prevent the risk from fluctuating foreign exchange rates by entering
forward contracts of the foreign exchange market. Overall, the extent to which the
Company’s measures of controlling the exchange rates’ risk vary based on situations.
Yet, the Company does not have a policy over speculation in the foreign exchange
market.
5. Risk from the Working Capital
The Company has requiring the steadily increasing working capital to
manage the accounts receivable and inventory as sales increase. The Company’s working
capital has been funded by the use of short-term loans from financial institutions for
liquidity. Days in inventory are approximately controlled at 33 days while the average
collection period takes 50 days as the Company supports well-rated customers by
extending the payment period of their ARs under the circumstance that the IT industry
has faced a smaller growth when compared to the previous year. Meanwhile, the
Company’s average payment period is at 30 days as the Company, in turn, has been
offered the payment period’s extension on accounts payable while the Company also
makes payments in cash or early payments to get trade discounts. Currently, the
Company has been approved loans from several commercial banks which are adequate
to facilitate the business operations. Besides, owing to the good rapports between the
Company and these commercial banks, there are constant chances for the Company to

32
negotiate and review the loan balance, interest rates, and banks’ fees to achieve the
appropriate level of the financial costs for the Company.
6. Risk from Competition and Low Gross Margin
It Distribution is considered as competitive and its margin is low, in this
industry, price may be used as a primary strategy in the competition. Consequently,
such factors as the foreign currency exchange rates, quality of accounts receivable,
depreciation cost from new investment, and inventory management may affect the
Company’s net profit and operating result. However, the Company pays attention to
the risk on profit and prepares such measures as the management of risk from foreign
exchange rates, strict inventory management, thoroughly planned budgeting, and cost
controlling. These measures reduce effects of the aforementioned factors on the net
gross profit. Moreover, the Company has been appointed as the exclusive distributor
of several product brands, enabling the Company to control product pricing in order to
achieve a higher level of the gross profit margin.
3.2.1 Risk Matrix
Table 3.4 Risk Matrix
LIKELIHOOD RISK RANKING MATRIX
HIGH
(68%-100%)
- Competition and
Low Gross Margin
- The Foreign
Exchange Rates
- Changes in Technology
and Product Development
MODERATE
(34%-67%)
- The Advent of AEC - The Working
Capital
- Reliance on Majority
Vendors
NEGLIGIBLE
(1%-33%)
CONSEQUENCE NEGLIGIBLE MODERATE Severe

33
Table 3.5 Sensitivity Analysis
Sensitivity Analysis
Price per stock Cost of Capital (WACC)
6.43 9.00% 10.00% 11.00% 11.38% 12.00% 13.00% 14.00% 15.00%
Term
ina
l G
row
th R
ate
1.00% 7.03 5.98 5.13 4.85 4.44 3.87 3.38 2.96
2.00% 8.04 6.73 5.71 5.38 4.90 4.23 3.68 3.21
2.50% 8.66 7.18 6.05 5.69 5.17 4.45 3.85 3.35
3.00% 9.38 7.70 6.44 6.04 5.46 4.68 4.04 3.50
3.50% 10.23 8.29 6.88 6.43 5.79 4.93 4.24 3.67
5.00% 14.07 10.80 8.62 7.97 7.06 5.90 4.99 4.26
6.00% 18.76 13.51 10.36 9.48 8.27 6.77 5.64 4.77
7.00% 28.14 18.04 12.98 11.67 9.95 7.93 6.48 5.40
8.00% 56.28 27.08 17.34 15.15 12.47 9.55 7.60 6.21
9.00% N/A 54.21 26.07 21.57 16.68 11.99 9.17 7.29
10.00% N/A N/A 52.24 37.29 25.10 16.05 11.52 8.80
\
As the DCF model method, terminal growth rate and cost of capital (WACC)
are major variable items which effect to price of stock, thus, we varied terminal growth
rate at 1%-10% and Cost of Capital at 9%-15%. It is possible that future price volatility
may be declined/raised based on changing in terminal growth rate and cost of capital
as table above.
3.2.2 Assumption for Investment Risks and Downside Possibilities
In case there are investment risks and downside possibilities which may
affect the Company’s operations, the finance performance of the firm will be changed
based on these impacts. We assume that the constant growth and terminal growth of
the firm as 3.0% from 5.0% and 3.5% in normal situation, respectively. Therefore, the
current appropriate price will be around 4.92 baht per share as sensitivity table below.

34
Table 3.6 Sensitivity Analysis of Downside Possibilities
Sensitivity Analysis
Price per stock Cost of Capital (WACC)
4.92 9.00% 10.00% 11.00% 11.38% 12.00% 13.00% 14.00% 15.00%
Term
ina
l G
row
th R
ate
1.00% 5.77 4.86 4.14 3.90 3.55 3.06 2.64 2.28
2.00% 6.63 5.51 4.64 4.36 3.94 3.37 2.90 2.50
2.50% 7.16 5.89 4.93 4.62 4.17 3.55 3.04 2.62
3.00% 7.77 6.34 5.26 4.92 4.42 3.75 3.20 2.75
3.50% 8.50 6.85 5.63 5.25 4.70 3.97 3.38 2.89
5.00% 11.78 8.99 7.12 6.57 5.79 4.79 4.02 3.39
6.00% 15.79 11.30 8.61 7.85 6.82 5.54 4.57 3.83
7.00% 23.81 15.17 10.85 9.73 8.26 6.53 5.29 4.36
8.00% 47.85 22.90 14.58 12.71 10.41 7.92 6.25 5.06
9.00% N/A 46.09 22.03 18.19 14.01 10.00 7.59 5.98
10.00% N/A N/A 44.39 31.62 21.20 13.47 9.60 7.28

35
REFERENCES
Bank of Thailand. (2015). Retrieved November 2, 2015, from https://www.bot.or.th/
English/Pages/default.aspx.
Moodys. (2015). Moody's- credit ratings, research, tools and analysis for the global
capital market. Retrieved November 2, 2015, from https://www.moodys.
com/
Reuters. (2015). Synnex Thailand PCL (SYNEX.BK) “Chart”. Retrieved November
2, 2015, from http://www.reuters.com/finance/stocks/chart?symbol=SYN
EX. BK
Reuters. (2015). Synnex Thailand PCL (SYNEX.BK) “Overview”. Retrieved November
2, 2015, from http://www.reuters.com/finance/stocks/overview?symbol=
SYNEX.BK#KzpcwAErAQApSEoO.99
SET. (2015). Companies/Securities in Focus “SYNEX : SYNNEX (THAILAND)
PUBLIC COMPANY LIMITED”. Retrieved November 2, 2015, from
http://www.set.or.th/set/companyprofile.do?symbol=SYNEX&ssoPageId=
4&language=th&country=TH
SETSMART -SET Market Analysis and Reporting Tool. (n.d.) Retrieved November
2, 2015, from http://www.setsmart.com/ism/login.synex
Settrade. (2015). Stock Information “Synex - Synnex (Thailand) Public Company
Limited”. Retrieved November 2, 2015, from http://www.settrade.com/
C04_01_stock_quote_p1.jsp?txtSymbol=SYNEX&ssoPageId=9&selectPa
ge=1
SYNNEX (THAILAND). (20015). PCL Retrieved November 2, 2015, from http://
www .synnex.co.th/Th/home.aspx
Thai Bond Market Association. (2015). Retrieved November 2, 2015, from http://
www.thaibma.or.th/

36
APPENDICES

37
Appendix A: The Business Structure of the Company Group
Structure of SYNNEX (Thailand) PCL (the Company) and its subsidiaries as
at 31 December 2014.
Prism Solutions Company Limited was founded on 9 February 1996 with
the initial registered capital of 2,000,000 Baht, with the Company’s stockholding ratio
of 99.99% of the registered and paid-up capital of Prism Solutions Company Limited,
to operate support services on training, installation, and maintenance of advanced
computer programs and IT system. On 22 June 1999, the Company increased the
registered and paid-up capital of Prism Solutions Company Limited to 8,000,000 Baht.

38
Shareholder Structure

39
Appendix B: Major Shareholders and Free-Float
Free Float 2/4/2015 2/4/2014
% / Shareholders 25.48% 2,012 25.43% 2,712
Foreign Shareholders 41.86% @ 16/11/2015 Foreign Limit 49.00%
Shareholders
As of 31 December 2014, Top 10 major shareholders are follows:
The Board of Directors
As of 31 December 2014, the Board of Directors comprised of the following
13 directors:

40
Appendix C: Corporate Governance (CG)
The Board of Directors followed the Code of Best Practices for the Company’s
directors, which is in line with the Code of Best Practices for Directors of Listed
Companies to comply with the procedure of the Stock Exchange of Thailand (SET)
regarding good corporate governance that concerns five principles namely The Rights
of Shareholder, Equitable Treatment of Shareholders, Roles of Stakeholders in Corporate
Governance, Disclosure and Transparency, and Accountabilities of Directors, as
presented below:
1. The Rights of Shareholders
The Company recognizes the importance of shareholders by treating
shareholders with methods and standards acceptable and dependable, encouraging
shareholders to exercise the fundamental shareholder rights of buying, selling, and
transferring securities held; allocating the share of Company’s profits; and inviting to
participate in the Annual General Meeting (AGM) of shareholders in which they can
vote on the directors’ election and appointment of Company’s Auditor and fixing of
their auditing remuneration; make inquiries or offer their opinions concerning matters
reported by the Board of Directors; and use their individual voting right from the
number of shares held.
2. The Equitable Treatment of Shareholders
It is part of the Company’s policies to treat shareholders of all groups,
being major, minor, institutional, or foreign, with equality by setting regulations on
preventing the abuse of data obtained as Company’s directors and Management for
personal gains and interests of other businesses as well as the misuse of internal data
for personal trading of Company’s shares. In this regard, Company’s directors and
Management members concerned are obliged to declare their initial obtaining of
Company’s shares and report any changes in number of shares held and to strictly
follow related regulations set forth by Securities Exchange Commission (SEC) and
Stock Exchange of Thailand. The Company discloses current information of the
Company via the investor relations (IR)’s website in order to ensure shareholders
receive news on significant changes of the Company. Company’s news in Thai and

41
English languages that have been uploaded for public information in the SET’s website
are also uploaded to the Company’s IR website.
3. The Role of Stakeholders in Corporate Governance
It is a commitment of the Company to operate the business with responsibility
towards all stakeholders for sustainable, mutual benefits. The Board of Directors
supervises the Company’s procedure of ensuring the realization of the stakeholders’
rights as specified in organization’s code of ethics of the Company.
4. Disclosure and Transparency
The Company recognizes the importance of information disclosure, which
is accurate, transparent, and completed in a timely manner to benefit investment decision
making. The Company strictly adheres to regulations defined by SEC and other relevant
governing agencies to ensure transparency, honesty, and accountability in information
disclosure which comprises of such topics as the Company’s shareholding structure,
operating results by quarter, corporate governance, audit and control procedure, and a
variety of channels on information disclosure for all shareholders to access the Company’s
information with equality.
5. Accountabilities of Directors
The Company recognizes the importance of duties and responsibilities of
the Company’s Board of Directors in protecting the interests of shareholders and
stakeholders by developing a comprehensive internal control system on finance and
business operations to be in compliance with laws and regulations stipulated by Stock
Exchange of Thailand as well as setting up an adequate risk management system with
internal audit mechanism to ensure transparency and good management in business
operations as well as adequate risk management system with effective risk management
monitoring that suits the business of the Company.
Policies against corruptions
Synnex (Thailand) PCL. acknowledges the importance of conducting the
business in compliance with the principles of good corporate governance, fair and
transparent competition, strict obedience with laws, and commitment with countering
corruptions. Therefore, the Company and its subsidiary including corporate personnel
and related persons to participate in the campaign against corruptions. Thus, the Company

42
has established policies, regulations, guidelines, and requirements to prevent corruptions
as the business ethics for everyone in the organization to follow under the same policies
and to understand the anti-corruption intent of the Company for a good corporate
image and sustainable development of the organization.

43
Appendix D: SWOT analysis
SYNNEX’s SWOT analysis
Strengths
Supply chain efficiency: The business model of Synnex (Thailand) PCL
is a supply chain and logistics management. In the modern era, business is not
determined successful just with an innovative idea and sales. It's measured through the
efficiency of cost in transporting and manufacturing products and the effectiveness of
reaching the customer as soon as possible. With that said, Synnex has come into a
distribution market that has allowed corporations increase margins while managing
higher demands without changing their business model. Synnex is supplemented as the
"middle man" in business transactions and that allows them to profit off of the margins
in reselling.
Reselling: Synnex does not have to develop products for selling purposes
as the business simply buys products and resells them for a higher value. The margins
are lower than a regular business but that is sheer profit through turning over products
rather than spending on raw materials, labor and finished goods. This allows the costs
to be solely focused on the supply chain business model and essentially cuts the costs
that come along with research and development.
Suppliers: Another strength that Synnex possesses is the products that are
manufactured by the suppliers. The dependence on other businesses can generally hurt

44
a corporation but when the suppliers are HP, Lenovo, Sumsung etc, then Synnex
knows that the products that it is receiving will be in great demand for a strong price.
The possibility of a "default" or no replenishment in Synnex's inventory is extremely
unlikely as these technological corporations are multi-billion dollar companies.
Weaknesses
Margins: Profit margins for Synnex (Thailand) PCL have been 0.95%,
1.18%, 1.77% and 1.86% over the past four years (31/12/2014-31/12/2011). The issue
with reselling electronic devices and IT systems is the difficulty in price discrimination.
The cost of research and development, manufacturing the product, and creating the
product all are higher than numerous industries. Thus, the reselling of such products
cannot come at too high of a premium, otherwise retailers and wholesalers will bypass
the intermediary and go directly to the source. The efficiency that Synnex provides for
suppliers and retailers cannot be undermined but pricing power cannot be overstated
either. Synnex's capabilities of pricing are extremely limited which hinders expansion
and growth.
Expansion: As previously stated, the pricing inflexibility causes constriction.
Since Synnex does not create its own products (although they are pushing for global
business services which do), they have no inner growth potential. Their dependence on
suppliers and manufacturers forces them to only grow when the number of orders
grow or when the demand for certain products increase. This hindrance really affects
the growth potential of Synnex and can only be fixed internally
Opportunities
Business Services: A segment that can be within Synnex is their business
services. These services encompass customer management, renewal management,
back office processing and information technology outsourcing. Synnex creates its
own services in order to produce some independent revenue. However, it only accounts
for about 1% of Synnex 's revenue. To grow on this segment of their business would
be critical for their expansion. An issue with this project would be their margins and
their incapability to fund development of business services. But with the growth in
cloud computing demand alongside the importance of technology, Synnex could see

45
this opportunity to push forward with their global business services to capture a bigger
portion of the market share. Ultimately, this allows Synnex to be more diversified and
less reliant on other suppliers to fund their revenue stream.
Threats
Dependence on suppliers: With Synnex 's supply chain business model,
the dependence on suppliers is evidently noticeable. This leverages a high supplier
power to dictate terms and measures for how products will be purchased. The restricted
positioning for Synnex Corporation can create a conflict for their revenue and then
lower its opportunity for growth.
Variance in demand: The method that Synnex sells their products and
services to resellers is through purchase orders. This can create some hedging against
higher order demand but it can also create a downside if demand diminishes. In addition,
there are no contracts or long term agreements to establish a long term relationship
with the client. If Synnex cannot anticipate proper demand, their business can be
extremely damaged through excess inventory or lack of inventory. Variance in market
demand and variance in supply can drastically affect operations and finances of Synnex.

46
Appendix E: Porter's Five Forces
Threat of New Entry
Low: Even though Synnex (Thailand) PCL only manages reselling and
primarily distribution services, the threat of new entry is extremely high. In the
distribution services sector, the contracts and negotiations of reselling products is
extremely challenging for new competitors to come into. Synnex and other competitors
have established themselves as corporations that can sufficiently buy products from
top technology firms (i.e. HP, SUMSUNG) and resell those products in order to maintain
solvency as a corporation. Coming into the market and proposing purchases of products
from big technology firms requires a lot of initial capital and a strong basis of proving
that the company can re-order from the technology corporations. In the global business
services sector, producing new software and technologies to implement into global
businesses requires a lot of capital for research and development. It also requires
networking an connections created from previous business with distribution suppliers.
These factors ultimately create too many barriers to entry for a new corporation in the
distribution and global business services.
Buyer Power
Low: Synnex (Thailand) PCL is an intermediary to the products that
consumers want (i.e. computer devices, IT systems). The computer and technology
market has drastically increased the past two years after the economic recession.
Consumer demand has exponentially increased as the technology market has advanced
so efficiently and effectively. Synnex is simply reselling the products received by
technology corporations and the demand of technological equipment has significantly
gone up. Therefore, until the suppliers demand decreases, Synnex will have a proper
price adjustment for the demand to maintain their margins.

47
Supplier Power
High: Synnex (Thailand) PCL relies on their suppliers to create their
profits. Without the suppliers, Synnex cannot sell any of the products they acquire.
Their distribution services are their predominate business as it accounts for most of the
revenue. Therefore, the business is vastly dependent on its suppliers to even sustain
itself. Furthermore, technology companies have the capabilities of finding competitors
to sell through if prices are not sufficient to their standards. Essentially, Synnex is at
the whim of the suppliers that provide them with the capability of reselling, which
allows them to maintain profits and grow as a business.
Threat of Substitution
Medium/Low: The possibility of a substitution of Synnex, a supply chain
based corporation, is simply to eliminate them as the intermediary to the retailers. The
big technology corporations can create deals with the wholesalers and retailers and
take Synnex out of the equation for the supply chain strategy. However, this seems to
be an unlikely solution for the tech companies as that would increase their transportation
costs and force them to shop around for stores that will offer a good price. It is easier
and more efficient for the tech corporations to hire an intermediary who will purchase
their products and sell them to the retailers without having issues of transporting goods
to the wholesalers and retailers.
Competitive Rivalry
Medium: Competition amongst technology supply chain distributors is
battling for position to suppliers. However, competitors have their own contracted
suppliers and gaining leverage is simply creating more efficient supply chain models.
There are a few strong suitors in this specific industry which creates an oligopoly for
the sector. Being able to bare with razor sharp margins and still find sufficient funding
is an issue to all competitors, which remains the issue amongst these corporations.
Thus, pricing schemes cannot fluctuate because of the low margins. However, if
companies that are suppliers to Synnex are not happy with their supply chain service,
substituting Synnex with a competitor is an easy change. Overall though, the rivalry
stays within its restricted boundaries due to the business model's inflexibility in pricing.

48
SYNNEX: Porter's Five Forces Model
SYNNEX: Porter's Five Forces Model
Porter's Five Forces Remark
Threat of New Entry Low
Buyer Power Low
Supplier Power High
Threat of Substitution Medium/Low
Competitive Rivalry Medium

49
Appendix F: Statement
Statement of Comprehensive Income
For the year ended 31 December 2010 to 2014 (Actual),
and 2015 to 2019 (Projection)
Unit: '000 Baht
SYNNEX (THAILAND) PUBLIC COMPANY LIMITED 2010 2011 2012 2013 2014REVENUES FROM SALE OF GOODS AND RENDERING OF
SERVICES 15,592,154 20,228,285 20,555,367 18,719,927 19,055,864
REVENUES FROM SALES 15,580,006 20,214,131 20,541,062 18,707,689 19,039,911
REVENUES FROM RENDERING OF SERVICES 12,148 14,153 14,305 12,238 15,953
OTHER INCOME 63,960 32,717 94,625 58,891 108,544
DIVIDEND INCOME - - - - 31,415
GAIN ON FOREIGN CURRENCY EXCHANGE 48,895 16,818 77,016 42,739 54,076
OTHER INCOMES - OTHERS 15,064 15,900 17,609 16,152 23,054
TOTAL REVENUES 15,656,113 20,261,002 20,649,992 18,778,818 19,164,409
COST OF SALE OF GOODS AND RENDERING OF
SERVICES 14,727,170 19,105,605 19,477,661 17,787,355 18,276,698
COST OF GOODS SOLD 14,725,236 19,101,996 19,474,480 17,781,870 18,271,741
COST OF RENDERING OF SERVICES 1,934 3,609 3,181 5,485 4,957
SELLING AND ADMINISTRATIVE EXPENSES 505,964 565,138 616,915 671,452 584,459
SELLING EXPENSES 285,943 317,563 326,168 290,366 297,290
ADMINISTRATIVE EXPENSES 220,021 247,574 290,748 381,086 287,170
MANAGEMENT AND DIRECTORS' REMUNERATION 24,811 27,187 28,404 30,863 28,216
TOTAL EXPENSES 15,257,946 19,697,930 20,122,980 18,489,670 18,889,374
PROFIT (LOSS) BEFORE FINANCE COSTS AND INCOME
TAX EXPENSES 398,168 563,072 527,011 289,148 275,035
FINANCE COSTS 31,698 51,888 47,508 23,625 22,225
INCOME TAX EXPENSES 98,487 136,765 117,896 52,272 43,154
NET PROFIT (LOSS) 267,982 374,418 361,606 213,251 209,656
PROFIT (LOSS) ATTRIBUTABLE TO EQUITY HOLDERS OF
THE PARENT 267,982 374,418 361,606 213,251 209,656
EARNINGS PER SHARE (UNIT : BAHT) 0.4 0.55 0.52 0.28 0.27
ordinaryshares (shares) 683,744.75 688,641.63 693,450.28 770,328.65 770,328.65
SYNNEX (THAILAND) PUBLIC COMPANY LIMITED 2015F 2016F 2017F 2018F 2019F
TOTAL REVENUES 20,122,628.99 21,128,760.44 22,185,198.46 23,294,458.38 24,459,181.30
COST OF SALE OF GOODS AND RENDERING OF SERVICES 19,099,952.69 20,054,950.32 21,057,697.84 22,110,582.73 23,216,111.87
SELLING AND ADMINISTRATIVE EXPENSES 584,445.79 613,668.08 644,351.48 676,569.06 710,397.51
TOTAL EXPENSES 19,684,398.48 20,668,618.40 21,702,049.32 22,787,151.79 23,926,509.38
PROFIT (LOSS) BEFORE FINANCE COSTS AND INCOME TAX
EXPENSES 438,230.51 460,142.03 483,149.14 507,306.59 532,671.92
FINANCE COSTS 35,389.06 35,389.06 35,389.06 35,389.06 35,389.06
INCOME TAX EXPENSES** 76,539.87 80,703.06 85,074.41 89,664.33 94,483.74
NET PROFIT (LOSS) 326,301.57 344,049.91 362,685.66 382,253.20 402,799.12
PROFIT (LOSS) ATTRIBUTABLE TO EQUITY HOLDERS OF
THE PARENT 326,301.57 344,049.91 362,685.66 382,253.20 402,799.12
EARNINGS PER SHARE (UNIT : BAHT) 0.4236 0.4466 0.4708 0.4962 0.5229
ordinaryshares (shares) 770,328.65 770,328.65 770,328.65 770,328.65 770,328.65
** Assume income tax expenses as 19% of net profit after finance costs due to affect of deferred tax and exempted tax in the year.

50
Statement of Financial Position
As at 31 December 2010 to 2014 (Actual)
Unit: '000 Baht
SYNNEX (THAILAND) PUBLIC COMPANY LIMITED 2010 2011 2012 2013 2014
CASH AND CASH EQUIVALENTS 108,220 86,647 23,483 85,263 42,951
TRADE ACCOUNTS AND OTHER RECEIVABLE 2,051,469 2,149,294 2,607,936 2,386,665 2,829,513
OTHER PARTIES - - 2,607,936 - -
ADVANCES AND SHORT-TERM LOANS - - - - 30,000
RELATED PARTIES - - - - 30,000
INVENTORIES 1,088,491 1,447,622 1,554,986 1,349,726 1,940,389
OTHER CURRENT ASSETS 109,247 305,601 320,461 339,951 338,938
TOTAL CURRENT ASSETS 3,357,427 3,989,164 4,506,867 4,161,605 5,181,792
INVESTMENT ACCOUNTED FOR USING COST
METHOD 49,400 42,748 26,401 25,474 28,619
SUBSIDIARIES 8,000 8,000 8,000 8,000 9,000
LONG-TERM INVESTMENTS 41,400 34,748 18,401 17,474 19,619
PROPERTY, PLANT AND EQUIPMENTS 368,469 332,122 309,143 350,841 320,434
DEFERRED TAX ASSETS - - - 76,062 82,792
OTHER NON-CURRENT ASSETS 4,533 13,608 15,177 19,423 19,023
TOTAL NON-CURRENT ASSETS 422,402 388,478 350,720 471,799 450,867
TOTAL ASSETS 3,779,829 4,377,641 4,857,587 4,633,404 5,632,659
BANK OVERDRAFTS AND SHORT-TERM
BORROWINGS FROM FINANCIAL
INSTITUTIONS 1,074,646 837,118 1,101,287 532,082 1,646,909
TRADE ACCOUNTS AND OTHER PAYABLE 912,176 1,453,418 1,346,446 1,630,584 1,397,971
OTHER SHORT-TERM ACCOUNT PAYABLES -
NET 26,558 38,257 26,064 54,226 68,616
ADVANCES AND SHORT-TERM LOANS 18,000 20,000 10,000 20,000 -
CURRENT PORTION OF LONG-TERM
LIABILITIES 36,421 170,000 120,000 120,000 120,000
OTHER CURRENT LIABILITIES 155,837 190,092 228,468 167,743 205,069
CORPORATE INCOME TAX PAYABLE 36,369 44,995 44,597 2,915 5,940
ACCRUED EXPENSE 105,671 129,839 161,270 138,840 188,160
OTHER CURRENT LIABILITIES - OTHERS 13,797 15,257 22,600 25,988 10,970
TOTAL CURRENT LIABILITIES 2,223,638 2,708,885 2,832,265 2,524,635 3,438,566
NET OF CURRENT PORTION OF LONG-TERM
LIABILITIES 132,880 - 78,500 38,500 18,500
NET OF CURRENT PORTION OF POST
EMPLOYEE BENEFIT OBLIGATIONS - 20,013 23,588 27,014 31,685
OTHER NON-CURRENT LIABILITIES 16,072 15,101 15,620 16,261 21,380
TOTAL NON-CURRENT LIABILITIES 148,952 35,114 117,708 81,775 71,565
TOTAL LIABILITIES 2,372,589 2,743,999 2,949,973 2,606,409 3,510,131
AUTHORIZED SHARE CAPITAL 705,000 705,000 705,000 800,000 800,000
ISSUED AND FULLY PAID-UP SHARE
CAPITAL 683,745 688,642 693,450 770,329 770,329
TOTAL EQUITY 1,407,240 1,633,643 1,907,615 2,026,995 2,122,529
TOTAL EQUITY AND LIABILITIES 3,779,829 4,377,641 4,857,587 4,633,404 5,632,659

51
Statement of Financial Position
As at 31 December 2015 to 2019 (Projection)
Unit: '000 Baht
2015F 2016F 2017F 2018F 2019F
CASH AND CASH EQUIVALENTS 65,682.63 65,053.51 87,846.99 54,117.31 56,715.29
TRADE ACCOUNTS AND OTHER RECEIVABLE 2,570,026.90 2,698,528.25 2,833,454.66 2,975,127.39 3,123,883.76
INVENTORIES 2,027,792.20 2,129,181.81 2,235,640.90 2,347,422.94 2,464,794.09
OTHER CURRENT ASSETS 302,250.66 317,363.19 333,231.35 349,892.92 367,387.56
TOTAL CURRENT ASSETS 4,965,752.39 5,210,126.75 5,490,173.90 5,726,560.56 6,012,780.70
INVESTMENT ACCOUNTED FOR USING COST
METHOD 36,897.96 38,742.86 40,680.00 42,714.00 44,849.70
PROPERTY, PLANT AND EQUIPMENTS 278,569.09 359,275.21 377,238.97 396,100.92 436,701.26
DEFERRED TAX ASSETS 84,877.57 89,121.45 93,577.52 98,256.39 103,169.21
OTHER NON-CURRENT ASSETS 15,337.52 16,104.40 16,909.62 17,755.10 18,642.85
TOTAL NON-CURRENT ASSETS 415,682.14 503,243.91 528,406.11 554,826.41 603,363.03
TOTAL ASSETS 5,381,434.53 5,713,370.66 6,018,580.00 6,281,386.97 6,616,143.73
BANK OVERDRAFTS AND SHORT-TERM
BORROWINGS FROM FINANCIAL INSTITUTIONS 1,210,286.77 1,323,623.01 1,389,804.17 1,401,058.23 1,471,111.14
TRADE ACCOUNTS AND OTHER PAYABLE 1,440,512.36 1,512,537.98 1,588,164.88 1,667,573.12 1,750,951.78
OTHER SHORT-TERM ACCOUNT PAYABLES - NET 45,677.47 47,961.34 50,359.41 52,877.38 55,521.25
CURRENT PORTION OF LONG-TERM LIABILITIES 120,000.00 120,000.00 120,000.00 120,000.00 120,000.00
OTHER CURRENT LIABILITIES
CORPORATE INCOME TAX PAYABLE 87,646.10 92,028.41 96,629.83 101,461.32 106,534.38
ACCRUED EXPENSE 154,676.80 162,410.64 170,531.17 179,057.73 188,010.61
OTHER CURRENT LIABILITIES - OTHERS 18,937.23 19,884.10 20,878.30 21,922.22 23,018.33
TOTAL CURRENT LIABILITIES 3,077,736.74 3,278,445.48 3,436,367.75 3,543,949.99 3,715,147.49
NET OF CURRENT PORTION OF LONG-TERM
LIABILITIES 8,500.00 - - - -
NET OF CURRENT PORTION OF POST EMPLOYEE
BENEFIT OBLIGATIONS 25,386.45 26,655.77 27,988.56 29,387.99 30,857.39
OTHER NON-CURRENT LIABILITIES 16,762.21 17,600.32 18,480.33 19,404.35 20,374.57
TOTAL NON-CURRENT LIABILITIES 50,648.66 44,256.09 46,468.90 48,792.34 51,231.96
TOTAL LIABILITIES 3,128,385.40 3,322,701.57 3,482,836.65 3,592,742.33 3,766,379.45
AUTHORIZED SHARE CAPITAL 800,000.00 800,000.00 800,000.00 800,000.00 800,000.00
ISSUED AND FULLY PAID-UP SHARE CAPITAL 770,328.65 770,328.65 770,328.65 770,328.65 770,328.65
TOTAL EQUITY 2,253,049.13 2,390,669.09 2,535,743.36 2,688,644.64 2,849,764.28
TOTAL EQUITY AND LIABILITIES 5,381,434.53 5,713,370.66 6,018,580.00 6,281,386.97 6,616,143.73

52
Statement of Cash Flow
As at 31 December 2010 to 2014 (Actual)
Unit: '000 Baht
SYNNEX (THAILAND) PUBLIC COMPANY LIMITED 2010 2011 2012 2013 2014
PROFIT (LOSS) BEFORE FINANCIAL COSTS AND
INCOME TAX EXPENSES 366,469 374,418 361,606 213,251 209,656
DEPRECIATION AND AMORTISATION 42,044 44,619 41,265 40,623 40,776 BAD DEBT AND DOUBTFUL ACCOUNTS
(REVERSAL) 30,562 1,075 8,860 140,900 45,577
LOSS ON OBSOLESCENCE (REVERSAL) 2,898 7,616 43,401 - -
LOSS ON DIMINUTION IN VALUE OF INVENTORIES
(REVERSAL) - - - (41,030) (12,347)
UNREALISED (GAIN) LOSS ON FOREIGN
CURRENCY EXCHANGE (607) 13,683 (7,296) 22,935 1,173 (GAIN) LOSS ON DISPOSAL OF OTHER
INVESTMENTS (4,457) (3,395) (1,999) - -
(GAIN) LOSS ON DISPOSAL OF FIXED ASSETS 109 (7) (348) 746 (864)
FINANCE COSTS 31,698 51,888 47,508 23,625 22,225
INCOME TAX EXPENSES - 136,765 117,896 52,272 43,154
OTHER RECONCILIATION ITEMS 13,478 18,517 15,503 3,687 (16,461)
CASH FLOWS FROM (USED IN) OPERATIONS
BEFORE CHANGES IN OPERATING ASSETS AND
LIABILITIES 482,193 645,179 626,398 457,009 332,887
(INCREASE) DECREASE IN OPERATING ASSETS (423,943) (687,518) (647,316) 295,382 (1,078,479)
(INCREASE) DECREASE IN TRADE ACCOUNT
AND OTHER RECEIVABLES - OTHER PARTIES (398,280) (98,900) (467,503) 80,371 (488,206)
(INCREASE) DECREASE IN INVENTORIES (24,111) (383,189) (163,383) 238,733 (589,367)
(INCREASE) DECREASE IN OTHER CURRENT
ASSETS
(1,705) (196,353) (14,860) (19,477) 1,000
(INCREASE) DECREASE IN OTHER NON-
CURRENT ASSETS 153 (9,075) (1,569) (4,246) (1,906)
INCREASE (DECREASE) IN OPERATING LIABILITIES 202,449 557,857 (75,475) 271,945 (181,787)
INCREASE (DECREASE) IN TRADE ACCOUNT
AND OTHER PAYABLES - OTHER PARTIES 173,675 527,508 (103,855) 261,203 (234,006)
INCREASE (DECREASE) IN OTHER PAYABLES -
OTHER PARTIES 2,258 11,699 (12,193) 28,162 14,390
INCREASE (DECREASE) IN OTHER PAYABLES -
RELATED PARTIES - - - - -
INCREASE (DECREASE) IN OTHER CURRENT
LIABILITIES 24,925 23,581 40,054 (18,061) 32,709
INCREASE (DECREASE) IN OTHER NON-
CURRENT LIABILITIES 1,591 (4,931) 519 641 5,119
CASH GENERATED FROM OPERATIONS 260,700 515,518 (96,393) 1,024,336 (927,379)
INTEREST PAID (32,046) - - - -
INCOME TAX PAID (91,744) (128,139) (118,294) (114,295) (47,216)
NET CASH PROVIDED BY (USED IN) OPERATING
ACTIVITIES 136,909 387,379 (214,687) 910,041 (974,595)
INCREASE (DECREASE) IN SHORT-TERM
BORROWINGS FROM FINANCIAL INSTITUTIONS 68,485 (237,477) 268,348 (569,205) 1,114,827
INCREASE (DECREASE) IN LONG-TERM
BORROWINGS FROM FINANCIAL INSTITUTIONS 81,260 - 28,500 - -
INCREASE (DECREASE) IN OTHER LOAN FROM
FINANCIAL INSTITUTIONS - 4,659 - (40,000) (20,000)
INCREASE (DECREASE) IN LONG-TERM
BORROWINGS FROM RELATED PARTIES - - (10,000) - -
INCREASE (DECREASE) IN OTHER LOANS FROM
RELATED PARTIES - 2,000 - 10,000 (20,000)
INCREASE (DECREASE) IN FINANCE LEASE
CONTRACT LIABILITIES (1,200) - - - -
PROCEEDS FROM ISSUANCE OF SHARE CAPITAL 8,164 10,675 10,483 15,738 -
PROCEEDS IN ADVANCE FROM SHARE
SUBSCRIPTION 5,798 (1,043) 2,095 (6,850) -
PURCHASE OF TREASURY SHARES - - - - -
PROCEEDS FROM DISPOSAL OF TREASURY
SHARES
- - 65,015 - -
DIVIDEND PAID (160,934) (135,193) (149,560) (153,250) (115,549)
INTEREST PAID - (49,841) (48,788) (24,607) (20,632)
OTHER ITEMS (36) - - - -
NET CASH PROVIDED BY (USED IN) FINANCING
ACTIVITIES 1,536 (406,219) 166,093 (768,175) 938,645
NET INCREASE (DECREASE) IN CASH AND CASH
EQUIVALENT 87,213 (21,573) (63,163) 61,780 (42,312)
CASH AND CASH EQUIVALENTS, BEGINNING
BALANCE 21,008 108,220 86,647 23,483 85,263
CASH AND CASH EQUIVALENTS, ENDING
BALANCE 108,220 86,647 23,483 85,263 42,951

53
Statement of Cash Flow
As at 31 December 2015 to 2019 (Projection)
Unit: '000 Baht
SYNNEX (THAILAND) PUBLIC COMPANY LIMITED 2015 2016 2017 2018 2019
PROFIT (LOSS) BEFORE FINANCIAL COSTS AND
INCOME TAX EXPENSES 438,230.51 460,142.03 483,149.14 507,306.59 532,671.92
DEPRECIATION AND AMORTISATION 41,865.26 58,006.48 61,599.24 65,371.63 73,491.69
BAD DEBT AND DOUBTFUL ACCOUNTS
(REVERSAL) 22,961.80 24,109.89 25,315.39 26,581.16 27,910.21
FINANCE COSTS 35,389.06 35,389.06 35,389.06 35,389.06 35,389.06
INCOME TAX EXPENSES 76,539.87 80,703.06 85,074.41 89,664.33 94,483.74
OTHER RECONCILIATION ITEMS 317,292.40- 292,327.56- 19,764.79 312,057.74- 18,493.78
CASH FLOWS FROM (USED IN) OPERATIONS
BEFORE CHANGES IN OPERATING ASSETS AND
LIABILITIES 297,694.10 366,022.97 710,292.03 412,255.02 782,440.42
(INCREASE) DECREASE IN OPERATING ASSETS 243,956.10 332,565.26- 599,779.03- 296,536.65- 682,051.70-
(INCREASE) DECREASE IN TRADE ACCOUNT
AND OTHER RECEIVABLES - OTHER PARTIES 259,486.51 128,501.35- 134,926.41- 141,672.73- 148,756.37-
(INCREASE) DECREASE IN INVENTORIES 87,402.76- 101,389.61- 106,459.09- 111,782.04- 117,371.15-
(INCREASE) DECREASE IN OTHER CURRENT
ASSETS 36,687.09 15,112.53- 333,231.33- 16,661.57- 367,387.56-
(INCREASE) DECREASE IN OTHER NON-
CURRENT ASSETS 35,185.26 87,561.77- 25,162.20- 26,420.31- 48,536.62-
INCREASE (DECREASE) IN OPERATING
LIABILITIES 75,793.23 87,372.50 91,741.12 96,328.18 101,144.59
INCREASE (DECREASE) IN TRADE ACCOUNT
AND OTHER PAYABLES - OTHER PARTIES 19,602.39 74,309.49 78,024.97 81,926.21 86,022.53
INCREASE (DECREASE) IN OTHER CURRENT
LIABILITIES 48,223.81 12,116.14 12,721.95 13,358.05 14,025.95
INCREASE (DECREASE) IN OTHER NON-
CURRENT LIABILITIES 7,967.03 946.86 994.20 1,043.92 1,096.11
CASH GENERATED FROM OPERATIONS 617,443.44 120,830.22 202,254.12 212,046.55 201,533.31
INTEREST PAID 35,389.06- 35,389.06- 35,389.06- 35,389.06- 35,389.06-
INCOME TAX PAID 38,838.45- 68,885.89- 72,632.76- 76,566.97- 80,697.90-
NET CASH PROVIDED BY (USED IN) OPERATING
ACTIVITIES 543,215.93 16,555.27 94,232.30 100,090.52 85,446.35
INCREASE (DECREASE) IN SHORT-TERM
BORROWINGS FROM FINANCIAL INSTITUTIONS 436,622.13- 113,336.24 66,181.15 11,254.06 70,052.91
DIVIDEND PAID 83,862.34- 130,520.63- 137,619.96- 145,074.26- 152,901.28-
NET CASH PROVIDED BY (USED IN) FINANCING
ACTIVITIES 520,484.46- 17,184.39- 71,438.81- 133,820.20- 82,848.37-
NET INCREASE (DECREASE) IN CASH AND CASH
EQUIVALENT 22,731.47 629.12- 22,793.48 33,729.68- 2,597.98
CASH AND CASH EQUIVALENTS, BEGINNING
BALANCE 42,951.16 65,682.63 65,053.51 87,846.99 54,117.31
CASH AND CASH EQUIVALENTS, ENDING
BALANCE 65,682.63 65,053.51 87,846.99 54,117.31 56,715.29

54
Appendix G: Stock and Price
Performance: SYNNEX
OVERALL IN CURRENT MARKET FINANCIALS
Beta: 1.21 SYNEX.BK Industry Sector
Market Cap(Mil.): ฿3,466.48 P/E (TTM): 10.84 0.5 18.67
Shares Outstanding(Mil.): 770.33 EPS (TTM): 0.41 -- --
Dividend: 0.08 ROI: 14.03 6.29 11.45
Yield (%): 2.96 ROE: 14.92 8.56 14.79
Source: http://www.reuters.com/finance/stocks/overview?symbol=SYNEX.BK#KzpcwAErAQApSEoO.99

55

56
BIOGRAPHY
NAME Miss Kansasin Wongsriudomphorn
DATE OF BIRTH 04 August 1984
PLACE OF BIRTH Bangkok, Thailand
INSTITUTE ATTENDED Bachelor of Accounting,
Kasetsart University, 2007
Master of Management,
Mahidol University, 2015
RESEARCH GRANT -
HOME ADDRESS 493/18 Ratchawithi Rd., Ratchathevi,
Bangkok 10400 Thailand
Tel. 096-336-6448
Email: [email protected]
EMPLOYMENT ADDRESS Global Adjusting Technical Services
(Thailand) Co., Ltd.
3 Rajanakarn Building, 10th Floor,
South Sathorn Road
Yannawa, Sathorn, Bangkok 10120
E-mail: [email protected]
PUBLICATION/ PRESENTATION -