synnex (thailand) public company limited - dcs-digital.com · prism solutions co.,ltd. • about 70...
TRANSCRIPT

SYNNEX (Thailand) Public Company Limited
Q3/14 Opportunity Day
12 November 2014

5 Pillars
5 Pillars
Overseas
Investment
M&A
Portfolio
RestructureCost Efficiency
People and
Culture

5 Pillars
Overseas
Investment

5 Pillars
M&A

Prism Solutions Co.,Ltd.• About 70 Staffs and more than 40 Engineers
• Financial support by SYNNEX Thailand PCL.
• Distributor more than 10 Products
• Own training center www.ITFastLearning.com
• Call Center 7X24 ,7 Agents
• More than 40 branches cover nationwide
New Opportunity – September 2014

PRISM Solutions Co., Ltd.

5 Pillars
Portfolio
Restructure

5 Pillars
Cost
Efficiency

Operating Expenses
Q3/14 operating expenses (% of Sales) at 2.85% slightly decreased from Q4/13
Highlights
165 174 180190
163 160145
3.53% 3.64% 3.55%
4.54%
3.68%3.46%
2.85%
0.00%
0.50%
1.00%
1.50%
2.00%
2.50%
3.00%
3.50%
4.00%
4.50%
5.00%
0
20
40
60
80
100
120
140
160
180
200
Q1/13 Q2/13 Q3/13 Q4/13 Q1/14 Q2/14 Q3/14
Operating Expenses (MB) Operating Expenses (% of Sales)

Finance Cost (MB)
30.8
44.9 47.1
23.3
13.4
2010 2011 2012 2013 9M14

5 Pillars
People and
Culture


• PC, NB, Tablet,
Smartphone
• CPU, Hard disk,
Main Board,
Memory, VGA,
Monitor
• Printer, Scanner,
TV, Projector,
Camera, Flash
Memory,
Accessories
• Toner, Ink cartridge
and other
consumables such
as paper and office
supplies
2014 Consumer Products Portfolio

2014 NEW PRODUCTS
ASUS ZenFone, HUAWEI Smartphone & Tablet
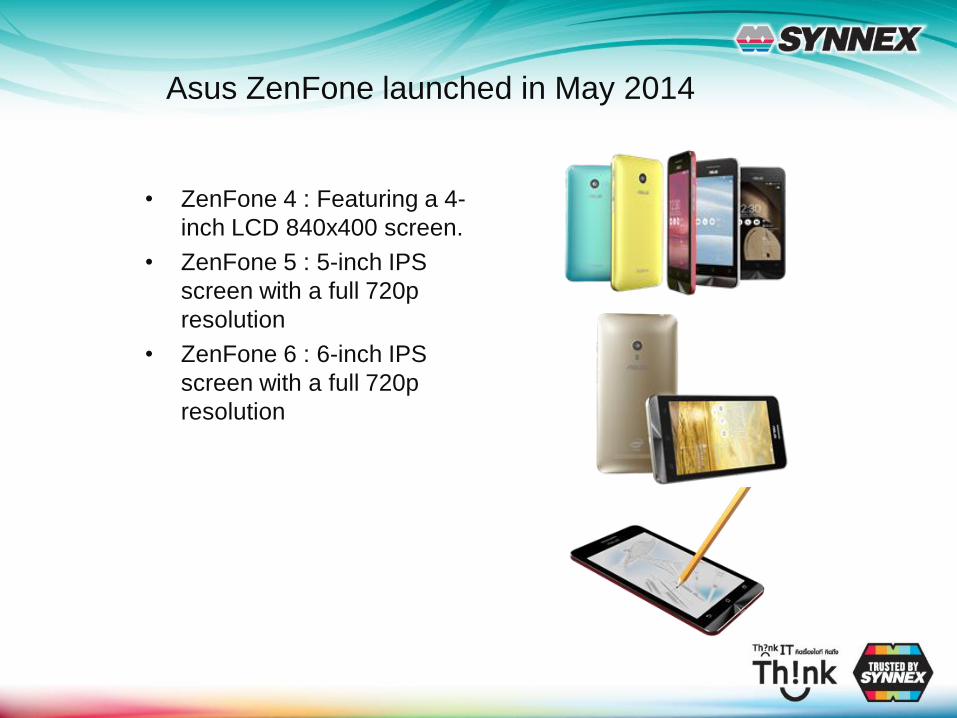
Asus ZenFone launched in May 2014
• ZenFone 4 : Featuring a 4-
inch LCD 840x400 screen.
• ZenFone 5 : 5-inch IPS
screen with a full 720p
resolution
• ZenFone 6 : 6-inch IPS
screen with a full 720p
resolution

HUAWEI Smartphone and Tablet will launch in Aug 2014
Ascend Mate 7

Q3 Y2014 REVIEW
Device, Storage, Commercial

Q3 2014 -2013 Overall Revenue
Comparison
+0.2%

Devices
Q3 Revenue +8.7%
+12.7%
-8.3%
+15%
+30.8%

Storage Products
Q3 Revenue +27%
+31.9%
+24%

Commercial Products
Q3 Revenue -9.7%
-10.6%
-6.6%

Component Products – DIY
Q3 Revenue + 12.9%
+33.1% +5.6% +12.9%
+9.3%
+13.2%

MARKET TRENDS
Device, Storage, Commercial Product Trends

Device Shipments
2 Years Forecast
by Gartner
(updated Oct 2014)
Worldwide Device Shipments by
Segment (Thousands of Units)
Source: Gartner (October 2014)
Device Type 2013 2014 2015
Traditional PCs (Desk-Based and Notebook) 296,131 276,457 261,005
Ultramobile Premium 21,517 37,608 64,373
PC Market Total 317,648 314,065 325,378
Tablets 207,082 229,085 272,904
Mobile Phones 1,806,964 1,859,946 1,928,169
Other Hybrids/Clamshells 2,706 6,462 8,609
Total 2,334,400 2,409,558 2,535,060
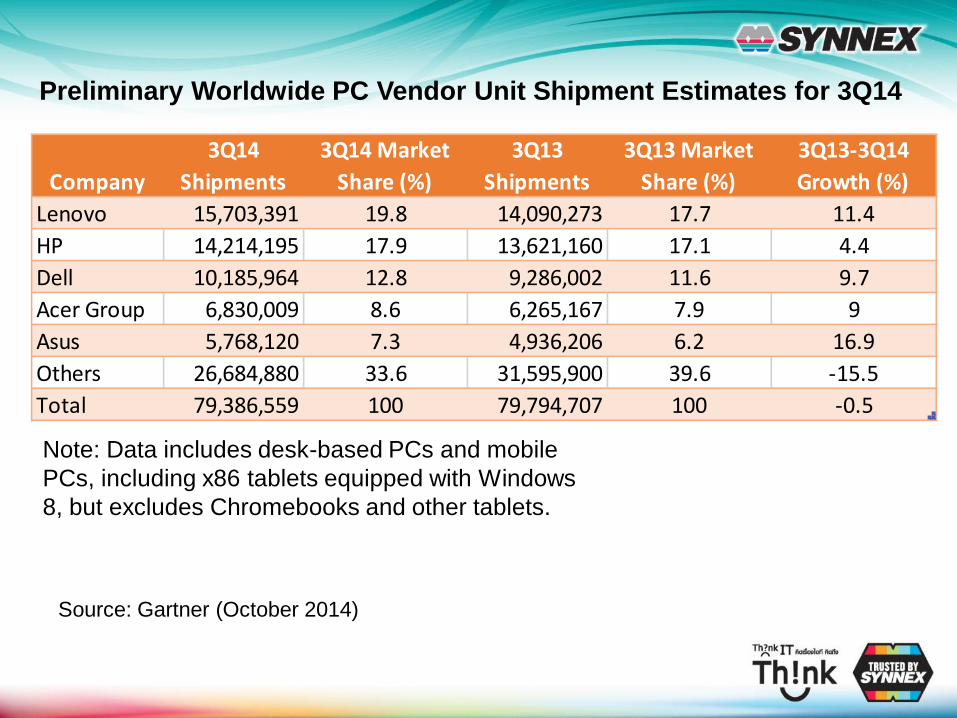
Preliminary Worldwide PC Vendor Unit Shipment Estimates for 3Q14
Source: Gartner (October 2014)
Company
3Q14
Shipments
3Q14 Market
Share (%)
3Q13
Shipments
3Q13 Market
Share (%)
3Q13-3Q14
Growth (%)
Lenovo 15,703,391 19.8 14,090,273 17.7 11.4
HP 14,214,195 17.9 13,621,160 17.1 4.4
Dell 10,185,964 12.8 9,286,002 11.6 9.7
Acer Group 6,830,009 8.6 6,265,167 7.9 9
Asus 5,768,120 7.3 4,936,206 6.2 16.9
Others 26,684,880 33.6 31,595,900 39.6 -15.5
Total 79,386,559 100 79,794,707 100 -0.5
Note: Data includes desk-based PCs and mobile
PCs, including x86 tablets equipped with Windows
8, but excludes Chromebooks and other tablets.

Storage Trend 2010-2017by Coughlin Associates

Commercial Products Trend
• Cloud computing– Microsoft Office 365
– Microsoft Azure
• Data Center Renovation– HP Network, Server and
Storage
– Dell Network, Server and Storage
– Cisco Network, Server and Storage
• Security – Essential for Cloud computing– Next Gen Firewall
– Security Software


Financial Performance (MB)
Revenue
Net Profit and Net Profit Margin
5,1255,472
5,1844,795 4,680 4,789
5,082
4,209 4,436 4,6165,080
0
1,000
2,000
3,000
4,000
5,000
6,000
Q1'12 Q2'12 Q3'12 Q4'12 Q1'13 Q2'13 Q3'13 Q4'13 Q1'14 Q2'14 Q3'14
82 80
129
80
121
36
82
(18)
3921
62
1.61%1.46%
2.57%
1.57%
2.59%
0.75%
1.62%
-0.42%
0.87%
0.46%
1.21%
(40)
(20)
0
20
40
60
80
100
120
140
-1.00%
-0.50%
0.00%
0.50%
1.00%
1.50%
2.00%
2.50%
3.00%
Q1'12 Q2'12 Q3'12 Q4'12 Q1'13 Q2'13 Q3'13 Q4'13 Q1'14 Q2'14 Q3'14
Net Profit Net Profit Margin

Q3/14 Financial Highlights (MB)
Q3/14 vs Q3/13 and Q2/14
THB million Q3/14 Q3/13 %YoY Q2/14 %QoQ
Sales 5,080.40 5,081.93 (0.03) 4,615.77 10.07
Gross profit 205.05 229.35 (10.60) 176.06 16.46
EBIT 79.74 111.61 (28.56) 31.80 150.74
EBITDA 91.38 121.76 (24.95) 41.82 118.52
Net Profit 61.53 82.27 (25.20) 21.14 191.06
Finance Cost 4.34 8.71 (50.18) 3.73 16.48
Outstanding Shares 770.33 770.33 0.00 770.33 0.00
Key Financial Ratios (%) Q3/14 Q3/13 %YoY Q2/14 %QoQ
Gross profit margin 4.04% 4.51% (10.57) 3.81% 5.81
Operating Expenses (% of Sales) 2.85% 3.55% (19.77) 3.46% (17.70)
EBIT margin 1.57% 2.20% (28.54) 0.69% 127.81
Net profit margin 1.21% 1.62% (25.18) 0.46% 164.45

9M14 Financial Highlights (MB)
9M14 vs 9M13
THB million 9M14 9M13 %YoY
Sales 14,132.69 14,550.07 (2.87)
Gross profit 564.56 755.28 (25.25)
EBIT 163.89 315.31 (48.02)
EBITDA 195.43 346.12 (43.54)
Net Profit 121.18 239.47 (49.40)
Finance Cost 13.49 16.84 (19.91)
Outstanding Shares 770.33 770.33 0.00
Key Financial Ratios (%) 9M14 9M13 %YoY
Gross profit margin 3.99% 5.19% (23.04)
Operating Expenses ( % of Sales) 3.31% 3.57% (7.39)
EBIT margin 1.16% 2.17% (46.49)
Net profit margin 0.86% 1.65% (47.90)

3.80 4.40 4.90 4.70 5.50 5.68
2.402.80
2.90 2.60
3.43 3.611.40
1.602.00
2.10
2.07 2.07
0.00
2.00
4.00
6.00
8.00
10.00
12.00
2010 2011 2012 2013 9M13 9M14
Asset Liabilities Equity
Short Term, 97%
Long Term, 3%
As of Sep 30,2014
IBD = 1.418.84
Interest Bearing Debt (IBD)Balance Sheet
Total Debt and D/E ratio (MB.)
Well Balanced Capital Structure
THB BN
2,359 2,729 2,949 2,598 3,428 3,613
1.66 1.65 1.49
1.26
1.65 1.75
-
0.50
1.00
1.50
2.00
-
1,000
2,000
3,000
4,000
2010 2011 2012 2013 9M13 9M14
Total Debt D/E

Dividends and Share Information
Dividend Policy: Policy of paying a minimum of 40% of net profit after tax, after reserve required by laws and other reserves.
0.21
0.30
0.40
0.560.53
0.29
0.12
0.22 0.25
0.27
0.32
0.15
57%
73%
63%
48%
60%
52%
0%
10%
20%
30%
40%
50%
60%
70%
80%
0.00
0.10
0.20
0.30
0.40
0.50
0.60
2008 2009 2010 2011 2012 2013
EPS DPS Dividend Payout
YearOperation
periodPayment Date Dividend (Per Share) EPS
Dividend Payout
Ratio
Cash Dividend 0.22
Stock Dividend 10:012012 Jan-Dec 2012 14/5/2013 0.53 60.38%
Note:

Questions & Answers

INVESTOR RELATIONS:EMAIL: [email protected]
FOR FURTHER INFORMATION AND CURRENT NEWS: WWW.SYNNEX.CO.TH/INVESTOR

2,418.48 , 17%
2,277.49 , 16%
1,692.84 , 12%
653.85 , 5%870.52 , 6%
1,598.15 , 11%
1,169.31 , 8%
1,734.72 , 12%
1,763.19 , 13%
Communication
Devices (CDG)
Component
(CPG)
Consumables
& Supply(CSG)
Revenues Contribution 9M14 (MB)
Display(DPG)
Network(NPG)
Software(SWG)
Imaging &
Printing(IPG)
Multimedia
Consumer Electronics (MPG)
System
(SPG)

37
Revenues & GP Structure 9M/2014
Units : M.B.
Revenue GP Revenue GP
Contribution Contribution Contribution Contribution
CDG 3,156.53 116.68 3.70% 14.90% 11.01% 2,418.48 3.37 0.14% 17.11% 0.60%
CPG 3,580.55 156.63 4.37% 16.91% 14.78% 2,277.49 84.86 3.73% 16.12% 15.05%
CSG 2,655.37 179.48 6.76% 12.54% 16.93% 1,692.84 98.16 5.80% 11.98% 17.41%
DPG 937.80 45.71 4.87% 4.43% 4.31% 653.85 25.65 3.92% 4.63% 4.55%
NPG 2,213.78 146.29 6.61% 10.45% 13.80% 870.52 41.06 4.72% 6.16% 7.28%
SWG 1,642.97 72.84 4.43% 7.76% 6.87% 1,598.15 80.78 5.05% 11.31% 14.33%
IPG 1,546.13 90.57 5.86% 7.30% 8.55% 1,169.31 62.27 5.33% 8.27% 11.04%
MCE 2,341.91 147.00 6.28% 11.06% 13.87% 1,734.72 85.18 4.91% 12.27% 15.11%
SPG 3,104.97 104.63 3.37% 14.66% 9.87% 1,763.19 48.39 2.74% 12.48% 8.58%
CNEX Shop 6.21 0.79 12.71% 0.04% 0.14%
Other Products (Service) 4.71 4.48 95.04% 0.03% 0.79%
Other operating revenues (56.84) 28.84 -50.74% -0.40% 5.11%
Total 21,180.00 1,059.83 5.00 100% 100% 14,132.63 563.83 3.99% 100% 100%
MKT Group
Target 2014 9M-2014
Sales
Amount
GP
Amount GP %
Sales
Amount
GP
Amount GP %
CDG Including GP HTC = 61.34 M.B. GP% =2.68%
COD= 8.62 M.B. ,HTC =61.34 M.B.GP =4.50

38
Q110
Q210
Q310
Q410
Q111
Q211
Q311
Q411
Q112
Q212
Q312
Q412
Q113
Q213
Q313
Q413
Q114
Q214
Q314
Revenue 3,74 3,75 4,20 3,89 4,55 5,29 5,94 4,43 5,12 5,47 5,18 4,79 4,68 4,78 5,08 4,20 4,43 4,61 5,07
Available 1,57 1,46 1,36 1,86 1,61 1,43 2,80 3,73 3,39 3,47 3,31 4,26 4,39 4,14 3,95 4,66 4,43 4,18 3,91
S/T Loans 1,14 1,25 1,32 1,07 1,33 1,73 1,46 830 845 1,48 1,81 1,10 754 1,07 1,21 1,37 795 964 1,27
L/T Loans 114 145 173 164 150 141 132 170 366 265 235 199 169 139 189 159 129 209 169
F/N Costs 6.4 8.0 7.4 9.1 8.1 13.0 13.1 10.8 9.3 14.5 14.0 9.3 3.9 4.2 8.7 6.5 5.4 3.7 4.3
6.4
8.0 7.4
9.1
8.1
13.0 13.1
10.8
9.3
14.5
14.0
9.3
3.9 4.2
8.7
6.5
5.4
3.7 4.3
-
3.0
6.0
9.0
12.0
15.0
18.0
21.0
0
2000
4000
6000
8000
10000
12000
In M
illio
n B
ah
t
Total F/N Costs
Q1-Q3 2014 =13.48 MB Total F/N Costs 2011
=44.95MB Total F/N Costs 2012
=47.13MB Total F/N Costs 2013
=23.27MB
Total F/N Costs 2010 =30.83MB
Credit Facilities & Finance Costs

Cash Cycle (Days)
Key Financial Ratios
44
38
42
49
55
2023
26
31
38
2724
2830
38
50
40
44
48
55
0
10
20
30
40
50
60
2010 2011 2012 2013 9M14
- Average collection period - Average payment period
- Average age of inventory - Cash Cycle
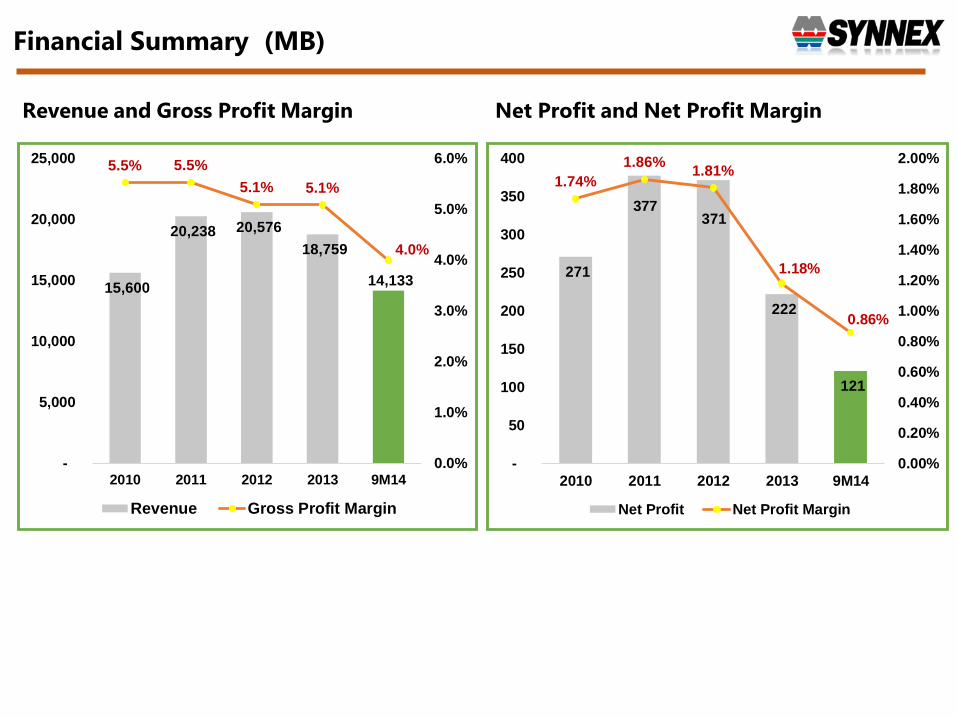
Revenue and Gross Profit Margin Net Profit and Net Profit Margin
Financial Summary (MB)
15,600
20,238 20,576
18,759
14,133
5.5% 5.5%
5.1% 5.1%
4.0%
0.0%
1.0%
2.0%
3.0%
4.0%
5.0%
6.0%
-
5,000
10,000
15,000
20,000
25,000
2010 2011 2012 2013 9M14
Revenue Gross Profit Margin
271
377 371
222
121
1.74%
1.86%1.81%
1.18%
0.86%
0.00%
0.20%
0.40%
0.60%
0.80%
1.00%
1.20%
1.40%
1.60%
1.80%
2.00%
-
50
100
150
200
250
300
350
400
2010 2011 2012 2013 9M14
Net Profit Net Profit Margin

EBIT and EBIT Margin 9M14 Financial Cost vs Sales
408
566 531
300
164
2.6%
2.8%
2.6%
1.6%
1.2%
0.0%
0.5%
1.0%
1.5%
2.0%
2.5%
3.0%
-
100
200
300
400
500
600
2010 2011 2012 2013 9M14
EBIT EBIT Margin
Financial Cost, 0.10%
Sales, 99.90%
Financial Cost Sales
Key Financial Ratios
ROA and ROE
11.37%13.88%
11.47%
6.29% 7.31%
2.65%
19.98%
24.52%
20.38%
11.13%
16.04%
5.00%
0.00%
5.00%
10.00%
15.00%
20.00%
25.00%
30.00%
2010 2011 2012 2013 9M13 9M14
ROA ROE

1.66 1.65
1.49
1.26
1.75
0.87
0.61 …
0.34
0.69 0.79
0.56 0.64
0.29
0.62
-
0.20
0.40
0.60
0.80
1.00
1.20
1.40
1.60
1.80
2.00
2010 2011 2012 2013 9M14
Liabilities to Equity IBD to Equity Net Debt To Equity
Debt to Capitalization Net Debt to EBITDA & ICR
Key Financial Ratios
Times
2.50
1.50 2.21
1.75 2.35
10.96 11.01 11.26
12.84 12.15
-
2.00
4.00
6.00
8.00
10.00
12.00
14.00
2010 2011 2012 2013 9M14
Net Debt to EBITDA ICR
Times
Net Debt to EBITDA Interest Coverage
Sep14: 0.62 Sep14: 16.16 Sep14:16.96 Sep14: 1.49
Sep13: 0.56 Sep13:9.33 Sep13: 13.40 Sep13: 1.52
Current RatioNet Debt to Equity
KEY RATIOS

Revenues Structure GP%
CPG, 20% CPG, 17% CPG, 16%
CDG, 13%CDG, 14% CDG, 17%
SPG, 17%SPG, 14% SPG, 12%
CSG, 13%
CSG, 12% CSG, 12%
SWG, 9%SWG, 12% SWG, 11%
MCE, 9%MCE, 11% MCE, 12%
NPG, 6% NPG, 8% NPG, 6%
IPG, 9% IPG, 7% IPG, 8%
DPG, 5% DPG, 5% DPG, 5%
0%
10%
20%
30%
40%
50%
60%
70%
80%
90%
100%
2012 2013 Jan- Sep 2014
CPG, 5.02% CPG, 4.26% CPG, 3.73%
CDG, 3.23%CDG, 3.08%
CDG, 0.14%
SPG, 3.36%SPG, 2.63%
SPG, 2.74%
CSG, 6.37%CSG, 6.22%
CSG, 5.80%
SWG, 6.95%
SWG, 5.65%
SWG, 5.05%
MCE, 6.68%
MCE, 5.28%
MCE, 4.91%
NPG, 4.32%
NPG, 3.88%
NPG, 4.72%
IPG, 5.69%
IPG, 6.41%
IPG, 5.33%
DPG, 4.60%
DPG, 4.59%
DPG, 3.92%
0.00%
5.00%
10.00%
15.00%
20.00%
25.00%
30.00%
35.00%
40.00%
45.00%
50.00%
2012 2013 Jan- Sep 2014
CDG Including GP HTC = 61.34 M.B. GP% = 2.68%