dismantling bilingual education implementing english immersion
TRANSCRIPT

DISMANTLING BILINGUAL EDUCATION IMPLEMENTING ENGLISH IMMERSION:
THE CALIFORNIA INITIATIVE
Christine H. Rossell
Political Science Department Boston University
Email: [email protected] Web Page: http://web.bu.edu/POLISCI/CROSSELL/CRossell.html
Revised August 20, 2002
This research project was funded by the Public Policy Institute of California, San Francisco, California

DISMANTLING BILINGUAL EDUCATION IMPLEMENTING ENGLISH IMMERSION:
THE CALIFORNIA INITIATIVE
Christine H. Rossell
Political Science Department Boston University
Email: [email protected]
Revised August 20, 2002
This research project was funded by the Public Policy Institute of California, San Francisco, California

i
Summary
California has a 26 year history of bilingual education that was supposed to end with the
passage of Proposition 227 on June 2, 1998. Proposition 227 required that children who were
“English learners” (formerly called limited English proficient or LEP) be placed in a sheltered
English immersion program in which nearly all instruction was in English but at a pace the
student could understand.
Proposition 227 did not completely replace bilingual education, but the number of limited
English proficient or English Learner (EL) students enrolled in bilingual education declined from
409,879 in 1997-98 to 169,440 in 1998-99. It has remained close to that level at 169, 929 in
1999-00, and 167, 163 in 2000-01. The percentage enrolled in bilingual education declined from
29 to 12 percent in 1998-99 and has pretty much remained at that level (11 percent in 1999-00
and 2000-01). At the elementary level, the percentage enrolled in bilingual education declined
from 39 percent to 15 percent and has pretty much remained at that level (16 percent in 1999-00
and 15 percent in 2000-01). Similar changes were seen in the largest school districts in
California, although San Francisco and Oakland are notable exceptions. San Diego has seen a
resurgence in bilingual education enrollment since the large decline in the first year of
Proposition 227.
On February 7, 2002, the California State Board of Education approved the circulation of
regulations allowing the principal and educational staff, as well as parents, to make the decision
on whether children should be placed into bilingual education programs, thereby nullifying a
core provision of Proposition 227. The proposed February 2002 regulations also eliminated the
requirement that English learners be taught English for at least the first thirty days of every
school year. If a child receives a waiver and is placed in an alternative program, the 30 days in

ii
English would only be necessary the first year that the child enrolls in school. Although this is
current practice, the threat of a lawsuit by Ron Unz prompted the defeat of these proposed
regulations on March 30, 2002. Teachers are in fact already the primary decision makers of
whether a child is placed in bilingual education and many schools are already cheating on the 30
day requirement, so the state board’s proposed regulations were merely an attempt to codify
current practice. The defeat of the proposed regulations is unlikely to change current practice.
The future academic success of Proposition 227 is limited by other potential problems as
well. To begin with, there is no unequivocal research demonstrating that bilingual education is
the educational disaster that some of its critics claim. Nor was bilingual education universal.
Although not publicly acknowledged, bilingual education was and is a program for Spanish
speaking English Learners. Spanish speakers were 82 percent of the English Learners in
California and the only students in bilingual education learning to read and write in their native
tongue. Other English Learners do not receive native tongue instruction even though the
program may be called “bilingual.”
The tendency is to claim a program for English Learners is “bilingual” whenever students
of the same ethnicity are placed in a separate classroom for the purposes of helping them learn
English even if the native tongue is not used in instruction. As noted above, only 29 percent of
all English Learners and 39 percent of all elementary English Learners were enrolled in bilingual
education before Proposition 227. If the only children enrolled in nominal bilingual education
had been Spanish speakers, at most only 36 percent of all Spanish speaking English Learners
would have been enrolled in bilingual education, 47 percent at the elementary level and 13
percent at the secondary level. The actual percentage of children enrolled in a true bilingual
education program is probably several points lower than this since not all the children enrolled in

iii
programs labeled bilingual education were Spanish speakers and not even 100 percent of the
Spanish speakers enrolled in bilingual education were actually being taught in their native
tongue.
The import of the fact that bilingual education was not widespread and affected only
Spanish speakers is that whatever replaces it will not produce miracles. The low achievement of
English Learners is due primarily to their immigrant status, their social class, and the way in
which English Learner is defined. An English Learner is not just a child who is learning English
or from an immigrant family. An English Learner is a child who is learning English or from an
immigrant family who scores low on tests in English. Thus, by definition, these students are low
scorers and it is not possible for them to be designated English Learner and not be a low scorer.
In addition, once classified as an English Learner, anywhere from 1/3 to 1/2 of English Learners
will never be reclassified fluent English speaking solely because the test score criterion is
unattainable for 1/3 to 1/2 of native English speakers.
If we take into account these limitations and the fact that as of the spring of 2001 the
resdesignation standard had not changed, the apparently small improvement in redesignation
rates since Proposition 227 apears more impressive. The 24 point decline in elementary English
Learners enrolled in bilingual education produced a 7 ½ to 15 point increase in elementary
English Learners redesignated. The lower number is the cumulative elementary school (seven
grade) impact of the one point difference between the actual and the projected and the higher
number is the cumulative difference between the 7 percent before Proposition 227 and the 9.1
percent in spring 2001. By the standards of educational research, even the smaller number is an
impressive impact. It means that for every 3.2 point decline in the percentage enrolled in
elementary bilingual education, the state gets a one point increase in the percentage of

iv
elementary English Learners redesignated. The adoption of a statewide English proficiency test
(CELDT) as of spring 2002 will, however, muddy the waters for quite some time since one
cannot compare past redesignation rates to those achieved with the new test.
Between the state board’s and the school district’s interpretations, Proposition 227 has
been modified substantially. School districts have interpreted Proposition 227 to allow at least
30 percent of instruction in the native tongue in a sheltered immersion class. Moreover, it seems,
that in districts that have not made a districtwide commitment to English language instruction,
parents in schools with substantial numbers of Spanish speaking English Learners can easily
obtain a waiver to enroll their child in bilingual education. Such schools have been assigning
kindergarten and preschool Spanish speaking English Learners and other new English Learner
immediately to programs labeled bilingual education without 30 days of instruction in a sheltered
English immersion program. The careful documentation of special need is apparently often
ignored and the primary consideration of many schools seems to be whether they have enough
English Learners of a single language to form a classroom for that grade.
In schools where there are not enough Spanish speakers to maintain a bilingual education
program or in districts that have made an across the board commitment to English language
instruction, parents may not be informed of their right to a waiver since there is no practical way
to comply with that request. Districts do not seem to be busing Spanish speaking English
learners to other schools in order to have enough to run a bilingual education program.
Thus, schools apparently control demand for bilingual education. Many Hispanic parents
are quite willing to defer to the school staff as the authority on the program their child should be
in. Teachers in schools with enough Spanish speaking English Learners to run a bilingual
education program explained to me that they “worked very hard” telephoning and holding

v
meetings during the 30 day all-English trial period to convince parents that their child would be
better off in the bilingual education program they had been recommended for the previous year
and in some cases had been assigned to immediately on the first day of school.
Hispanic students are the only English Learners who get waivered into bilingual
education since they were the only ones in true bilingual education in the first place. Thus, the
percentage of students in bilingual education since Proposition 227 is still primarily a function of
the number of Hispanic English Learners. Since only the Spanish speakers were being taught
literacy in their native tongue before Proposition 227, they are the only English Learners who
need to be waivered after Proposition 227.
But waivered students do not necessarily translate into bilingual education classrooms.
The reality is a lot messier. Only 40 percent of the schools for which I had data had all of their
waivered students in bilingual education classrooms. Many, if not most, waivered students are
actually in a mixed treatment or structured immersion classroom.
Teachers in the structured immersion classrooms were universally pleased at the success
of the program. Former Spanish bilingual teachers were pleased at how rapid was their students’
progress in English in the sheltered English immersion classroom and how proud their students
were to be learning English. This was particularly true of the former bilingual education teachers
in Oceanside who were not only pleased with their experience with sheltered English immersion,
but with the benefits that accrue from the entire school district having adopted sheltered English
immersion. Nevertheless, former bilingual education teachers in the other school districts still
believe in the facilitation theory and worry about possible long term negative consequences of
learning to read and write in English rather than Spanish. Former Chinese bilingual teachers saw

vi
Proposition 227 as a non-event. They continued to do what they had always done—teach
children to read and write in English in a sheltered environment.
One of the most controversial aspects of Proposition 227 has been the one year limit on
being in a self-contained program. The state board has interpreted the one year time limit as
renewable if the child has not achieved a “reasonable level of English proficiency” as measured
by state designated assessment tests. Following their lead, school districts have said that one
year is the minimum, not the maximum time the law states that a child can be in a sheltered
English immersion program. Thus, it is possible that English Learners will stay in structured
immersion classes their entire elementary school careers just as often occurred with bilingual
education before Proposition 227.
Students who obtain waivers to stay in bilingual education are not affected by the one
year time limit at all. Assuming there are enough students to run a K-6 bilingual education
program, a Hispanic English Learner could still stay in bilingual education his or her entire
elementary school career, as was sometimes the case before Proposition 227, and it would be
perfectly legal.
Many school district administrators do not understand what structured English immersion
is and they believe that if the language of instruction is English, they are in compliance with
Proposition 227. As a result, there are numerous English Learners currently in mainstream
classrooms, not the sheltered classrooms envisioned in Proposition 227. This coupled with the
fact that some large, unknown percentage of the bilingual education students are in mixed
treatment classes and the ones in true bilingual education classes are getting more English,
means that evaluating the educational effect of structured immersion is going to be extremely
difficult.

vii
This is further complicated by the fact that currently about 16 percent of English Learners
are not tested in reading on the SAT9 despite the state law requiring it. This varies considerably
from school to school and district to district with a range from 0 to 100 percent. Drawing
conclusions from simple descriptive statistics of the achievement of English Learners in a school
or school district, as so many have done, is risky because of the differences in testing rates for
English Learners, and the even lower testing rate for students in bilingual education. In some
schools, it is possible that none of the students in bilingual education were tested in reading. The
STAR data file with test scores of English Learners by school does not clarify this because it is
not broken down by program. What is available from the state is not reliable, except for the most
recent year.1
A statistical analysis of the relationship between 2001 school achievement and the
percentage enrolled in bilingual education in 2001 controlling for 1998 test scores and the %
poor in 2001 shows about a six point reduction in reading achievement and a three point
reduction in math achievement if a school has all of its English Learners enrolled in bilingual
education compared to none.
Other scientific research (Bali, 2000) at the individual level shows a similar effect—a
small significant effect in reading and an even smaller effect in math. Nationwide reviews of the
scientific research on the effectiveness of bilingual education suggests that the model required by
Proposition 227 is the most successful approach to educating limited English proficient children.
On the other hand, there is also evidence to indicate that the best bilingual education programs
1 There is a data file that has just been posted at http://www.eddataonline.com/research/ that breaks test scores down by program enrollment. However, the bilingual education program category is not at all accurate before 2000-01. In earlier, years, it includes instructional programs for English Learners that are in English because the question was a yes or no as to whether the child was enrolled in a bilingual education program. Thus, there is no ability to analyze change over time. The state (CDE) will make individual student test scores available to researchers with contracts to the state, but the student records in the CDE files do not have individual identifiers that would allow one to track the progress of individual kids across years or associate them with particular teachers and classrooms.

viii
are as good as the worst all-English programs. A program with some native tongue instruction
and no reduction in English is, on average, the equal of a mainstream classroom.
Thus, Proposition 227 may have a positive effect on the academic achievement of
English Learners, but it is not going to turn them into high scoring students. This is because
bilingual education may be the least effective way of teaching English Learners, but it was not
the primary cause of their low achievement. Second, the redesignation standards are still as
problematic as, and even more unrealistic than, they were before Proposition 227. The new
statewide test will only add to the confusion, at least for several years. Although redesignation
rates have gone up substantially in proportion to the reduction in bilingual education since
Proposition 227, the new standards and tests may change all this. Redisignation rates could go
up or down solely as a result of the new standards rather than the new programs.
Recommendations for Amending Proposition 227
I have four recommendations for improving Proposition 227 and its outcomes and one for
improving the state law on testing. First, sheltered English immersion programs that use up to 30
percent Spanish instruction should be tolerated, so long as they do not teach Spanish literacy.
Second, the state should prohibit the clustering of preschool and kindergarten English Learners
in classrooms labeled bilingual education during the initial 30 day sheltered English immersion
period. Third, school districts should be prohibited from using tests as the sole means of
classifying and reclassifying students as EL. Fourth, Proposition 227 should be amended to
include a provision that individual students cannot be kept in a self-contained sheltered English
immersion program longer than a year regardless of their test scores unless a) the parent visits
the school and personally signs a waiver each year, and b) the school district fills out a lengthy

viii
are as good as the worst all-English programs. A program with some native tongue instruction
and no reduction in English is, on average, the equal of a mainstream classroom.
Thus, Proposition 227 may have a positive effect on the academic achievement of
English Learners, but it is not going to turn them into high scoring students. This is because
bilingual education may be the least effective way of teaching English Learners, but it was not
the primary cause of their low achievement. Second, the redesignation standards are still as
problematic as, and even more unrealistic than, they were before Proposition 227. The new
statewide test will only add to the confusion, at least for several years. Although redesignation
rates have gone up substantially in proportion to the reduction in bilingual education since
Proposition 227, the new standards and tests may change all this.
Recommendations for Amending Proposition 227
I have four recommendations for improving Proposition 227 and its outcomes and one for
improving the state law on testing. First, sheltered English immersion programs that use up to 30
percent Spanish instruction should be tolerated, so long as they do not teach Spanish literacy.
Second, the state should prohibit the clustering of preschool and kindergarten English Learners
in classrooms labeled bilingual education during the initial 30 day sheltered English immersion
period. Third, school districts should be prohibited from using tests as the sole means of
classifying and reclassifying students as EL. Fourth, Proposition 227 should be amended to
include a provision that individual students cannot be kept in a self-contained sheltered English
immersion program longer than a year regardless of their test scores unless a) the parent visits
the school and personally signs a waiver each year, and b) the school district fills out a lengthy
form attesting to the special circumstances that require that this child be kept in a self-contained

ix
form attesting to the special circumstances that require that this child be kept in a self-contained
program. Fifth, Proposition 227 should be amended to include a provision that students in
bilingual education classes cannot be kept in a self-contained classroom for longer than two
years regardless of their test scores unless a) the parent visits the school and personally signs a
waiver each year, and b) the school district fills out a lengthy form attesting to the special
circumstances that require that this child be kept in a self-contained program.
I also have a recommendation to improve the state law on testing. School districts should
be required to test 90 percent of their English Learners in order to receive state awards. This
simply applies the new state regulations for all students to English Learners specifically.
As it stands now, a major impact of Proposition 227 that can be determined with some
certainty is that it came close to eliminating bilingual education in California after 26 years of
support by the California Department of Education. Fifty-six percent of the schools, and about
47 percent of the school districts, that had some bilingual education before Proposition 227
completely eliminated their bilingual education programs and almost all of them had a reduction
in bilingual education.
We also know that maintaining a bilingual education program after Proposition 227 has a
negative effect on reading and math achievement at both the school and individual level. The
size of the negative effect will remain small, however, so long as bilingual education programs
are allowed to test fewer of their students than all-English programs and there is no way to
follow the achievement gains of students after they are redesignated fluent-English-proficient.
An English Learner is, by definition, a low achiever in English and so their test scores can only
improve a small amount before they are transferred out of that category.

x
Contents
Summary......................................................................................................................................... i RECOMMENDATIONS FOR AMENDING PROPOSITION 227 .......................................................... VIII
Figures.......................................................................................................................................... xii
Tables .......................................................................................................................................... xiv
Appendices................................................................................................................................... xv
Acknowledgements .................................................................................................................... xvi
1. What is Bilingual Education? .................................................................................................. 1 DATA ........................................................................................................................................... 2 PROGRAMS FOR ENGLISH LEARNERS ........................................................................................... 4 CALIFORNIA LAW ........................................................................................................................ 9 PROPOSITION 227....................................................................................................................... 10
Legal Challenges .................................................................................................................. 12 HOW SCHOOL DISTRICTS INTERPRETED PROPOSITION 227........................................................ 15 THE TIME LIMIT IN A SELF-CONTAINED CLASSROOM................................................................ 21
2. Designating a Child Limited-English-Proficient or English Learner ................................ 24 THE DESIGNATION PROCESS ...................................................................................................... 26
The Home Language Survey ................................................................................................. 26 Norm-Referenced Tests......................................................................................................... 27 Oral Proficiency Tests .......................................................................................................... 32
THE RESEARCH ON ENGLISH PROFICIENCY TESTS ..................................................................... 32 THE ENGLISH LEARNER POPULATION IN CALIFORNIA ............................................................... 39 REDESIGNATION RATES IN CALIFORNIA .................................................................................... 41
3. Enrollment in Bilingual Education Before Proposition 227 ............................................... 44 PROGRAM ENROLLMENT DATA ................................................................................................. 44 HOW MANY STUDENTS IN BILINGUAL EDUCATION? ................................................................. 49 WHICH LANGUAGE GROUPS? .................................................................................................... 52
4. The Impact of Proposition 227 on Bilingual Education ...................................................... 58 TRENDS IN BILINGUAL EDUCATION ENROLLMENT .................................................................... 71 WHAT KINDS OF SCHOOLS CONTINUED BILINGUAL EDUCATION AFTER PROPOSITION 227?..... 80
5. Did Bilingual Education Harm English Learners in California?....................................... 82 METHODOLOGICAL CONSTRAINTS: DIFFERENTIAL TESTING RATES .......................................... 84 THE EFFECT OF PROPOSITION 227 ON ACHIEVEMENT................................................................ 91 RESEARCH FINDINGS NATIONWIDE............................................................................................ 95
Bilingual Education v. Doing Nothing.................................................................................. 97 Bilingual Education v. Structured Immersion. ..................................................................... 97 Structured Immersion v. ESL ................................................................................................ 98 Transitional Bilingual Education v. Maintenance Bilingual Education .............................. 98
META-ANALYSIS ....................................................................................................................... 99 RECOMMENDATIONS OF ROSSELL AND BAKER (1996B) .......................................................... 101

xi
6. Summary And Recommendations....................................................................................... 105 RECOMMENDATIONS FOR AMENDING PROPOSITION 227 ......................................................... 106
BIBLIOGRAPHY END
xii
Figures
Figure 1.1 Percentage of English Learners who are Spanish or Vietnamese Speakers in Los Angeles Unified, San Diego City Unified, San Francisco Unified and the State, 1989-90 to 2000-01
Figure 2.1 Percentage Poor in a California School District by English Learner (EL) Status, Spring 1997
Figure 2.2 Percentage of Fluent English Speaking Children Scoring at or Below the 36th Percentile on CAT5 by Poverty Status in a California School District, Spring 1997
Figure 2.3 Percentage of English Learners (EL) and Actual and Projected Percentage of EL Redesignated Pre and Post Proposition 227 in California, 1981-82 to 2000-01
Figure 3.1 Elementary and Secondary English Learner Program Enrollment in California, 1997-98
Figure 3.2 Maximum Possible Percentage of Spanish Speaking English Learners in Bilingual Education in California, 1997-98
Figure 3.3 Pre-Proposition 227 Predicted Program Placement of English Learners in California
Figure 4.1 A Supply and Demand Model of the Process of Creating Waivered Bilingual Education Students and Waivered Bilingual Education Classrooms Under Proposition 227
Figure 4.2 Percentage of Waivered Students in Mainstream Classrooms in Observed Hispanic Elementary Schools, California, 1998-99
Figure 4.3 Percentage of Students Who are Waivered in 31 Classrooms Containing Waivered Students in One Elementary School in Los Angeles Unified, 1998-99 and September 2001
Figure 4.4 Percentage of Observed Hispanic Schools with Waivered Students by Grade, 1998-99 and September 2001
Figure 4.5 Percentage of English Learners Enrolled in Bilingual Education (Old Category) in California, 1989-90 to 2000-01
Figure 4.6 Percentage of Elementary English Learners Enrolled in Each Program Model (Old Categories) in California, 1997-98 to 2000-01
Figure 4.7 Percentage of Secondary English Learners Enrolled in Each Program Model (Old Categories) in California, 1997-98 to 2000-01
Figure 4.8 Elementary and Secondary English Learner Program Enrollment (New Categories) in California, 2000-01
Figure 4.9 Percentage of Elementary English Learners Enrolled in Bilingual Education in Los Angeles, San Diego, San Francisco, and the State, 1996-97 to 2000-01
Figure 4.10 Percentage of Secondary English Learners Enrolled in Bilingual Education in Los Angeles, San Diego, San Francisco, and the State, 1996-97 to 2000-01
Figure 4.11 Percentage of Elementary English Learners Enrolled in Bilingual Education in Five Districts and the State, 1996-97 to 2000-01
Figure 4.12 Percentage of English Learners Enrolled in Bilingual Education in Oceanside Unified School District and the State, 1989-90 to 2000-01
xiii
Figure 4.13 Percentage of English Learners Enrolled in Bilingual Education in California Schools Pre and Post Proposition 227 by Number of Spanish Speaking English Learners, 1997-98 to 2000-01
Figure 4.14 Percentage of Elementary English Learners Enrolled in Bilingual Education in California Schools Pre and Post Proposition 227 by Number of Spanish Speaking English Learners, 1997-98 to 2000-01
Figure 5.1 Percentage of English Learners Tested in Reading in California Schools, 1997-98 to 2000-01
Figure 5.2 Percentage of English Learners Tested in Math in California Schools, 1997-98 to 2000-01
Figure 5.3 Percentage of Elementary School English Learners Tested in Reading in the State and the Four California School Districts that Litigated the Requirement to Test All English Learners,1997-98 to 2000-01
Figure 5.4 Percentage of Elementary School English Learners Tested in Reading in Four Other Large California School Districts and the State, 1997-98 to 2000-01
Figure 5.5 Percentage of Elementary English Learners Tested in Reading in California Schools by Extent of Enrollment in Bilingual Education Controlling for Poverty, Size, and Spanish Speaking Population, 1997-98 through 2000-01
Figure 5.6 Percentage of English Learners Tested in Reading by Program Using Individual Student Data from Pasadena Unified School District, Los Angeles Unified School District and a Nationwide Sample
Figure 5.7 English Learner Test Score Gains from 1998 to 2001 in Reading and Math in California Elementary Schools with More than 120 Students Enrolled in Bilingual Education in 1998
Figure 5.8 Effect of Bilingual Education on 2001 Achievement in California Elementary Schools Controlling for 1998 School Achievement and % Poor in 2001

xiv
Tables
Table 1.1 Post-227 Classroom Observations and Interviews, Spring 1999 and Fall 2001 Table 1.2 Interpretations of Proposition 227 Requirement for Structured Immersion in Los
Angeles, San Diego, and San Francisco, 1998-1999 Table 1.3 Interpretations of Informed Consent and Circumstances Justifying Parental
Waiver of Proposition 227 in Los Angeles, San Diego, and San Francisco, 1998-99
Table 1.4 Interpretations of Definition of English Learner and Time Period of Sheltered English Immersion Program in Emergency State Board Regulations (10/98), Los Angeles, San Diego, and San Francisco, 1998-99
Table 1.5 State Board of Education Proposed Regulations Regarding the 30 Day Time Period and Who Can Initiate Waivers, February 2002
Table 2.1 Percentage of Hispanic, Asian, Non-Hispanic White, and All Students Who Are Designated English Learners in California in 1997-98 and 2000-01 by School Level
Table 2.2 Percentage of English Learners who are Hispanic, Asian, and Non-Hispanic White in California, 1997-98 and 2000-01
Table 2.3 Redesignation Rates for English Learners and Cumulative Redesignation Rates for 1992-93 Kindergarten Cohort in California, 1981-82 to 2000-01
Table 3.1 Staff providing Primary Language Instruction in California From State Department of Education Language Census, Before Proposition 227 (1997-1998)
Table 3.2 Predictors of the Number of English Learners (EL) Enrolled in Bilingual Education in Individual Schools in California, 1997-98
Table 4.1 Predictors of the Number of English Learners (EL) Enrolled in Bilingual Education in Individual Schools in California after Proposition 227, 2000-01
Table 4.2 Correlation Between Number and Percentage of English Learners Enrolled in Bilingual Education Pre and Post Proposition 227 in California Schools
Table 4.3 Correlation Between Number and Percentage of English Learners Enrolled in Bilingual Education Pre and Post Proposition 227 in California School Districts
Table 5.1 The Effect of Bilingual Education on 2001 Achievement in California Elementary Schools
xv
Appendices
Appendix A Text of Proposition 227 Appendix B Example of Interview Questions Appendix C Instructions for the Language Census (Form R30-LC), Spring 2001 Appendix D Language Census Form, Spring 2001 Appendix E English Language Proficiency Tests Approved by the State of California Appendix F Program Enrollment in California, Los Angeles, San Diego, and San Francisco Table F.1 Program Enrollment by Year in State of California Table F.2 Program Enrollment in State of California, Elementary Schools Only Table F.3 Program Enrollment in Los Angeles Unified School District Table F.4 Program Enrollment in Los Angeles Unified School District, Elementary Schools
Only Table F.5 Program Enrollment in San Diego City Unified School District Table F.6 Program Enrollment in San Diego City Unified School District, Elementary
Schools Only Table F.7 Program Enrollment in San Francisco Unified School District Table F.8 Program Enrollment in San Francisco Unified School District, Elementary
Schools Only Appendix G Bilingual Education Enrollment in the Largest School Districts in California Table G.1 Bilingual Education Pre and Post Proposition 227 in Largest (at or above 20,000
in 2000-01) School Districts in California Table G.2 Elementary Bilingual Education Pre and Post Proposition 227 in Largest (at or
above 20,000 in 2000-01) School Districts in California Appendix H Percentage of English Learners Tested in Reading Pre and Post Proposition 227 in
Largest (at or above 20,000 in 2000-01) School Districts in California Appendix I Predictors of the Percentage of English Learners Tested in California Elementary
Schools, 1997-98, 1998-99, 1999-00, 2000-01 Appendix J Percentage of Methodologically Acceptable Studies Demonstrating Program
Superiority, Equality, or Inferiority by Achievement Test Outcome

xvi
Acknowledgements
I wish to thank the Public Policy Institute of California for awarding me a Visiting
Fellowship in Winter and Spring 1999 on the strength of a proposal written before Proposition
227 came on the political horizon. When I showed up in January 1999, it had been in place for
four months.
I am also grateful to Mark Lopez, Russell Gersten, Kim Reuben, Charles Glenn, Peter
Schrag, and Michael Teitz for comments on organization and substance which improved this
analysis. Of course, any remaining errors or omissions are entirely mine.
Several of the classroom observations and interviews in schools in the Los Angeles area
in Spring 1999 were conducted by Carol Janes, a former teacher in the Los Angeles public
schools and professor of education at Loyola Marymount University. I am grateful for her
insight and expertise.
Finally, I am indebted to the Superintendents and Associate Superintendents, principals
and teachers who allowed me to observe their classes and interview them. They are poised and
polished professionals who seem to be not at all concerned about an outsider wandering into
their classroom unannounced and sitting in the back of the room taking notes. I have been doing
this for 25 years, first in connection with school desegregation litigation and now in connection
with bilingual education research, and I am enormously impressed by the openness of American
classrooms, and by the skill and talent of American teachers, particularly the Spanish bilingual
education teachers whose talent and skills span two languages. Indeed, I am grateful to all the
teachers I have observed, and administrators and teachers I have talked to, for what they have
taught me.

1
1. What is Bilingual Education?
Perhaps no other educational policy is as misunderstood and the subject of as much
venom and passion as bilingual education. Nowhere is this more evident than in California
which had a 26 year history of bilingual education that was supposed to end with the passage of
Proposition 227 on June 2, 1998. Proposition 227 required that all English Learners (EL)
participate in a “sheltered English immersion” program (AKA “immersion” or “structured
immersion”) in which nearly all instruction was in English, but with the curriculum and
presentation designed for children who are learning the language for a transition period “not
normally intended to exceed one year.” It was supposed to replace bilingual education, the
program which had been supported by the California Department of Education for two and a half
decades.
The characterization of bilingual education by its critics in California is epitomized by
Los Angeles Mayor Riordan’s comment before the Westchester Chamber of Commerce: "I know
of a few laboratory examples of bilingual education succeeding, but in the vast, vast majority of
schools it is a total failure," (Newton and Smith, Los Angeles Times, 1998).
Similarly, Article 1, 300 (d) of Proposition 227 stated
…the public schools of California currently do a poor job of educating immigrant children, wasting financial resources on costly experimental language programs whose failure over the past two decades is demonstrated by the current high drop-out rates and low English literacy levels of many immigrant children;2
The purpose of this report is to analyze this phenomenon. In doing so, I analyze 1)
California law on instruction for English Learners3 before and after Proposition 227, and the
2 The entire text of Proposition 227 is in Appendix A. 3 From 1972 until June 2, 1998, children learning English in California were designated limited-English-proficient or LEP. This is still the most common term in other states and in the federal government. In June 2, 1998, the term

2
interpretation of Proposition 227 by school districts; 2) the process by which a child is
designated English Learner, the characteristics of these students, and trends in the number of
students redesignated fluent-English-proficient; 3) bilingual education enrollment before and
after Proposition 227 and the characteristics of the students enrolled; 4) testing rates for all
English Learners and English Learners enrolled in bilingual education; and 5) the educational
impact of bilingual education in California and nationwide.
Data
The data used in this report come from the following sources: 1) the California State
Department of Education (CDE) database on California schools from 1981-82 through 2000-01,
2) classroom observations and interviews of teachers and principals and school documents they
gave me during these visits, and 3) scientific research studies conducted by myself and others.
Most of the quantitative data on English Learners and programs for them in California
schools was downloaded from the state department of education web site:
www.cde.ca.gov/demographics. In describing statewide trends, all schools were analyzed and no
sampling was done. The data on the number of English Learners tested on the statewide test,
SAT9, in reading were downloaded from the CDE web site: star.cde.ca.gov. Test scores by
program are available from the state web site http://www.eddataonline.com/research/ for Spring
1998 through Spring 2001, but the program category is definitely not reliable before Spring 2001
(and may not be reliable in that year either). In earlier years, the bilingual education category
includes English language programs. Because there is only one year of even potentially reliable
program data, this report does not contain analyses of achievement by program.
changed to English Learner in California because that is the term used in Proposition 227. The term English

3
I have observed more than 300 classrooms, and interviewed a smaller number of teachers
and principals, in California, Minnesota, New York City, and Massachusetts over the last decade
and a half. The California classrooms constitute more than half of the sample, and were
observed from Fall 1986 through Fall 2001.
The number of schools, classrooms, teachers, and administrators observed and
interviewed in California in the period after Proposition 227 is reported in Table 1.1. The
schools in Oceanside, Los Angeles, San Diego, and San Francisco were selected randomly from
among those with large numbers of Hispanic or Chinese English Learners. Across all eight
districts, 170 classrooms in 29 elementary and junior high schools were observed by myself or
my colleague Carol Janes.4
The total number of teachers and administrators interviewed is approximately 66
teachers, 39 building administrators, one superintendent, and one associate superintendent.5 In
general, teachers were interviewed only if they had some free time before or after the classroom
observations or school visit. At least one administrator, and sometimes two, was interviewed in
every school.
The interviews were open-ended and conversational and an example of the questions I
asked is shown in Appendix B. The administrators were asked to explain the implementation of
227 in their school, the effect it had on their school in terms of the number of students in
bilingual education, and the way in which waivered classrooms were created for each grade.
Teachers were asked these and other questions about their students and their instructional
Language Learner is increasingly being used in academia. In this report, I use the term English Learner to conform to current California legislation and regulations. 4 I personally observed 161 classrooms in Spring 1999 and September 2001. Carol Janes observed 12 classrooms in Spring 1999. 5 Los Angeles and Bay area school districts A and B are unnamed because they are so small that to name them would compromise the anonymity of the schools visited.

Table 1.1 Post-227 Classroom Observations and Interviews
Spring 1999 and Fall 2001 OBSERVATIONS INTERVIEWS Schools Classrooms Teachers Administratorsa 1999 2001 1999 2001 1999 2001 1999 2001 Oceanside 3 27 6 5 Los Angelesb 8 2 33 18 16 4 14 3 San Diegob 4 2 21 28 9 5 7 2 San Francisco 5 32 14 5 Bay Area District A 1 4 4 1 Bay Area District B 0 0 1 1 Los Angeles Area District A 4 7 7 0 Los Angeles Area District B 0 0 0 1 TOTAL 22 7 97 73 51 15 29 10 GRAND TOTAL 29 170 66 39 a Includes Superintendent, Assoc. Superintendent, Principal, Assistant Principal, Director or Coordinator of Bilingual Education, or Curriculum. b In Fall 2001, one of the schools in San Diego and one in Los Angeles were schools that had been previously visited in Spring 1999. These schools are counted again in the total.

4
approach and the effect of Proposition 227. Former bilingual education teachers who were
teaching in sheltered English immersion classrooms were asked which approach they preferred
and whether they would ever go back. Because the purpose of the interviewing was to obtain
information on the implementation of 227, not to evaluate teachers, I skipped questions that
would disrupt the logic or flow of what I was being told and I added questions in order to
understand what I was being told or observing. In addition, because the teacher interviews were
not scheduled and were taken from time that teachers could be doing other things, I tried to speed
things up by not writing everything down. I was looking for common themes or anomalies in
order to enhance my understanding of how Proposition 227 was implemented in these
classrooms.
The classroom observations and interviews are absolutely necessary if one is to
understand how programs are implemented and the biases in the quantitative data. 6 The
inclusion of native tongue instruction in the education of English Learners generates such
passion among supporters and critics and there is so little common vocabulary that few people,
including the teachers themselves, can be trusted to accurately describe these programs and their
effects. The classrooms observations are also helpful in understanding the large scale, empirical
analyses of data. Both approaches are necessary to understand the whole picture, and this report
contains both.
Programs for English Learners
During the last two and a half decades in California and the rest of the U.S., there have been
three very different instructional programs for limited English-proficient students or English
6 The case study approach to theory building has a long tradition in the social sciences. Explanations of this approach can be found in Miles and Huberman, 1995; Yin, 1994; and Huberman and Miles, 1984, among others.

5
Learners: 1) regular mainstream classroom instruction with English as a Second Language (ESL)
instruction in a pullout setting; 2) structured immersion—all English instruction in a self-contained
classroom consisting only of second language learners, and 3) native tongue instruction characterized
by initial literacy in the primary language and subject matter in the primary language with English
language instruction. All three programs have been called bilingual education by national, state and
local administrators, legislators, reporters, and educators, although only the last one actually is
bilingual education.
The state tries to bring some order to this chaos by conducting an annual Language Census
on the program enrollment of LEP or English Learner students. The instructions for the language
census (form R30-LC) are in Appendix C and the census form itself is in Appendix D for the year
2000-01.7 The census asks for the following data: number of English Learner (EL) students
(formerly known as limited-English-Proficient or LEP) and Fluent English-proficient (FEP) students
in California public schools (K-12) by grade and primary language other than English; number of
English Learners enrolled in specific instructional settings or services by type of setting or service;
number of students redesignated from English Learner to Fluent-English-Proficient from the prior
year; and the number of bilingual staff persons providing instructional services to English Learners
by primary language of instruction.
Thus, school administrators are asked to choose from among the program descriptions
offered by the state. It is not an easy task and within districts, the numbers for some programs
are somewhat erratic. For example, it appears that school district administrators placed ESL
programs in any one of the five Language Census program definitions shown below that refer to
the language of instruction being English, although category 00 (English Language
Development) would seem to be the most appropriate:
7 The current year’s forms can be found on the department web site at www.cde.ca.gov/demographics.

6
• (00) English Language Development (ELD) is English language instruction appropriate for the student’s identified level of language proficiency. It is consistently implemented and designed to promote second language acquisition of listening, speaking, reading, and writing.
• (01) ELD and Specially Designed Academic Instruction in English (SDAIE)
is ELD and at a minimum two academic subjects taught through SDAIE.
• (02) ELD and SDAIE with Primary Language Support is ELD and SDAIE with Primary Language Support (L1 support) in at least two academic subject areas. L1 support does not take the place of academic instruction through the primary language but may be used to clarify meaning and facilitate comprehension of academic content taught mainly through English.
• (04) Instructional Services Other than those Defined in 00-03 (prior to
Proposition 227, this category was called Withdrawn from all Services) • (05) Not Receiving Any English Learner Services means no specialized
instructional services for English Learners.
Category 01, ELD and Specially Designed Academic Instruction in English (SDAIE), is
close to what is called structured immersion in the academic literature and sheltered English
immersion in Proposition 227. Structured immersion, or sheltered English immersion, is all-
English instruction in a self-contained classroom containing only English Learners. The teacher
teaches in English, but at a level the student can understand. At the secondary level, these
programs are sometimes called sheltered classes.
The definition of bilingual education in the language census is shown below.
• (03) ELD and Academic Subjects Through the Primary Language (L1) is EL students receiving ELD and, at a minimum, two academic subjects through the primary language (L1). L1 instruction is (1) for Kindergarten – grade 6, primary language instruction provided, at a minimum, in language arts (including reading and writing) and mathematics, science, or social science; or (2) for grades 7-12, primary language instruction provided, at a minimum, in two academic subjects required for grade promotion or graduation. The curriculum should be equivalent to that provided to FEP and English-only students. These students may also be receiving SDAIE as described above. L1 instruction should be provided by teachers with a CTC bilingual authorization or in training for a CTC bilingual authorization.

7
In 1997-98, according to the Language Census, 11 percent of the programs were
classified as ELD, 12 percent as SDAIE, and 22 percent as SDAIE with L1 support. Altogether,
55 percent of English Learners were in programs that used English as the language of instruction,
but provided some extra help, 12 percent of English Learners were in some other kind of English
language program or no program at all, and 29 percent were in bilingual education.
But these statistics probably overestimate bilingual education enrollment. Although the
state distinguishes between these different techniques and their language of instruction, the
school districts do not consistently follow them. Prior to Proposition 227, structured immersion
was often called “bilingual” education, and ESL pullout was occasionally called “bilingual”
education, even though both are taught entirely or almost entirely in English.
Structured immersion is typically called bilingual education by school systems if the
teacher is bilingual, the students are in a self-contained classroom separate from fluent English
speakers, and the classes are formed with the declared intent (although not actual
implementation) of providing native tongue instruction. In some of these classrooms there may
be some instruction in a non-English language as an enrichment, but it is not a means of subject
matter instruction nor of acquiring literacy. The Chinese bilingual education classes, for
example, are actually structured immersion, even when some Mandarin is taught as an
enrichment.8
Occasionally ESL pullout programs are also called bilingual education if the students
receiving the ESL instruction are from the same language background and the teacher is
8 I have been in numerous Chinese bilingual education classes across the U.S. which included the teaching of Mandarin for a few hours a week. Many people would argue that this justifies calling the program bilingual education, although Mandarin might be the language of only one or two of the ethnically Chinese English Learners in the program. I would argue that since Mandarin is not the native tongue or primary language of the students it is being taught to, it is not bilingual education according to the theory. Even if it were the language of all the students, it is still not being taught according to the theory because the students learn to read and write initially in English and then receive some Mandarin instruction as an enrichment after having attained literacy in the second language.

8
bilingual. The fact that these so-called bilingual education classrooms are actually taught in
English is ignored by the administrators, the policymakers, the parents, and the advocates of
bilingual education—indeed, the latter passionately deny it. The advocates apparently see a
political advantage in casting as wide a net as possible to include many different types of
programs under the label bilingual education.
By contrast, I define bilingual education as native tongue instruction with initial literacy
in the primary language and subject matter in the primary language. English is taught as a
subject, for about an hour a day initially. The amount of English is typically increased over time,
but students are not supposed to be transitioned completely to English until they have mastered
native tongue literacy.
I define bilingual education this way because this is the program described in the
facilitation theory that is the foundation of bilingual education (Cummins 1980a, 1980b). The
facilitation theory has two parts: 1) the "threshold" hypothesis which states that there is a
threshold level of linguistic competence in the first language which a bilingual child must attain
in order to avoid cognitive disadvantages, and 2) the "developmental interdependence"
hypothesis that states that the development of skills in a second language is facilitated by skills
already developed in the first language. According to this theory, children must learn to read and
write in their native tongue, and learn subject matter in their native tongue. They only begin
English (second language) literacy after they have mastered native tongue literacy. If a
“bilingual education” program does not follow this process, it is not implementing the rationale
for native tongue literacy and the child is not supposed to benefit from the program. Therefore,
the program is not “true bilingual education” or “bilingual education according to the theory.”

9
California Law
The state of California adopted the definition found in the theoretical literature more than
25 years ago. Chapter 5.7, the Bilingual Education Act of 1972, defined bilingual education as
“the use of two languages, one of which is English, as a means of instruction in any subject or course. It is a means of instruction in which concepts and information are introduced in the dominant language of the student and reinforced in the second language. It recognizes that teaching of language skills is most meaningful and effective when presented in the context of an appreciation of cultural differences and similarities.9
The 1976 Chacon-Moscone Act divided bilingual education into “basic bilingual
education,” defined as:
(a) … a system of instruction which builds upon the language skills of the pupil and which consists of, but is not limited to, all of the following:
(1) A structured English language development component with daily instruction leading to the acquisition of English language proficiency, including English reading and writing skills.
(2) A structured primary language component with daily basic skills instruction in the primary language for the purposes of sustaining achievement in basic subject areas until the transfer to English is made. As the pupil develops English language skills, the amount of instruction offered through English shall increase,
and “bilingual-bicultural education,” defined as (b) a system of instruction which uses two languages, one of which is English, as a
means of instruction. It is a means of instruction which builds upon and expands the existing language skills of each participating pupil, which will enable the pupil to achieve competency in both languages. This instruction shall include all of the following:
(1) Daily instruction in English language development which shall include: (A) Listening and speaking skills. (B) Reading and writing skills; formal instruction in reading and writing of
English shall be introduced when appropriate criteria are met (emphasis added).
(2) Language development in the pupil’s primary language (emphasis added).
9 Section 5761.2 (a) of The Bilingual Education Act of 1972. Funding for bilingual education programs was to be given to school districts that were willing to write a project proposal explaining their goals and how they would implement and evaluate the program. The 1972 act was voluntary and school districts needed to comply only if they wanted the small amount of money appropriated for bilingual education programs. For the 1972-73 year, one million dollars was appropriated. This increased to four million in 1973-74.
10
(3) Reading in the pupil’s primary language (emphasis added). (4) Selected subjects taught in the pupil’s primary language (emphasis added). (5) Development of an understanding of the history and culture of California and the
United States, as well as an understanding of customs and values of the cultures associated with the languages being taught.
Thus, the state required California school districts to adopt what I call “true bilingual
education” or “bilingual education according to the theory.” The annual language census also
defined bilingual education according to the theory. School districts, however, typically used a
broader definition than the state, as evidenced by district materials describing their programs for
English Learners, public statements appearing in newspapers, and private statements made to me
over the last decade and half about their programs.
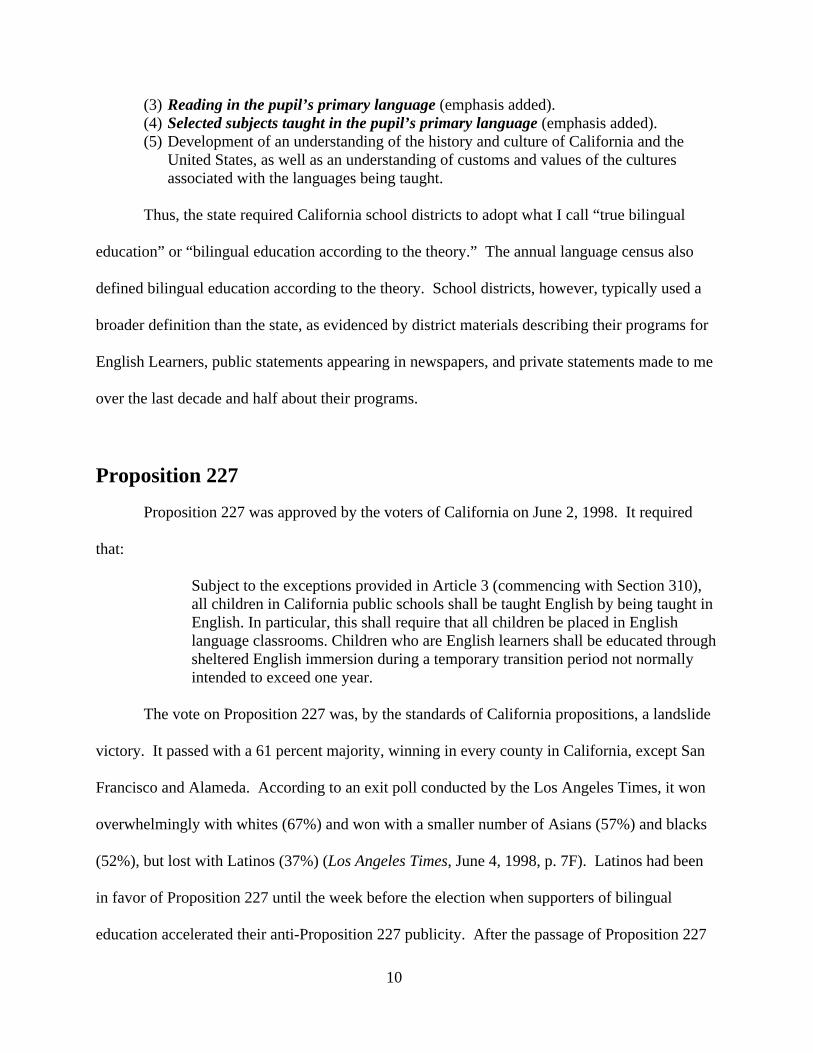
Proposition 227
Proposition 227 was approved by the voters of California on June 2, 1998. It required
that:
Subject to the exceptions provided in Article 3 (commencing with Section 310), all children in California public schools shall be taught English by being taught in English. In particular, this shall require that all children be placed in English language classrooms. Children who are English learners shall be educated through sheltered English immersion during a temporary transition period not normally intended to exceed one year.
The vote on Proposition 227 was, by the standards of California propositions, a landslide
victory. It passed with a 61 percent majority, winning in every county in California, except San
Francisco and Alameda. According to an exit poll conducted by the Los Angeles Times, it won
overwhelmingly with whites (67%) and won with a smaller number of Asians (57%) and blacks
(52%), but lost with Latinos (37%) (Los Angeles Times, June 4, 1998, p. 7F). Latinos had been
in favor of Proposition 227 until the week before the election when supporters of bilingual
education accelerated their anti-Proposition 227 publicity. After the passage of Proposition 227

11
on June 2, students in a number of high schools boycotted or threatened to boycott classes.
Educational leaders urged calm and compliance.
The Los Angeles Times recommended a “no” vote on Proposition 227 on the grounds
that bilingual education was not perfect, but 227 was worse. Others saw the end of bilingual
education as nothing short of an educational calamity of gargantuan proportions.
Illustrative of this perspective is the following letter to the editor: “Proposition 227’s
plan of a one-year "crash course" of "sheltered English immersion" for English learners is based
on ignorance of linguistics, ignorance of second-language acquisition research and, most
important, ignorance of what actually takes place in a classroom of English-learning students.
(letter to the editor, Los Angeles Times, John Espinoza, Teacher, May 30, 1998, B-7).
In fact, there seems to have been widespread ignorance on the part of both supporters and
advocates of bilingual education of the fact that most English Learners were not in bilingual
education. On the other hand, although only 29 percent of all English Learners and 39 percent of
elementary school English Learners were in bilingual education across the state, Proposition 227
was certainly a shock to the school districts that actually had true bilingual education programs.
On July 23, 1998 the state board issued emergency regulations to guide school districts in
implementing Proposition 227. These regulations remained in effect until November 1998, when
the Office of Administrative Law approved them as permanent (de Cos, 1999). What was new
for California school districts was obviously not the English instruction for English Learners, but
the prohibition against bilingual education and the imposition of a one year time limit for a
student to be in a self-contained classroom.
Although the term “sheltered English immersion” was coined by the co-chairmen of the
initiative, Ron Unz and Gloria Matta Tuchman, the concept had been practiced throughout

12
California for more than a decade under the label SDAIE (Specially Designed Academic
Instruction in English), Cantonese bilingual education, Vietnamese bilingual education, sheltered
English, sheltered U.S. History, sheltered Biology, etc., and in Canada under the term “French
Total Immersion,” or “French Early Immersion.” Yet, a survey of school districts conducted by
the State Department of Education (Kitchen 1999) found that many districts reported a need for
model programs and effective curricula for implementing the structured English immersion
program, despite the decades of experience with very similar programs, albeit with different
labels.
Bilingual education is not entirely forbidden by Proposition 227. Parents or guardians
may request a waiver for their child to enroll in an alternative course of study where they are
“taught English and other subjects through bilingual education techniques or other generally
recognized educational methodologies permitted by law.” This was only allowed, however, after
the child had been in an English language classroom for 30 days10 and parents had personally
visited the school to request the waiver. The initiative also appropriates $50 million annually for
10 years to provide English language instruction to adults who pledge to tutor school-age
children in English. The tutoring provision was added in order to abide by the rule that
initiatives must have only one subject. Unz himself simply wanted the state to help parents of
English Learners learn English.11
Legal Challenges
10 According to Kitchen (1999), the CDE legal office has reviewed EC 305, 310, and 311 and concluded that placement in a structured English immersion needs to take place for 30 days only the first year that a parent submits a waiver for bilingual education. However, the parents must personally appear at the school each year to sign a waiver. This is expected to be codified by new proposed Board regulations of February 2002. 11 Personal communication with Ron Unz, Spring 1998.

13
When Proposition 227 passed on June 2, it was immediately challenged in court. The
state school board, Governor Wilson and state Superintendent of Public Instruction Delaine
Eastin were named as defendants in a lawsuit filed in U.S. District Court in San Francisco by the
Mexican-American Legal Defense and Educational Fund, the National Council of la Raza, the
Southern Christian Leadership Conference, the American Civil Liberties Union and groups
representing Asian Americans.12 The lawsuit sought an immediate injunction to block
implementation of Proposition 227 in September 1998, claiming that the initiative violated the
civil rights of 1.4 million California children who were not fluent in English, and citing
Castañeda and a score of other court decisions and federal laws on the civil rights violation.
The state school board refused to consider any waiver requests from school districts
wishing to maintain their bilingual education programs. Although the state board has the power
to grant waivers from state laws, the legislative counsel argued that doing so would effectively
repeal the general intent of Proposition 227 since if the waivers were given for two consecutive
years, school districts would not have to reapply for a waiver. A child could then be in a
structured English immersion program for more than a year, in contradiction of the voters’
wishes. In addition, the California Constitution states that unless an initiative specifically allows
the legislature to amend or repeal a law, only the voters may do so. In the case of Proposition
227, the initiative itself states that the Legislature may amend it only to the extent that the
amendment furthers the purposes of Proposition 227 and only by a 2/3 vote plus the Governor’s
approval.
12 Valeria G., et al v. Wilson, et al. (C98-2252Cal) filed in U.S. District Court, Northern District of California.

14
Three school districts, Berkeley, Oakland, and Hayward objected to the state board's
refusal to hear waiver requests and filed suit on this issue.13 The California Superior Court sided
with the school districts, but the appeals court overturned this and was upheld by the California
Supreme Court in December of 1999. As it currently stands, only individual parents, not school
districts, can obtain waivers from Proposition 227. If the State Board’s proposed regulations of
February 2002 are approved by them when they come up for a vote, the group that can request
waivers will expand to include teachers.
On July 15, 1999, U.S. District Court Judge Charles Legge ruled that Proposition 227
was constitutional because it was based on a sound educational theory supported by at least some
experts in the field. This opinion was upheld by the Ninth Circuit Court of Appeals on July 31,
1998. Also on July 31, 1998, in a separate lawsuit, southern federal district court Judge Lourdes
Gillespie Baird of Los Angeles ordered the immediate implementation of the initiative in Los
Angeles Unified.
In December 1998, a consortium of education groups filed another lawsuit alleging that
Proposition 227 was unconstitutionally vague because it required a program that was not
specified in detail, yet in Article 5, school board members, other elected officials, administrators,
and teachers were held legally accountable for implementing it.14 This group also lost in federal
district court. Thus, to date all statewide legal challenges to Proposition 227 have failed.
Although Los Angeles Unified lost its challenge, two other school districts succeeded.
San Jose Unified was able to get a federal district court to agree that they did not have to
implement Proposition 227 because it violated their 1994 court approved consent decree,
13 Berkeley, Oakland, and Hayward Unified School Districts v. State Board of Education (8008105) filed in Alameda Superior Court. 14 California Teachers Association et al. v. Wilson et al. (9896ER (CWx)) filed in U.S. District Court for the central district of California.

15
Vasquez v. San Jose Unified, requiring bilingual education. San Francisco Unified also
interpreted Proposition 227 as being in conflict with their court order, in their case a 1975
consent decree, Lau v. Nichols, which ordered bilingual education for Chinese, Filipino, and
Spanish English Learners. Unlike San Jose, however, they did not get a court ruling on their
interpretation. So far no one has challenged their position.
How School Districts Interpreted Proposition 227
Tables 1.2 and 1.3 compare excerpts from the original Proposition 227 legislation, the
entire text of which is in Appendix A, to interpretations of the legislation in three important
school districts in California: Los Angeles Unified, San Diego Unified, and San Francisco
Unified. These interpretations come from the guidelines handed out to the principals in each
school district. Los Angeles and San Diego are the two largest school districts in California and
San Francisco is the fifth largest. Together they enroll 23 percent of the English Learners and 13
percent of all the public school students in the state.
These school districts are also representative of the ethnic makeup of the English Learner
population in California. Figure 1.1 shows the percentage of English Learners who are Spanish
speaking and Vietnamese speaking (the second largest English Learner population) in Los
Angeles, San Diego, San Francisco, and the entire state. As shown, the percentage of English
Learners who are Spanish and Vietnamese speaking has increased only slightly over the last
decade in California and the three major school districts. San Francisco has the smallest Spanish
speaking English Learner population with only 39 percent of their English Learner population
being Spanish speaking. Los Angeles has the highest with 93 percent of their English Learner
population being Spanish speaking. San Diego is in-between at 79 percent. All three districts

16
are similar to the state in having less than five percent Vietnamese, the second largest English
Learner population in the state.
The first and most important issue school districts had to deal with in constructing a
programmatic response to Proposition 227 was designing a structured English immersion
program. All three school districts, Los Angeles, San Diego, and San Francisco, interpreted
Proposition 227 as allowing the assignment of English Learners to a regular classroom with extra
help such as ESL pullout or tutoring. As shown in Table 1.2, this was called Model A in Los
Angeles, Structured English Immersion in San Diego, and English Only in San Francisco.
Depending on the size of the school’s total English Learner population and the philosophy of the
principal, this model could also be similar to a structured immersion classroom if it consisted
only of second language learners. In general, however, the school district’s implementation
guidelines to principals, and the principals I talked to, seemed primarily concerned with the
language of instruction, not the organization of the school or composition of the classrooms.
They felt they were in compliance with Proposition 227 whether English Learners were in
mainstream classrooms or special self-contained structured immersion classrooms, so long as the
language of instruction was English.
District administrators in Los Angeles and San Diego also felt that a self-contained
classroom with up to 30 percent of instruction in the primary language was in compliance with
the requirement to have “nearly all” classroom instruction in English. In both school districts,
district administrators recommended that students who were assigned to bilingual education in
the 1998-99 school year before Proposition 227 was passed should be assigned to 30 percent
native tongue classes in order to smooth the transition from bilingual education to structured

Table 1.2 Interpretations of Proposition 227 Requirement for Structured Immersion
in Los Angeles, San Diego, and San Francisco 1998-1999
PROPOSITION 227 LOS ANGELES SAN DIEGO SAN FRANCISCO Sheltered English immersion" or "structured English immersion" means an English language acquisition process for young children in which nearly all classroom instruction is in English, but with the curriculum and presentation designed for children who are learning the language.
Model B Structured English Immersion: This model provides instruction primarily in English. Students will be taught English language skills in English. Students will be taught subjects using special methods in English combined with primary language instructional support.
English Language Immersion: “Because true language immersion is an additive program where students do not lose their proficiency in their native language, students will be instructed through their native language for a maximum of 30% of the school day. One half of the literacy period will be dedicated to literacy and other activities taught through the native language” …NOTE: Schools with bilingual programs previously should implement this model during the 30 day period.
English Only: English Language Development and content classes taught using ESL and SDAIE methodologies. Exceeds criteria for Code 300 Et Seq. (Structured English Immersion).
Model A: Structured English Immersion: This model provides instruction in English. Students will be taught English language skills in English. Students will be taught subjects using special methods in English, with primary language used for clarification, as needed.
Structured English Immersion: …”instructed through English language immersion for all, or almost all, of the school day.” NOTE: Schools that have English learners of mixed language groups and that have previously implemented Sheltered English programs should implement this model.
SECONDARY SCHOOLS can meet the same requirements if the classes in which the English learner is enrolled do not exceed two classes in the language other than English.

Table 1.3 Interpretations of Informed Consent and Circumstances Justifying Parental Waiver of Proposition 227
in Los Angeles, San Diego, and San Francisco, 1998-99
PROP. 227 LOS ANGELES SAN DIEGO SAN FRANCISCO INFORMED CONSENT Parents or legal guardian [must] personally visit the school to apply for the waiver..
Parents must visit school to sign waiver. Hardship cases may mail form.
If it is a hardship to visit school, parents can mail in a parent hardship form.
Parents do not have to visit school.
CIRCUMSTANCES OF CHILD (a) Children who already know English…; (b) Older children…; or (c) Children with special needs: the child already has been placed for a period of not less than thirty days during that school year in an English language classroom and it is subsequently the informed belief of the school principal and educational staff that the child has such special physical, emotional, psychological, or educational needs that an alternate course of educational study would be better suited to the child's overall educational development. A written description of these special needs must be provided.
30 days in Model A, Model B, or mainstream during which time schools hold parent meetings. Schools recommend bilingual program for some students.
30 days in structured English immersion, English language immersion, or mainstream during which time schools hold parent meetings. Schools recommend bilingual program for some students and parents visit school to sign waiver.
It is not necessary to place an LEP child in an English language classroom for 30 days before assigning to bilingual education because the “Lau Consent Decree orders bilingual education.” Assignment to bilingual education, however, must be approved by parent in form mailed to district. Choices on the form are types of bilingual education.

Figure 1.1Percentage of English Learners who are Spanish or Vietnamese Speakers in Los Angeles
Unified, San Diego City Unified, and San Francisco Unified and the State, 1989-90 to 2000-01
0%
5%
10%
15%
20%
25%
30%
35%
40%
45%
50%
55%
60%
65%
70%
75%
80%
85%
90%
95%
100%
89-90 90-91 91-92 92-93 93-94 94-95 95-96 96-97 97-98 98-99 99-00 00-01
State Spanish
L.A. Spanish
S.D. Spanish
S.F. Spanish
State Vietnamese
L.A. Vietnamese
S.D. Vietnamese
S.F. Vietnamese
Vietnamese Speakers
S.F.
S.D.
State
L.A.

17
immersion. Since San Francisco was not implementing Proposition 227, it did not have this 30
percent native tongue model.
Despite the fact that San Diego has a superintendent who purportedly supports sheltered
English immersion, its interpretation and practice comes closest to subverting the intent of the
law. Spanish speaking English Learners are being taught to read and write in Spanish in San
Diego schools. Indeed, in my visits to two San Diego schools in September 2001, I discovered
that kindergarten Spanish speaking English learners who had just entered school and knew no
English were being assigned to classrooms called “waivered bilingual” during the first 30 days
and were being instructed virtually entirely in Spanish during this time period in violation of the
law. At one elementary school visited in 2001, I asked a teacher who was teaching in Spanish in
the afternoon why she was not following the schedule that showed that this time period was for
English. I was told that she had not covered all the Spanish learning activities she had planned
for the morning and so they were finishing them in the afternoon. At least that day, there would
be no English instruction for her students, again in violation of the law.
Only San Diego had an explicit policy at the secondary level. A secondary program
would be in compliance if no more than two classes were in the native tongue. However, the
secondary schools I visited in San Diego were not able to offer more than one class in Spanish.
One junior high school with a large Spanish speaking English Learner population had no classes
in Spanish.
After one month in an English language classroom, the parents of English Learners could
obtain a waiver to enroll their child in bilingual education. Individual schools in which 20
students or more of a given grade level received a waiver must offer bilingual education or
“other generally recognized educational methodologies permitted by law” or allow students to

18
transfer to another public school in order to enroll them in bilingual education or “other generally
recognized educational methodologies permitted by law.”
Table 1.3 shows varying interpretations of the requirement for parents to personally visit
the school and the circumstances justifying a parental waiver to enroll a child in an alternate
course of study, which in most cases was bilingual education. Although San Francisco did not
require parental visits since it was not implementing 227, it did require parents to mail in a form
approving their child’s assignment to bilingual education. Los Angeles and San Diego seem to
have followed the letter of the law, although they both allowed hardship cases to mail in their
waiver requests.
In San Francisco, students recommended for bilingual education in 1998-99 were
immediately assigned to such a program without the 30 day waiting period. Los Angeles, San
Diego, and other school districts followed the law as they interpreted it. Despite the fact that San
Diego Unified has a superintendent who purportedly supports sheltered English immersion, San
Diego is closer to the traditional bilingual education model than is Los Angeles.
Proposition 227 allowed parental waivers to enroll a child in an alternate course of study
for the following children:
a) children who already know English b) older children c) children with special needs
• who had been placed in an English language classroom for at least 30 days and • whose special physical, emotional, psychological, or educational needs had been
documented by the school principal and educational staff • who believed “an alternative course of educational study” would better suit the
child’s “overall educational development.” Although Proposition 227 indicates a special need must be carefully documented before a
child can be waivered, the school districts I visited required only that school staff recommend the
waiver and that the parents consent. On the other hand, according to Kitchen (1999), 32 percent

19
of school districts reported that they did not inform parents of their right to request a waiver.
These were typically school districts with a low number of English Learners where it would not
have been possible to form a bilingual education class even if a parent had signed a waiver.
Gandara, et al. (2000) also reports widely varying interpretations of the legal
requirements of Proposition 227 among the 16 school districts in their sample, although they
provide no systematic listing of these interpretations. Interestingly, Oceanside which has
received considerable publicity over its alleged improved test scores, has been singled out by the
state as a district that did not comply with Proposition 227.
The complaint against Oceanside was brought in July 1999 by Deborah Escobedo, an
attorney for the Multicultural Education Training and Assistance, Inc. (META), a pro-bilingual
education advocacy group. After a year’s investigation, the California Department of Education
released its report (CDE, 2000) finding Oceanside guilty of 10 violations of state law:
1. Failure to establish site and district-wide LEP Parent Advisory Committee; 2. Failure to provide services to LEP Children in accordance with state law to ensure
that they are acquiring English language proficiency and recouping any academic deficits, which may have been incurred in other areas of the core curriculum. (Ed. Code Sections 305, 306, 62002, and 5 CCR Section 11302);
3. Failure to establish educationally sound and consistent criteria to determine when an LEP student has achieved a “good working knowledge of English” or a “reasonable fluency in English.” (Ed. Code Sections 305 and 306, 5 CCR Section 11302);
4. Failure to establish a plan that describes how any academic deficits will be monitored and overcome or to ensure that actions to overcome academic deficits are taken before deficits become irreparable. (Ed. Code Sections 305, 306, 62002, and 5 CCR Section 11302);
5. Failure to ensure that parents were timely and properly informed of the placement of their child in a structured immersion program and of the opportunity to apply for a parental exception waiver. (Ed. Code Sections 310, 311, and 5 CCR Section 11303);
6. Failure to provide a timely and full written description of the structured immersion program and different educational program choices (to the extent they exist) and all educational opportunities offered and a full description of the educational materials to be used in the different options. (Rd. Code Sections 310, 311, and 5 CCR Section 11303);
7. Failure to establish alternative programs as mandated by Ed. Code Sections 310, 311, and 5 CCR Section 11303);
20
8. Failure to timely establish criteria and procedures for granting parental exception waivers. (Education Code Sections 310 and 311);
9. Failure to grant waivers to children for whom an alternative course of educational study would be better suited for their overall educational development. (Ed. Code Sections 310, 311, and 5 CCR Section 11303); and
10. Failure to provide alternative programs even in those few instances (5 out of 154 requests) when a waiver was granted; (Ed. Code Sections 310, 311, and 5 CCR Section11303).
Given the vagueness of state law and regulations, however, there are probably many
school districts that could be found guilty of these violations. On the issue of parental
notification of their right to a waiver, the state acknowledged that Oceanside did notify parents of
their right to a waiver and that the district had guidelines for doing so, but in the opinion of the
CDE this was not done in a “clear” or “timely” manner (CDE: 20).
Proposition 227 does not require that school districts notify parents of their right to a
waiver. It says only that:
The requirements of Section 305 may [emphasis added] be waived with the prior written informed consent, to be provided annually, of the child’s parents or legal guardian under the circumstances specified below and in Section 311.
The requirement to notify parents of their right to a waiver from 227 was added by the
State Board of Education in their July 23, 1998 Emergency Regulations. Indeed, the State Board
requirements are quite lengthy and complicated and take up a page and a half of the Emergency
Regulations. It is the State Board regulations by which Oceanside was judged.
The CDE also faulted Oceanside because “although teachers and parents who were
interviewed by the CDE reported that many students needed bilingual instruction, only five
percent (5%) of 144 waiver applications submitted by parents were approved” (CDE: 21). In
addition, parents provided evidence to CDE that these children were not doing well academically
(CDE: 22). If this is the standard, most school districts in California with English Learners are
vulnerable to being found in violation of state law since, as explained below, English Learners

21
are, by definition, low achievers. Indeed, the document is general enough that its allegations
could be applied to most school districts with substantial numbers of English Learners and few
students in bilingual education.
In response to these allegations, Oceanside is currently undergoing a process called
Comite, that was originally established in 1987 as a result of a court decision called Comite De
Padres De Familia v. Honig (1987) 192 Cal.App.3d 528. That court order required that the
California Department of Education monitor the implementation of state legislation and
regulations. Oceanside is undergoing this process which involves an in-depth self-study, CDE
observation, training, and on-site visits, and compliance documentation. The process does not
end until Oceanside can provide substantial compliance. It is ironic that one of the few school
districts implementing the most important aspect of Proposition 227—that English Learners be
educated in a sheltered English immersion classroom—is under surveillance while school
districts, such as San Diego, with important violations of this requirement of Proposition 227 are
ignored by the CDE.
The Time Limit in a Self-Contained Classroom
One of the most controversial aspects of Proposition 227 has been the one year limit on
being in a self-contained program. As shown in Table 1.4, the state board of education
essentially rewrote this part of Proposition 227. Although Proposition 227 stated that enrollment
in a structured immersion classrooms was for a “temporary transition period” not normally to
exceed one year, the state board unilaterally lifted the one year limitation by stating that students

Table 1.4 Interpretations of Definition of English Learner and Time Period of Sheltered English Immersion Program in
Emergency State Board Regulations (10/98), Los Angeles, San Diego and San Francisco, 1998-99
PROP. 227 STATE BOARD 10/98 LOS ANGELES SAN DIEGO SAN FRANCISCO TIME PERIOD OF SHELTERED ENGLISH IMMERSION PROGRAM a temporary transition period not normally intended to exceed one year… Once English learners have acquired a good working knowledge of English, they shall be transferred to English language mainstream classrooms.
11301(c) An English learner may be re-enrolled in a structured English immersion program not normally intended to exceed one year if the pupil has not achieved a reasonable level of English proficiency as defined in Section 11301(a) unless the parents or guardians of the pupil object to the extended placement
Students who are not able to achieve reasonable fluency (ELD level 5) within one year of structured English immersion will take more time and, with parent consent, will receive an additional year of structured English immersion.
Proposition 227 requires all English learners to receive “Sheltered English Immersion” for at least one year. If the student does not develop a good working knowledge of English by the end of that year, the student, with yearly parental approval, may continue receiving that instruction.
…an intensive English program for at least one year
DEFINITION OF ENGLISH LANGUAGE LEARNER "English learner" means a child who does not speak English or whose native language is not English and who is not currently able to perform ordinary classroom work in English, also known as a Limited English Proficiency or LEP child
…as measured by any of the state-designated assessments approved by the California Department of Education, or any locally developed assessments.
NEP or LEP scores on PRE-LAS, LAS or BINL; remain LEP if below 36th percentile on a standardized norm-referenced test of reading and language; or NEP or LEP on LAS-O
NEP or LEP score on LAS I English (oral) proficiency test and LAS Literacy; remain LEP if below 36th percentile on CTBS in reading and math; below C on report card in core courses; below advanced or transitional on LALAR; below level 3 on writing assessment

Table 1.5 State Board of Education Proposed Regulations Regarding the 30 Day Time Period
and Who Can Initiate Waivers, February 2002
PROP. 227 STATE BOARD Children with special needs: the child already has been placed for a period of not less than thirty days during that school year in an English language classroom
11309 [formerly 11303] (c) (2) …Once a waiver has been granted and a pupil has been enrolled in an alternative program, the pupil does not have to be placed in an English language classroom for another 30-day period in subsequent years, as long as the pupil is enrolled in the alternative program. The waiver must be renewed on a yearly basis.
The requirements of Section 305 may be waived with the prior written informed consent, to be provided annually, of the child’s parents or legal guardian under the circumstances specified below and in Section 311. Such informed consent shall require that said parents or legal guardian personally visit the school to apply for the waiver and that they there be provided a full description of the educational materials to be used in the different educational program choices and all the educational opportunities available to the child.
11309 © (4) Pursuant to Education Code sections 311(b) and (c), the school principal and educational staff may initiate a waiver request or they may recommend a waiver to a parent. Parents and guardians must be informed in writing of any waiver request for an alternative program initiated by the school principal and educational staff and must be given notice of their right to refuse to agree to the waiver.

22
may be re-enrolled in a structured English immersion program …if the student has not achieved
a reasonable level of English proficiency.
The proposed regulations that failed to pass on May 30, 2002 were, as shown in Table
1.5, merely a codification of the CDE legal staff’s interpretation that English Learners who
receive a waiver and are placed in an alternative program only need to be in a 30 day English
program the first time they enter school. Proposition 227, however, states that this must be done
during that school year which implies each school year, although it is not as clear as it could be.
The threat of a lawsuit from Ron Unz is credited with the ultimate defeat of the proposed
regulations (Associated Press, 2002). Nevertheless, the practice that these regulations were to
codify is expected to continue—English Learners are only required to be an English language
classroom the first year they enroll in school—despite what Proposition 227 seems to say.
The state board’s proposed 2002 regulations would also have allowed principals and
educational staff to initiate waivers, in addition to parents. As discussed below, this has in fact
been common practice. Proposition 227, however, specifically gave only parents the right to
initiate waivers. Although the proposed regulations were defeated, the practice continues.
Thus, the law has been dramatically changed by administrative fiat and apparently
without protest. Los Angeles, San Diego, and San Francisco have followed the board’s lead and
instructed their principals that the one-year limit in a self-contained classroom is a minimum, not
a maximum. Furthermore, whereas Proposition 227 eschewed tests and defined an “English
learner” as someone “who is not currently able to perform ordinary classroom work in English,”
the State Board of Education has unilaterally changed the standard for defining a child as an
English Learner to “as measured by any of the state-designated assessments approved by the
California Department of Education, or any locally developed assessments.”

23
The State Department of Education has also recently made it harder for a child to be
reclassified from English Learner to Fluent English Proficient, not easier (if the school districts
actually follow their recommendations). Whereas prior to Proposition 227 a typical standard for
reclassifying a child was the 36th percentile, according to the 2000-2001 Coordinated
Compliance Review Training Guide, it is now
Each former English learner (EL) who has been redesignated fluent English proficient (FEP) has demonstrated English-language proficiency comparable to that of the average [emphasis added] native English speakers and can participate equally with average native speakers in the school’s regular instructional program (California Department of Education, 1999, Sec. I-EL1, p.156.) This means the standard for fluent English speaking is higher for English Learners than it
is for native English speakers. Only half of all native English speakers in a school will be at or
above their average in the school, but the state is requiring all English Learners to be above that
average before they can be considered fluent English speaking. In short, raising the
redesignation criteria as the state appears to be doing will make redesignation rates decline even
if nothing else changed.

24
2. Designating a Child Limited-English-Proficient or English Learner
Not only is there confusion and disagreement over what bilingual education is, what
structured English immersion is, and what Proposition 227 requires, but there is confusion and
disagreement over what an LEP student, or English Learner, is. Children who come from a
home where a language other than English is spoken are language minority children. But, not
all language minority children are designated English Learners. School districts in California,
and every other state, establish a test score criterion to determine whether a child from a
language minority family is limited-English proficient or English Learner. Language minority
children who score above this criterion are designated English-Only or fluent English proficient.
It is only those language minority children who score below this criterion who are deemed to be
English Learners. In short, English Learners are, by definition, low scorers in English. If they
are not low scorers in English, they have been improperly classified. Once designated English
Learner, the same test score criterion determines whether they can be redesignated Fluent
English proficient (FEP).
This report addresses this issue because the basic process by which a child is designated
an English Learner, or redesignated Fluent English Proficient, did not change with the
implementation of Proposition 227. The only thing that has changed is that beginning May 14,
2001 all school districts will have to use the same English proficiency test, called the California
English Language Development Test (CELDT), to determine if a language minority child is an

25
English Learner. The test is published by CTB/McGraw Hill and is purported to be an
adaptation of the LAS test to the new California ELD standards.15
The public assessment of the success of bilingual education was often based on
redesignation rates that depended on the criterion chosen. The same thing has occurred with
Proposition 227. In a debate between Ron Unz and Catherine Snow, Unz cited redesignation
rates before Proposition 227 as an example of the failure of bilingual education and Snow
responded with statistics showing little improvement with Proposition 227 as of 1999-00.16
Neither of them seemed to care that statistics were being misused so long as they could be used
as ammunition in the battle.
The state has only added to the confusion. The CDE report on Oceanside faulted the
district for a declining redesignation rate:
Data available to the CDE (R-300LC) indicated that the number and percentage of English learners in Oceanside meeting the district criteria for redesignation has generally decreased from 1996-2000. Specifically, the percentage of English learners meeting district redesignation criteria for fluent English proficiency status dropped from 7.9% in 1996 to 4.1% in 2000 (CDE, 2000:30).
This drop could have occurred solely because the test changed or the criterion changed.
Because the state, other policymakers, and the public insist on misusing redesignation rates to
make judgments about program quality, it is important to understand the designation and
redesignation process in order to understand why such conclusions are often wrong.
15 Information on the testing program and ELD standards can be found at http://www.cde.ca.gov/statetests/eld/eld.html. 16 See Mary Ann Zehr, “California's English-Fluency Numbers Help Fuel Debate,” Education Week, December 5, 2001.

26
The Designation Process
The process of designating a student as limited-English-proficient is basically the same
throughout the United States, although the specific instruments used in the process vary from
school district to school district. The process is reducible to two steps: (1) a home language
survey is administered to all students to identify the pool of potential English Learners; and (2)
the students identified in the home language survey are tested on several measures of academic
performance in English, and sometimes in their native tongue, and classified accordingly.
The decision to exit a student from bilingual education or special language assistance
involves procedures similar to those used to determine eligibility. Students are redesignated
fluent English proficient (FEP) if they score at or above a certain score or percentile on an
English language test that has been normed on an English speaking population. The decision to
redesignate is tempered by either the child's classroom teacher or a team of professionals
employed by the school district.
The Home Language Survey
The home language survey is the first step in the process of identification of students as
English Learner. Parents are asked to respond to questions about the language the child first
spoke, the language(s) used in the home environment by the child to various family members and
to friends, and the languages used by people living in the home. Typically, if a parent’s answer
is a language other than English for any one of these questions, they are considered potentially
English Learner and referred for testing. The questions are intentionally broad because their goal
is to identify children who come from language minority backgrounds—that is, a home where a
language other than English is spoken, not children who are limited in English.

27
Norm-Referenced Tests
The over-inclusiveness of the home language survey would not be a problem if the
subsequent steps accurately identified who was not fluent in English. Unfortunately, they do not.
On the other hand, were it not for the home language survey, many fluent English speaking, and
even English monolingual, children would be designated English Learner by the tests that are
used.
Children identified by the home language survey must take a standardized test normed on
an English speaking population. The first norm referenced test they take is an English
proficiency test. If they fail the English proficiency test, they are then classified Limited English
Proficient or English Learner. If they pass the English proficiency test, they still have another
chance to be classified Limited English Proficient or English Learner. Most school districts
require a child who has passed an English proficiency test to take a standardized achievement
test of reading, language, and math in English. If they are Spanish speakers, they may also take
these tests in Spanish. These are the same tests English Learners will take later when being
evaluated for reclassification to fluent-English-speaking.
A point on the scale for the standardized achievement test, typically between the 20th and
the 50th percentile, or a specific ordinal score that is equivalent to a score in this range (e.g. 5 on
a scale of 1 to 10),is selected as the point at which a student is defined as an English Learner.
Across the entire norming population of English speakers, any criterion chosen will classify
children who are fluent in English as limited English proficient or English learners.
Until 1998-99, the California Code of Regulations required one of the following tests and
procedures of “proven validity and reliability”:

28
(i) norm referenced tests with cut-off scores of not less than the thirty-sixth percentile based on national norms [emphasis added] or on the distribution of scores derived from a representative pupil sample of nonminority English proficient students [emphasis added] of the same age and grade; or
(ii) norm referenced tests with cut-off scores between the thirty-first and thirty-fifth
percentile based on national norms [emphasis added] or on the distribution of scores derived from a representative pupil sample of nonminority English proficient students [emphasis added] of the same age and grade provided that the school or district’s language appraisal team, with the pupil’s parents’ or guardians’ agreement, judges the pupil to have English language skills necessary to succeed in an English only classroom.
(iii) in the case that the fiftieth percentile of the nonminority district population of the
local educational agency is lower than the thirty-sixth percentile of the national norm, the cut-off score shall be no lower than three percentile points below the local norm; or
(iv) standardized criterion referenced tests for basic skills assessment, including
curriculum mastery of language arts, reading, writing, and mathematics at grade level equivalent to nonminority pupils provided that such procedures are approved by the Department…(section 4307).
The regulations allowed school districts to override the test scores in redesignating
students if the student had been in a bilingual education program for at least three years and had
received English instruction for at least a year. There is no data on how many school districts
used this option.
Reliance on the test scores keeps redesignation rates low because it is not possible even
for all English proficient students to achieve the score that classifies them as fluent English
proficient. If the designation criterion is the 36th percentile, or its equivalent on an another scale,
across all districts we would expect at least 36 percent of the norming population of English
proficient students to be designated “limited in English” or “English Learners” and to maintain
that designation over time so long as they are making grade level progress. This is a
mathematical principle. While it is possible for any individual child or school district to have all

29
their children reach the 36th percentile, or some absolute number on another scale on a language
proficiency test, it is not possible for all districts and children to do so.
The new CELDT, an adaptation of the LAS, has five categories of English proficiency:
beginning, early intermediate, intermediate, early advanced, and advanced which are constructed
from raw scores that range from 0 to 70 or scale scores that range from 220 to 710. The text
publisher’s recommended cut-point for designating a child as English Learner is below “Early
Advanced,” which corresponds to a scale score of 506 for a kindergarten student, 517 for a first
grader, and so forth. Because the test is normed on an English speaking population, this cut-
point, and indeed any cut-point, will classify English proficient students as English Learners.
Although across the entire norming population, 36 percent will score at the 36th percentile
or below, children who are poorer than the norming population will tend to have a higher
percentage scoring at or below the 36th percentile. Figure 2.1 shows that, on average, English
Learners are substantially poorer than non-English Learners.17 The percentage of English
Learners who are poor is 71 percent and the percentage of currently, or formerly, English
Learners who are poor is 65 percent. By contrast, the percentage of never-English Learners who
are poor is only 20 percent, about 1/3 lower than the English Learners.
To understand how this affects norm referenced test results, we need to look at the
relationship between poverty and test scores in an English speaking population. Figure 2.2
compares the percentage scoring at or below the 36th national percentile in vocabulary, reading
comprehension, math analysis, and math computation on the CAT5 in Spring 1997 in the same
school district shown in Figure 2.1. Across the entire population of fluent English speakers,
17 This figure presents data on the percentage of students on free or reduced lunch by English Learner status in Spring 1997 calculated from individual student records obtained from a California school district.

Figure 2.1Percentage Poor in a California School District by English Learner (EL) Status,
Spring 1997
71%65%
20%
0%
10%
20%
30%
40%
50%
60%
70%
80%
90%
100%
Currently EL Currently or Formerly EL Never EL
% P
oor

30
between 24 percent and 35 percent score at or below the 36th national percentile, a little better
than the national norming population.
The reverse is true for poor students, however. Between 46 and 60 percent of fluent
English speaking, poor students score at or below the 36th percentile, a much higher percentage
than the national norming population (36 percent) and the local district population (24 to 35
percent). Although the poor students in Figure 2.2 are fluent English speakers, 1/4 to 1/3 would
be classified as limited English proficient if they had to take the achievement tests that children
from language minority families must take for designation and redesignation purposes.
What these data suggest is that because English Learners are typically poorer and have
fewer family resources than the norming population, if the redesignation criterion is the 36th
percentile, or its equivalent on another scale, on average, about half of English Learners will
never get redesignated no matter how good the program and how proficient they are in English.
While any individual school district might deviate from this pattern if their population is unusual,
the typical school district will exhibit these outcomes and across all school districts this is the
pattern that will be observed.
An important question is why school administrators establish criteria for limited English
proficient students that cannot be met by even the entire English speaking population. One
reason is ignorance. Educators seem to have been misled by the constant criticism they receive
from intellectuals, policymakers, and reporters who castigate them for such as sins as having
“only half their students at grade level.” In my discussions with school personnel, I have found
them to be almost universally ignorant of the fact that nationally it is only possible to have half
the student population at grade level.18
18 The concept of grade level and reading below grade level is almost universally misunderstood, not only by laymen, but by educators. Grade level is simply the average achievement for a particular grade, it has no “absolute”

Figure 2.2Percentage of Fluent English Speaking Children Scoring at or Below the 36th Percentile
on CAT5 by Poverty Statusin a California School District, Spring 1997
31%27%
35%
24%
57%
51%
46%
60%
0%
10%
20%
30%
40%
50%
60%
70%
80%
90%
100%
Vocabulary Reading Comprehension Math Analysis Math Computation
% S
cori
ng a
t or
Bel
ow 3
6th
Nat
iona
l Per
cent
ile o
n C
AT
5
ALL
POOR
31
Another reason why people adopt a standard for English Learners that typically cannot be
met by 36 percent of the students in their school district is confusion. Educators apparently
believe that children who score below average—often any score below the 50th percentile--are
children who are in academic difficulty. Since the home language survey identifies those who
are from a home where a language other than English is spoken, many educators believe that
setting a standard such as the 36th or 40th or 50th percentile, or its equivalent on another scale,
identifies children who are academically in trouble because they come from a home where a
language other than English is spoken.
This is, however, wrong. The 40th percentile is that point at which 40 percent of the
population scores—no more and no less. All of the students, including those scoring below the
40th percentile, could be extremely smart and highly knowledgeable (let us say by comparison to
previous generations). Conversely, all the students including those scoring above the 99th
percentile, could be stupid and ignorant (let us say by comparison to previous generations). We
just can’t tell from scores computed for the purpose of differentiating children. They are rank
orders, not absolute standards, a fact which is usually not known, or if known, forgotten.
The final reason why school districts adopt a standard that cannot be met by all of the
student population is that the law requires them to do it. Compliance is undoubtedly further
secured by the fact that a school district receives more money to help children if it declares its
low achieving students to be English Learners. Thus, there is little incentive to question the
process or the test criteria.
meaning. It is not possible, for example, for all students in the norming population to be at grade level because it is not possible for all students to be at or above average, only half can be.

32
Oral Proficiency Tests
In virtually every school district in the country, students identified by the home language
survey as potentially English Learner have to take an oral proficiency test and if they are older
(i.e. assumed to be literate) a written English proficiency test. Typically a kindergarten and often
a first grade student will take only an oral proficiency test.
On the face of it, oral English proficiency tests would seem to be better than a written test
at determining whether a child knows enough English to function in a regular classroom because
the child doesn’t have to know how to read or write to take an oral proficiency test.
Unfortunately, oral English proficiency tests are no better than written English proficiency and
standardized achievement tests, and for many of the same reasons. Although they appear to be
on a different scale, they are nevertheless norm referenced on English speakers. Moreover, oral
proficiency tests have some additional problems that written proficiency tests do not have. In
oral tests, students are asked questions that require they not only know English, but understand
and remember the question and have the self-confidence to stand up to a stranger when the
question is not understood.
The Research on English Proficiency Tests
The state of California approves the following English proficiency tests: the BINL, BSM
I/II, Pre-IPT, IPT I/II, pre-LAS, LAS I/II, the Woodcock-Muñoz Language Survey, and the QSE.
This list, which did not change with the passage of Proposition 227, is in Appendix E with the
acronym, complete name, and description of each test. As noted above, the State Superintendent
of Instruction selected the LAS as the foundation for the statewide test for English Learners in
accordance with AB 748, enacted in 1997, which requires that tests assessing English Learners

33
be aligned with state standards for English language development. Although school districts can
continue to administer any of the state approved English proficiency tests in Appendix E if they
wish, they must administer the California ELD test.
All English proficiency tests, including the LAS and its reincarnation as the CELDT, are
problematic in both their written and oral forms. Their oral versions are known to be
unreliable—that is, you cannot get the same outcome in subsequent tests of the same child--and
invalid—that is, they do not accurately determine who is limited-English-proficient (Baker and
Rossell, 1987; Rossell and Baker, 1988). Like standardized achievement tests administered to
the English speaking student body and written English proficiency tests administered only to the
English Learners, oral proficiency tests cannot tell the difference between a student who does not
know English and a student who does not know the answer. They are normed on an English
speaking body and the same arbitrary cut-off points are used. Any cut-off point will classify
children who know no language other than English as “English Learners.”
Nor will testing in the native tongue clear up all misclassification problems. Students
who score low in English, often score low in their native tongue because the tests in different
languages are norm referenced and tap general intelligence in that language, as well as whether
you can speak and understand the language in the colloquial sense. Someone with a low
academic ability in Spanish is likely to have a low academic ability in English. Illustrative of the
problem is a study of relative language proficiency among a sample of Hispanic students in
California by Duncan and De Avila (1979). A majority (54) of the 101 students classified by the
Language Assessment Scales (LAS) as limited or non-proficient in Spanish were also classified
as limited or non-proficient in English. Of the 96 students found to be limited or non-proficient

34
in English, less than half (42) were considered proficient Spanish speakers according to their
Spanish test score.
Ulibarri, Spencer and Rivas (1980) investigating the comparability of three oral English
proficiency tests used in California (the LAS, BSM, and BINL) concluded that language
classification is a function of the particular test used with each test identifying different numbers
of eligible students. Studies by Gillmore and Dickerson (1979), Cervantes (1982) and Pelavin
and Baker (1987) have similar results. They also find that the lack of agreement in classification
is greatest when the student knows some English, in particular when a reclassification decision is
being made.
Berdan, So, and Sanchez (1982) administered the Language Measurement and
Assessment Instrument (LM&AI) to Cherokee students at the request of the Cherokee Nation to
determine the need for Cherokee bilingual education. Through home interviews, Berdan et al.
found that 82 percent of the Cherokee students were English monolinguals. The LM&AI,
however, classified 48 percent of these monolingual English-speaking children as limited-
English-proficient presumably in need of instruction in Cherokee so they could improve their
English. In 1984, the U.S. Department of Education had the LM&AI administered to a
nationally representative sample of monolingual English speaking school-aged children. The test
classified 42 percent of them as limited-English-proficient (US Bureau of the Census Data,
1984).
A similar experiment in Chicago (Perlman and Rice, 1979) suggests that the problem of
over inclusiveness of the tests is not limited solely to low achieving students. Administrative
staff of the Chicago School District administered the LAS to students who spoke only English
and were above the citywide ITBS norms in reading. Almost half of these above average
35
monolingual, English speaking children were misclassified as non-or-limited English speaking.
Moreover, there is a developmental trend. Seventy eight percent of the English monolingual five
year olds, but only 25 percent of the 14 year olds were classified LEP.
Another state approved proficiency test is the IPT. The IPT begins with apparently
simple questions put to the child about him or herself (e.g. name, age, etc.) and then progresses
to questions about pictures the child is shown and then to oral stories the child must understand
and remember. Teachers can only repeat a question once. The items that involve listening to a
story, understanding what was heard, and remembering it, are not to be repeated at all.
Ramirez, Yuen and Ramey (1986) analyzed the reliability of the IPT. Reliability has to
do with whether an instrument can give you the same answer in repeated tests. They found that
of 573 kindergarten students classified as Non-English-Speaking, Limited-English-Speaking or
Fluent-English-Speaking in the fall of 1984, 236 had moved up one category, 238 had stayed the
same, and 99 had moved down one category or more two years later in the Spring of 1986.
Thus, according to the IPT not only has 40 percent of the sample made no progress in English
over two years, but 17 percent know less English than when they began. Similar results are
found with students in higher grades. Of 232 first graders classified Non- or Limited-English-
Proficient in the fall of 1984, 50 percent made no progress over two years and 13 percent knew
less English than when they began according to the IPT. Of 123 third graders classified Non- or
Limited-English-Proficient by the IPT in the Fall of 1984, 48 percent seemingly made no
progress and 7 percent knew less English than when they began. In short, the IPT is unreliable.
I am also familiar with a particular instance of misclassification in California using the
IPT. Misclassification deals with the issue of validity. An English proficient test is valid if it
can accurately determine who is limited-English-proficient. In 1988, the principal of an

36
elementary school in the Berkeley Unified School District, upset over the State Department of
Education’s compliance review, decided not to wait for the results of the home language survey
before testing students. She tested all new Spanish-surnamed students in her school with the
IPT.
The five year old child of a professional Hispanic family in Berkeley was administered
the oral IPT in the mass testing that occurred in 1988. Although this child knows no language
other than English, he failed the IPT, was classified limited-English-proficient, and assigned to
the Spanish bilingual program. When the family received the notice, the mother called the
school, informed them of their mistake, and was allowed to withdraw her child from the
bilingual education program. But what if the mother had not been a fluent-English-speaker and
an assertive professional who understood that a mistake had been made? There is a good chance
that this child would have been assigned to the Spanish bilingual program and taught in a
language he did not know. A year later this same child who at age 5 had been classified LEP by
the IPT, was classified “gifted” on the basis of a standardized achievement test. Thus, it is
possible for a gifted kindergarten child to fail an oral English proficiency test and be classified
limited in English.
Although much of the research on English proficiency tests that I have cited was
conducted more than a decade ago, it is still relevant today because the tests and the way they are
used have not changed in any important way since they were first created. Nor are they likely to
change in the future since the new state ELD test is just an adaptation of the LAS.
To summarize, the research evidence indicates that language proficiency tests are
unreliable and invalid and there is a good deal of disagreement between the different types,
particularly when the students tested speak some English. The tests over identify students as

37
English Learner because they cannot tell the difference between a student who does not know
English and a student who does not know the answer or who refuses to answer.
Teachers are better than tests in determining whether a child is proficient in English, but
even they make mistakes and for the same reasons (Russell and Ortiz, 1989; SWERL, 1980).
Like the tests, teachers can become confused as to whether a child does not understand English
or does not know the answer, particularly if the teacher does not know the child very well.
Some school districts also do a primary language assessment. This typically only occurs
for the Spanish speakers as there are commercially produced Spanish language proficiency tests,
but few or none for other languages. The purpose of the primary language assessment is to
increase the accuracy of the designation process by eliminating low scorers who are English
monolingual. The California Code of Regulations, section 4305, for example, states that low
scorers in English who are found to have no proficiency in their “primary” language need not be
considered English Learners.
Dual language testing reduces error, but it does not eliminate it because tests in two
different languages are not equivalent. The 36th percentile on a Spanish proficiency test is not
the same ability level as the 36th percentile on an English proficiency test. For one thing the tests
are normed on different populations—Spanish-speakers in the case of a Spanish proficiency test
and English speakers in the case of an English proficiency test—and for another we do not know
how to make questions equally difficult in two languages.
Even if we were able to, few educators would be able to resist concluding that a language
minority student who scores at the 10th percentile in Spanish and the 11th percentile in English is
limited English proficient. Most educators appear to believe, incorrectly, that a low test score
has some absolute meaning.

38
Even if a language minority student is accurately identified as English Learner upon
entering the school system, a classification criterion of the 36th percentile, or its equivalent on an
ordinal scale, guarantees that if the students are similar in social class and family environment to
the norming population of English proficient students, 36 percent of them will never get
redesignated fluent English proficient no matter how good the program is and no matter how
proficient they are in English. If they are lower in social class and family environment than the
norming population, more than 36 percent will never get redesignated.
Moreover, the cut-off point can be manipulated to produce more or fewer English Learners.
If a school district or state changes their criterion from the 20th to the 40th percentile as New
York City did in 1989, they can in one fell swoop double the number of limited English
proficient children (Rossell, 2000b). As Valdés and Figueroa (1994) note about English
proficiency tests:
So great indeed were the discrepancies between the numbers of children included in NES [non-English-speaking] and LES [limited English speaking] category by different tests that cynical consultants often jokingly recommended one "state approved" instrument or another to school districts depending on whether administrators wanted to "find" large or small numbers of LES children (p. 64).
They conclude, “The field is no more close to developing means for assessing whether a child
can or cannot “perform” satisfactorily in an all-English program than it was in 1964” (Valdés
and Figueroa, 1994:66).
Because of these problems, Proposition 227 says only that:
Once English learners have acquired a good working knowledge [emphasis added] of English, they shall be transferred to English language mainstream classrooms (Article 2, sec. 305) English learner" means a child who does not speak English or whose native language is not English and who is not currently able to perform ordinary

39
classroom work in English [emphasis added], also known as a Limited English Proficiency or LEP child (Article 3, sec. 306 (a)).
The CDE has interpreted this to mean that they can continue to use detailed and explicit
test score standards that are known to classify English monolingual children as “English
Learners.” Their report on Oceanside suggests that little will change with the new CELDT,
except that every school district will be using the same flawed test.
The English Learner Population in California
Table 2.1 shows the percentage of all students and the percentage of each ethnic or racial
group by school level who are designated English Learner in 1997-98, the year before
Proposition 227, and English Learner in 2000-01, the latest year for which we have data in
California. These data show that in 1997-98, 25 percent of the California public school
enrollment was officially designated English Learner by their school districts (col. 1, bottom
row) and this has not changed in the three years since Proposition 227 was implemented.
The percentage is higher at the elementary level than the secondary level—31 percent of
elementary school students are English Learner compared to 18 percent of secondary students.
Again this has not changed with the passage of Proposition 227. The difference between the
elementary and secondary English Learner percentages occurs for two reasons. First, as the
Perlman and Rice (1979) study found, English proficiency tests are more difficult for elementary
school students than secondary students even when the children are English monolingual
children. In their study, seventy eight percent of the English monolingual five year olds, but
only 25 percent of the 14 year olds were classified as limited English proficient by the LAS
proficiency test. Second, there are children who are born in this country to non-English speaking
families who enter school not speaking English. They, and the cohorts of 1, 2, 3, and 4 year

PRE POST PRE POST PRE POST
% of Group that is LEP or EL 1997-98 2000-01 1997-98 2000-01 1997-98 2000-01
Hispanics 49% 48% 59% 57% 37% 37%
Asians 31% 27% 39% 34% 24% 21%
Non-Hispanic Whites 2% 1% 2% 2% 1% 1%
All Students 25% 25% 31% 31% 18% 18%
All Levels Elementary Secondary
Table 2.1Percentage of Hispanic, Asian, Non-Hispanic White, and All Students Who Are
Designated English Learners in California in 1997-98 and 2000-01by School Level

40
olds, who immigrate to this country, but who do not enter school until kindergarten create a
bulge of truly non-English speaking, or limited English speaking, children in the elementary
schools. This "bulge" of children learns English in elementary school so that by secondary
school many have attained a test score that gets them redesignated fluent-English-proficient, thus
further reducing the English Learner population at the secondary level.
Hispanics have the highest percentage of students who are designated English Learner
with almost half being so classified across all school levels. At the elementary level, the
percentage is 57 percent with little change since Proposition 227. At the secondary level it is 37
percent with no change since Proposition 227. Less than 1/3 of Asian students are designated
English Learner--34 percent at the elementary and 21 percent at the secondary level. Only 1
percent of non-Hispanic whites are designated English Learner.
The differential between Hispanics and Asians on the one hand and non-Hispanic whites
on the other hand is due mostly to differences in the numbers of immigrants. Only 7.9 percent of
legal immigration is from Europe. But the differences between Hispanics and Asians may not be
due to differences in immigration rates since Asians are 43 percent of legal immigration to the
U.S. Latin American and Caribbean immigrants are 41 percent of legal immigration (California,
Department of Finance, 2000). Of course, illegal immigration probably ultimately tips the
balance in favor of Latin Americans, and looking at just the school-age population might further
do that, but the legal immigration data suggest that not all of the difference in English Learner
rates between Asians and Hispanics is due to differences in immigration rates.
Another way to look at these data is to ask what percentage of English Learners belong to
each of these groups? That data is shown in Table 2.2. Although only half of all Hispanic
students are English Learners, 83 percent of all English Learners in California in 2000-01 were

PRE POST
% of LEP or EL Population That is: 1997-98 2000-01
Hispanic 81% 83%Asian or Pacific Islander 14% 12%
European or Middle Eastern 2% 2%
Hispanic, Asian, European, Middle Eastern 98% 99%
Table 2.2Percentage of English Learners who are Hispanic, Asian, and Non-Hispanic White
in California, 1997-98 and 2000-01

41
Hispanic because Hispanics are the single largest ethnic group (43%) in the public school
population and there is continuing immigration from Latin America.19 The percentage of the
English Learner population that is Hispanic increased slightly in 2000-01 to 83 percent.
Redesignation Rates in California
As noted above, one of the many statistics used against bilingual education was the
annual redesignation rate for English Learners. It was alleged that the low redesignation rates
proved that English Learners in bilingual education were not learning English. Unfortunately the
redesignation criteria guarantee low redesignation rates regardless of the effectiveness of the
programs in teaching English.
Table 2.3 shows the number of English learner students in each year from 1981-82 to
2000-01. Figure 2.3 shows the annual redesignation rates. The annual redesignation rates in the
1990s before Proposition 227 averaged six percent. This seems abysmally low. But of we
follow a kindergarten cohort that began school in 1992-93 and assume that the same students are
in the English Learner population each year (which is an optimistic, false assumption), at least 47
percent of the English Learner population are redesignated by 6th grade, almost what you would
expect if the tests were given to English monolingual students. Since it is not the same students
over time, the annual redesignation rates are actually better than you would predict from the exit
criteria used by most school districts.20
19 The official CBEDs enrollment data for the state in 2000-01 shows 2,613,480 Hispanic students (43 percent), but only 667,630 Asian (Asian, Pacific Islander, Filipino) students (11 percent) in the public schools of the state of California in a total public school student body of 6,050,895. There were also 510,779 African American students, 2,171,861 white students, and 35,219 multi-race or no response students. 20 Sixth grade seemed to be a good point to end this intellectual analysis because the error in the estimate is greater with each successive grade. Also, most of the English Learners are in elementary school.

YearNumber of EL Students
% of K-12 Enrollment
# of Students Redesignated FEP
% Redesignated of Previous Year’s Els
1990 Cohort School Grade
Cumulative % Redesignated FEP w/ Assumption of Same Students in Cohort
Projected from Pre-227 Trend ('92-'93 to '97-'98)
2000-01 1,512,655 25.0% 134,125 9.1% 8.1%1999-00 1,480,527 24.9% 112,214 7.8% 7.8%1998-99 1,442,692 24.7% 106,288 7.6% 7.4%1997-98 1,406,166 24.6% 96,545 7.0% 7th 47.5%1996-97 1,381,393 24.6% 89,144 6.7% 6th 41.0%1995-96 1,323,767 24.2% 81,733 6.5% 5th 34.3%1994-95 1,262,982 23.6% 72,074 5.9% 4th 27.8%1993-94 1,215,218 23.1% 63,379 5.5% 3rd 21.9%1992-93 1,151,819 22.2% 54,530 5.1% 2nd 16.4%1991-92 1,078,705 21.1% 55,726 5.6% 1st 11.3%1990-91 986,462 19.9% 49,001 5.7% Kind.1989-90 861,531 18.1% 53,223 7.2%1988-89 742,559 16.1% 54,482 8.4%1987-88 652,439 14.5% 57,385 9.4%1986-87 613,224 14.0% 53,277 9.4%1985-86 567,564 13.3% 55,105 10.5%1984-85 524,076 12.6% 50,305 10.3%1983-84 487,835 11.9% 47,503 10.4%1982-83 457,540 11.2% 52,504 12.2%1981-82 431,449 10.7% 57,336 15.2%
Source: State Department of Education, Language Census Reports for California Schools, www.cde.ca.gov.
Table 2.3
Redesignation Rates for English Learnersand Cumulative Redesignation Rates for 1992-93 Kindergarten Cohort
in California, 1981-82 to 2000-01

Figure 2.3 Percentage of English Learners (EL) and Actual and Projected Percentage of EL Redesignated Pre and
Post Proposition 227 in California, 1981-82 to 2000-01
0%
5%
10%
15%
20%
25%
81-82 82-83 83-84 84-85 85-86 86-87 87-88 88-89 89-90 90-91 91-92 92-93 93-94 94-95 95-96 96-97 97-98 98-99 99-00 00-01
Pro
posi
tion
227
Im
plem
ente
d
% English Learners
Actual % Redesignated
Projected % Redesignated

42
Ironically, the annual redesignation rates had been increasing steadily in the years before
Proposition 227. This doesn’t mean much since only 39 percent of elementary English Learners
and 10 percent of secondary English Learners were enrolled in bilingual education before 227. If
we project the trend from 1992-93 to 1997-98 forward to the next three years after 227, the
percentage redesignated is only one point higher than what would have occurred without 227. In
short, so long as the same redesignation criteria are used, there is a ceiling on how high the
redesignation rates can go. If the standard being used is the 36th percentile, or its equivalent on
an ordinal scale, and the English Learner population being assessed is similar to the norming
population of English proficient students, you would expect at a minimum that 36 percent would
never get reclassified. Since the English Learner population being assessed is poorer and has
fewer resources than the norming population of English proficient students, you would expect
even higher percentages-- perhaps half-- to never get reclassified.
These data suggest that a 24 point decline in elementary English Learners enrolled in
bilingual education (see Chapter 4) produced a 7 ½ to 15 point increase in elementary English
Learners redesignated. The lower number is the cumulative elementary school (seven grade)
impact of the one point difference between the actual and the projected and the higher number is
the cumulative difference between the 7 percent before Proposition 227 and the 9.1 percent in
spring 2001. By the standards of educational research, even the smaller number is an impressive
impact. It means that for every 3.2 point decline in the percentage enrolled in elementary
bilingual education, the state gets a one point increase in the percentage of elementary English
Learners redesignated.
The new CELDT, however, will make the evaluation environment worse. School
districts which had been using English proficiency tests with higher "pass" rates will see a

43
decline in their redesignation rates with the new test. School districts which had been using a
test with a lower "pass" rate will see their redesignation rates improve with the new test.
Comparing the new redesignation rates with the pre-ELD and pre-Proposition 227 redesignation
rates will no longer be possible. We will have to start from scratch in assessing redesignation
trends. In addition, the essential problem remains, English proficiency tests, including the
CELDT, cannot tell the difference between a student who does not know English and a student
who does not know the answer. As a result they are capable of classifying a child who knows no
language other than English as an English Learner.

44
3. Enrollment in Bilingual Education Before Proposition 227
There are several reasons why it is important that we understand who was enrolled in
bilingual education before Proposition 227. First, knowing how many students were enrolled in
bilingual education gives us a perspective on the scope of its harm before Proposition 227.
Second, knowing which language groups actually receive bilingual education gives us an
additional perspective on what it is and what it is not.
Program Enrollment Data
With the passage of Proposition 227, a whole new set of program categories appeared in
the state language census (R30-LC) alongside the old categories. The new program categories
are in Row 01 in Appendix D under the heading “Number of English Learner (EL) Students
Enrolled in Specific Instructional Settings” and in Appendix C. The old program categories are
in Row 02 of Appendix D under the heading “English Learner (EL) Students Receiving
Instructional Services.”
The old categories are:
• English Language Development (ELD) (00) • ELD and Specially Designed Academic Instruction in English (SDAIE) (01) • ELD and SDAIE with primary language support (02) • ELD and Academic Subjects Through the Primary Language (L1) (03) • Instructional Services Other than those Defined in 00-03 (04) • Not Receiving Any English Learner Services (05)
The new program categories are:
• (00) Structured English Immersion (also referred to as Sheltered English Immersion): Classes where EL students who have not yet met local district criteria for having achieved a "good working knowledge" (also defined as "reasonable fluency") of English are enrolled in an English language acquisition process for young children in which nearly all classroom instruction is in English but with a curriculum and presentation designed for children who are learning the language (EC 305 and 306(a)).

45
• (01) Alternative Course of Study: Classes where EL students are taught English and other subjects through bilingual education techniques or other generally recognized methodologies permitted by law and where the pupils enrolled have been (1) granted a parental exception waiver pursuant to EC 310 and 311; or (2) enrolled in any Alternative Education Program operated under the Superintendent of Public Instruction's waiver authority (EC 58509) when such an alternative for EL students was established specifically to waive one or more sections of EC 300 through 340; or (3) enrolled in a Charter School program which offers any alternative course of study for EL students.
• (02) English Language Mainstream Classroom (with additional and appropriate services) - Students Meeting Criteria: Classes where English learners who have met local district criteria for having achieved a "good working knowledge" (also defined as "reasonable fluency") of English are enrolled and provided with additional and appropriate services (EC 305; CCR T5 11301 and 11302).
• (03) English Language Mainstream Classroom (with additional and appropriate services) - Parental Request: CCR 11301(b) permits a parent or guardian of an English Learner to request, at any time during the school year, that a child placed in Structured English Immersion be transferred to an English Language Mainstream Classroom and provided with additional and appropriate services. Enter in this column the number of English Learners currently placed in English Language Mainstream Classrooms at the request of their parents.
• (04) Other Instructional Settings (04): Classes or any other instructional setting other than those described in columns (00) through (03) of Part II, Row 01. The instructional settings described in columns (00) through (03) are those explicitly authorized by EC 300-340.
School districts are asked to fill out both sets of program categories. In the old program
categories, bilingual education is category 3, “ELD and Academic Subjects Through the Primary
Language.” In the new program categories, bilingual education is category 1, “Alternative
Course of Study”, although this category also includes charter schools and any other program
considered "alternative." In the old program categories, ESL pullout seems to have been defined
as ELD. This category has disappeared in the new language census program categories. If a
school district is offering ESL pullout, it would have to go into categories 02, 03, or 04, although
I am aware of one school district that put it in category 01, "alternative course of study," where
the bilingual education programs typically go. In the old program categories, SDAIE (category
01) would be closest to the new program category, Structured English Immersion (category 00).

46
At all grade levels, there is confusion over how to code program enrollment and this is
especially obvious with bilingual education. Claims are made in reports to the state about
offering bilingual education when the numbers indicate there couldn’t possibly be a bilingual
education program taught according to the theory and state law. To have a true bilingual
education program, a school must have at least 10 students in a single grade of the same
language group. But the data reported to the state in 1997-98, the year before Proposition 227
was passed, reveal numerous examples of bilingual education enrollment that is simply beyond
the fiscal resources of any school or school district. For example, in the year before Proposition
227, Rooftop Elementary in San Francisco Unified reported having one student in bilingual
education in 1997-98 in the entire school and no bilingual certified or in-training teachers.
Valenzuela Elementary in Stockton Unified similarly reported having 6 students in bilingual
education in 1997-98. Of the schools in California that reported having at least some students in
bilingual education, 6.4 percent had less than 10 students enrolled in bilingual education and we
do not know whether they even spoke the same language. It is simply impossible for a school to
be able to offer true bilingual education when it has less than 10 students across all grades.
Fifty-three schools claimed to have from 1 to 124 students enrolled in bilingual education,
although they had no bilingual certified or teachers in-training to be bilingual certified in any
language.
Data on bilingual certified teachers for the entire state shows a similar bias. Table 3.1
shows the number of teachers who are bilingual certified and in training to be bilingual certified
who were providing primary language instruction in the state in 1997-98 by language group of
the teachers and the English Language Learner students. The language groups are sorted by the
median number of teachers in a school. I also denote whether a language group has a Roman

Primary Bilingual Bilingual Number Percentage of Median LEP/Bil.Language LEP Certified In-Train. of Schools Teachers Number of Teacher
Roman Literacy Students Teachers Teachers w/ Biling. Alone Teachers Ratio inLanguage Alphabet First in State in State in State Teachera in Schoola in Schoola Statea
Spanish YES If resources 1,140,197 15,224 10,529 3,531 3% 5.0 44
Cantonese No No 25,360 270 141 113 13% 3.0 62
Korean No No 15,521 42 16 14 9% 2.5 268
Japanese No No 4,967 5 13 5 11% 2.0 276
Khmer (Cambodian) No No 18,694 8 31 13 15% 2.0 479
Portuguese YES No 2,207 20 0 8 25% 1.0 110
Vietnamese YES No 43,008 61 65 65 32% 1.0 341
Mandarin No No 10,380 19 11 17 37% 1.0 346
Pilipino/Tagalog YES No 20,062 25 9 19 38% 1.0 590
Laotian No No 8,343 5 3 6 50% 1.0 1,043 All Others 117,427 104 1,129
TOTAL 1,406,166 15,783
a Bilingual certified and in-training combined; denominator for percentages is schools with at least one certified or in-training teacher of that language.
Table 3.1
Before Proposition 227 (1997-1998)
Schools w/ at Least OneBilingual Teacher in Lang.
Staff Providing Primary Language Instruction in CaliforniaFrom State Department of Education Language Census,

47
alphabet and thus whether they are likely to be receiving bilingual education according to the
theory—that is, learning to read and write initially in their native tongue. The next columns
show the number of English Learners in the state of each language group, and the number of
bilingual certified and in-training teachers in the state for each language. The columns after that
show the number of schools across the entire state that have at least one bilingual certified or in-
training teacher of each language group. I have combined bilingual certified and bilingual in-
training in this and subsequent columns because the latter are typically given the same
responsibilities as the bilingual certified teachers, including their own classrooms.21
The data on the numbers of teachers of each language also suggest that it is highly
unlikely that anybody but the Spanish speakers are actually being taught native tongue literacy in
self-contained classrooms. This cannot be determined with more certainty from these data
because although the state keeps English Learner status and teacher certification by language, it
does not keep program enrollment by language.
In 1997-98, there were 25,753 Spanish bilingual teachers (certified plus in-training) in
3,531 schools. If we look at the schools that had at least one Spanish bilingual teacher, only 3
percent were in schools by themselves and the median number of Spanish bilingual teachers in a
school was 5. Thus, there are enough Spanish bilingual teachers in most schools to actually run
a full fledged Spanish bilingual education program. Across the entire state, the ratio of Spanish
English Learners to Spanish bilingual teachers is 44.
The Cantonese bilingual teachers are the next largest number of bilingual teachers of a
language. The median number of teachers in a school is 3, enough to run a native tongue literacy
program for three years, kindergarten through 2nd grade. But even if the students are in self-
21 The major difference is that the teachers in training are also given a teacher’s aide whereas the bilingual certified usually are not. Thus, there may be a perverse incentive not to get certified since it typically means the loss of a

48
contained classrooms, they will learn to read and write in English, and their textbooks will be in
English, although they may learn Mandarin as a second language and their teacher may translate
or speak in Cantonese if all the children are Cantonese speakers (which is rare).
Each successive language group in Table 3.1 has fewer and fewer bilingual teachers. The
median number of Portuguese, Vietnamese, Mandarin, Pilipino/Tagalog, and Laotian bilingual
teachers is 1 per school. This is not enough to run a true bilingual education program in these
languages. In addition, from 9 to 50 percent of the certified teachers are in a school by
themselves. Typically the services provided by these solo "bilingual education" certified
teachers are ESL instruction and management of the ESL program, which can include being the
school-parent liaison for families of the same language as the "bilingual education" teacher.
The correlation between the number of English Learners of a language group in a school
and the number of bilingual teachers of a language group in a school is highest for the Spanish
speakers and the Cantonese speakers at .74 and .75 respectively. There is very little relationship
(less than .30) between the number of Vietnamese, Filipino, Mandarin, Laotian, and Armenian
English Learners and bilingual teachers in that language at a school. Indeed, there are no
Armenian bilingual certified or in-training teachers in the state, although there are school
districts that claim to have an Armenian bilingual education program.22
We can draw two conclusions from these data. First, bilingual education appears to be
feasible only for the Spanish speakers. Second, there is confusion or disagreement over what
bilingual education is, but the bias is to include more programs under that label than actually
teach the native tongue or use it in instruction. According to these data and my classroom
observations and teacher and principal interviews, the definition of bilingual education seems to
teacher’s aide.

49
range from native tongue instruction with English as a Second Language to any kind of special
help for English Learners.
How Many Students in Bilingual Education?
If we look just at the old program category for bilingual education, in the year before
Proposition 227, Figure 3.1 shows that 39 percent of elementary English Learners were in
bilingual education compared to only 10 percent of secondary students. To some extent this
reflects the differential in the English Learner percentage at elementary (31 percent) and
secondary (18 percent) levels.23 But the difference in bilingual education enrollment by school
level is greater than the difference in English Learner percentages. It is also a reflection of the
fact that students are more likely to be literate in their native tongue at the secondary level than at
the elementary level which diminishes the motivation for bilingual education. According to the
theory, bilingual education is first and foremost a program for teaching literacy.
Not only were most English Learners enrolled in an English speaking instructional
program prior to Proposition 227, but so were most Spanish speaking English Learners. There
were 1,140,197 Spanish English Learners in 1997-98, but only 409,879 students of all languages
enrolled in bilingual education. Even if the only children enrolled in nominal bilingual education
were Spanish speakers, at most only 36 percent of Spanish English Learners could have been
enrolled in bilingual education before Proposition 227, as illustrated in Figure 3.2 on the right.
Since we know that not all of the students enrolled in programs labeled bilingual education are
22 This information comes from newspaper articles and interviews over the last decade and a half not from the program data since that is not broken down by language group. 23 As discussed above, there is a bulge of immigrant children in kindergarten that is the accumulation of those who were born into non-English speaking families or who moved here at 1, 2, 3, or 4 years of age. In addition, the English proficiency tests that are used to classify a student as LEP are easier for older children than for younger children. See, for example, Perlman and Rice, 1979.
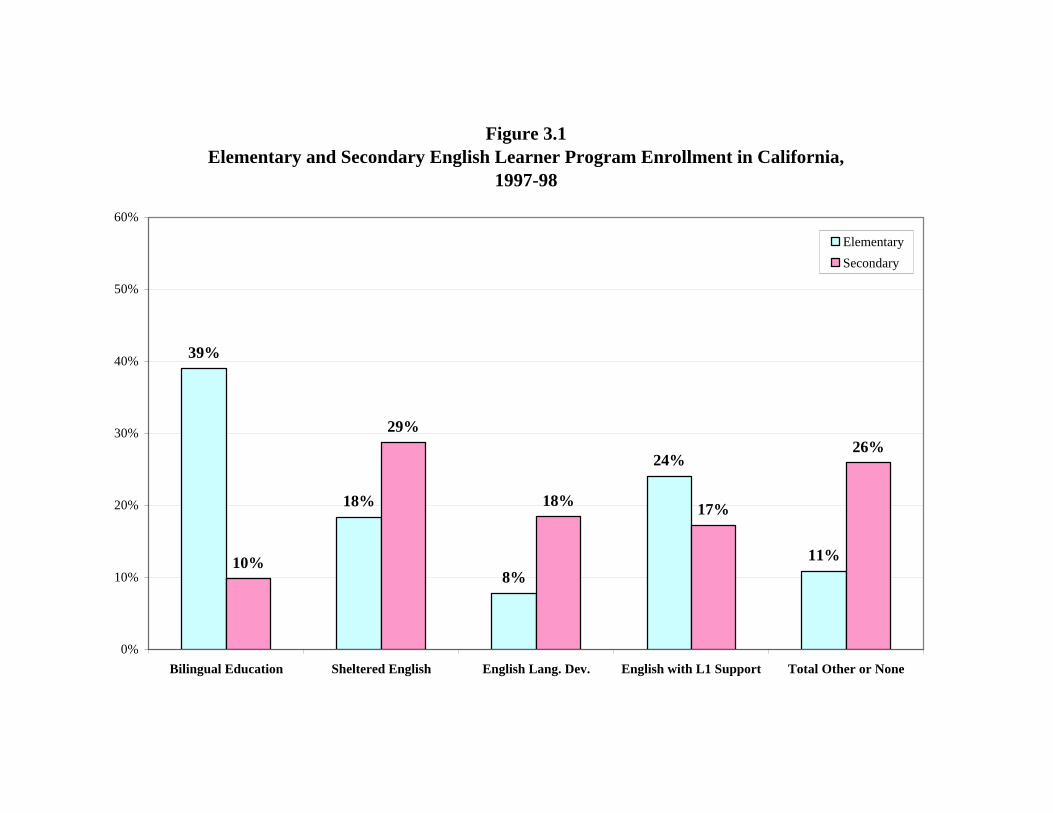
Figure 3.1Elementary and Secondary English Learner Program Enrollment in California,
1997-98
39%
18%
8%
24%
11%10%
29%
18% 17%
26%
0%
10%
20%
30%
40%
50%
60%
Bilingual Education Sheltered English English Lang. Dev. English with L1 Support Total Other or None
Elementary
Secondary

50
Hispanic, the percentage of Hispanic English Learners enrolled in bilingual education is
probably several points lower than 36 percent.
At the elementary school level, there were 770,633 Spanish speaking English Learners in
the state in 1997-98. However, there were only 363,568 elementary students enrolled in
bilingual education. As shown in Figure 3.2 on the left, even if we were to assume that all the
elementary English Learners enrolled in bilingual education were Spanish speakers, at most only
47 percent of the Spanish speaking English Learners were in bilingual education. Since we
know that not all the English Learners in bilingual education were Spanish speakers, the actual
percentage of Spanish speaking English Learners enrolled in bilingual education is several points
lower than 47 percent.
At the secondary school level, there were 369,608 Spanish speaking English Learners in
the state in 1997-98. However, there were only 46,311 secondary English Learners enrolled in
bilingual education. As shown in Figure 3.2, even if we assume that all the secondary English
Learners in bilingual education were Spanish speakers, at most only 13 percent of secondary
level Spanish speakers could have been enrolled in bilingual education. Since we know that not
all the English Learners in bilingual education were Spanish speakers, the actual percentage of
Spanish speaking English Learners enrolled in bilingual education is several points lower than 13
percent.
Thus, critics of bilingual education have exaggerated its aggregate harm and supporters
have exaggerated its aggregate benefit to English Learners, including Spanish speaking English
Learners. Prior to Proposition 227, about 2/3 of all English Learners and Spanish speaking
English Learners, were either in a regular classroom with no extra help, a regular classroom with
ESL pullout, or a structured immersion classroom very similar to what Proposition 227 requires.

Figure 3.2Maximum Possible Percentage of Spanish Speaking English Learners in Bilingual
Education in California, 1997-98
47%
13%
36%
0%
10%
20%
30%
40%
50%
60%
Elementary Secondary Total

51
This percentage was higher for elementary students and lower for secondary students, but the
data suggest that bilingual education was not the primary cause of the low achievement of
English Learners and it certainly was not the primary cause of the high school dropout rate of
Hispanic students since only 13 percent of Spanish speaking English Learners (and not all
Hispanics are English Learners) at that school level were enrolled in bilingual education.
Table 3.2 shows the results of a statistical analysis of the number of elementary and
secondary students enrolled in nominal bilingual education in individual schools in California in
1997-98. Elementary students are shown in model 1 and secondary students in model 2. The
predictors of the number enrolled in bilingual education in a school in 1997-98 are the number of
Spanish, Vietnamese, Hmong, Cantonese, Filipino, Khmer, Korean, Armenian, Mandarin, and
Laotian English Learners, the total enrollment (size) of the school, and the percentage eligible for
free or reduced lunch (poor).24
The easiest way to determine the relative strength of each variable is to look at the Beta,
the standardized coefficient measuring the relationship between bilingual education enrollment
and each of the variables. The relationship between the number of Spanish speaking English
Learners and bilingual education enrollment is strongest for elementary students with a Beta of
.95 out of a maximum of 1.0. It is still strong for secondary students, but less so with a Beta of
.67 out of a maximum of 1.0. The number of students of speakers of other languages has little or
no relationship to the number of students enrolled in bilingual education. Indeed, if we could
measure true bilingual education instead of just what is labeled bilingual education, the
coefficient for Cantonese speakers would be zero. The equation for elementary students explains
78 percent of the variation in the number of students enrolled in bilingual education in California

Signif. Signif.Dependant Variable= Mean b Beta t Level Mean b Beta t LevelNumber in Bilingual Education 1997-98 74 20
Constant 9.839 2.72 0.007 * -3.913 -1.88 0.060Number Spanish EL Students, 1997-98 157 0.606 0.95 80.36 0.000 * 154 0.142 0.67 30.44 0.000 *Number of Vietnamese EL Students, 1997-98 5 -0.521 -0.06 -9.20 0.000 * 7 -0.154 -0.08 -4.81 0.000 *Number of Hmong EL Students, 1997-98 4 0.014 0.00 0.30 0.761 4 0.063 0.03 1.40 0.161Number of Cantonese EL Students, 1997-98 3 0.632 0.08 10.59 0.000 * 4 0.221 0.07 4.44 0.000 *Number of Philipino EL Students, 1997-98 2 0.206 0.01 1.48 0.139 4 0.164 0.03 1.82 0.068Number of Khmer EL Students, 1997-98 2 0.495 0.05 7.45 0.000 * 3 0.097 0.03 1.55 0.122Number of Korean EL Students, 1997-98 2 0.033 0.00 0.41 0.678 2 -0.153 -0.03 -1.52 0.129Number of Armenian EL Students, 1997-98 2 -0.060 -0.01 -1.30 0.195 2 -0.040 -0.02 -1.22 0.222Number of Mandarin EL Students, 1997-98 1 -0.108 0.00 -0.52 0.601 2 0.011 0.00 0.12 0.905Number of Laotian EL Students, 1997-98 1 -0.055 0.00 -0.26 0.794 1 -0.092 -0.01 -0.51 0.608Total Enrollment, 1997-98 612 -0.035 -0.07 -6.75 0.000 * 1071 -0.005 -0.07 -3.29 0.001 *% Eligible Free or Reduced Lunch, 1997-98 54 -0.193 -0.04 -4.42 0.000 * 39 0.162 0.08 4.38 0.000 *
Adjusted r2 0.781 0.452
N 4,916 2,358 * Statistically significant at .05 or better.
Table 3.2
Predictors of the Number of English Learners (EL) Enrolled in Bilingual Education
ELEMENTARY SECONDARY
in Individual Schools in California, 1997-98

52
elementary schools in 1997-98. The equation for secondary students, however, explains only 45
percent of the variation in bilingual education enrollment.
These equations were also run separately for Los Angeles, San Francisco, and San Diego,
the three school districts examined in greater depth in this report. The effect of the number of
Spanish speaking English Learners is even stronger in Los Angeles and San Diego than it is in
the state as a whole. In San Francisco, however, the number of Cantonese speaking English
Learners is slightly stronger than the number of Spanish speaking English Learners with a Beta
of .65 in model one compared to .60 for Spanish speakers. This, of course, reflects the large
number of English Learner Cantonese speakers--San Francisco has 26 percent of all the English
Learner Cantonese speakers in the state compared to only 8 percent in Los Angeles and 1 percent
in San Diego.
Which Language Groups?
The data presented above suggests that bilingual education is a program for elementary
school Spanish speaking English Learners. These equations show they are the only ones in most
school districts with the numbers. But Spanish speakers also have some other interesting
characteristics that set them apart from many other English Learners, particularly those from
Asia. The most important of these differentiating characteristics is the nature of their language.
Indeed, one of the problems with the facilitation theory and with California state law
before Proposition 227 is that it ignores the great variation in written language. In particular, the
theory and the law are silent on how you would teach Asian children to read and write in their
native tongue and why you would want to do that since so few of the skills would be transferable
24 The percentage of the English Learners who are Spanish speakers was included in the equation, but it explains

53
to English. The vast majority of Asian languages use an ideographic system of writing, rather
than an alphabetic or phonetic system, and have no similarity in appearance to English,25 thus
reducing the number of transferable skills, such as sight recognition of words, sounding out of
words, and so forth.
These languages also take much longer to master than English. In other words, learning
to read in the native language, if it is ideographic (e.g. Chinese or Japanese), may actually be
harder than learning to read and write in the second language, if the latter is English or another
phonetic, alphabetic language. As a result, I have not found any non-alphabetic bilingual
education programs that actually teach initial literacy in the native language, although many of
them are taught in self-contained classrooms, are called bilingual education, and receive
bilingual education funding.
I also have not found any non-Roman alphabet bilingual education programs, even if the
alphabet is phonetic (e.g., Hebrew, Arabic, the Indian dialects, Russian, Armenian, and Khmer),
that teach initial literacy in the native language. The teachers I have interviewed have told me
that it is too difficult or distracting to teach initial literacy, particularly to young children, in a
language with a different alphabet from English. The literature, however, is silent on this issue.
This is also true of the legislation and regulations in California and every other state.
None of them acknowledge any limitation to providing bilingual education except the number of
English Learners, the number of certified bilingual teachers, and the availability of materials in
that language. The characteristics of the language itself, and its similarity to English are
universally ignored in official documents and in most of the literature in the field.
nothing and increases the standard error of the equation because it is highly correlated with the number of Spanish speakers. Moreover, it is the absolute numbers that are needed to form a classroom, not percentages. 25 Two exceptions are Hmong and Vietnamese whose written languages were created by westerners and so have a Roman alphabet.

54
The only other individuals I am aware of who have written about this issue are James
Traub (1999) in a New York Times Magazine article and McDonnell and Hill (1993) in a study of
newcomer programs in California. McDonnell and Hill attribute the differences they observed to
differences in resources to support bilingual education:
Because of the lack of bilingual teachers in the Southeast Asian languages, instructional strategies differ at the Visalia newcomer center for Spanish-speaking and Southeast Asian students. The Spanish speaking students are taught for half the day in their native language, while the Southeast Asian students are taught entirely in English using language development techniques (McDonnell and Hill: 94).
James Traub does not attribute the differences he observes to a lack of resources. He
thinks parental attitudes and the number of speakers of that language in the U.S. are a more
important influence. Russian and Chinese English Learners in bilingual education classes are
taught in English because the parents support it and there are no large communities of these
languages where the non-English speakers can get along without English.
But I think it is more complicated than that. In Figure 3.3, I have diagrammed what I
believe is the implicit decision process in California that determines whether an English Learner
receives instruction in a self-contained classroom and then whether they receive native tongue
instruction. This model incorporates important practical criteria, ignored in the theory, the
legislation, the regulations, and policy statements, that I believe are implicitly used by school
district officials and teachers. This chart is based on the empirical analysis presented in Table
3.1, on logic and on my classroom observations in schools in California, and across the country.
Assuming a language minority group meets the minimum criterion for a school district of
10 in a single grade of a single dialect or language,26 my flow chart predicts that if the
elementary English Learner is of northern European or more affluent Asian origin (e.g., Japan or
26 This was the requirement of the 1976 Chacon-Moscone Act which was enforced by the California Department of Education until the passage of Proposition 227.

Teacher fluent innative language of all
students inclassroom?
yes
yes
no
no
no
BE offered ,as per theory
example: Spanish
No BE, butstudents placed
in segregated classes
with cultural andnative language
enrichment
examples: Vietnamese, "Chinese"
Textbooks for U.S.curriculum in native
language? yes
no
no
Official language oflarge country?
yes
yes
Roman alphabet?
Staff perception:group's academicskills are good?
no
yes
> 10 students in asingle grade in alanguage group?
No BE ,students placedin mainstream
classes with aidesor pull-outs
examples: Japanese,Korean
Figure 3.3Pre-Proposition 227 Predicted Program Placement of English
Learners in California
55
Korea), they will be in a regular classroom where they will receive instruction in English with
pullout support or in-class ESL tutoring, although there may be a bilingual teacher or teacher’s
aide for support. If the elementary English Learner is from a poor Asian country such as China,
Cambodia, Laos, the Philippines, or Vietnam; a poor southern European country like Greece or
Portugal; or a Latin American country, they are more likely to be in a self-contained classroom
consisting only of English Learners because they are thought to need the protection of a self-
contained classroom. I base this conclusion on my interviews with teachers who often replied
that the reason why a particular language group was not in a separate classroom like some other
language groups was because “they did not need it.”
However, as shown in Figure 3.3, even if the students are in a self-contained classroom
consisting only of the same country of origin English Learners, I predict they will be taught to
read and write in their native tongue only if a) their native tongue is a phonetic language with a
roman alphabet, b) their teacher is fluent in their dialect/language, c) all the students in the
classroom speak the same dialect, d) there are published textbook materials in the native tongue
written for the U.S. curriculum, and e) the dialect or language is the official language of one or
more large countries. In short, this model predicts that only the Spanish speakers will receive
bilingual education according to the theory because they are typically the only ones that fulfill all
the conditions for receiving it: that is, there are enough of them to fill a classroom by combining
two grades and they have a native tongue that is a phonetic language with a roman alphabet, and
they are likely to have a teacher who is fluent in their language, and all the students in the
classroom speak the same dialect since Spanish has no important dialects, and there are

56
published textbook materials in the native tongue written for the U.S. curriculum, and the dialect
or language is the official language of one or more large countries.27
The causal path for secondary students is different and is not shown here. Secondary
schools (defined as the grade where departmentalization of subjects occurs) differ from
elementary schools in the rationale for bilingual education, since the typical secondary English
Learner already knows how to read and write in their native tongue and has many years of
cognitive development. The purpose of bilingual education for secondary students is to protect
the English Learner from the competition and, it is believed, assault on their self-esteem found in
the regular classroom and to enhance their self-esteem by showing respect for their native tongue
and culture. Some of the secondary programs also have another purpose--to keep at-risk English
Learner high school students from dropping out and to enable them to attain a high school degree
by offering as many required courses as possible in the native tongue or in a "sheltered"
environment on the assumption that they would have trouble passing the same course in a regular
English language classroom and/or would feel alienated to the point of dropping out.
But the reality at the secondary level is that it is rare for a school to have enough resources to
offer all courses in the native tongue, even if it is Spanish, since teachers have to be certified in both
a subject matter and a foreign language. In addition, there are not enough English Learners, even
Spanish speaking English Learners, at that level to be able to form bilingual education classrooms in
every subject. Therefore, as we have seen, bilingual education at the secondary level is a hit or miss
proposition. If it is offered, it is usually in one or two subjects, although this does not stop some
junior and senior high schools in California from declaring that they have a bilingual education
program. Even with this bias--that is, more programs are declared to be bilingual than actually are--
27 Occasionally, other Roman alphabet language groups will have the numbers to fill a classroom—in California this is sometimes true of Vietnamese and Portuguese speakers—but even in these cases, I have never seen one offered in either of these languages.

57
only 10 percent of secondary English Learners, and at most only 13 percent of Spanish speaking
English Learners, were enrolled in bilingual education at the secondary level prior to Proposition
227.
One might ask why the proponents of bilingual education ignore, or as often happens
vehemently deny, this reality—that only the Spanish speaking English Learners are receiving true
bilingual education. I suspect it is because it calls into question the underlying theory of bilingual
education which is that children must learn to read and write in their native tongue or they will be
cognitively disadvantaged. If one accepts this theory as true, it is not clear how one would modify it
to exempt the non-Roman alphabet speakers. Moreover, these students, most of whom are Asian, are
the most successful students in school. It is easier to ignore or deny the fact that only the Spanish
speakers are receiving bilingual education than it is to modify the theory to exempt the non-Roman
alphabet English Learners.

58
4. The Impact of Proposition 227 on Bilingual Education
Although Proposition 227 allowed parents to request that their child remain in bilingual
education, the extent to which there was enough demand to maintain a bilingual education
program depended on the size of the Spanish speaking English Learner population and the
organization of the school. Parents in schools with small numbers of Spanish speaking English
Learners may not even have been made aware of their right to apply for a waiver since there was
little or no likelihood of having enough students to maintain a bilingual education program. In
school districts which had made the decision to adopt sheltered English immersion across the
board, parents may also not have been made aware of their right to apply for a waiver since there
was little or no likelihood of having enough students to maintain a bilingual education programs.
A sizeable portion of parental demand is generated from above and when that pressure is absent,
parental demand is low.
In the remaining schools—those with sizeable numbers of Spanish speaking English
Learners in districts which had not made a district-wide commitment to English instruction--
some schools were able to continue their bilingual education programs by organizing their
classrooms during the 30 day trial period so as to facilitate converting them to bilingual
education. They did this in some cases because of a belief in the superiority of bilingual
education, and in at least one case because there was not enough time to plan a structured
immersion program. This was apparently a problem in San Diego because the school district
changed superintendents and bilingual education directors soon after Proposition 227 passed.
One elementary school principal in San Diego told me that she simply continued the bilingual
education programs from the year before because the Director of Bilingual Education was
encouraging this. When he was fired by the new Superintendent, she just did not have enough

59
time to implement a different strategy. Every student assigned to bilingual education for the
1998-99 year was assigned to a 30 percent Spanish program and during the 30 day waiting
period most parents were persuaded to come in to the school and sign a waiver. All of these
classes then converted to bilingual education on the 31st day.
At an assembly consisting only of the parents in the new waivered bilingual education
classes, this same principal asked the parents if they would be willing to let the school teach their
child completely in English beginning in 1999-2000 and let Spanish instruction be the job of the
family. She said every one of the parents who had just signed waivers to have their child taught
in the native tongue raised their hand to indicate that all-English in school was also fine with
them.
But not all parents of Hispanic English Learners signed waivers despite the efforts of the
principal and the teachers. Even in this school where the principal tried to waiver all of the
students who had been assigned to bilingual education before Proposition 227, the number of
Spanish speakers in bilingual education declined by almost 100 students from 544 (57%) in
1997-98 to 448 (51%) with the implementation of Proposition 227.
The principal and her co-principal had been supporters of bilingual education because
they thought it was more successful than sink-or-swim in making readers out of Spanish English
Learners. On the other hand, they acknowledged that it had costs—some teachers spent too
much time perfecting their student’s Spanish literacy at a cost to their English literacy and there
were students who never got out of Spanish instruction. By the end of their discussion with me,
the two San Diego principals seemed to have reversed themselves because they were asserting
that they planned to implement Proposition 227 fully in 1999-2000. They thus appeared to
support both bilingual education and structured immersion. Indeed, this was often the case with

60
the teachers and administrators that I talked to. Although they preferred bilingual education, any
extra help for English Learners was a close second.
The data for this school, indeed, shows a sharp decline in bilingual education from 448
(51%) in the first year of Proposition 227 to 299 (36%) in the second year, but then it rose again
to 440 (46%) in the third year. Thus, Proposition 227 was still not implemented fully as she had
claimed it would be. Moreover, in a return visit to this school in September 2001 (the fourth
year), I learned that classrooms were still being organized so that children who were thought to
“need” bilingual education were in the same classroom. Since the CDE legal office has
concluded that placement in a structured English immersion needs to take place for 30 days only
the first year that a parent submits a waiver for bilingual education and that is the practice, it is
possible that the students enrolled in first grade and higher bilingual education classrooms are
simply continuing students who were in a sheltered English immersion classroom for 30 days in
the previous year. However, at this school there were six kindergarten bilingual education
classrooms in the second week of school that by law should not have existed. The two remaining
kindergarten classes were mixed sheltered English immersion and mainstream classes.
The other school in San Diego and the two schools in Los Angeles that were revisited in
September 2001 also had kindergarten bilingual education classrooms during the first 30 days in
apparent violation of the law. In addition, not only were the classes labeled waivered bilingual,
bilingual literacy (San Diego), or bilingual instruction, the children in these classrooms were
definitely being instructed in Spanish. When I questioned this, I was told by their teachers that
they were being instructed in Spanish because they knew no English. Despite Proposition 227,
this apparently seemed like a sensible conclusion to their teachers.

61
However, non-Spanish speakers in these schools who knew no English were being
instructed in English. When I questioned their teachers as to how they were able to teach a child
who spoke no English in English, they replied that it was hard but that they had no choice—there
were not enough students of any single language to do anything else. In short, when given no
choice, teachers can and do teach in English to children who know no English. Although they
find it difficult, they believe they are making it work.
The September 2001 revisits confirm that some three years after Proposition 227 was
passed, the 30 day rule is being routinely violated in San Diego and Los Angeles if the child is a
Spanish speaker who knows no English. Only in Oceanside are Spanish speakers who speak no
English taught in English. And even there, the teachers acknowledge that “they are working
harder than ever before.” Bilingual education for Spanish speakers who speak no English is,
quite simply, easier than all-English instruction. And that is part of its attractiveness to
educators. Their only fear was that it was too easy and as a result, students stayed in Spanish too
long.
The Waiver Process. Visiting the school to sign a parental waiver is not an idea that
typically originates with the parent. The proposed February 2002 regulations that would have
allowed principals and teachers to initiate waivers, in addition to parents, was merely an attempt
to codify what was already common practice. The defeat of these regulations will not change
this practice. My interviews indicate that bilingual education is like medical care. Teachers, like
doctors, create supply by the criteria they use to define a child as needing treatment and they
create demand by telling the patient what treatment he or she needs. In every school that I or my
colleague, Carol Janes, visited in Spring 1999, teachers explained that they had “worked very
hard” to get parents to sign waivers. They held daytime and evening meetings during the 30 day

62
period and called parents to convince them that their child would be better off in the bilingual
education program that had been recommended for them the previous year.
This process is diagrammed in Figure 4.1 as a supply and demand model of creating
waivered classrooms. The first step in creating a waivered classroom is that there must be 20 or
more Hispanic English Learners in a single grade in a district that has not made a districtwide
commitment to English instruction. Just as Hispanic students were the only ones receiving true
bilingual education before Proposition 227, they are the only ones being waivered after 227.
Indeed, the flow chart in Figure 3.3 is still valid in California after the implementation of
Proposition 227.
If anything, there is more difference between the process for Spanish speakers and
speakers of other languages after Proposition 227 than there was before. Since there is no need
to persuade Chinese parents to come in and visit the school to sign waivers to be in “bilingual”
education when the bilingual education they are in is legal under Proposition 227, I expect these
labels to change. 28 In most cases, the programs will disappear. In some cases, they will continue
because they serve important social functions such as preserving the child’s culture or protecting
Asian students from low income black and Hispanic students.29
Figure 4.1 also depicts how schools create supply by how they define eligibility to be
waivered. Although it is the district that defines who is English Learner, it is the school that
decides who is to be recruited for a waivered bilingual education class. They can create greater
28 Since San Francisco is not implementing 227, the Cantonese bilingual education classes have continued with the same label. Nevertheless, these classes are in compliance with 227 despite their label. 29 About a decade ago I had a conversation with a Chinese vice-principal in a predominantly black and Hispanic Bay Area school district about the motivation behind enrolling children in a Chinese bilingual education program that was taught completely in English. I was told quite simply that the Chinese parents demanded it as a way to keep their children separate from the tougher black and Hispanic students. See also, Zhou, 1995; 1998 for the same point.

Broadly
Narrowly
# Waivered Students
Classroom distribution oflow level English language
students
Define eligibility(low level English language
ability)
Clustered Within
Scattered Across
# Waivered Classrooms
Public meetings with parentsto explain benefits
Many
Few
Telephone calls to parentsto explain benefits
Many
Few
Classroom Conversion Rule
+
-
+
-
+
-
+
-
+
+++-
+
Figure 4.1A Supply and Demand Model of the Process of Creating Waivered Bilingual Education Students and Waivered Bilingual Education
Classrooms Under Proposition 227
> 20 Hispanic LEP Students in a grade and no districtwide policy of English instruction
Assigned to mainstream or maximum English Structured English Immersion,
waivered BE not an option
Interpretation: School staff create supply and demand, modified by parent negotiation
Extraordinarymajority; remaining
parents asked toconvert or change
teachers
Simple majority,remaining parents
asked to convert orchange teachers
None
no
yes
DE
MA
ND
FA
CT
OR
SSU
PPL
Y F
AC
TO
RS

63
or fewer numbers in such classes by the level of English language achievement they choose as
the criterion for assignment.
In addition, the classroom distribution of low achieving students can affect how many
students are waivered. If the sheltered English immersion classes are formed on the first day so
that the lowest level Spanish speaking English Learners in a grade are in the same classroom
then it is much easier to convert the whole classroom to waivered bilingual on the 31st day. If the
lowest level Spanish speaking English Learners are scattered across classrooms, it is harder to
convert them to waivered bilingual because it means another reorganization of the classrooms.
The district staff in both Los Angeles and San Diego suggested to principals that students who
were recommended for bilingual education in 1998-99 be placed in the 30 percent native tongue
classes. If principals took their advice, this also had the effect of making it easier to convert an
entire classroom to waivered bilingual.
The next two variables in the supply-demand model shown in Figure 4.1 reflect the
extent of outreach to parents. Outreach includes the number of public meetings with, and
individual telephone calls to, parents to explain the benefits of bilingual education. Obviously,
individual telephone calls are more effective than public meetings. In every school I visited in
1999, teachers explained to me how hard they worked at convincing parents and how effective
calling them personally was. All of these variables will influence the number of students who
are waivered.
But the number of students who are waivered does not necessarily translate into waivered
classrooms. The latter also depends on the number of Hispanic English Learners in a school and
the classroom conversion rule. There are two possible classroom conversion rules. The first is
that when a simple majority of waivered students is obtained for a given teacher and classroom,

64
the other parents are called and told that if they do not sign a waiver, their child will have to
change teacher. The second possibility is that the telephone calls are not made until an
extraordinary majority of waivered students is obtained. These telephone calls are very effective
in converting additional parents because most parents do not want their child’s education to be
disrupted by changing classrooms and many of them care more about that than they do about the
language of instruction, if they understand the language of instruction at all.
Thus, the number of bilingual waivered students and bilingual waivered classes is not
necessarily indicative of parent support for bilingual education. Rather it seems to reflect staff
support for bilingual education and to some extent parent support for staff. Although it has been
suggested that some teachers may have obtained waivers to protect themselves and their schools
from legal liability, this is probably not an important explanation. The number of waivers at the
elementary school level did not decline in the second year and third years when it became clearer
what the law actually required and that teachers in practice would not be sued for the use of the
native tongue in the classroom.
Some parents resisted the staff, or the staff didn’t work very hard to convert parents,
because in many schools it was not possible to form entire classrooms of waivered students. In
one school I visited, the former bilingual education teacher gave a passionate defense of
bilingual education and explained how hard she had worked to get her parents to sign waivers.
The state database confirms this. It showed an increase from 30 students in bilingual education
in 1997-98 to 53 in 1998-99.
But when I asked “So, these students are all being taught to read and write in Spanish
now?” I was told they were not. Amazingly, none of these 53 waivered students were being
taught in Spanish in a self-contained bilingual education class. They were learning to read and

65
write in English in a mixed waivered/mainstream classroom. The teacher’s explanation for this
was that she did not have enough waivered students to form a whole bilingual education
classroom at each grade. Since she was the Reading Recovery teacher, she felt her students
would be better off being taught to read and write in English because if problems arose she could
do reading recovery. I then asked her about her legal obligation to the parents whom she had just
convinced to sign waivers. She said that this was no problem because these parents, who had
only recently agreed that their child was better off in a Spanish bilingual education program, had
been called by the teacher and all had verbally consented to have their children taught to read
and write in English after all. Nevertheless, they remain in the state database as "waivered."
Other teachers and principals told me similar stories. Their experience is that parents
typically look to the teachers and principals as their authority and most of them are willing to
comply with whatever educational decision is made for their child by these authorities whether it
is bilingual education or all-English instruction. It is a minority of parents who have independent
opinions on educational issues, even the language of instruction, if they even understand the
issue.
In several of the elementary schools I visited, the principal or bilingual education
coordinator was able to provide me with data on the exact number of waivered students by
language group in each classroom. All were Spanish speakers. These data, shown in Figure 4.2,
indicate that in School 1 all of the waivered students were in mainstream classes, although the
state data showed them to be in bilingual education. In School 2, 33 percent of the waivered
students were in mainstream classes, although the state data showed that 98 percent of the
waivered students were in bilingual education in 1998-99 and 31 percent in September 2001.30
30 This is determined by comparing the number of English Learners in bilingual education in Part II to the number of English Learners who are waivered in Part I of the Language Census.

100%
33%
10%
0% 0%
0%
10%
20%
30%
40%
50%
60%
70%
80%
90%
100%
% o
f W
aive
red
Stud
ents
School 1 School 2* School 3** School 4 School 5
Observed Elementary Schools
Figure 4.2Percentage of Waivered Students in Mainstream Classrooms in Observed Hispanic Elementary Schools,
California, 1998-99
Language Census Reports
0%
Language Census Reports 2%
* The % of waivered students in mainstream classrooms in 2001 is 31%** School is 100% sheltered English immersion as of Fall 2001.

0%
10%
20%
30%
40%
50%
60%
70%
80%
90%
100%
% o
f St
uden
ts in
Eac
h C
lass
room
1 2 3 4 5 6 7 8 9 10 11 12 13 14 15 16 17 18 19 20 21 22 23 24 25 26 27 28 29 30 31
31 Classrooms With Waivered Students
Figure 4.3Percentage of Students Who are Waivered in 31 Classrooms Containing Waivered Students
in One Elementary School in Los Angeles Unified, 1998-99 and September 2001*
* 38% of Hispanic LEP students are waivered in 1998-99 and 13% in September 2001.
66
In School 3, 10 percent of the waivered students were in mainstream classes which agrees with
the state data. School 4 had none of its waivered students in mainstream classes which also
agreed with the state data. School 5, however, also had none of its waivered students in
mainstream classes, but the state database indicated 29 percent were in mainstream classes. Only
40 percent of the schools on which I had data had all of their waivered students in bilingual
education classes. Thus, some unknown percentage of waivered students were getting a program
other than bilingual education, but it was showing up in the state database as bilingual education.
Figure 4.3 shows the distribution of waivered students in one elementary school in Los
Angeles in Spring 1999 and in September 2001. This school had the largest number of waivered
students of the schools I visited in 1999. But, in 1998-99, only 15 of the 31 waivered classrooms
consisted of nothing but waivered students and in September 2001 only 2 of the 31 classrooms
consisted of nothing but waivered students. This is important information because it is only in
the 100 percent waivered classrooms that there is a high probability that the students are actually
receiving bilingual education.
In one mixed classroom that I was in 1998-99, the teacher was assisting some students
with Spanish and others with English reading and writing and going back and forth between the
two. Whole-class instruction, however, was now mostly in English whereas previously it would
have been in Spanish. Although the state statistics in 1998-99 showed the dozen waivered
students in a bilingual education classroom, they were not. In short, in the schools I visited, the
state data overestimated bilingual education enrollment because once a student was counted as
waivered, the schools did not “unwaiver” them when they could not form a bilingual education
classroom. Thus a "waivered" student may not necessarily be in a bilingual education classroom
despite what the state database says.

67
Of course, the opposite is also true. At least in San Diego, the state database will show
English Learners in sheltered English immersion classrooms that are taught 100 percent in
Spanish during the first 30 days and by the end of the year at least half or more of the day in
Spanish, including Spanish literacy instruction. This may be more instruction in English than
occurs in Spanish bilingual classes, but it is not enough for a sheltered English immersion
classroom. In my opinion, the San Diego public schools are flouting the law and yet no one has
called them to task for this. The Superintendent of the San Diego City Unified School District
seems oblivious to this since he continues to make statements supporting English language
instruction for English Learners. The public watchdogs are apparently interested only in
complaining about school districts that they believe are denying bilingual education to English
Learners (e.g. Oceanside) or that are not adequately informing parents of their right to a waiver
(e.g. Oceanside). There have been no complaints about school districts that are denying
sheltered English immersion to English Learners nor of teachers that are recruiting parents to
come in and sign waivers.
One interesting finding from my 1999 teacher interviews conducted in April and May is
that the teachers I spoke to in Spanish bilingual education classes believed they were using more
English than in the past. Two reasons were given for this. First, the Proposition 227 vote
expressed the preferences of the electorate for a greater emphasis on English. Many teachers
stated they were being responsive to their clients by increasing the English in bilingual
education. Second, because there is no guarantee that a waivered class can be assembled for the
next grade in the next year, teachers in bilingual education classes told me they were preparing
their students for the possibility they would unexpectedly be in an English language classroom at
the start of the next year.

68
In Fall 2001, I asked several of the former bilingual education teachers who were now
teaching in English in sheltered English immersion classrooms how sheltered English immersion
compared to bilingual education and whether they would ever go back to bilingual education.
Not a single teacher said they would go back to bilingual education if they were given a chance.
All preferred sheltered English immersion, despite the fact that they thought it was harder work
for them as teachers. A recurring theme was that “bilingual education was a good theory, but in
practice it just didn’t work very well.” One problem that bilingual education had to deal with
was the fact that because many students change their residence from year to year, and even
within a year, they could find themselves in bilingual education in one school, all-English in the
next, and back to bilingual education in a third school.
Indeed, that can still happen under Proposition 227. It is possible for a child to be in a
waivered bilingual education classroom in one school, move and find themselves in sheltered
English immersion in the next school. This occurs less often if the whole school district has
converted to sheltered English immersion since a lot of mobility is within a single district. But it
will still occur when a student moves from one school district to another.
The teachers in Oceanside Unified School District, visited in September 2001, were
especially happy with sheltered English immersion. The entire district had adopted sheltered
English immersion upon the opening of school in September 1998. One teacher said she had
never worked harder in her life, but the benefits had never been greater. Not only were her
students learning English quickly, but the curriculum in the district was now coordinated in a
way it had not been under bilingual education. Indeed, all of the teachers I talked to in
Oceanside mentioned that one benefit of Proposition 227 was that “everyone was on the same
page.” The school district had curriculum standards and materials that were now basically the

69
same for everyone. English Learners could be transferred from a sheltered English immersion
classroom to a mainstream classroom and the curriculum would not change appreciably. A
student could similarly transfer from one school to the next within Oceanside and not be in any
danger of having their program changed from bilingual education to sheltered English immersion
and back again. This was a theme that I did not hear in the other districts I visited. Although
teachers in other districts were surprised and pleased at how fast their English Learners were
learning English, and some remarked on how it made the eventual transition to an English
language classroom easier, they did not emphasize the improvement in curriculum coordination
the way it was emphasized in Oceanside because in fact they were still in schools and in districts
with a mix of bilingual and sheltered English. It is clear to me that, at least in terms of teacher
satisfaction, there is an advantage to having the whole school district convert to sheltered English
immersion because it enables the school and the district to have a coordinated curriculum. As
was pronounced frequently in Oceanside, “everyone is now on the same page.”
Across all of the schools that I visited in Spring 1999 and Fall 2001, several themes
emerged on how well structured English immersion was going. First, former Spanish bilingual
education teachers were impressed by how quickly their Spanish speaking English Learners in
kindergarten and first grade learned English and learned to read in English.31 They were also
surprised at how much they themselves liked teaching in a sheltered English immersion
classroom, although they had never worked harder. Those that were asked in 2001 if they would
ever want to return to teaching in a bilingual education classroom all responded with a
resounding no. Bilingual education was a good theory they claimed, but in practice it had too
many problems, which they attributed to a lack of support, materials, and teachers not to the
program or theory itself.

70
Second, these same teachers were amazed at how much their younger students liked
English and how proud they were of learning it. Third, the Cantonese bilingual teachers saw
Proposition 227 as a non-event. In their minds, nothing had changed. Finally, in 1999 several of
the former Spanish bilingual education teachers, although impressed by their students’ short-term
progress and pride in learning English, were worried about the long-term effect of learning
English literacy first. They worried that the proponents of bilingual education were correct that
English Learners would suffer a cognitive disadvantage if they are not taught literacy in their
native tongue. In short, the former Spanish bilingual teachers were pleased at how well things
seemed to be going, but worried about the long term consequences. The smaller number who
were interviewed in 2001, however, did not express such worries. Three years of apparent
success had quieted their fears.
In general, I would conclude that, despite some residual uneasiness about the future and
an unwillingness to renounce the theory of bilingual education, former bilingual education
teachers love sheltered English immersion. They perceive themselves as giving their students
the sheltered, nurturing environment that they believe only a bilingual education teacher can
provide, and providing an adequate exposure to English that they worried was lacking in the
bilingual education programs they used to teach in.
The pride in learning English that was observed in the children by the sheltered English
immersion teachers may explain why the research shows that bilingual education has, on
average, no effect on the self-esteem of Spanish speaking English Learners (see literature
reviews by Rossell and Ross, 1983; Baral, 1983; Rotberg, 1983; Alexander and Baker, 1992).
On the one hand, bilingual education elevates the language of the home to a higher status than it
would ordinarily have and common sense would suggest that this would have a positive impact
31 See Haager, et al., 2001 for a similar conclusion.

71
on the self esteem of the children enrolled. On the other hand, it is just not possible for bilingual
education to raise the language of the home to the status of English since English is the language
of this country and the home language is not. The students in these programs thus receive two
contradictory messages: 1) the language of your home is important enough for it to be the
language of the classroom, and 2) you are not ready to be instructed in the language of this
country and this school, the language of power and prestige, and you must be segregated from
the English speaking students for many years. The latter negative message may counteract the
positive effect of the first message which may explain why the most common outcome is
typically no difference in self-esteem between students enrolled in bilingual education and those
enrolled in a mainstream classroom.
There is a grade progression in the percentage waivered into bilingual education.
Teachers put most of their energy into converting the early grade students where literacy
instruction begins. As shown in Figure 4.4, among the schools I visited in 1998-99 and again in
September 2001, the percentage with waivered students declined with each grade. Although
there are waivered students at the secondary level in these districts and statewide, there were
none in the schools visited.
Trends in Bilingual Education Enrollment
The effect of Proposition 227 on program enrollment, using the old categories is shown
in Figure 4.5. The underlying data is in Table F.1 in Appendix F. Pre and post Proposition 227
comparisons can only be made with the old program categories. The percentage of English
Learners enrolled in bilingual education was about 33 percent until 1993-94 when it declined by
5 percentage points to 28 percent. In 1998-99, it plummeted to 12 percent with the

100%100% 100%100%
75%
100%
50%
100%
25% 25% 25%
0% 0% 0% 0% 0%
0%
10%
20%
30%
40%
50%
60%
70%
80%
90%
100%
% o
f H
ispa
nic
Scho
ols
K 1 2 3 4 5 6 7 8Grades
Figure 4.4Percentage of Observed Hispanic Schools with Waivered Students by Grade, 1998-99
and September 2001
1998-99
September 2001*

Figure 4.5Percentage of English Learners Enrolled in Bilingual Education (Old Category)
in California, 1989-90 to 2000-01
11%
39%
15%
11%
29%
30%30%28%
33%33%34%33%
30%
12%
16%
40%
15%
0%
5%
10%
15%
20%
25%
30%
35%
40%
45%
50%
55%
60%
1989-90 1990-91 1991-92 1992-93 1993-94 1994-95 1995-96 1996-97 1997-98 1998-99 1999-00 2000-01
All Schools
Elementary Schools
Prop
ositi
on 2
27

72
implementation of Proposition 227, but not to zero as many had hoped. In 1999-00, it only
declined one more percentage point to 11 percent where it remained in 2000-01.
The decline for elementary schools, using the old program categories, is more dramatic,
but again bilingual education was not eliminated. As shown in the top line of Figure 4.5 and in
Table F.2 in Appendix F, the percentage of elementary English Learners enrolled in bilingual
education dropped by 24 points to 15 percent in 1998-99, rose slightly to 16 percent in 1999-00,
and went back to 15 percent in 2000-01.
Figure 4.6 compares the percentages of elementary English Learners enrolled in each of
the six programs for English Learners for two years before and three years after Proposition 227
using the old categories. About 7 percent of elementary English Learners are enrolled in ESL
pullout (English Language Development), another 9 percent are receiving no services or some
other service,32 and this has changed very little since Proposition 227. The big increases have
occurred in sheltered English (SDAIE) and English with L1 support. Although in principle
Proposition 227 requires that everyone not in bilingual education be enrolled in sheltered
English, according to these data only 36 percent of elementary English Learners are.
Figure 4.7 displays the same analysis for secondary students. About 10 percent of
secondary English Learners were enrolled in bilingual education before Proposition 227 and
about 3 percent after. There has been a small increase in sheltered subject enrollment, but only
about a third of secondary English Learners are enrolled in the sheltered English program
mandated by Proposition 227.
Figures 4.6 and 4.7 demonstrate that bilingual education after Proposition 227 is
essentially an elementary school program. There are very few secondary students enrolled in
32 The state only began using “other services” in 1998-99. Prior to that there were two residual categories called “withdrawn” and “none.” It is not clear which category “other services” might have been put in.

Figure 4.6Percentage of Elementary English Learners Enrolled in Each Program Model
(Old Categories) in California, 1997-98 to 2000-01
40%
15%
9%
24%
13%
39%
18%
8%
24%
11%
15%
27%
7%
40%
11%
16%
32%
6%
10%
15%
36%
7%
33%
9%
36%
0%
10%
20%
30%
40%
50%
60%
Bilingual Education Sheltered English English Lang. Dev. English with L1 Support Total Other or None
96-97 (Pre)97-98 (Pre)98-99 (Post)99-00 (Post)00-01 (Post)

Figure 4.7Percentage of Secondary English Learners Enrolled in Each Program Model
(Old Categories) in California, 1997-98 to 2000-01
10%
29%
17%18%
27%
10%
29%
18%17%
26%
4%
32%
18% 19%
3%
34%
18%
16%
30%
3%
36%
18%
15%
28% 28%
0%
10%
20%
30%
40%
50%
60%
Bilingual Education Sheltered English English Lang. Dev. English with L1 Support Total Other or None
96-97 (Pre)97-98 (Pre)98-99 (Post)99-00 (Post)00-01 (Post)
73
bilingual education, despite the fact that Proposition 227 makes it legal for school districts to
offer bilingual education to students older than 10 without any documentation of special need as
must occur with younger children.
Figure 4.8 directly compares program enrollment in 1999-00 for elementary and
secondary students using the new state categories. According to the language census, 54 percent
of elementary English Learners are enrolled in Structured English Immersion. This is more than
20 points higher than the percentage of elementary English Learners enrolled in SDAIE, labeled
Sheltered English in the figures based on the old state categories. Thus, some school district
officials apparently view Structured English Immersion as different from SDAIE.
Interestingly, almost 21 percent of elementary English Learners and 49 percent of
secondary English learners are in a mainstream classroom because they meet the criteria of
having achieved “a good working knowledge” of or “reasonable fluency” in English, although
they have not achieved the test score that would get them reclassified. This fact only
underscores the problems with the exit criteria—there are English Learners with a good working
knowledge of English, who nevertheless cannot be reclassified because they have not achieved
the test score criterion.
The above statistics are totals for the state. If we look at the range of the school districts
affected, we find that the impact of Proposition 227 was widespread. There were 904 school
districts in California in 1997-98. Of these, 495 or 55 percent, had no students enrolled in
bilingual education. Among the 409 school districts in California that had at least some students
enrolled in bilingual education before Proposition 227, 66 percent had a 50 percent or greater
reduction in bilingual education, 47 percent eliminated their bilingual education programs
entirely, and almost 90 percent had at least some reduction in bilingual education.
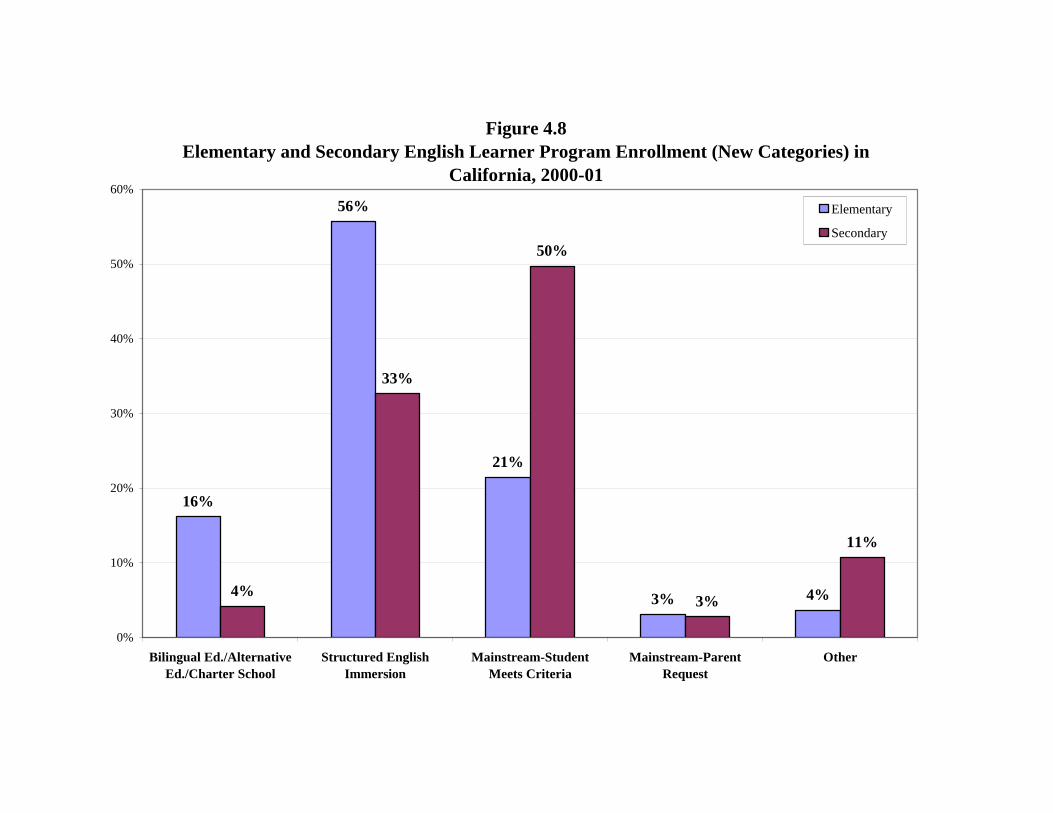
Figure 4.8Elementary and Secondary English Learner Program Enrollment (New Categories) in
California, 2000-01
16%
56%
21%
3% 4%4%
33%
50%
3%
11%
0%
10%
20%
30%
40%
50%
60%
Bilingual Ed./AlternativeEd./Charter School
Structured EnglishImmersion
Mainstream-StudentMeets Criteria
Mainstream-ParentRequest
Other
Elementary
Secondary

74
Los Angeles, San Francisco, and San Diego, are shown in Figure 4.9 and 4.10 and in
Appendix F, Tables F.3 through F.8. We can see that there is quite a bit of difference among
them in the effect of Proposition 227. Using the old program categories, the data clearly indicate
that San Francisco Unified did not implement Proposition 227 in the first year, but the
percentage enrolled in bilingual education declined by seven more points in 1999-00 and another
point in 2000-01. Individual schools deviated a little, but not a lot, from the central
administration's position that they could ignore Proposition 227. One principal in a San
Francisco elementary school with a Chinese bilingual education program33 incorrectly
interpreted 227 as giving her permission to mainstream all of her Chinese English Learners since
she no longer had to pretend they were teaching them in Cantonese. As of 1999-2000 year there
were no students enrolled in bilingual education in that school, compared to 120 the year before
and 109 the year after Proposition 227.
The real effect of Proposition 227 is on the Spanish speaking English Learners because
they are the only English Learners in bilingual education who had a change in their language of
instruction. Los Angeles shows the largest drop in bilingual education enrollment from 34
percent to 5 percent across all grades with the implementation of Proposition 227. At the
elementary level, the drop is from 46 percent to 8 percent in 1999-00.
None of the districts have much bilingual education enrollment at the secondary level.
Even San Francisco has only 14 percent of its secondary students enrolled in bilingual education.
The other two districts have 2-3 percent, as does the state as a whole.
33 Although California does a better job than most states in distinguishing between the different Chinese languages in their statistics, the people who administer and teach in the programs do not make these distinctions. Since they teach in English, it is not important to them to distinguish between Cantonese and Mandarin programs. In their conversations with me, the teachers and principals universally called their programs, "Chinese" bilingual education--in other words, programs for English Learners from China.

Figure 4.9Percentage of Elementary English Learners Enrolled in Bilingual Education in Los
Angeles, San Diego, San Francisco and State, 1996-97 to 2000-01
40%
45% 44%
55%
39%
46%
43%
54%
15%
5%
26%
52%
16%
8%
38%
47%
15%
7%
40%
46%
0%
5%
10%
15%
20%
25%
30%
35%
40%
45%
50%
55%
60%
STATE Los Angeles San Diego San Francisco
1996-97 (Pre)1997-98 (Pre)1998-99 (Post)1999-00 (Post)2000-01 (Post)

Figure 4.10Percentage of Secondary English Learners Enrolled in Bilingual Education in Los
Angeles, San Diego, San Francisco and State, 1996-97 to 2000-01
10%9%
12%
16%
10%11%
14%
25%
4% 4%
1%
26%
3%2% 2%
16%
3%2%
3%
14%
0%
5%
10%
15%
20%
25%
30%
STATE Los Angeles San Diego San Francisco
1996-97 (Pre)1997-98 (Pre)1998-99 (Post)1999-00 (Post)2000-01 (Post)

75
To some extent Los Angeles' adherence may be a little misleading, since Model B of
Structured English Immersion is characterized by up to 30 percent of instruction in Spanish. In
fact, on June 30, 1999, a grand jury found that Model B was in violation of Proposition 227. But
San Diego has a “30 percent native tongue” program that appears to use more than 30 percent
Spanish in instruction and, more importantly, specifically includes Spanish literacy. San Diego
experienced a fairly large drop in bilingual education enrollment in the first year, but is now
approaching pre-Proposition 227 levels with 40 percent of its elementary students enrolled in
bilingual education. Indeed, at this level it is only 6 points below San Francisco which claims it
can ignore Proposition 227.
I visited many Model B classrooms in Los Angeles and I found them to be substantially
different from a typical Spanish bilingual education classroom, and very different from San
Diego’s so-called sheltered English immersion program, in that they do not teach Spanish
literacy. Students learn to read and write in English and the teachers I talked to were quite
emphatic about this being necessary for compliance.
I agree with the teachers that these programs are in compliance. Using Spanish to explain
and clarify when teaching English literacy is not the same as teaching Spanish literacy itself.
The amount of time it takes to master Spanish reading, and in particular, Spanish writing, is time
taken away from English. Spanish literacy may be easier to achieve than English literacy for a
Spanish speaking child who does not speak English, but it is not effortless. Spanish literacy is a
time consuming, difficult process for Spanish speakers just as English literacy is a time
consuming, difficult process for English speakers. In the 30 percent native tongue programs in
Los Angeles, Spanish literacy is avoided and Spanish is a bridge to English, not an end. As a
result, it is my opinion that these programs are in compliance with the spirit of sheltered English

76
immersion programs. I do not believe that is the case with the San Diego programs, however,
because they teach Spanish literacy.
A conversation I had with a Spanish bilingual education program teacher in San Diego
who was teaching in a waivered bilingual education classroom illustrates the difference between
using Spanish as an aid to instruction and teaching Spanish literacy. I asked this teacher if she
was using more English or about the same as she did last year at this time (April) when she
taught a similar bilingual education class. She said she was definitely using more English. But
she did not want to attribute it entirely to the message sent by the voters as many other teachers
had. She said the difference was due to the fact that last year at this time her students were at
such a low level in Spanish literacy that she felt she could not transition them to English.
And that is the core of the problem with the theory behind bilingual education. If you
take it literally—that students must become fully literate in their native tongue before they can be
taught English literacy—it is possible for a student to get stuck in Spanish because they cannot
reach a level that teachers consider proficient. Model B eliminates this problem because the
students are not acquiring Spanish literacy. Moreover, the research on bilingual education shows
no harm, and some benefit, from programs that are very similar to the Los Angeles 30 percent
native tongue programs.34 In short, I believe the Los Angeles Grand Jury erred in declaring
Model B in Los Angeles to be in violation of Proposition 227. I think it is a reasonable and
pedagogically sound adaptation of Proposition 227. I am not so sure about the San Diego
sheltered English immersion program, however. If it truly teaches Spanish literacy, it is in
violation of the law.
34 See for example, Gersten and Woodward (1995) which describes the success of a program that closely resembles Model B.

77
In addition to these three school districts, there are several other school districts that have
received considerable publicity for one reason or another. Figure 4.11 shows the percentage
enrolled in bilingual education in five school districts involved in litigation with the state. The
school districts that sued the state to stop the testing of English Learners are Berkeley, Hayward,
Oakland, and San Francisco.35 San Jose is the only school district that successfully sued the state
to avoid implementing Proposition 227 because of a conflicting legal obligation.
Figure 4.11 addresses two questions. The first is whether the districts that wanted to
avoid testing English Learners on the SAT 9 were districts that continued bilingual education.
The answer to that question is yes. Berkeley, Hayward, and San Francisco had virtually no
change in their elementary bilingual education enrollment with the implementation of 227 and
Oakland's bilingual education percentage actually doubled from 26 percent before Proposition
227 to 57 percent in the first year. All four districts were well above the state in elementary
bilingual education enrollment after Proposition 227 and this is probably an important reason
why they wanted to avoid testing their English Learners in English.
The second question Figure 4.11 addresses is whether the two districts--San Jose and San
Francisco--that maintained that they could not implement Proposition 227 because of conflicting
legal obligations did in fact not implement it. The answer to that question is that they partially
implemented it--San Jose more so than San Francisco. The former had a large reduction in its
bilingual education enrollment with Proposition 227 from 75 percent to 56 percent, 54 percent,
and in 2000-01 to 53. Although it was under no legal obligation to do so, San Jose asked parents
to sign waivers before their children could be enrolled in bilingual education. San Francisco also
35 The lawsuit, California Department of Education v. San Francisco Unified School District, (Superior Court of SF) was initiated by the CDE against San Francisco on April 2, 1998. SFUSD then countersued the state on May 18, 1998. Oakland, Berkeley, and Hayward then intervened against the state on their own behalf on June 24, 1998. A settlement was reached on November 20, 2000 and all districts agreed to test English Learners on the SAT9.
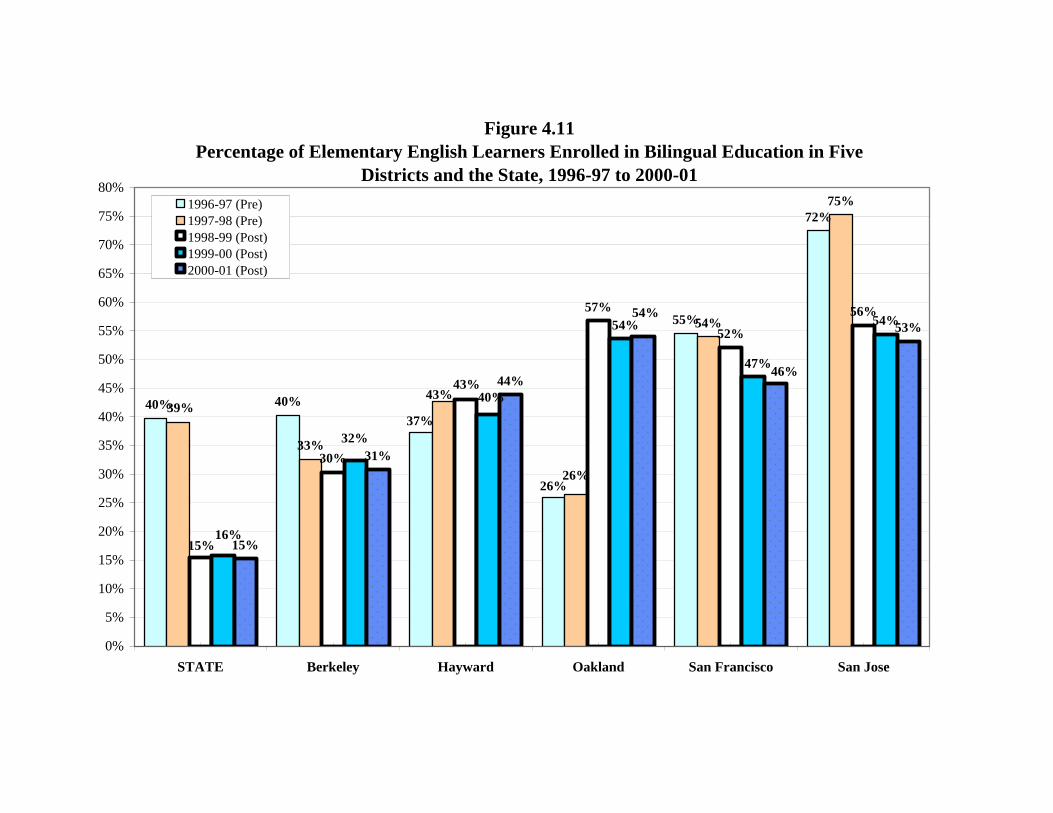
Figure 4.11Percentage of Elementary English Learners Enrolled in Bilingual Education in Five
Districts and the State, 1996-97 to 2000-01
40%
55%
72%
54%
75%
30%
57%
52%
56%54%
15%
31%
44%
53%
26%
40%37%
26%
43%39%
33%
43%
15%
32%
47%
54%
40%
16%
46%
54%
0%
5%
10%
15%
20%
25%
30%
35%
40%
45%
50%
55%
60%
65%
70%
75%
80%
STATE Berkeley Hayward Oakland San Francisco San Jose
1996-97 (Pre)1997-98 (Pre)1998-99 (Post)1999-00 (Post)2000-01 (Post)

78
experienced a small reduction in bilingual education enrollment from 55 to 47 percent. Despite
the fact that it believed it did not have to implement Proposition 227, San Francisco Unified also
asked parents to approve their child’s assignment to bilingual education, although it could be
done by mail.
Another school district that has received considerable publicity, first because of its
alleged increase in test scores, and second, because of the state complaint against it, is the
Oceanside Unified School District. Figure 4.12 compares the percentage of English Learners
enrolled in bilingual education from 1989-90 through 1999-00 in Oceanside to the state as a
whole. In the years before Proposition 227, Oceanside was well above the state enrollment in
bilingual education and in the years after well below the state enrollment in bilingual education.
Table G.1 in Appendix G shows the bilingual education and English Learner enrollment
pre and post Proposition 227 for the largest school districts in the state—those at or above 20,000
enrollment in 2000-01. That includes all of the school districts discussed above, except
Berkeley, which is a little less than 10,000 students. The largest school districts had more than
half of the bilingual education enrollment in the state.
These statistics indicate that Proposition 227 had a fairly large effect on the percentage
and number enrolled in bilingual education in these districts. There were, however, a few school
districts with substantial bilingual education enrollment before Proposition 227 that had little or
no change afterwards—San Diego Unified, Fremont Unified, Fresno Unified, Hayward Unified,
Sweetwater Union High, West Contra Costa Unified, Placentia-Yorba Linda Unified, and
Oakland Unified. As noted above, Oakland actually had an increase of 22 percentage points in
the first year of Proposition 227 and over three years the increase was 16 percentage points.
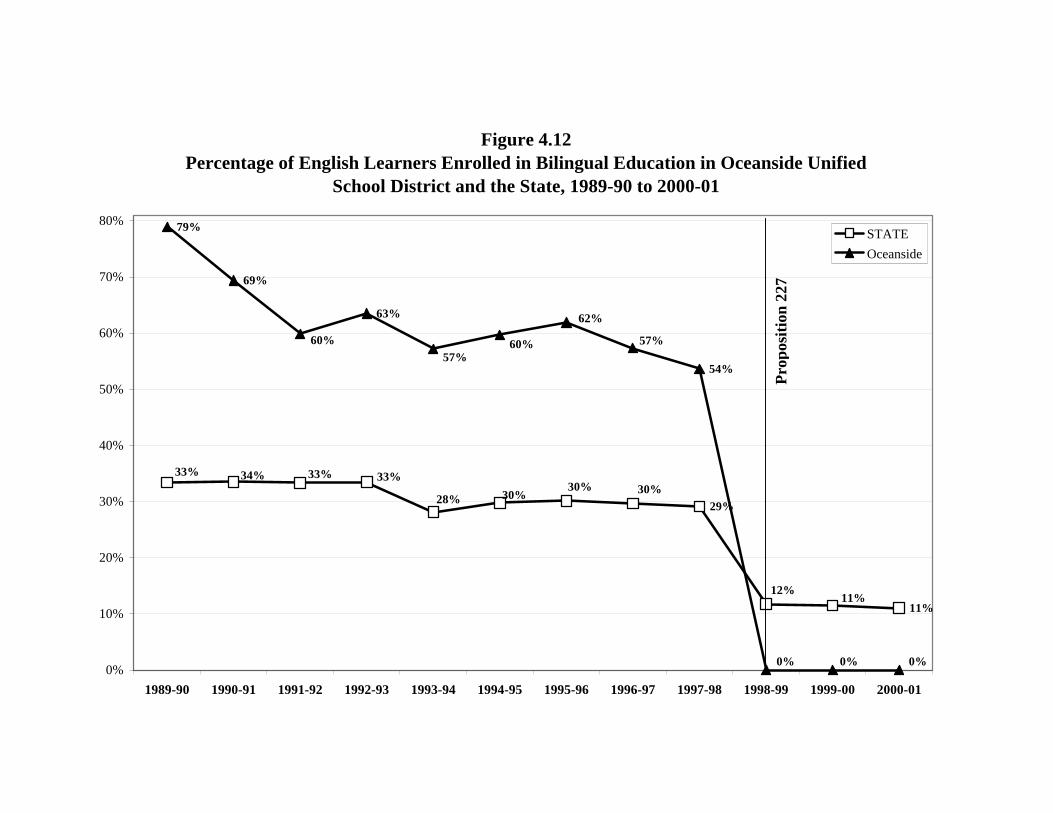
Figure 4.12Percentage of English Learners Enrolled in Bilingual Education in Oceanside Unified
School District and the State, 1989-90 to 2000-01
29%
11%
79%
69%
63%
54%
11%12%
30%
33% 34% 33% 33%
28% 30%30%
0%
60%
57%60%
62%
57%
0% 0%0%
10%
20%
30%
40%
50%
60%
70%
80%
1989-90 1990-91 1991-92 1992-93 1993-94 1994-95 1995-96 1996-97 1997-98 1998-99 1999-00 2000-01
STATE
Oceanside
Pro
posi
tion
227

79
The statistics for the entire group of large school districts are summarized in the bottom
row of the second page of Table G.1 in Appendix G. In these districts, Proposition 227 reduced
bilingual education enrollment by 156,284 students from 243,924 to 87,640 in the first year.
The percentage enrolled was reduced by 19 percentage points from 29 to 10 percent in the first
year of its implementation.
In the second year of Proposition 227, however, bilingual education enrollment increased
by 8,066 students in the largest school districts. It has remained constant at 11 percent of
English Learners enrolled in bilingual education as of 2000-01.
Table G.2 shows the same analysis for elementary schools with the summary statistics
again on the bottom row of the second page of the table.36 There was a decline of 137,626
elementary English Learners enrolled in bilingual education in 1998-99, but an increase of
10,000 in the next year in the largest school districts, only slightly offset by a decrease of 1,942in
2000-01. If we look at the percentage of elementary English Learners enrolled in bilingual
education in the largest school districts, there was a slightly greater decline than in the state as a
whole--from 39 percent to 13 percent in 1998-99, but this increased to 15 percent in 1999-00
where it remained in 2000-01. Thus, the largest school districts show pretty much the same
trends as the state as a whole--a large decline in bilingual education in 1998-99 and a small
increase in bilingual education in 1999-00 with no change in 2000-01.
36 Five of the largest school districts, Anaheim Union High, East Side Union High, Grossmont Union High, Kern Union High, and Sweetwater Union High dropped out of this particular analysis because they do not have elementary schools.

80
What Kinds of Schools Continued Bilingual Education After Proposition 227?
Bilingual education enrollment after Proposition 227 is explained by the same variables
that explained bilingual education enrollment before Proposition 227. These variables are shown
in Table 4.1, using the old program categories. As was the case before Proposition 227, the most
important explanatory variable is the number of Spanish speaking English Learners in a school.
But Proposition 227 has reduced the strength of the relationship between the number of Spanish
speaking English Learners and the number enrolled in bilingual education from a Beta of .95 to
.66 for elementary schools and from .67 to .47 for secondary schools. The explained variation
has declined from .78 for elementary schools in the year before Proposition 227 to .28 in 2000-
01 and from .45 for secondary schools in the year before Proposition 227 to .19 in 2000-01.
As shown in Figure 4.13 for all students and 4.14 for elementary students, the percentage
enrolled in bilingual education increases as the number of Spanish speaking English Learners
increases just as it did before Proposition 227. The range, however, has been reduced from four
to 38 percent before Proposition 227 to two to 15 percent after Proposition 227 across the same
groups.
Figure 4.14 shows the same analysis at the elementary level. Although the percentages
are higher, there is a similar relationship between the number of Spanish speakers in a school and
the number enrolled in bilingual education. There is also a reduction in the range with
Proposition 227. There is a difference in that at the elementary level, schools with more than
240 elementary Spanish speaking English Learners experienced an increase of five percentage
points, from 15 to 20 percent, in the percentage enrolled in bilingual education in 1999-00, which
changed little in 2000-01.

Signif. Signif.Dependant Variable= Mean b Beta t Level Mean b Beta t Level
Number in Bilingual Education 1999-00 30 7Constant 26.229 7.63 0.000 * -0.045 -0.05 0.962Number Spanish EL Students, 1999-00 165 0.250 0.66 30.87 0.000 * 161 0.053 0.47 19.92 0.000 *Number of Vietnamese EL Students, 1999-00 5 -0.116 -0.02 -1.83 0.067 5 -0.054 -0.04 -2.20 0.028 *Number of Hmong EL Students, 1999-00 3 0.054 0.01 0.87 0.383 4 0.048 0.04 1.68 0.093Number of Cantonese EL Students, 1999-00 3 0.556 0.11 8.52 0.000 * 3 0.175 0.11 5.21 0.000 *Number of Philipino EL Students, 1999-00 2 0.113 0.01 0.65 0.515 3 0.171 0.05 2.53 0.012 *Number of Khmer EL Students, 1999-00 2 0.201 0.02 1.92 0.055 3 -0.083 -0.04 -1.94 0.053Number of Korean EL Students, 1999-00 2 -0.088 -0.01 -0.98 0.327 2 0.039 0.01 0.70 0.485Number of Armenian EL Students, 1999-00 1 -0.111 -0.02 -1.89 0.059 2 -0.049 -0.04 -2.12 0.034 *Number of Mandarin EL Students, 1999-00 1 -0.646 -0.04 -2.76 0.006 * 2 -0.113 -0.04 -1.74 0.082Number of Laotian EL Students, 1999-00 1 1.528 0.06 4.65 0.000 * 1 -0.134 -0.02 -0.89 0.376Total Enrollment, 1999-00 611 -0.043 -0.14 -7.81 0.000 * 1065 -0.002 -0.06 -2.46 0.014 *Percentage Eligible Free or Reduced Lunch, 1999-00 43 -0.318 -0.11 -6.86 0.000 * 33 -0.009 -0.01 -0.63 0.528
Adjusted r2 0.28 0.19
N 5,074 2,583
* Statistically significant at .05 or better.
SECONDARYELEMENTARY
Table 4.1Predictors of the Number of English Learners (EL) Enrolled in Bilingual Education
in Individual Schools in California After Proposition 227, 2000-01

Figure 4.13Percentage of English Learners in Bilingual Education in California Schools Pre and
Post Proposition 227 by Number of Spanish Speaking English Learners, 1997-98 to 2000-01
38%
26%
9%
4%
15%
11%
4%3%
15%
10%
4%2%
14%
10%
4%2%
0%
10%
20%
30%
40%
50%
240+ 120-239 30-119 0-29
Number of Spanish Speaking LEP Students in School
% in
Bili
ngua
l Edu
catio
n
Pre (1997-98)Post (1998-99)Post (1999-00)Post (2000-01)

Figure 4.14Percentage of Elementary English Learners in Bilingual Education in California Schools
Pre and Post Proposition 227 by Number of Elementary Spanish Speaking English Learners, , 1997-98 to 2000-01
50%
35%
12%
4%
15% 15%
6%4%
20%
14%
5%3%
13%
6%
3%
19%
0%
10%
20%
30%
40%
50%
240+ 120-239 30-119 0-29
Number of Elementary Spanish speaking LEP Students in School
% in
Bili
ngua
l Edu
catio
n
Pre (1997-98)Post (1998-99)Post (1999-00)Post (2000-01)

81
In short, despite the reduction in bilingual education, there is still a strong and significant
correlation between the bilingual education enrollment in a school before and after Proposition
227. The data in Table 4.2 indicate that schools which had larger numbers and higher
percentages of students enrolled in bilingual education before Proposition 227 also had larger
numbers and higher percentages enrolled afterwards.
Table 4.3 shows the same analysis for districts. The school districts with greater
bilingual education enrollment before Proposition 227 had greater bilingual education enrollment
afterwards. Thus, although Proposition 227 reduced bilingual education, it did not end it.
Schools with greater numbers of Spanish speaking English Learners had more students enrolled
in bilingual education before and after Proposition 227. Schools and school districts with more
English Learners enrolled in bilingual education before Proposition 227 had more English
Learners enrolled in bilingual education after Proposition 227. In addition, although bilingual
education enrollment declined dramatically in the first year after Proposition 227, it increased
slightly in the second year where it basically remained in the third year, particularly in the
schools with large numbers of Spanish speakers.

Number 1998-99
Number 1999-00
Number 2000-01
% Enrolled 1997-98
% Enrolled 1998-99
% Enrolled 1999-00
% Enrolled 2000-01
Number 1997-98 .60* .64* .61* .74* .44* .46* .44*
% 1997-98 .52* .51* .51* .61* .62* .59*
*Statistically significant at .01 or better.
Schools
Table 4.2Correlation Between Number and Percentage of English Learners
Pre and Post Proposition 227 in California SchoolsEnrolled in Bilingual Education

Number 1998-99
Number 1999-00
Number 2000-01
% Enrolled 1997-98
% Enrolled 1998-99
% Enrolled 1999-00
% Enrolled 2000-01
Number 1997-98 .73* .83* .78* .15* .11* .12* .09*
% 1997-98 .29* .26* .27* .60* .59* .47*
*Statistically significant at .01 or better.
Schools
Correlation Between Number and Percentage of English LearnersTable 4.3
Pre and Post Proposition 227 in California School Districts Enrolled in Bilingual Education

82
5. Did Bilingual Education Harm English Learners in California?
Proposition 227 was predicated on the assumption that English Learners had been greatly
harmed by bilingual education. Article I, section 300(d) states:
WHEREAS the public schools of California currently do a poor job of educating immigrant children, wasting financial resources on costly experimental language programs whose failure over the past two decades is demonstrated by the current high drop-out rates and low English literacy levels of many immigrant children;…
Yet, the California State Department of Education supported bilingual education for almost
three decades from 1972 to 1998, continuing to enforce the provisions of the Chacon-Moscone
Bilingual-Bicultural Act after it sunsetted in 1989 until the day that Proposition 227 passed in
June 1998. Not only did the Department enforce compliance with the sunsetted act, but it
sponsored scores of pro-bilingual education reports, manuscripts, and books that provided the
theoretical and empirical foundation for bilingual education.
The critics of bilingual education were not as active or influential. They tended to base their
criticisms on personal experiences, including numerous instances of Hispanic parents being
prevented from withdrawing their children from bilingual education.37 They alleged bilingual
education was a “failure” because the immigrant children enrolled in it did not learn English.
However, an equally important source of outrage seems to have been the obstacles thrown in the
path of parents who wanted to get their children out. Indeed, this was the origin of Proposition
227. When a group of Hispanic garment workers in Los Angeles Unified School District were
unable to withdraw their children from bilingual education during the 1997-98 school year, an
37 An organization called LEAD was created by Sally Peterson in Los Angeles in March 1987 to reform bilingual education and to support parents who wanted their children taught in English. Gloria Matta Tuchman, later to be a co-chairman of Proposition 227, was an Orange County teacher who also became active during this time period and for similar reasons.

83
Episcopalian nun, Alice Callahan, organized a boycott that attracted the attention of Ron Unz.
He in turn began to think in terms of a statewide initiative to protect the rights of all Hispanic
parents who were having difficulty withdrawing their children from bilingual education.
This chapter looks at the impact of bilingual education, and its inverse, sheltered English
immersion, on academic achievement in California schools since Proposition 227 and it
summarizes research that has been conducted nationwide on the educational impact of bilingual
education. There are several reasons why the nationwide empirical research on the effectiveness
of bilingual education is important. First, the findings help us understand why bilingual
education was supported for decades. As we shall see, the evidence against it is not so strong
that it cannot be ignored. Second, we will have a better understanding of Proposition 227 and its
likely success if we understand the empirical research on which it was based. Once Ron Unz had
made the decision to draft a statewide initiative, our book, and undoubtedly others like it,38 seem
to have been the foundation for its specific characteristics. A number of our recommendations
(including some of the most controversial) are in Proposition 227. Third, the research evidence
helps us to understand the constraints on the success of Proposition 227. If bilingual education is
not the disaster its critics allege, then Proposition 227 is not going to be the salvation hoped for,
and indeed, we are already seeing a counteroffensive being mounted by the supporters of
bilingual education. Ironically, they are using the very same ammunition that was used against
bilingual education—low English Learner redesignation rates and test scores.
38 See for example, Porter (1996) and Glenn and deJong (1996).

84
Methodological Constraints: Differential Testing Rates
There is a consistent bias in virtually all evaluations that compare bilingual education to
an alternative program. Teachers can decide when their English Learners are ready to take
standardized achievement tests. Teachers in bilingual education program test their English
Learners at lower rates than do teachers in all-English programs because they believe that it is
unreasonable to administer English language tests to students who are learning literacy in their
native tongue. However, this gives the bilingual education programs an unfair advantage over
all-English programs because a much larger number of low achieving students will not be
included in the evaluation of the bilingual education program than is the case with the all-English
program. It is the lowest scoring students who are deemed not ready to be tested.
This problem exists in California with English Learners as a group and bilingual
education in particular. According to state regulations, all Limited English Proficient students
must be tested on the new statewide Stanford 9 tests which were first administered in 1997-98,
the year before Proposition 227. However, as shown in Figure 5.1, only 2/3 of English Learners
were tested in 1997-98 in reading39 and this has only increased to about 84 percent in 2000-01,
despite the state law requiring all English Learners be tested. Moreover, there is considerable
variation in testing rates between schools and school districts.40
39 Earlier versions of this report contained total testing rates for 1997-98 through 1999-00, but reading testing rates for 2000-01 only because the data for total tested did not appear to be correct for that year. In this version of the report, the reading testing rate is used for all years in order to more accurately compare trends and also, because I concluded that the reading testing rate was a more accurate reflection of the impact of bilingual education than the total testing rate which appears to be the number who took any test. In addition, I have included the math testing rate in this version of the report. 40 The testing rates are calculated by dividing the number of English Learners tested in reading in a school in May from the STAR data file and the number of English Learners enrolled in the school as reported in the March language census. The language census enrollment could have been collected any time from September to March. Hence these data may differ from each school district’s calculation of the percentage of English Learners tested since they will have up to date information on English Learner enrollment. I constructed two rules for dealing with the incongruities presented by the time differences. If the number of English Learners tested was greater than the number of English Learners enrolled, the number tested was set to the number enrolled. If the number of English Learners was greater than zero, and the number tested was blank, the number tested was set to zero. This latter rule

Figure 5.1Percentage of English Learners Tested in Reading in California Schools,
1997-98 to 2000-01
69%
79%
84%87%
66%
75%78% 80%
68%
77%81%
84%
0%
10%
20%
30%
40%
50%
60%
70%
80%
90%
100%
1997-98 (Pre) 1998-99 (Post) 1999-00 (Post) 2000-01 (Post)
Elementary Secondary Total

85
Moreover, the math testing rate, shown in Figure 5.2, in a subject which is less language
based than reading, is only a few points higher than the reading testing rate. In 1997-98, only 72
percent of English Learners were tested in math and this had only increased to 86 percent in
2000-01.
The loophole in the state law is that parents have the right to remove their child from
testing. Of course, given the lack of knowledge that parents typically have of school activities
such as this, it is more likely that the school administration asks parents to remove their child
from testing rather than the other way around.
Figures 5.1 and 5.2 also show that the testing rate is a bit lower for secondary students
than for elementary students. Currently 80 percent of secondary English Learners are tested in
reading compared to 87 percent of elementary English Learners. Similarly, 81 percent of
secondary English Learners are tested in math compared to 90 percent of elementary English
Learners. The percentage tested in both reading and math has, however, increased by about 15
percentage points since the first year of testing, 1997-98.
Figure 5.3 shows the percentage of elementary English Learners tested in reading41 in the
state and in the four districts (San Francisco, Berkeley, Oakland, and Hayward) that sued the
state to avoid testing English Learners. Of the four, only San Francisco was significantly below
the state testing rate. San Francisco, which did not implement Proposition 227, only tested 42
percent of its elementary English Learners in reading in Spring 1998. As noted above, the school
districts settled with the state on this issue and agreed to test their English Learners. By 2000-01,
the average testing rate for these school districts had increased from 64 to 84 percent, only a few
was constructed because none of the schools ever had zero tested. Schools only had a blank or a number greater than zero. This only affected a few schools and English Learners. 41 For the sake of brevity, I focus here only on the reading testing rate because I think it is the most important and the most likely to be influenced by the extent of bilingual education.

Figure 5.2Percentage of English Learners Tested in Math in California Schools,
1997-98 to 2000-01
75%
83%87%
90%
68%
76%80% 81%
72%
80%84%
86%
0%
10%
20%
30%
40%
50%
60%
70%
80%
90%
100%
1997-98 (Pre) 1998-99 (Post) 1999-00 (Post) 2000-01 (Post)
Elementary Secondary Total

Figure 5.3Percentage of Elementary School English Learners Tested in Reading in the State and the
Four California School Districts that Litigated the Requirement to Test All English Learners,1997-98 to 2000-01
42%
62%
68% 69%67%
62%64%
43%
79%
72%
90%
77%
67%72%71%
84%85%88% 87%
81%
0%
10%
20%
30%
40%
50%
60%
70%
80%
90%
100%
San Francisco Hayward Oakland STATE Berkeley
1997-98 (Pre) 1998-99 (Post) 1999-00 (Post) 2000-01 (Post)

86
points below the state level. The data for Oakland, however, is a bit erratic and one can only
wonder how trustworthy it is.
Figure 5.4 shows the reading testing rate in four other school districts that received
notoriety over their achievement. San Jose not only received publicity over their litigation
against the state, but a Wall Street Journal article (August 23, 2000, p. A22) alleged that their
test score decline was due to their failure to implement Proposition 227. Oceanside, by contrast,
has been the subject of much media speculation, including the same Wall Street Journal article
that featured San Jose, that their increase in test scores is due to their complete implementation
of Proposition 227. Of course, the state alleges just the opposite with regard to achievement in
Oceanside. The other two school districts, Los Angeles and San Diego, are in this chart because
they are important school districts in California.
This chart shows how risky it is to attribute English Learner achievement to program
enrollment using aggregate data. As shown, Oceanside's testing rate increased by 35 points in
the two years after Proposition 227 and by 31 points as of 2000-01. This means that any
observed achievement gain pre and post implementation underestimates the actual gain since
many more students are tested now, that is, the testing pool includes lower achieving students
who would not have been tested in 1997-98. Secondly, Oceanside has had one of the highest
testing rates in the state with about 90 percent of its English Learners tested in two out of the
three years since Proposition 227. Oceanside's achievement scores can only be compared to
similar school districts with similar high English Learner testing rates (or school districts made
similar by a sophisticated research design) if valid conclusions about achievement are to be
drawn.

Figure 5.4Percentage of Elementary School English Learners Tested in Reading in Four Other Large California
School Districts and the State,1997-98 to 2000-01
57%61%
69% 69%66%
89%
82%79%
77%
87%88%86%
92% 89%
83%79%
84%87%
91%87%
0%
10%
20%
30%
40%
50%
60%
70%
80%
90%
100%
Oceanside Los Angeles STATE San Diego San Jose
1997-98 (Pre) 1998-99 (Post) 1999-00 (Post) 2000-01 (Post)
87
The data on San Jose suggests that the Wall Street Journal article is wrong on two counts.
As shown earlier, although it was under no legal obligation to do so, San Jose did at least
partially implement Proposition 227. The percentage enrolled in bilingual education declined by
almost 20 percentage points in the first year of 227 and continues to decline by a few points each
year. This is only slightly less than the average decline of 24 points in the largest districts.
Secondly, the percentage tested increased by about 20 percentage points. In other words,
students who would not have been tested before Proposition 227 were now being tested. Thus,
even if nothing had changed, we would expect achievement to go down. But in fact, something
did change--bilingual education enrollment was substantially reduced in San Jose. If San Jose
had an achievement gain as a result of this or some other program change, it is quite likely that it
would be completely obscured in the aggregate data reported in the Wall Street Journal article by
the increase in the percentage of English Learners tested. Indeed, this is true for the state as a
whole and for most school districts.
Appendix H shows the testing rates in reading for English Learners in each of the Largest
School Districts in California, those at or above 20,000. These are the same districts in
Appendix G. These trends are very similar to those for the state as a whole. Two conclusions
can be drawn from these data. First, there has been an increase in English Learner testing that
may offset any gains in achievement resulting from Proposition 227. If more students are tested,
scores will go down, all other things being equal. Second, not all English Learners are tested and
this varies considerably by school district.42
42 The state Board of Education has taken notice of the fact that not all students are being tested, but instead of focusing on the group that is not being tested--English Learners--they have adopted regulations (Article 1.7, sections 1031-1038, subchapter 4, Chapter 2, Division 1, Title 5 of the California Code of Regulations) that require that schools must have 85 percent of their students tested in spring 2000 and 90 percent tested in spring 2001 or they are ineligible for state performance awards. This may have some effect on the English Learner testing rate, but it may not have a large effect since it is possible to obtain a 90 percent testing rate for all students, but still have a much lower testing rate for English Learners if the latter group is not a large portion of the district.

88
In 1997-98, 29 percent of the districts tested less than half of their English Learners in
reading and 27 percent tested less than half in math. Although testing rates have gone up, 14
percent of school districts in California still tested less than half of their English Learners in
reading and seven percent tested less than half in math in 2000-01. Under these circumstances,
the kind of casual comparisons that are made in the press of achievement pre and post
Proposition 227, and between school districts, are risky.
In addition, the bias in the achievement data is still in favor of bilingual education.
Appendix I shows an equation predicting the percentage of elementary English Learners tested
on the SAT 9 in California schools by the extent of enrollment in bilingual education in that
school controlling for school poverty and size. This is done for each of the four years and for
math in the latest year. The easiest way to interpret the relative strength of the variables is to
look at the Beta, the standardized coefficient. The number enrolled in bilingual education is
statistically significant in every year.
Figure 5.5 solves the equations in Appendix I for three categories of the extent of
bilingual education enrollment—no bilingual education, bilingual education greater than 120
students, and bilingual education greater than 240 students—and the average poverty and school
size. This yields a prediction of the percentage of students tested if a school has those
characteristics (the mean or a specific value in the case of the number enrolled in bilingual
education) for reading for all years and for math for the latest year.43
In 1997-98, the percentage of English Learners tested in reading is 70 percent in a school
with no bilingual education enrollment compared to 67 percent in a school with more than 120
students enrolled in bilingual education. This is further reduced to 63 percent when the bilingual
43 In order solve the equation shown in Appendix I, one must multiply the b coefficient by the mean or a specific value and sum the computed values for each variable and the constant.
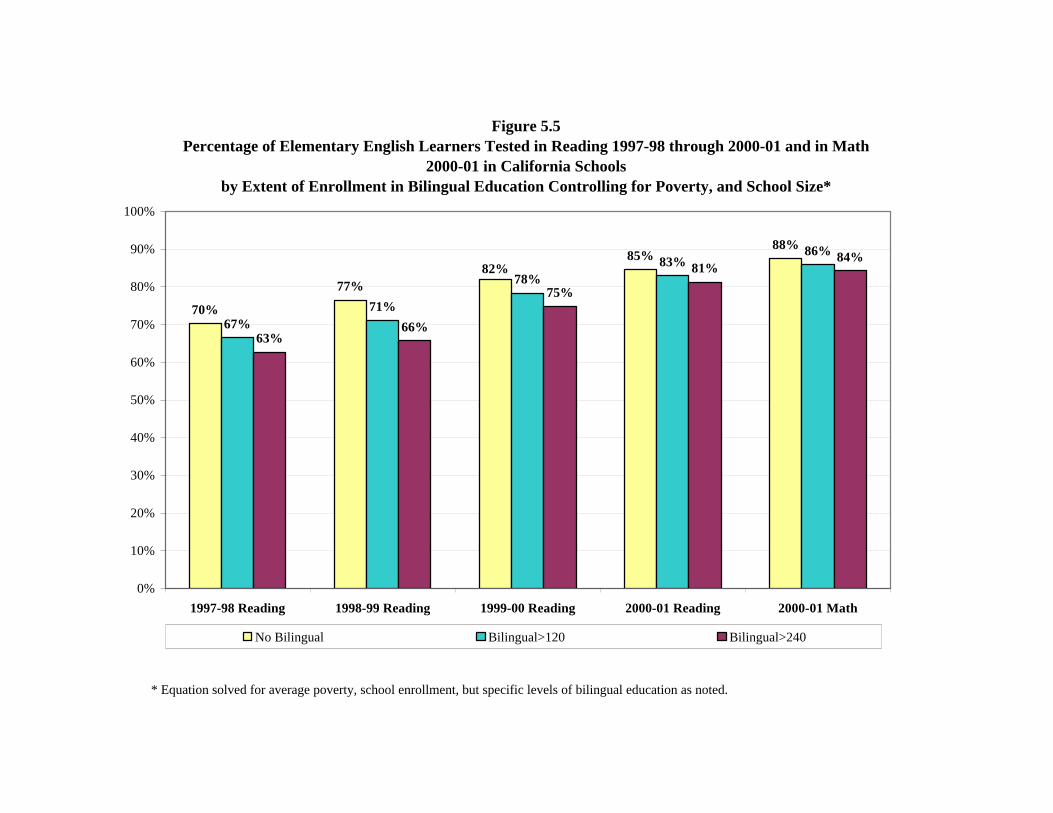
Figure 5.5Percentage of Elementary English Learners Tested in Reading 1997-98 through 2000-01 and in Math
2000-01 in California Schoolsby Extent of Enrollment in Bilingual Education Controlling for Poverty, and School Size*
70%
77%
85%88%
67%71%
78%83%
86%
63%66%
75%
81%84%
82%
0%
10%
20%
30%
40%
50%
60%
70%
80%
90%
100%
1997-98 Reading 1998-99 Reading 1999-00 Reading 2000-01 Reading 2000-01 Math
No Bilingual Bilingual>120 Bilingual>240
* Equation solved for average poverty, school enrollment, but specific levels of bilingual education as noted.

89
education enrollment is greater than 240. The testing gap between schools with no bilingual
education enrollment and 240 students enrolled in bilingual education has declined in 2000-01 to
only 4 points for both math and reading. These data suggest that bilingual education enrollment
in a school depresses the percentage tested, but not by a great amount, at least in so far as it can
be detected at the school level, and given the problems of matching two different sources of
school data—the number of English Learners tested in May and the English Learner enrollment
anywhere from two to eight months earlier.
Individual student data from California and the U.S. show even more striking disparities
in testing rates. Bali (2000) has obtained individual student data and program testing rates pre
and post Proposition 227 for Pasadena Unified in southern California. As shown on the left side
of Figure 5.6, she found a 50 percent testing rate for the English Learners in bilingual education
in Pasadena in 1997-98, but an 89 percent testing rate for the English Learners in ESL in the
same district.
The two bars in the middle show the testing rates for the Los Angeles Unified School
District in 1996-97. The school district’s report showed English Learners who were in bilingual
education for five years outscored English Learners in all-English classes on the Stanford 9.
However, only 61 percent of the students in the bilingual program were thought to know enough
English after five years to be able to take the test, but 97 percent of the students in the English
language program took the test (Los Angeles Unified, 1998). This 37 point differential is very
close to the 39 point differential Bali found in Pasadena.
Similar disparities can be found in the Ramirez, et al. (1991) nationwide study of more
than 1,000 children in 9 school districts, 46 schools, and 136 classrooms across 5 grades which is
on the right side of Figure 5.6. Eighty-nine percent of the structured immersion students were

Figure 5.6Percentage of English Learners Tested by Program Using Individual Student Data from Pasadena
Unified School District, Los Angeles Unified School District, and a Nationwide Sample
50%
61% 61%
29%
89%
98%
89%
42%
0%
20%
40%
60%
80%
100%
Pasadena,* 1997-98 Los Angeles,** 1996-97 Nationwide 1990,***Grades K-1
Nationwide 1990,***Grades 1-3
Bilingual Education ESL/Structured Immersion
* Source: Bali, 2000.** Source: LAUSD, 1998.*** Source: Ramirez, et al., 1991.

90
tested in K-1, but only 61 percent of the early exit bilingual education students were tested. In
grades 1-3, 42 percent of the structured immersion students were tested, but only 29 percent of
the early exit bilingual education students were tested. The Ramirez study found no difference
between the two programs, but this underestimates the benefit of immersion and overestimates
the benefit of bilingual education since far fewer students were tested in the bilingual program.
The popular press seems unaware of these problems. For example, Norm Gold, the now
retired former Manager of the Language Proficiency and Academic Accountability (LPAA) Unit
in the California Department of Education, has conducted an analysis of 63 successful
"bilingual" schools for an organization called Californians Together (Gold, 2000). He has
concluded there were remarkable gains in the API (Academic Performance Index) for the school
as a whole and the Hispanic (not Spanish speaking English Learner) population that can be
attributed to their successful bilingual education programs. But only a little more than half of
English Learners were enrolled in bilingual education in these so-called "bilingual" schools and
only a third of all the students were enrolled.
Across all schools, 15 percent of the students enrolled in bilingual education might not
have been tested. In some schools, it is possible that none of the students enrolled in bilingual
education were tested (Rossell, 2001). Therefore Gold’s assertion that the gains of all students
are due to a bilingual education program in which only a few students are enrolled and even
fewer tested is just not valid. But he is not alone in making such assertions. Both supporters and
critics of bilingual education are guilty of such sins.
To summarize, comparisons between schools and school districts with different testing
rates are comparisons between apples and oranges and thus are unwarranted. With aggregate
data, gains from educational reforms can be completely obscured by increases in the testing rates

91
of the target population or changes in the testing instrument. The state database only contributes
to the confusion because achievement data has only recently been reliably kept by program and
that is in a separate file that is accurate only for the most recent year. Moreover, none of the
control variables are kept by program.
The Effect of Proposition 227 on Achievement
Determining the effect of Proposition 227 on the academic achievement of English
Learners using the CDE school achievement data is not easy since at the moment, only the
school achievement data is broken down by program and that is only reliable for the most recent
year, 2000-01 (http://www.eddataonline.com/research/). Therefore, there is currently no trend
data or pretest of achievement by program. One cannot use the poverty level of the students in
each program as a surrogate for the pretest since that is not available by program. Nor is the
ethnicity of the English Learners or the testing rates for each program available.
The regular STAR data files which can be found at http://star.cde.ca.gov and the program
and socioeconomic status data which can be found at www.cde.ca.gov/demographics do have
information going back to the 1997-98 school year, but none of it is available by program.
Therefore, one can only estimate the impact on English Learner achievement of greater or fewer
students enrolled in bilingual education controlling for other school characteristics.
There are hundreds of schools in California that had no students in bilingual education or
had so few there was no possibility of actually having had a bilingual education program before
the implementation of Proposition 227. To reduce the noise in the data in order to determine the
impact of Proposition 227 and the effect of maintaining a bilingual education program, I have
examined only the elementary schools with more than 120 students in bilingual education in

92
1998 and looked at their test score gains under two different scenarios: 1) keeping more than 120
students in bilingual education and 2) eliminating bilingual education. Secondary schools are not
examined at all since there are currently so few with bilingual education programs and since a
bilingual education program at that level is so different from an elementary program, that it
would only muddle the results to include them.
Figure 5.7 indicates that elementary schools that eliminated their bilingual education
program had a 10 point gain in reading, but those that kept their bilingual education program in
some form only had a 6 point gain. This may underestimate the difference between the two
groups since even the schools that kept more than 120 students in bilingual education still had a
large reduction in bilingual education from an average 290 students enrolled (62 percent of their
English Learners) to an average 119 students enrolled (26 percent of their English Learners). In
addition, my interviews with bilingual education teachers in California indicates that more
English is being used in bilingual education since Proposition 227 than before. In short, even
bilingual education has been changed by the initiative.
Figure 5.7 also indicates that the testing rates for the schools that kept a bilingual
education program were four points lower in reading and three points lower in math. This is an
advantage that will serve to inflate test scores for the bilingual education schools, all other things
being equal.
Table 5.1 shows a regression equation predicting the effect of the percentage of English
Learners enrolled in bilingual education on an elementary school’s 2001 reading and math test
scores44 controlling for their 1998 test score and their percentage poor in 2001 (enrolled in
44 This is the school’s average NCE converted to a national percentile rank. The state does this conversion.

Figure 5.7English Learner Test Score Gains from 1998 to 2001 in Reading and Math in California Elementary
Schools with More than 120 Students Enrolled in Bilingual Education in 1998
6
86
13
89
10
90
14
92
0
10
20
30
40
50
60
70
80
90
100
Test Gain % Tested '01 Test Gain % Tested '01
Reading Math
Avg
. NC
E in
Mat
h an
d R
eadi
ng
>120 in 1998, >120 in 2001 >120 in 1998, >0 in 2001

Mean b Beta Sig. Mean b Beta Sig.EL Reading Score 2001 27 EL Math Score 2001 41(Constant) 14.992 0.000 * Constant 24.275 0.000 *EL Reading Score 1998 19 0.737 0.69 0.000 * EL Math Score 1998 28 0.720 0.69 0.000 *% Bilingual Ed. 2001 13 -0.060 -0.13 0.000 * % Bilingual Ed. 2001 13 -0.028 -0.05 0.000 *% Poor 2001 17 -0.090 -0.11 0.000 * % Poor 2001 17 -0.142 -0.14 0.000 *
Adj. R20.599 0.579
N 2,755 2,811
* Statistically significant at .05 or better.
Table 5.1The Effect of Bilingual Education on 2001 English Learner Achievement in
READING MATH
California Elementary Schools

93
Calworks, the state poverty program).45 It was not necessary to examine only the schools with
significant bilingual education programs in 1998, that is, the extreme cases, since the control
variables perform the function of reducing the noise in the data. Moreover, including all the
elementary schools, not just those with 120 students in bilingual education in 1998, increases the
R2 by about 30 percentage points.
The 1998 test score is basically a control for the characteristics of the school that are not
captured in the poverty rate.46 As noted, the test scores are low (on a scale from 0 to 100), but
that is because they are supposed to be low—an English Learner is a student who scores low in
English. This also means there is a ceiling on how much progress can be made in English
Learner test scores since when their scores get above a certain level (around the 36th to 50th
percentile), they will no longer appear in the English Learner category.
The percentage enrolled in bilingual education is significantly and negatively related to a
school’s test score in both reading and math. Figure 5.8 solves the equations in Table 5.1 and
shows what a school’s predicted test score would be if 100, 50, and 0 percent of a school’s
English Learners were enrolled in bilingual education in 2001. As shown, an elementary
school’s reading score is increased by six points in reading and three points in math if they have
no bilingual education enrollment compared to a school that has all its English Learners enrolled
in bilingual education.
45 The percentage of English Learners tested in reading or math was not significant at the school level and is not shown. It may be that in a statistical analysis at the school level, the problem of countervailing tendencies—low test rates occur in schools with low achievement—muddles the advantage of not testing the very lowest scoring students. Because the higher scoring schools test more of their students, the sign for the testing rate variable is positive, although insignificant. 46 The state data also include the achievement of all students in a school, but that is not a good control variable since the English Learners comprise a large percentage of all students in the schools that formerly had bilingual education programs. In addition, most of the fluent English proficient (FEP) students were once English Learners and so controlling for the achievement gains of fluent English proficient students wipes out part of the treatment effect for English Learners.

Figure 5.8Effect of Bilingual Education on 2001 English Learner Achievement in California Elementary Schools
Controlling for 1998 English Learner Achievement and % Poor in 2001*
21
39
24
40
27
42
0
5
10
15
20
25
30
35
40
45
50
Reading Math
Pre
dict
ed T
est
Scor
e
100% Bilingual 2001 50% Bilingual 2001 0% Bilingual 2001
* Equation solved for average % poor and average 1998 EL achievement in school, but specfic levels of bilingual education as noted.

94
This analysis may not show the true effect of bilingual education, or its inverse, English
language instruction, on school achievement since it appears that bilingual education in
California has been changed by Proposition 227---more English is being used—and because all
but a handful of schools reduced their bilingual education enrollment even if they did not
eliminate it entirely. Trying to isolate the true effect of a program that is no longer the same or
the true effect of sheltered English immersion when it also had an effect on other programs is a
difficult task even at the individual level and it is even more difficult at the school level.
Moreover, there is a ceiling effect that is present in the state data since it is not possible
to examine the achievement of redesignated English Learners. Because an English Learner
whose test scores improve beyond the 36th percentile (the exact point varies from district to
district), drops out of the English Learner category, the scores for that group cannot improve
very much. One must be able to follow English Learners after they are redesignated fluent
English proficient in order to determine the true effect of a program for them and unfortunately,
at this point in time that appears not be possible with school level data.
Individual student data still suffers from the testing rate bias favoring bilingual education,
but at least it is possible to determine the program the student is enrolled in. Bali (2000) has
analyzed the achievement of individual English Learners in the Pasadena Unified School District
using data provided by them. In 1998, 53 percent of Pasadena's English Learners were enrolled
in bilingual education. After Proposition 227, less than two percent of English Learners were
enrolled in bilingual education. Bali used the Heckman selection model47 to control for the
selection bias introduced by the lower testing rate for the bilingual education program in 1997-
98.
47 See Heckman, 1979.

95
The effect of being in a bilingual education program in 1998 is negative and statistically
significant, but the magnitude was only 2.4 points in reading and a half point in math. The
effect of putting these same English Learners in a structured immersion classroom the next year
was to eliminate the small gap between English Learners who had been in bilingual education
and those not in bilingual education.
Bali also looked at the gains made by the two groups of students using the same
technique. The English Learners who had formerly been in bilingual education who were now in
structured immersion made gains of 4.15 points in reading compared to gains of only 1.8 for the
students who had been in English previously. There was no difference in the gains of the two
groups in math. In short, both analyses suggest that putting English Learners who had been in
bilingual education into structured immersion increased their reading scores by about two points
and their math scores by about a half point or less.
These positive effects for structured immersion may be statistically significant, but they
are small. It may be that the Heckman selection model does not completely overcome the bias
introduced by the huge differential in test taking between the two programs. It may also be that
the true effect of all-English instruction is small.
These findings are not that different from what I obtained in a school achievement
analysis. School achievement in reading increases by six points if all children are enrolled in
bilingual education compared to a school where none are. School achievement only increases by
three points in math if all children are enrolled in bilingual education compared to a school
where none are.

96
Research Findings Nationwide
There is also national evidence on the impact of bilingual education on achievement.
Keith Baker and I reviewed hundreds of research studies of bilingual education in order to
determine which programs were most effective. Our review was first published in Rossell and
Baker (1996a, 1996b, and 1996c) and preceded earlier reviews we had conducted (Baker and de
Kanter, 1981, 1983a, 1983b; Rossell and Ross, 1983).
We found 300 program evaluations, that is, studies whose purpose was to empirically
evaluate the effectiveness of TBE or some other second language acquisition technique.
Methodologically acceptable studies generally were either true experiments in which students
were randomly assigned to treatment and control groups or they were quasi-experiments that
either matched students in the treatment and comparison groups on factors that influence
achievement or statistically controlled for them.
Of course, as occurs in any analysis of this kind, we can never be certain of what the
treatment is. The likelihood that these evaluations are of true bilingual education programs, that
is, programs that include native tongue instruction according to the theory, is enhanced, but not
guaranteed, by the fact that all but two are of Spanish bilingual programs.
The following synthesis of the scientific research on the effectiveness of bilingual is of
individual student achievement, not school achievement. These results are nevertheless biased
by the test rate advantage of bilingual education programs. They thus underestimate the
effectiveness of alternatives to bilingual education because we now know that the alternatives
have higher testing rates than bilingual education. Unfortunately, there is nothing that can be

97
done about this at this point. It is, however, something that future research studies should be
aware of and should control for to the extent that this is possible.48
Appendix J shows the effect of transitional or early-exit bilingual education--compared
to 1) doing nothing, also called submersion, 2) ESL, 3) structured immersion, and 4)
maintenance bilingual education--on second language (usually English) reading, language, and
mathematics as demonstrated by 72 methodologically acceptable studies.49 Appendix J also
shows the effect of structured immersion compared to ESL pullout. Studies not in the table are
excluded because they did not meet the methodological criteria,50 or they did not assess
alternative second language learning programs.
Bilingual Education v. Doing Nothing
Appendix J indicates that for second language reading (or oral English for kindergarten
or preschool), 22 percent of the studies show transitional bilingual education to be superior, 33
percent show it to be inferior, and 45 percent show it to be no different from the supposedly
discredited “doing nothing.”
In a standardized achievement test of language, a test of grammatical rules, bilingual
education does even worse than it does in reading. Seven percent of the studies show transitional
48 There are statistical procedures, such as two-stage least squares and the Heckman selection model, that attempt to control for selection bias. It is not clear that they are entirely successful since finding the right instrumental variables is difficult and sometimes impossible. It may be possible to physically control for the selection bias problem. That is, if the bilingual education program has a testing rate of 50 percent in a grade, the top 50 percent of the alternative program in that grade would be the comparison group. This approach, however, might give an unfair advantage to the alternative program, since there is undoubtedly some error in the process of selecting which students in the bilingual program will be tested. Teachers are making an educated guess when they decide that a bilingual education student is not ready to take the test. They do not test and then throw out the lowest scores. 49 More detail, such as the names of the studies and complete citation information can be found in Rossell and Baker, 1996a. 50 The criteria for selecting studies and other methodological issues are discussed in Rossell and Baker, 1996a. A complete list of the methodologically unacceptable studies are in Appendix B of Rossell and Baker, 1996a.

98
bilingual education to be superior, 64 percent show it to be inferior, and 29 percent show it to be
no different from submersion--doing nothing.
In math, nine percent of the studies show bilingual education to be superior, 35 percent
show it to be inferior, and 56 percent show it to be no different from bilingual education. If we
look only at ESL pullout programs or the combined category of Submersion and ESL, we see
very much the same findings. Bilingual education is the same or worse than doing nothing. In
short, the available scientific research demonstrates that it is not the superior technique that its
advocates have claimed it to be.
Bilingual Education v. Structured Immersion.
Appendix J also compares bilingual education to structured immersion, the program
required by Proposition 227. Twelve studies had reading outcomes, one study had language
outcomes, and eight studies had math outcomes. No study showed bilingual education to be
superior to structured immersion in reading, language, or math. In reading, 83 percent of the
studies showed bilingual education to be worse than structured immersion and 17 percent
showed no difference. In language, the one study showed no difference. In math, five studies
showed no difference and three studies showed bilingual education to be worse than immersion.
Thus, the evidence suggests that structured immersion is superior to bilingual education, but not
by a lot. On the other hand, these findings underestimate the differences between the programs
because of the lower testing rate of the bilingual education programs.
Structured Immersion v. ESL
There were also three studies that compared structured immersion to a mainstream
classroom with ESL pullout specifically. These studies all showed structured immersion to be
superior to a mainstream classroom with ESL pullout in reading.

99
Transitional Bilingual Education v. Maintenance Bilingual Education
The final category in Appendix J compares transitional bilingual education to
maintenance bilingual education.51 This study (Medina and Escamilla, 1992) showed
transitional bilingual education produced significantly higher English oral proficiency than
maintenance bilingual education, although the authors do not acknowledge this in their
conclusions.52
Meta-Analysis
The technique we used in our review is called the "voting method." It is also possible to
do a meta-analysis of at least some of the same studies. Each approach has its advantages and
disadvantages. A meta-analysis is a statistical analysis of the effects of bilingual education
across all studies. If we had conducted a meta-analysis, we would have had to drop a large
number of the studies because there is insufficient programmatic data available to estimate an
effect size (see also Okada, 1983). We opted not to take this approach.
Jay Greene, however, has taken this approach (Greene, 1996; 1997). His meta-analysis
of the 72 scientific studies in this report and in Rossell and Baker, 1996a, 1996b, was submitted
as part of his declaration on behalf of plaintiffs alleging the unconstitutionality of Proposition
227 (Valeria G., et al v. Wilson, et al. (C98-2252Cal, 1998). For a variety of reasons, Greene's
meta-analysis only included 11 of our 72 studies. The bilingual education programs included the
best of bilingual education, but excluded the best of all-English instruction (structured
51 Ramirez et al., 1991 also examined maintenance bilingual education (late-exit bilingual education), but unfortunately did not directly compare it to transitional bilingual education (contrary to media reports and some of their conclusions). Although their graphs appeared to show that the students in late-exit bilingual education were doing worse than the students in transitional bilingual education, no statistical analysis was performed to verify that.

100
immersion). Among the true random assignment studies, there was no reduction in English in all
but one of the bilingual education programs. If the effect size of each study is weighted by its
sample size (which he did not do), there is no difference between the best of bilingual education
and the worst of all-English instruction—that is, doing nothing.53
This strikes me as a believable finding that has important implications for the success of
Proposition 227 in California and the political rhetoric on this issue. Like Greene, I think the
research evidence suggests that a mainstream English language classroom with no extra help is
not necessarily a superior situation for English Learners. It is often no better, and it is sometimes
worse, than a good Spanish bilingual education program—that is, one that offers a sheltered
environment for English Learners, uses Spanish as a means not an end, and does not reduce
English language time on task during the normal school day.
This helps explain why so many intelligent, dedicated professionals within the California
State Department of Education and in classrooms throughout California support bilingual
education. In their experience, bilingual education at its best is an effective program—that is,
Spanish speaking English Learners learn English in a timely fashion in a supportive
environment. They understand many of these students would have low test scores regardless of
the program they are in and that all programs have costs and benefits. In particular, they
perceive a great risk to placing an English Learner in a mainstream classroom without any
special help, although the risk is, on average, much less than they think it is. It is also true that
the harm of bilingual education, as it is typically practiced, is much less than its critics allege.
Often there is no harm and sometimes there is a real benefit.
52 See also Rossell and Baker, 1996c. 53 See Gersten, 1998.

101
In short, the research evidence only supports the conclusion that bilingual education is,
on average, the least effective approach to educating English Learners. It does not support the
conclusion that it is always the least effective approach nor that it is a disaster. Indeed, I would
maintain that if it were truly a disaster—for example, if English Learners came out of it speaking
no English--it would not have so many supporters.
These data, along with the individual student data from Pasadena, suggest once again that
bilingual education may have been the least effective program for English Learners, but there is
no evidence that it was a disaster. Although Proposition 227 may have had a small, positive
effect on achievement, it is not likely it will be a panacea. As is the case with all children, the
achievement of English Learners is influenced primarily by their personal and family
characteristics. The effect of the program they are enrolled in is, by comparison, small.
Recommendations of Rossell and Baker (1996b)
Synthesizing the research findings and applying simple logic led Keith Baker and me to
the following conclusions in our 1996 book (Rossell and Baker, 1996b). These same program
characteristics appear in the text of Proposition 227.
1) The default approach should be that English Learners learn to read and write in
English, not their native tongue. The research indicates that, on average, learning to read and write in English is superior
to learning to read and write in the native tongue, even if the native tongue is a Roman alphabet
language. But we also concluded that there might be some children who would be better off
learning to read in Spanish. Proposition 227 requires that English Learners be assigned to an
English language classroom, but allows parents (and principals and teachers if the state board of

102
education approves the February 2002 regulations) to request bilingual education for their child
after one month in an English language classroom.
2) English Learners should be instructed in sheltered/structured immersion
classrooms. Our review of the research shows structured immersion, not a mainstream classroom, is
the best environment for an English Learner child. Proposition 227 does not require that English
Learners be immediately mainstreamed, but instead requires placement in a sheltered English
classroom.
3) English Learners should probably be in a self-contained classroom for no more
than a year. This recommendation was based on the fact that one of the problems with self-contained
classrooms, evidenced in Ramirez, et al., (1991), is that students do not leave them. This is true
whether the program is structured immersion or bilingual education. According to Ramirez et al.
(1991:373), only 57 percent of the students in the structured immersion programs were
mainstreamed after four years--only slightly higher than the 42 percent of early-exit bilingual
education students who were mainstreamed. The failure to mainstream means students who are
fairly proficient in English are slowed down by the newcomers that come every day of the year,
including the last, to American schools.
The recommendation for a one year time limit in a Sheltered English classroom appears
in Proposition 227. Unfortunately, there is probably no element of Proposition 227 that is more
controversial. As a result the state has basically overturned this element in its regulations. There
does not seem to be much awareness of the fact that there are one year newcomer schools all
over California and the U.S. Although three years is a more common time limit imposed by

103
states and school districts for how long English Learners can stay in bilingual education, there is
no research justification for this or any other time limit.
The one year limit is derived from my interpretation of the research and my conversations
with English Learners. The research indicates that children stay in sheltered programs long after
there is any benefit from them and that tests cannot be relied on to tell us when that is. My
conversations with English Learners indicate that they understand enough English sometime
during the first year to be able to benefit from a regular classroom, although it may be years or
even decades before they reach full proficiency in English.
Almost everyone confuses these two issues, however. Thus, the answer to the question
of how long it takes a child to reach full proficiency in a second language is anywhere from three
years to two decades, depending on the age a child comes to the U.S. and their intelligence. But,
the answer to the question of when a child is better off in a mainstream classroom than in a
sheltered classroom is anywhere from a few months to a year, depending on the age a child
comes to the U.S. and their intelligence. (See also Rossell, 2000c.)
Thus, Proposition 227 recommends that children who are English learners shall be
educated through sheltered English immersion during a temporary transition period not normally
intended to exceed one year. Since the bias is to keep children in sheltered programs longer, not
shorter, than the law requires, the average English Learner is spending at least two years, if not
longer, in a sheltered English immersion program.
4) Use a home language survey and staff judgment to classify and assign students to
programs.

104
Our book recommends staff judgment as an alternative to tests to classify and assign
students to programs. Similarly, Proposition 227 defined an English Learner in a general sense
as a student “who is not currently able to perform ordinary classroom work in English…”.
Since the passage of Proposition 227, I have come to the conclusion that the LEP,
English Learner, or English Language Learner classification should be eliminated altogether and
replaced with “language minority.” It is a lot easier to assess whether a child is language
minority (i.e. comes from a home where a language other than English is spoken) than it is to
assess whether a child is limited English proficient because the former can be determined by a
few simple questions on a home language survey. State and federal funds would flow to school
districts based on the number of language minority children who are also poor. Children who
cannot speak English as determined by a home language survey (see Rossell, 2000a) would be
assigned to structured immersion unless parents objected and they would go to a mainstream
class within a year where they would receive any extra help they need for as long as they need it.
The fact that our policy recommendations appear in Proposition 227 means that the
initiative is research based and well positioned to survive a legal challenge. According to federal
district law established in Castañeda v. Pickard (648 F. 2d 989, 1981) a constitutional program
for English Learners must meet a three pronged test: 1) it should be “informed by an educational
theory recognized as sound by some experts in the field or, at least, deemed a legitimate
experimental strategy;” 2) …the programs and practices “actually used by a school
system…[should be] reasonably calculated to implement effectively the educational theory
adopted by the school,” and 3) the programs and practices should produce results--that is
overcome English language barriers to educational success.54 Proposition 227 is informed by an
54 Castañeda at 1009-1010.

105
educational theory recognized as sound by some experts in the field and, as a result, has survived
all legal challenges.

106
6. SUMMARY AND RECOMMENDATIONS
Proposition 227 was implemented in California in 1998-99. The number of English
Learners enrolled in bilingual education declined by 240,439 students from 409,879 to 169,440
in the first year. It has remained close to that level at 169, 929 in 1999-00, and 167, 163 in 2000-
01. The percentage enrolled declined 17 points from 29 to 12 percent and has remained at 11
percent in 1999-00 and 2000-01. Similar declines were seen in the largest school districts in
California, although they had an increase in more than 8,000 students at all grade levels and
10,000 students at the elementary level in bilingual education in 1999-00. The slight decline in
2000-01 only somewhat offset the increase in bilingual education in 1999-00.
Bilingual education is almost entirely a program for Spanish speaking English Learners
in California and elsewhere in the U.S. Spanish speakers are 83 percent of the English Learners
in California and, in my experience, the only students learning to read and write in their native
tongue. Nevertheless, although 11 percent of English Learners (overwhelmingly Spanish
speaking) are still enrolled in bilingual education, my interviews and observations suggest there
is more English being used in these programs than before Proposition 227.
One of the most controversial aspects of Proposition 227 has been the one year limit on
being in a self-contained program. The state board and school districts have interpreted the one-
year limit as a minimum, not a maximum. Because the state and the school districts may be
using even higher unrealistic redesignation standards, it is possible that many students will never
get out of structured immersion.
Proposition 227 is based on research that suggests that structured English immersion is
the best way to teach English Learners. But many school district administrators do not
understand what structured English immersion is. They believe that if the language of

107
instruction is English, the program is in compliance. As a result, according to the state census,
there are numerous English Learners in mainstream classrooms rather than the sheltered
classrooms required by Proposition 227. Evaluating the educational effect of Proposition 227
under these conditions will be very difficult.
The research suggests that Proposition 227 is likely to have a positive effect on the
academic achievement of English Learners, but it is not going to turn them into high scoring
students. First, bilingual education may be the least effective way of teaching English Learners,
but there is no evidence that it was a disaster nor the primary cause of the low achievement of
English Learners. Second, some schools and school districts are subverting the intent of
Proposition 227 by assigning Spanish speaking English Learners to bilingual education
classrooms taught almost entirely in Spanish in the first 30 days of school. The San Diego
sheltered English immersion teaches Spanish literacy and seems closer to bilingual education
than to sheltered English immersion. Third, the redesignation standards are still as illogical as
they were before Proposition 227. Although the 24 point decline in the percentage of elementary
English Learners enrolled in bilingual education seems to have produced a 7 ½ to 15 point
increase in the percentage of English Learners redesignated, the new statewide ELD test will
muddy the waters, at least for several years. For some school districts it will be easier than their
old test and for others, it will be harder. Redesignation rates will not be comparable pre and post
ELD.
Recommendations for Amending Proposition 227
The 30 percent Spanish sheltered English immersion programs I observed in Los Angeles
are fine programs supported by research evidence because Spanish is used to explain and assist,

108
not as an end in and of itself. The 30 percent Spanish sheltered English immersion programs in
San Diego, however, seem to be contrary to the spirit of Proposition 227 because they teach
Spanish literacy. Thus, Spanish becomes an end not a means.
Accordingly, my first recommendation is
1) sheltered English immersion programs that use 30 percent Spanish instruction should be tolerated, so long as they do not teach Spanish literacy.55
Unfortunately, Proposition 227 has been superimposed on top of the old illogical
classification and reclassification system. The ELD is simply a version of the LAS that will be
required of all school districts. The criterion for “fluent English speaking” established for these
tests, including the LAS and the ELD, cannot be achieved even by all native English speakers.
This is a problem because not achieving the FEP redesignation test score could be used to
justify keeping a child in a self-contained classroom of second language learners for their entire
elementary school career. But, a classroom for non-English speaking students cannot possibly
be a challenging educational environment for a child who is fluent in English. Since we do not
know how to determine whether a child is fluent in English and since almost all standards used
by school districts in California would classify large percentages of native English speakers as
limited English proficient simply because they are among the 50 percent of students who are
below average, English Learners must be compelled to exit these programs unless a strong case
can be made for keeping them in.
Another omission in Proposition 227 is that the one year time limit on program
enrollment apparently does not apply to bilingual education programs. If a parent signs a waiver,
their child could be in a bilingual program for their entire elementary school career and still be in
compliance with Proposition 227. This strikes me as a problem. Although a one year time limit

109
seems draconian for a program that teaches in the native tongue in the first year, perhaps
bilingual education programs could be restricted to two years except under unusual
circumstances. This would make California not very different from several other states—New
York and Massachusetts for example—which have imposed three year time limits on how long
students can stay in bilingual education.
Accordingly, my additional recommendations for amending Proposition 227 are:
2) School districts should be prohibited from using tests as the sole means of classifying and reclassifying students as limited English proficient. There is no test created that is capable of correctly classifying students and the bias is for all English proficiency tests to over classify students as being limited-English-proficient. 3) Proposition 227 should be amended to include a provision that students cannot be kept in a self-contained sheltered English immersion program longer than a year regardless of their test scores unless a) the parent visits the school and personally signs a waiver each year, and b) the school district documents the special circumstances that require that this child be kept in a self-contained program;
4) Proposition 227 should be amended to include a provision that students in bilingual education classes cannot be kept in a self-contained classroom for longer than two years regardless of their test scores unless a) the parent visits the school and personally signs a waiver each year, and b) the school district documents the special circumstances that require that this child be kept in a self-contained program. Right now there is a danger that large numbers of children will remain in a special
program they no longer need for their entire elementary school career. It is the nature of
education for English Learners that a sheltered environment is often a help, but risks becoming a
hindrance, if it is given to children who no longer need it. If these recommendations cannot be
accomplished through the regulatory process then perhaps they should be accomplished through
another statewide initiative. If they are not adopted, any beneficial effect of Proposition 227 may
be dissipated.
55 Spanish literacy is obviously a desirable goal in and of itself but it should be independent of bilingual education which is a program whose goal is English language literacy.

110
I also have a recommendation to improve the state law on testing. School districts should
be required to test 90 percent of their English Learners in order to receive state awards. In other
words, the new state regulations should be specifically applied to English Learners. If that
doesn't ensure compliance, then perhaps regular state aid should be withheld. We can never
adequately evaluate programs for English Learners if large numbers of English Learners are not
tested as occurs in some school districts.
As it stands now, a major impact of Proposition 227 that can be determined with some
certainty is that it came close to eliminating bilingual education in California after 26 years of
support by the California Department of Education. Fifty-six percent of the schools, and about
47 percent of the school districts, in California completely eliminated their bilingual education
programs and almost all of them had a reduction in bilingual education.
We also know that a 24 point decline in the percentage of elementary English Learners
enrolled in bilingual education is associated with a 7 ½ to 15 point increase in the percentage of
elementary English Learners redesignated during a time period when the redesignation standards
did not change substantially. In addition, maintaining a bilingual education program after
Proposition 227 has a negative effect on reading and math achievement at both the school and
individual level. The size of the negative effect will remain small, however, so long as bilingual
education programs are allowed to test fewer of their students than all-English programs and
there is no way to follow the achievement gains of students after they are redesignated fluent-
English-proficient. An English Learner is, by definition, a low achiever in English and so their
test scores can only improve a small amount before they are transferred out of that category.

A-1
APPENDIX A TEXT OF PROPOSITION 227
English Language Education for Children in Public Schools by Ron K. Unz and Gloria Matta Tuchman Text: SECTION 1. Chapter 3 (commencing with Section 300) is added to Part 1 of the Educational Code, to read: CHAPTER 3. ENGLISH LANGUAGE EDUCATION FOR IMMIGRANT CHILDREN ARTICLE 1. Findings and Declarations 300. The People of California find and declare as follows: (a) WHEREAS the English language is the national public language of the United States of America and of the state of California, is spoken by the vast majority of California residents, and is also the leading world language for science, technology, and international business, thereby being the language of economic opportunity; and (b) WHEREAS immigrant parents are eager to have their children acquire a good knowledge of English, thereby allowing them to fully participate in the American Dream of economic and social advancement; and (c) WHEREAS the government and the public schools of California have a moral obligation and a constitutional duty to provide all of California’s children, regardless of their ethnicity or national origins, with the skills necessary to become productive members of our society, and of these skills, literacy in the English language is among the most important; and (d) WHEREAS the public schools of California currently do a poor job of educating immigrant children, wasting financial resources on costly experimental language programs whose failure over the past two decades is demonstrated by the current high drop-out rates and low English literacy levels of many immigrant children; and (e) WHEREAS young immigrant children can easily acquire full fluency in a new language, such as English, if they are heavily exposed to that language in the classroom at an early age. (f) THEREFORE it is resolved that: all children in California public schools shall be taught English as rapidly and effectively as possible. ARTICLE 2. English Language Education 305. Subject to the exceptions provided in Article 3 (commencing with Section 310), all children in California public schools shall be taught English by being taught in English. In particular, this shall require that all children be placed in English language classrooms. Children who are English learners shall be educated through sheltered English immersion during a temporary transition period not normally intended to exceed one year. Local schools shall be permitted to place in the same classroom English learners of different ages but whose degree of English proficiency is similar. Local schools shall be encouraged to mix together in the same classroom English learners from different native-language groups but with the same degree of English fluency. Once English learners have acquired a good working knowledge of English, they shall be transferred to English language mainstream classrooms. As much as possible, current supplemental funding for English learners shall be maintained, subject to possible modification under Article 8

A-2
(commencing with Section 335) below. 306. The definitions of the terms used in this article and in Article 3 (commencing with Section 310) are as follows: (a) "English learner" means a child who does not speak English or whose native language is not English and who is not currently able to perform ordinary classroom work in English, also known as a Limited English Proficiency or LEP child. (b) "English language classroom" means a classroom in which the language of instruction used by the teaching personnel is overwhelmingly the English language, and in which such teaching personnel possess a good knowledge of the English language. (c) "English language mainstream classroom" means a classroom in which the students either are native English language speakers or already have acquired reasonable fluency in English. (d) "Sheltered English immersion" or "structured English immersion" means an English language acquisition process for young children in which nearly all classroom instruction is in English but with the curriculum and presentation designed for children who are learning the language. (e) "Bilingual education/native language instruction" means a language acquisition process for students in which much or all instruction, textbooks, and teaching materials are in the child’s native language. ARTICLE 3. Parental Exceptions 310. The requirements of Section 305 may be waived with the prior written informed consent, to be provided annually, of the child’s parents or legal guardian under the circumstances specified below and in Section 311. Such informed consent shall require that said parents or legal guardian personally visit the school to apply for the waiver and that they there be provided a full description of the educational materials to be used in the different educational program choices and all the educational opportunities available to the child. Under such parental waiver conditions, children may be transferred to classes where they are taught English and other subjects through bilingual education techniques or other generally recognized educational methodologies permitted by law. Individual schools in which 20 students or more of a given grade level receive a waiver shall be required to offer such a class; otherwise, they must allow the students to transfer to a public school in which such a class is offered. 311. The circumstances in which a parental exception waiver may be granted under Section 310 are as follows: (a) Children who already know English: the child already possesses good English language skills, as measured by standardized tests of English vocabulary comprehension, reading, and writing, in which the child scores at or above the state average for his grade level or at or above the 5th grade average, whichever is lower; or (b) Older children: the child is age 10 years or older, and it is the informed belief of the school principal and educational staff that an alternate course of educational study would be better suited to the child’s rapid acquisition of basic English language skills; or (c) Children with special needs: the child already has been placed for a period of not less than thirty days during that school year in an English language classroom and it is subsequently the informed belief of the school principal and educational staff that the child has such special physical, emotional, psychological, or educational

A-3
needs that an alternate course of educational study would be better suited to the child’s overall educational development. A written description of these special needs must be provided and any such decision is to be made subject to the examination and approval of the local school superintendent, under guidelines established by and subject to the review of the local Board of Education and ultimately the State Board of Education. The existence of such special needs shall not compel issuance of a waiver, and the parents shall be fully informed of their right to refuse to agree to a waiver. ARTICLE 4. Community-Based English Tutoring 315. In furtherance of its constitutional and legal requirement to offer special language assistance to children coming from backgrounds of limited English proficiency, the state shall encourage family members and others to provide personal English language tutoring to such children, and support these efforts by raising the general level of English language knowledge in the community. Commencing with the fiscal year in which this initiative is enacted and for each of the nine fiscal years following thereafter, a sum of fifty million dollars ($50,000,000) per year is hereby appropriated from the General Fund for the purpose of providing additional funding for free or subsidized programs of adult English language instruction to parents or other members of the community who pledge to provide personal English language tutoring to California school children with limited English proficiency. 316. Programs funded pursuant to this section shall be provided through schools or community organizations. Funding for these programs shall be administered by the Office of the Superintendent of Public Instruction, and shall be disbursed at the discretion of the local school boards, under reasonable guidelines established by, and subject to the review of, the State Board of Education. ARTICLE 5. Legal Standing and Parental Enforcement 320. As detailed in Article 2 (commencing with Section 305) and Article 3 (commencing with Section 310), all California school children have the right to be provided with an English language public education. If a California school child has been denied the option of an English language instructional curriculum in public school, the child’s parent or legal guardian shall have legal standing to sue for enforcement of the provisions of this statute, and if successful shall be awarded normal and customary attorney’s fees and actual damages, but not punitive or consequential damages. Any school board member or other elected official or public school teacher or administrator who willfully and repeatedly refuses to implement the terms of this statute by providing such an English language educational option at an available public school to a California school child may be held personally liable for fees and actual damages by the child’s parents or legal guardian. ARTICLE 6. Severability 325. If any part or parts of this statute are found to be in conflict with federal law or the United States or the California State Constitution, the statute shall be implemented to the maximum extent that federal law, and the United States and the California State Constitution permit. Any provision held invalid shall be severed from the remaining portions of this statute. ARTICLE 7. Operative Date 330. This initiative shall become operative for all school terms which begin more than sixty days following the date at which it

A-4
becomes effective. ARTICLE 8. Amendment. 335. The provisions of this act may be amended by a statute that becomes effective upon approval by the electorate or by a statute to further the act’s purpose passed by a two-thirds vote of each house of the Legislature and signed by the Governor. ARTICLE 9. Interpretation 340. Under circumstances in which portions of this statute are subject to conflicting interpretations, Section 300 shall be assumed to contain the governing intent of the statute. END Ron K. Unz, a high-technology entrepreneur, is Chairman of One Nation/One California, 555 Bryant St. #371, Palo Alto, CA 94301. Gloria Matta Tuchman, an elementary school teacher, is Chair of REBILLED, the Committee to Reform Bi-Lingual Education, 1742 Lerner Lane, Santa Ana, CA 92705.

B-1
Appendix B EXAMPLE OF INTERVIEW QUESTIONS
The questions shown below are illustrative of those asked. Because the style of interviewing was conversational, I skipped questions that would disrupt the logic or flow of what I was being told and I added questions in order to understand what I was being told or observing. 1998 Administrator Interviews I am a Professor of Political Science at Boston University and a Research Fellow at the Public Policy Institute of California. I am doing research on the implementation of Proposition 227 in California. I want to ask you some questions about this process and to observe the classrooms in your school designated for LEP students. No school or individual will be identified in my report. This is not a study of the quality of instruction. I am gathering information on the ways in which Proposition 227 is being interpreted and implemented as background information for the analysis of data that I will be conducting. 1. What are the language groups in your LEP population? 2. Which groups were receiving bilingual education prior to 227? 3. What were the other LEP students receiving? 4. What was the effect of Proposition 227 on your school? 5. What guidance did you receive from the central administration and the state on the
implementation of 227? 6. What problems have you encountered in implementing 227? 7. How has your school changed? 8. How have your teachers reacted to having to implement 227? 9. How do they feel about bilingual education and about 227? 10. How have the parents of LEP students reacted? What are their feelings about the language of
instruction for their child this year and compared to last year? 11. What was the process by which bilingual waivered classrooms were created? 12. What was your role and what was the role of teachers? 13. Did you require parents to come to the school and sign a waiver? Were there exceptions to this
rule? 14. How do your parents feel about their children being taught in the native tongue? 15. How do your parents feel about their children being taught in English? 16. How many classrooms in your school are waivered bilingual education and how many are
structured English immersion by grade and language group? 17. Do you have a list of the classrooms in your school, their grade, program title, and enrollment? 18. Have you talked to other principals about how 227 was implemented in their schools and their
problems? [If no] have you heard anything about the process of implementation in other schools? [If yes] What?
19. Do you want to go with me to observe classrooms or should I just follow this list of classrooms? Note: it was rare for principals to accompany me to classrooms.

B-2
Appendix B (cont.) 1998 Teacher Interviews 1. What is the name of the program these children are in? 2. [If sheltered English immersion in LA Unified] Is this Model A or Model B? 3. What languages (or dialects) do these children speak? 4. What languages (or dialects) do you speak? 5. What language do these children learn to read and write in? 6. About how much time do you spend teaching in English and how much in _____ (the native
tongue]. 7. [If native tongue instruction] Which subjects? 8. [If native tongue instruction] Are you using more or less English than you were at the same time
last year? [If more or less] Why? 9. [If native tongue instruction] When do these children transition to English in subject matter? 10. What problems have you encountered in teaching these children in this program this year? 11. [If sheltered English immersion] What about the long term success of this approach? 12. What guidance did you receive from your school’s administration and from the district’s
administration? 13. How did you create bilingual education classrooms? How were parents involved? 14. How do you feel about the program you are teaching in? Is this the best way to teach these
children? 15. Do you feel you have the support of the parents for this program? Additional 2001 Teacher Interview Questions 1. [If sheltered English immersion] Are you a former bilingual education teacher? 2. [If former bilingual education] Which do you like better, bilingual education or sheltered
English immersion? 3. [If former bilingual education] Would you ever want to go back to bilingual education?

C-1
APPENDIX C LANGUAGE CENSUS INSTRUCTIONS
FORM R30-LC SPRING 2001
Table of Contents Submission Information...................................................................................................................1 R30-LC Page 1 Instructions............................................................................................................3 Part 1 - English learners (EL) and Fluent-English Proficient (FEP) Students.................................4 Part 2 - English learners' Instructional Information..........................................................................6 Part 3 - Students Redesignated ...................................................................................................10 Part 4 - Oral English Proficiency...................................................................................................10 Part 5 - Teachers and Bilingual Paraprofessionals Providing Services to English learners.........11 Submission Information Who completes the Language Census? Each spring, the Language Census data collection captures non-English languages spoken by students in California and in what numbers. Reported on the R30-LC form, the data are required by both the California Education Code1 and federal case law. Submission of the Language Census for each school is a district responsibility and must be completed for every public school (grades kindergarten through 12) including community schools and community day schools. Most counties and a few districts administer schools that are jointly juvenile hall and community schools. In these cases, the Language Census must be completed for only the community school students. Based on federal case law, charter schools must also submit the Language Census or comparable data. The following types of schools are not required to submit a Language Census: the California Youth Authority schools; preschools; juvenile halls (except for any Community School students, as noted above); children's centers; adult schools; and regional occupational centers. Changes to the R30-LC form This year we made some design changes and added extra space to the R30-LC. The content remains the same. The intent of the changes is to make the form easier to complete and to prevent errors. Distribution of Language Census Materials The Educational Demographics Office is distributing all materials for completion of the Language Census directly to both county and school district offices in 2001. These local education agencies (LEAs) will return the completed Language Census forms for all the K-12 public schools they
1
Education Code 62002 and 62003 (former EC sections 52164.2 and 52164.5 and California Code of Regulations, Title 5, Education, sections 4304-4306)

C-2
administer or to which they have granted charters. Each LEA has designated a local contact to receive and return the Language Census data to our office. The LEA has also notified us of whether the data will be submitted on paper or using our software. For software users, the LEA has decided whether or not to request paper forms for internal data collection only. These internal forms are intended to gather the required data from the schools so that the district or county office can enter the data into the software. We call these internal forms “working copies” and a blue label distinguishes them. LEAs that submit data to our office on paper forms will have white labels. In distributing the Language Census materials to LEAs, the content will vary based on decisions each LEA has made. • LEAs choosing paper submission will receive, for each K-12 public school, one Language
Census, Spring 2001 Form (R30-LC), one set of Language Census Instructions, one set of Frequently Asked Questions and one preprinted white label.
• LEAs choosing software submission and requesting internal paper forms will receive, for each K-12 public school, one Language Census, Spring 2001 Form (R30-LC), one set of Language Census Instructions, one set of Frequently Asked Questions and one preprinted blue label.
• LEAs choosing software submission and not requesting internal paper forms will receive one Language Census, Spring 2001 Form (R30-LC), one set of Language Census Instructions, and one set of Frequently Asked Questions.
Software submission We strongly encourage you to complete and submit the census data using the LC Data Entry Assistant (LCDEA) software available at our web site. If you choose to use this software application, you do NOT need to submit any paper forms to us. Internet access and Windows 95 (or later version of Windows) are required in order to use the software. For more information and to obtain the software, view the web site at http://www.cde.ca.gov/demographics/lc2001 Return information Whether you use the LCDEA software or the paper form, the data must be submitted to our office through the county or district office, on or before April 3, 2001. If you are completing a paper form, submit the data to your district or county Language Census Coordinator, per their instructions, in time for transmittal to the Educational Demographics Office by April 3, 2001 (see Page 1 of the R30-LC for the address). If you are submitting your data on a paper form, affix the preprinted label to the R30-LC form where indicated at the top of Page 1. If there is no label for a school, see the instructions enclosed with the labels or contact our office for assistance. Data and Program Assistance

C-3
For questions about data submission, contact Nancy Chiu at (916) 327-0208 or her e-mail at [email protected]. For English learner program and policy information (in particular parts 2 and 5 of the R30-LC), you may contact David Dolson at (916) 654-3883 or his e-mail at [email protected] or Lauri Burnham at (916) 654-8787 or her e-mail at [email protected]. R30-LC Page 1 Instructions
Submission Options
Check the first box on Page 1 of the R30-LC form if there are no English learners (EL) and no Fluent-English Proficient (FEP) students enrolled as of March 1, 2001. Next, complete the contact information and certification and only submit Page 1 of the form by April 3, 2001.
Or, Check the second box if there are English learners (EL) and/or fluent-English proficient (FEP) students enrolled as of March 1, 2001. Next, complete the contact information, certification, and parts 1-5 and submit by April 3, 2001.
Contact Information
Print the name and phone number of the person completing the form and enter the current date. The contact person must be able to verify data entered on the form and to provide assistance if errors or inconsistencies are found with the data.
Certification of Language Census
All forms submitted on paper must be signed or submitted with a signed cover letter. If the district office compiles the school data, a cover letter certifying the accuracy of the data for all schools is acceptable in lieu of a certification signature on each form.
Primary Language Codes
Only those codes listed for the primary languages on Page 1 of the R30-LC form may be used in parts 1 and 5.

C-4
Part 1 - English learners (EL) and Fluent-English Proficient (FEP) Students Following are definitions of several terms used in the R30-LC form.
English learner (EL):
A student for whom there is a report of a primary language other than English on the state-approved "Home Language Survey" and who, on the basis of the state-approved oral language (grades K-12) assessment procedures and including literacy (grades 3-12 only), has been determined to lack the clearly defined English language skills of listening comprehension, speaking, reading, and writing necessary to succeed in the school's regular instructional programs.
Fluent-English Proficient students:
Fluent-English proficient (FEP) students are those whose primary language is other than English and who have met the district criteria for determining proficiency in English (i.e., those students who were initially identified as FEP and students redesignated from English learner to FEP). FEP students are reported every year as long as they are enrolled.
Primary Language:
A student's primary language is identified by the "Home Language Survey" as the language first learned, most frequently used at home, or most frequently spoken by the parents or adults in the home. For the purposes of the Language Census, sign language is not identified as a primary language.
Language Code:
A language code is a two-digit number assigned to each primary language identified in California public schools. Part 1 Instructions
(a) Primary Language Name
(b) Primary Language Code
Enter the language code and language name for each primary language, other than English, spoken by students identified as English learners and/or FEP at the school. The primary language codes are on Page 1 of R30-LC form and the last page of these instructions. Enter only the language codes shown on the Primary Language Code list. If a student reports a primary language other than English and it is not on the list, enter code 99, All other non-English languages. Combine all languages with a code 99 onto a single line.
(c) Type

C-5
Enter the number of students on either the English learner (EL) or FEP line.
(d) - (r) Grade Level
Enter the number of all identified English learners and FEP students by grade level on the corresponding row of their primary language. Total each row and enter the sum in Column (r). Enter the grand total of English learners and FEP at the bottom of Column (r). Count each student only once. Do not estimate and do not include English-only students. Do not enter any zeroes. If you are submitting on paper and there is insufficient space on the form for all the primary languages, other than English, spoken by students at the school, you may copy Page 2 and include the copy as an attachment. Please write "Attachment" at the top of the page in red ink.
1 Totals - EL
For paper submission, enter the total number of English learners. Software users will have automated calculations.
2 Total - FEP
For paper submission, enter the total number of FEP students. Software users will have automated calculations.

C-6
Part 2 - English learners' Instructional Information If you have questions on Part 2, please contact: § David Dolson, Language Policy and Leadership Office, (916) 654-3883; or,
§ Lauri Burnham, Language Proficiency and Academic Accountability, (916) 654-8787.
3 Total English learners from Part 1, row 1, column (r)
Enter the total from Part 1, Row 1, Column (r) of Page 2. This step will not be necessary for software users.
A. Number of English learners (EL) Enrolled in Specific Instructional Settings
Rows 4 - 8
Report all English learners placed in instructional settings required by Education Code 300-340. Count each English learner only once and report him/her in the column that most closely describes the placement of that student. Special Notice: The total number of English learners reported in Row 9 must equal the total number of English learners reported in Part 1, Row 1, Column (r), of the R30-LC form. If you do not enter the correct number in Row 9, the form will be considered incomplete and may be returned for correction. Software users will have these calculations automated and will be warned if parts 1 and 2 do not match.
4 Structured English Immersion
These are classes where English learners who have not yet met local district criteria for having achieved a "good working knowledge" (also defined as "reasonable fluency") of English are enrolled in an English language acquisition process for young children in which nearly all classroom instruction is in English but with a curriculum and presentation designed for children who are learning the language (EC 305 and 306(a)).
5 Alternative Course of Study
These are classes where English learners are taught English and other subjects through bilingual education techniques or other generally recognized methodologies permitted by law. The students enrolled have been (1) granted a parental exception waiver pursuant to EC 310 and 311; or (2) enrolled in any Alternative Education Program operated under the Superintendent of Public Instruction's waiver authority (EC 58509) when such an alternative for English learners was established specifically to waive one or more sections of Education Code 300 through 340; or (3)

C-7
enrolled in a Charter School program which offers any alternative course of study for English learners.
6 English Language Mainstream Class - Students Meeting Criteria
These are classes where English learners who have met local district criteria for having achieved a "good working knowledge" (also defined as "reasonable fluency") of English are enrolled and provided with additional and appropriate services (EC 305; CCR T5 11301 and 11302).
7 English Language Mainstream Class - Parental Request
These are classes where English learners, who have not met local district criteria for having achieved a "good working knowledge" (also defined as "reasonable fluency") of English, are enrolled in an English Language Mainstream Class and provided with additional and appropriate services on the basis of a parental request. Note: CCR 11301(b) permits a parent or guardian of an English learner to request, at any time during the school year, that a child placed in Structured English Immersion be transferred to an English Language Mainstream Class and provided with additional and appropriate services. Enter in this column the number of English learners placed in an English Language Mainstream Class at the request of their parent or guardian.
8 Other Instructional Settings
These are classes or any instructional settings other than those described in rows 4 through 7 of Part 2. The instructional settings described in rows 4 through 7 are those explicitly authorized by Education Code 300-340.
9 Total English learners
Enter the sum of rows 4 through 8. Ensure that the total is the same as the total in Part 1, Row 1, Column (r). For software users, the calculations will be made electronically. B. English learners Receiving Instructional Services Report all English learners receiving instructional services who have been placed in the instructional settings reported in Section A., rows 4 through 8. For each student, choose the row that most closely describes the services received by him/her. Count each English learner only once. Row 16 total must match the total in Row 9 and the total number of English learners reported in Part 1, Row 1, Column (r).
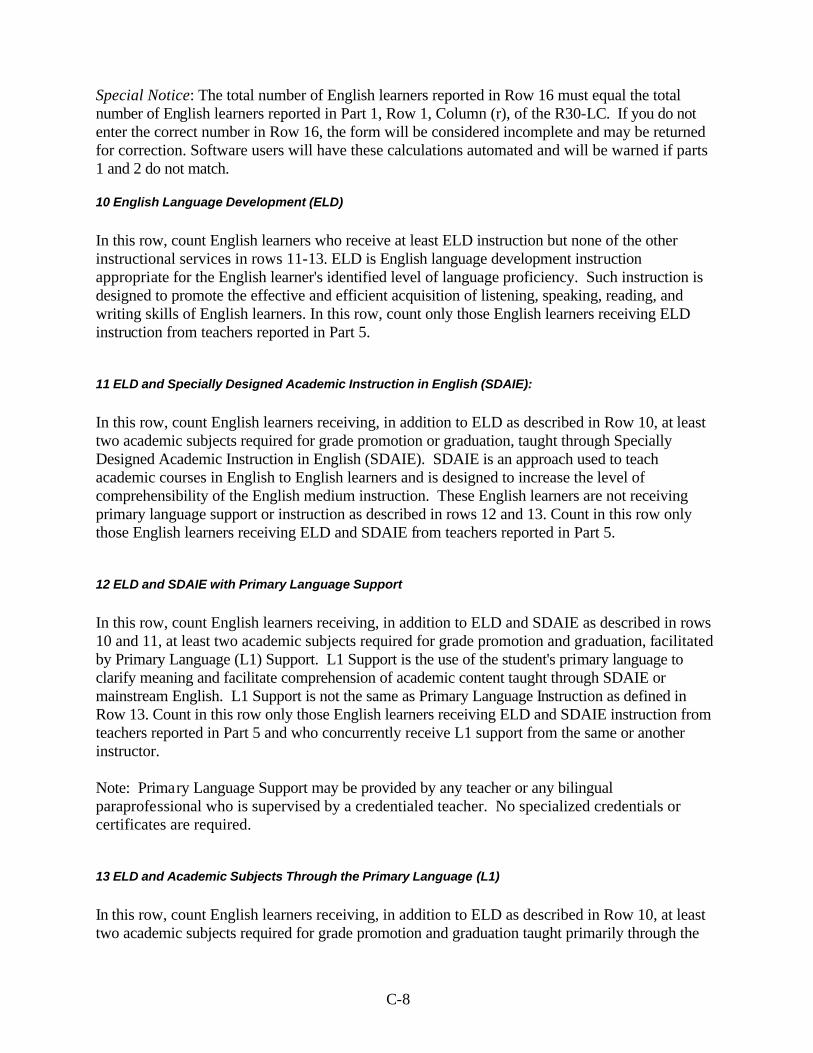
C-8
Special Notice: The total number of English learners reported in Row 16 must equal the total number of English learners reported in Part 1, Row 1, Column (r), of the R30-LC. If you do not enter the correct number in Row 16, the form will be considered incomplete and may be returned for correction. Software users will have these calculations automated and will be warned if parts 1 and 2 do not match.
10 English Language Development (ELD)
In this row, count English learners who receive at least ELD instruction but none of the other instructional services in rows 11-13. ELD is English language development instruction appropriate for the English learner's identified level of language proficiency. Such instruction is designed to promote the effective and efficient acquisition of listening, speaking, reading, and writing skills of English learners. In this row, count only those English learners receiving ELD instruction from teachers reported in Part 5.
11 ELD and Specially Designed Academic Instruction in English (SDAIE):
In this row, count English learners receiving, in addition to ELD as described in Row 10, at least two academic subjects required for grade promotion or graduation, taught through Specially Designed Academic Instruction in English (SDAIE). SDAIE is an approach used to teach academic courses in English to English learners and is designed to increase the level of comprehensibility of the English medium instruction. These English learners are not receiving primary language support or instruction as described in rows 12 and 13. Count in this row only those English learners receiving ELD and SDAIE from teachers reported in Part 5.
12 ELD and SDAIE with Primary Language Support
In this row, count English learners receiving, in addition to ELD and SDAIE as described in rows 10 and 11, at least two academic subjects required for grade promotion and graduation, facilitated by Primary Language (L1) Support. L1 Support is the use of the student's primary language to clarify meaning and facilitate comprehension of academic content taught through SDAIE or mainstream English. L1 Support is not the same as Primary Language Instruction as defined in Row 13. Count in this row only those English learners receiving ELD and SDAIE instruction from teachers reported in Part 5 and who concurrently receive L1 support from the same or another instructor. Note: Primary Language Support may be provided by any teacher or any bilingual paraprofessional who is supervised by a credentialed teacher. No specialized credentials or certificates are required.
13 ELD and Academic Subjects Through the Primary Language (L1)
In this row, count English learners receiving, in addition to ELD as described in Row 10, at least two academic subjects required for grade promotion and graduation taught primarily through the

C-9
primary language (L1). In kindergarten through grade 6, L1 instruction must be provided, at a minimum, in Language Arts (including reading and writing) and Mathematics, Science, or Social Science. In grades 7-12, L1 instruction must be provided, at a minimum, in any two academic subjects required for grade promotion and graduation. English learners reported as receiving L1 instruction may also receive SDAIE as described in Row 11. Count in this row only those English learners who receive ELD and L1 instruction from teachers reported in Part 5.
14 Instructional Services other than those defined in rows 10 through 13
In this row, count English learners receiving some type of instructional service which is specifically designed for English learners but which is an instructional service that does not correspond to any one of the descriptions of services found in rows 10-13 in Part 2. English learners reported in Row 14 may, but are not required to, receive the English learner instructional service from teachers reported in Part 5.
15 Not Receiving any English learner Services
In this row, count all of the remaining English learners who have not been counted previously in any row 10-14. These English learners are not receiving any specialized instructional services as specified in rows 10-14.
16 Total English Learners
Enter the sum of rows 10-15. Ensure that this total is the same as the total in Row 9 Total English learners. This will be calculated electronically for software users.

C-10
Part 3 - Students Redesignated
17 Students redesignated
Enter the total number of English learners redesignated as FEP since the last census (March 1, 2000). Include those who are no longer enrolled at the school (i.e., graduated or moved). These students are redesignated according to the multiple criteria, standards, and procedures adopted by the district and demonstrate English language proficiency comparable to that of average native English speakers. NOTE: In future years, continue to count these FEP students in Part 1 if still enrolled in the school. Part 4 - Oral English Proficiency This part must be completed if there were any English learners and/or FEP students reported in Part 1. Check only one of the three options. If no row is checked, the CDE will default the selection to option 18c. 18 a. Check this option if the school uses one or more of the listed, state-approved tests as part of its initial identification of English learner or FEP status. 18 b. Check this option if the district has on file a current CDE approved waiver to use an alternative testing procedure. 18 c. Select this option if the school uses a method other than those identified in 18a and 18b for the initial identification of English learners and FEP students.

C-11
Part 5 - Teachers and Bilingual Paraprofessionals Providing Services to English learners If you have questions on Part 5, please contact: § David Dolson, Language Policy and Leadership Office, (916) 654-3883; or,
§ Lauri Burnham, Language Proficiency and Academic Accountability, (916) 654-8787. This part reflects the staffing requirements for services to English learners as described in the 2000-2001 Coordinated Compliance Review (CCR) Training Guide. Count each teacher and paraprofessional (aide) only once. Report in whole numbers regardless of full-time or part-time status (no fractions or decimals). If a teacher or aide works at more than one school, report the person at the school in which he or she spends the majority of time providing instruction. If the teacher or aide spends an equal amount of time at more than one site, choose only one site to report the person. Caution: If a teacher holds a CTC bilingual, SDAIE or ELD authorization and is not providing services directly to English learners at the school, do not report the teacher in Part 5.
A. Teachers providing Primary Language Instruction to English learners and Bilingual Paraprofessionals
Identify the teachers who provide Primary Language instruction to students who were counted in Part 2, Row 13.
19 - 26, a & b Language of Instruction
Enter the two digit language code and language name for each language of instruction provided by a teacher and/or paraprofessional (aide) to the English learners reported in Part 1, Row 1, Column (r), and Part 2, Row 16. Do not enter the language Vietnamese if there are no Vietnamese English learners reported in Part 1. Please refer to Page 15 of these Instructions or Page 1 of the R30-LC for language codes and names.
(c) Teachers with a CTC Bilingual Authorization:
Include persons who (1) have valid Commission for Teacher Credentialing (CTC) Bilingual Crosscultural Language and Academic Development (BCLAD) certificates, (2) Bilingual Crosscultural Certificates of Competence (BCC), or (3) other CTC authorization for bilingual education including emergency or sojourn authorizations.

C-12
(d) Teachers in Training for a CTC Bilingual Authorization:
Teachers in Training are teachers who, on an interim basis, have been teamed with a bilingual paraprofessional (aide) to meet the primary language instruction staffing need in response to a district shortage of qualified bilingual teachers; or teachers who are documented to have the required language skills of the English learners (i.e., authorized foreign trained teachers providing content instruction in the native language) and not teamed with an aide. Each teacher should have completed or be currently enrolled in training that will qualify him or her for a bilingual certificate issued by the CTC. A description of the training program for these teachers should be included in the district’s Plan to Remedy the Shortage of Qualified Staff or the most current Staffing Plan Annual Report.
(e) Paraprofessionals (aides) teamed with teachers reported in column (d)
Report bilingual paraprofessionals (aides) teamed with the teachers in training for the purpose of providing academic instruction through the primary language. These aides should meet district criteria that ensure aides are (1) able to speak, understand, read, and write English and the primary language of the English learners; and are (2) familiar with the cultural heritage of the English learners.
(f) All other bilingual paraprofessionals (aides)
Report the number of all other bilingual paraprofessionals (aides who were not reported in column (e)). Aides reported in this column are those providing primary language support or primary language instruction to English learners and who have met the same district criteria for employment as indicated for paraprofessionals teamed with teachers as described in column (e).
27 Total L1 teachers
Enter totals for rows 19-26 to indicate the total numbers of teachers for columns c and d. For software users, this calculation will be made electronically.
28 Total Teachers providing Primary Language Instruction
Enter the total number of teachers providing services to English learners enrolled in the school (the sum of row 27, column c and column d). For software users, this calculation will be made electronically. Note: a teacher should not be counted more than once in Part 5. The total entered in Row 28 should not represent a duplicate count of teachers.
B. Teachers providing ELD and/or SDAIE Instruction to English learners
Note: The purpose of Part 5, Section B, Rows 29-31, is to collect data on teachers providing

C-13
SDAIE and/or ELD exclusively. In cases where teachers provide SDAIE and/or ELD in addition to primary language instruction, these teachers should be reported in Part 5, Section A, rows 19-26. Do not report any teachers providing primary language instruction in Part 5, Section B, rows 29-31.
(a) SDAIE and ELD
Report teachers who provide SDAIE and ELD in column (a). Do not report them in column (a) if you have already reported them in Section A., rows 19-26.
(b) SDAIE only
Report teachers who provide only SDAIE in column (b). Do not report them in column (b) if you have already reported them in column (a) or in Section A., rows 19-26.
(c) ELD Only
Report teachers who provide only ELD in column (c). Do not report them in column (c) if you have already reported them in column (a) or (b) or in Section A., rows 19-26.
(d) Total by authorization/certificate (columns a + b + c)
Enter the sum of columns (a) + (b) + (c). These calculations will be made electronically for software users.
29 Teachers with a CTC SDAIE or ELD teaching authorization
Include teachers who hold a valid regular California teaching authorization and (1) whose credential is a valid Crosscultural Language and Academic Development (CLAD) credential or (2) who hold a Language Development Specialist (LDS) Certificate issued by CTC or (3) who hold an ESL supplementary authorization issued by the CTC. Also include in this row, any teacher providing only ELD and/or SDAIE (but not L1) instruction and who holds any of the various bilingual teaching authorizations described in rows 29-31.
30 Teachers with SB 1969 (or SB/395) Certificate of Completion
Include teachers who hold a SB 1969/395 certificate of completion of staff development training.
31 Teachers in training for SDAIE or ELD teaching authorization
Include teachers in training who provide SDAIE to English learners and who are enrolled in either CLAD training or a SB 1969/395 staff development program with a SDAIE focus. Include teachers in training who provide ELD to English learners and who are enrolled in either CLAD training or a SB 1969/395 staff development program with an ELD focus for self-contained classroom instruction.

C-14
32 Total teachers providing ELD and/or SDAIE instruction to English learners
Enter the sum of rows 29-31. For software users, this calculation will be made electronically.
C. Summary of Teachers Providing Instructional Services to English learners
This section summarizes data reported above. The summary should help you verify that no teachers have been counted more than once. Duplicate counts has been the most frequent error in Part 5 in prior years. Note: For software users, Section C will be completed electronically.
33 Teachers providing Primary Language instruction to English learners (Row 28)
Enter the total from Row 28.
34 Teachers providing ELD and/or SDAIE instruction to English learners (Row 32)
Enter the total from Row 32.
35 Total number of teachers providing instructional services (Sum of row 33 and row 34)
Enter the sum of rows 33 and 34.

C-15
LANGUAGE CODE LIST The following is a list of primary languages and codes used for completing the Language Census form R30-LC in parts 1 and 5. Only language codes listed may be reported on the R30-LC form. Please do not enter language codes created for your individual school data systems. Primary languages not listed below are assigned code 99 (all other non-English languages). On Part 1 of the R30-LC form, aggregate all the students assigned code "99" onto one row only. Two changes were made to the Language Code List (see below):
§ Serbian (code 31) - a separate listing for Serbian has been deleted and, instead, added to Serbo-Croatian (code 52); and,
§ a Filipino label was added to Pilipino (Tagalog) (code 05), reflecting a change in the official name of the language.
For purposes of the data collection, sign language is not considered a primary language. Do not include it on the form. If there is a language not listed below and is spoken by 5 or more students designated as English learners or FEP students at your school, contact Nancy Chiu, Educational Demographics Office, at (916) 327-0208. It is possible that new language codes will be added in future years. Code/Language Code/Language Code/Language 11 Arabic 56 Albanian 12 Armenian 42 Assyrian 13 Burmese 03 Cantonese 36 Cebuano (Visayan) 54 Chaldean 20 Chamorro 39 Chaozhou (Chiuchow) 14 Croatian 15 Dutch 16 Farsi (Persian) 17 French 18 German 19 Greek 43 Gujarati 21 Hebrew 22 Hindi 23 Hmong
24 Hungarian 25 Ilocano 26 Indonesian 27 Italian 08 Japanese 09 Khmer (Cambodian) 50 Khmu 04 Korean 51 Kurdish 47 Lahu 10 Lao 07 Mandarin (Putonghua) 48 Marshallese 44 Mien (Yao) 49 Mixteco 40 Pashto 05 Pilipino (Tagalog or Filipino) 41 Polish 06 Portuguese
28 Punjabi 45 Rumanian 29 Russian 30 Samoan 52 Serbo-Croatian (Serbian) 01 Spanish 46 Taiwanese 32 Thai 57 Tigrinya 53 Toishanese 34 Tongan 33 Turkish 38 Ukrainian 35 Urdu 02 Vietnamese 99 All other non-English languages

APPENDIX D
LANGUAGE CENSUS FORM, 2000-01

Code
Language Census (LC) data may be submitted to the California Department of Education (CDE) using the LC Data Entry Assistant(LCDEA) software provided by CDE. Internet access and Windows 95 (or later version of Windows) are required in order to use thissoftware. If you choose to use this software application, do NOT submit any paper forms. Please check our site at http://www.cde.ca.gov/demographics/lc2001 for more information on the LCDEA software.
If you are using the LCDEA software, submit completeddata via the LCDEA software on or before April 3, 2001.
If you are not using the LCDEA software, complete andreturn this original form to CDE on or before April 3, 2001 to:
Educational Demographics Office California Department of Education P.O. Box 944272Sacramento, CA 94244-2720
Data submission assistance: Nancy Chiu, (916) 327-0208 [email protected]
English learner program and policy information:
David Dolson, (916) 654-3883 [email protected] Lauri Burnham, (916) 654-8787 [email protected]
Language Census, Spring 2001California Department of Education R30-LC (rev. 01/01)
Page 1 of 4
CDS Code:County name:District name:School name:
No English learner (EL) or Fluent-English Proficient (FEP) students enrolled as of March 1, 2001. Complete the contact information and certification below and submit only this page of the form by April 3, 2001.
English learner (EL) and/or Fluent-English Proficient (FEP) students enrolled as of March 1, 2001. Complete the contact information, certification, and Parts 1 through 5 and submit by April 3, 2001.
Check the correct submission option below:
Certification Of Language Census
Print name of person completing form
Phone
Date
Certification - I hereby certify that the data reported on this form are accurate. (If school data are compiled by the district office, a single cover letter which certifies the accuracy of
the data for all schools may be submitted instead of an individual certification for each school.)
Signature
Title
11 Arabic 56 Albanian 12 Armenian 42 Assyrian 13 Burmese 03 Cantonese 36 Cebuano (Visayan) 54 Chaldean 20 Chamorro (Guamanian) 39 Chaozhou (Chiuchow) 14 Croatian 15 Dutch 16 Farsi (Persian) 17 French 18 German 19 Greek 43 Gujarati 21 Hebrew 22 Hindi
23 Hmong 24 Hungarian 25 Ilocano 26 Indonesian 27 Italian 08 Japanese 09 Khmer (Cambodian) 50 Khmu 04 Korean 51 Kurdish 47 Lahu 10 Lao 07 Mandarin (Putonghua) 48 Marshallese 44 Mien (Yao) 49 Mixteco 40 Pashto 05 Pilipino (Tagalog or Filipino) 41 Polish
06 Portuguese 28 Punjabi 45 Rumanian 29 Russian 30 Samoan 52 Serbo-Croatian (Serbian) 01 Spanish 46 Taiwanese 32 Thai 57 Tigrinya 53 Toishanese 34 Tongan 33 Turkish 38 Ukrainian 35 Urdu 02 Vietnamese 99 All other non-English languages
Printed name
Date
Contact Information
Language Code Language Code Language
AFFIX LABEL HEREor type information
or contact CDE for assistance
Primary Language Codes (only these codes may be used in Part 1 and Part 5)
OR..

.
.
.
.
.
.
.
.
.
.
.
.
.
.
.
.
.
.
.
.
.
.
.
.
.
Language Census, Spring 2001California Department of Education R30-LC (rev. 01/01)
Page 2 of 4
County-District-Site Code:
School Name:
Type Kdgn 1st 2nd 3rd 4th 5th 6th 7th 8th 9th 10th 11th 12th Ungr
(c) (d) (e) (f) (g) (h) (i) (j) (k) (l) (m) (n) (o) (p) (q) (r)(a)
Language name
(b)
Code
Primary Language Grade Level (Do not enter zeros) RowTotal
Part 1English Learners (ELs) and Fluent-English Proficient (FEP) Students Report all ELs and FEP students enrolled as of March 1, 2001. Do not enter any zeros.
12
Totals - EL Totals - FEP
ELFEPELFEPELFEPELFEPELFEPELFEPELFEPELFEPELFEPELFEPELFEPELFEPELFEPELFEPELFEPELFEPELFEPELFEPELFEPELFEPELFEPELFEPELFEPELFEP

c.
Ro
w 9 an
d 16 m
ust m
atchLanguage Census, Spring 2001California Department of Education R30-LC (rev. 01/01)
Page 3 of 4
4
5
6
7
8
9
Structured English Immersion . . . . . . . . . . . . . . . . . . . . . . . . . . . . . . .
Alternative Course of Study . . . . . . . . . . . . . . . . . . . . . . . . . . . . . . . .
English Language Mainstream Class - Students Meeting Criteria . . . . . . . . . . . . . .
English Language Mainstream Class - Parental Request . . . . . . . . . . . . . . . . . .
Other Instructional Settings . . . . . . . . . . . . . . . . . . . . . . . . . . . . . . . . .
Total English learners (Sum of rows 4 through 8 - must also match row 1, col r & row 16)
4
5
6
7
8
9
Part 2 English Learners' Instructional Information
Ro
w 1, co
l. r and
row
9 mu
st match
10
11
12
13
14
15
16
10 English Language Development (ELD). . . . . . . . . . . . . . . . . . . . . . .
11 ELD and Specially Designed Academic Instruction in English (SDAIE) . . . . . .
12 ELD and SDAIE with Primary Language (L1) Support . . . . . . . . . . . . . .
13 ELD and Academic Subjects through the Primary Language (L1) . . . . . . . .
Instructional services other than those defined in rows 10 - 13 . . . . . . . . . . . . . .
Not receiving any English learner services. . . . . . . . . . . . . . . . . . . . . . . . .
Total English Learners (Sum of rows 10 through 15 - must also match row 1, col r & row 9)
14
15
16
Enter the total number of English learners redesignated as fluent-English proficient students sincethe last census (March 1, 2000). Include those who are no longer enrolled at the school (i.e.,graduated or moved).
Part 3 Students Redesignated
17
County-District-Site Code:
School Name:
Total English learners from Part 1, row 1, column r . . . . . . . . . . . . . .
17
English learners receiving services from teachers reported in Part 5
A.
B.English Learners Receiving Instructional ServicesChoose the row that most closely describes the services received by the English learners reported in Part 1.Count each English learner only once.
This school uses one or more of the following oral language assessment instruments in English for initialidentification of ELs and FEP students: BSM I-II (K-12); LAS I-II (K-12); Pre LAS (ages 4-6); BINL (K-12); IPT I-II(K-12); Pre IPT (ages 3-5); QSE (K-6) and/or Woodcock-Munoz Language Survey (PreK-12).
Part 4 Oral English Proficiency (check only one box)
This school uses an alternative instrument or procedure for initial identification of ELs and FEP students. The
district has on file a current CDE approved waiver to use the alternative instrument or procedure.
This school uses a method other than those identified above in a. and b. for initial identification of ELsand FEP students.
18
a.
b.
Number of English Learners Enrolled in Specific Instructional Settings Choose the row that most closely describes the placement of English learners reported in Part 1 as requiredby Education Code sections 300-340. Count each English learner only once.
3 3
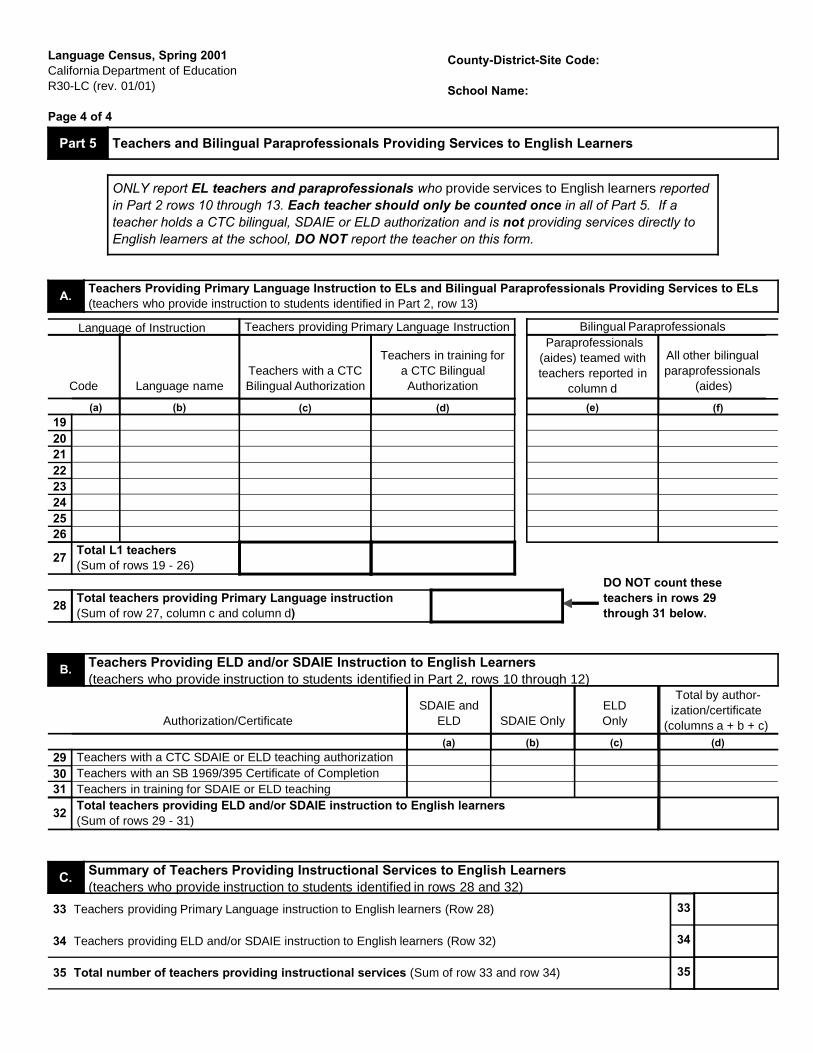
ONLY report EL teachers and paraprofessionals who provide services to English learners reportedin Part 2 rows 10 through 13. Each teacher should only be counted once in all of Part 5. If ateacher holds a CTC bilingual, SDAIE or ELD authorization and is not providing services directly toEnglish learners at the school, DO NOT report the teacher on this form.
Teachers providing Primary Language Instruction
Part 5 Teachers and Bilingual Paraprofessionals Providing Services to English Learners
Code Language nameTeachers with a CTCBilingual Authorization
Teachers in training fora CTC BilingualAuthorization
Paraprofessionals(aides) teamed withteachers reported in
column d
All other bilingualparaprofessionals
(aides)
Bilingual ParaprofessionalsLanguage of Instruction
33
34
35
33
34
35
Teachers providing Primary Language instruction to English learners (Row 28)
Teachers providing ELD and/or SDAIE instruction to English learners (Row 32)
Total number of teachers providing instructional services (Sum of row 33 and row 34)
Language Census, Spring 2001California Department of Education R30-LC (rev. 01/01)
Page 4 of 4
County-District-Site Code:
School Name:
(b) (c) (d) (e) (f)(a)
Total L1 teachers(Sum of rows 19 - 26)
Teachers with a CTC SDAIE or ELD teaching authorizationTeachers with an SB 1969/395 Certificate of CompletionTeachers in training for SDAIE or ELD teaching
293031
(b) (c) (d)(a)
SDAIE andELD SDAIE Only
ELD Only
Total by author-ization/certificate
(columns a + b + c) Authorization/Certificate
Total teachers providing ELD and/or SDAIE instruction to English learners (Sum of rows 29 - 31)
32
Total teachers providing Primary Language instruction (Sum of row 27, column c and column d)
28
DO NOT count theseteachers in rows 29through 31 below.
A.Teachers Providing Primary Language Instruction to ELs and Bilingual Paraprofessionals Providing Services to ELs(teachers who provide instruction to students identified in Part 2, row 13)
B. Teachers Providing ELD and/or SDAIE Instruction to English Learners (teachers who provide instruction to students identified in Part 2, rows 10 through 12)
1920212223242526
C. Summary of Teachers Providing Instructional Services to English Learners (teachers who provide instruction to students identified in rows 28 and 32)
27

APPENDIX F
PROGRAM ENROLLMENT IN CALIFORNIA, LOS ANGELES, SAN DIEGO, AND SAN FRANCISCO

OLD CATEGORIESSheltered English English w/ Withdrawn Other Total Other
Year Bilingual English Lang. Dev. L1 Supp. or None Services or None TotalNUMBER OF LEP OR EL STUDENTS ENROLLED
1989-90 287,774 87,774 119,058 148,694 218,231 218,231 861,531 1990-91 330,791 100,364 147,033 164,466 243,808 243,808 986,462 1991-92 359,829 117,650 161,689 182,343 257,194 257,194 1,078,705 1992-93 385,727 141,791 164,997 201,441 257,863 257,863 1,151,819 1993-94 341,905 152,272 175,076 223,217 322,748 322,748 1,215,218 1994-95 376,633 183,105 161,940 250,172 291,132 291,132 1,262,982 1995-96 399,340 211,386 178,978 260,828 273,235 273,235 1,323,767 1996-97 410,127 274,845 158,640 298,395 239,386 239,386 1,381,393 1997-98 409,879 307,176 159,617 305,764 223,730 223,730 1,406,166 1998-99 169,440 410,681 152,260 472,893 96,758 140,660 237,418 1,442,692 1999-00 169,929 486,091 151,518 427,720 90,749 154,503 245,252 1,480,527 2000-01 167,163 540,045 165,427 401,724 82,466 155,830 238,296 1,512,655
PERCENTAGE OF LEP OR EL STUDENTS ENROLLED1989-90 33% 10% 14% 17% 25% 25%1990-91 34% 10% 15% 17% 25% 25%1991-92 33% 11% 15% 17% 24% 24%1992-93 33% 12% 14% 17% 22% 22%1993-94 28% 13% 14% 18% 27% 27%1994-95 30% 14% 13% 20% 23% 23%1995-96 30% 16% 14% 20% 21% 21%1996-97 30% 20% 11% 22% 17% 17%1997-98 29% 22% 11% 22% 16% 16%1998-99 12% 28% 11% 33% 7% 10% 16%1999-00 11% 33% 10% 29% 6% 10% 17%2000-01 11% 36% 11% 27% 5% 10% 16%
NEW CATEGORIES
Year
Bilingual Ed./Alt. Ed./Charter School
Structured English Immersion
Mainstream-Student Meets Criteria
Mainstream-Parent Request Other Total
NUMBER OF LEP OR EL STUDENTS ENROLLED
1998-99 179,334 702,592 416,962 44,947 98,857 1,442,6921999-00 187,832 691,212 450,424 39,808 111,251 1,480,5272000-01 181,455 721,364 472,697 44,921 92,218 1,512,655
PERCENTAGE OF LEP OR EL STUDENTS ENROLLED1998-99 12% 49% 29% 3% 7%1999-00 13% 47% 30% 3% 8%2000-01 12% 48% 31% 3% 6%
Table F.1
Program Enrollment by Year in State of California

OLD CATEGORIESNUMBER OF LEP OR EL STUDENTS ENROLLED
Total Sheltered English English w/ Withdrawn Other Other
Year Bilingual English Lang. Dev. L1 Supp. or None Services or None Total1996-97 363,476 140,482 80,643 215,077 114,878 114,878 914,556 1997-98 363,568 171,276 72,450 224,314 101,240 101,240 932,848 1998-99 148,396 256,914 65,953 383,104 38,499 64,579 103,078 957,445 1999-00 153,643 317,020 61,519 349,037 31,317 64,705 96,022 977,241 2000-01 150,276 352,415 70,815 322,065 25,505 66,806 92,311 987,882
PERCENTAGE OF LEP OR EL STUDENTS ENROLLEDTotal
Sheltered English English w/ Withdrawn Other OtherYear Bilingual English Lang. Dev. L1 Supp. or None Services or None1996-97 40% 15% 9% 24% 13% 13%1997-98 39% 18% 8% 24% 11% 11%1998-99 15% 27% 7% 40% 4% 7% 11%1999-00 16% 32% 6% 36% 3% 7% 10%2000-01 15% 36% 7% 33% 3% 7% 9%
NEW CATEGORIES
NUMBER OF LEP OR EL STUDENTS ENROLLED
Year
Bilingual Ed./Alt. Ed./Charter School
Structured English Immersion
Mainstream-Student Meets Criteria
Mainstream-Parent Request Other Total
1998-99 158,365 540,002 180,116 31,876 47,086 957,445 1999-00 164,967 532,285 206,415 28,076 45,498 977,241 2000-01 159,642 550,093 211,768 30,337 36,042 987,882
PERCENTAGE OF LEP OR EL STUDENTS ENROLLED
Year
Bilingual Ed./Alt. Ed./Charter School
Structured English Immersion
Mainstream-Student Meets Criteria
Mainstream-Parent Request Other
1998-99 17% 56% 19% 3% 5%1999-00 17% 54% 21% 3% 5%2000-01 16% 56% 21% 3% 4%
Table F.2
Program Enrollment in State of CaliforniaElementary Schools Only

OLD CATEGORIESSheltered English English w/ Withdrawn Other Total Other
Year Bilingual English Lang. Dev. L1 Supp. or None Services or None TotalNUMBER OF LEP OR EL STUDENTS ENROLLED
1989-90 116,896 14,991 12,182 29,527 39,710 39,710 213,306 1990-91 134,872 17,011 25,818 24,471 39,795 39,795 241,967 1991-92 147,981 20,267 23,663 28,630 43,367 43,367 263,908 1992-93 155,171 20,688 25,219 31,813 47,008 47,008 279,899 1993-94 93,254 8,824 20,226 41,392 127,831 127,831 291,527 1994-95 101,691 11,988 11,358 51,548 118,416 118,416 295,001 1995-96 100,853 17,627 27,574 56,622 98,304 98,304 300,980 1996-97 101,882 42,100 14,852 77,196 73,772 73,772 309,802 1997-98 107,706 33,877 23,388 79,981 67,519 67,519 312,471 1998-99 14,575 37,208 24,632 173,255 890 62,882 63,772 313,442 1999-00 19,983 36,302 25,736 164,522 1,148 64,267 65,415 311,958 2000-01 17,066 39,667 26,327 161,684 1,465 61,385 62,850 307,594
PERCENTAGE OF LEP OR EL STUDENTS ENROLLED1989-90 55% 7% 6% 14% 19% 19%1990-91 56% 7% 11% 10% 16% 16%1991-92 56% 8% 9% 11% 16% 16%1992-93 55% 7% 9% 11% 17% 17%1993-94 32% 3% 7% 14% 44% 44%1994-95 34% 4% 4% 17% 40% 40%1995-96 34% 6% 9% 19% 33% 33%1996-97 33% 14% 5% 25% 24% 24%1997-98 34% 11% 7% 26% 22% 22%1998-99 5% 12% 8% 55% 0% 20% 20%1999-00 6% 12% 8% 53% 0% 21% 21%2000-01 6% 13% 9% 53% 0% 20% 20%
NEW CATEGORIES
Year
Bilingual Ed./Alt. Ed./Charter School
Structured English Immersion
Mainstream-Student Meets Criteria
Mainstream-Parent Request Other Total
NUMBER OF LEP OR EL STUDENTS ENROLLED
1998-99 15,757 213,200 82,448 1,147 890 313,442 1999-00 26,118 200,462 82,713 1,517 1,148 311,958 2000-01 22,270 205,631 76,975 1,570 1,148 307,594
PERCENTAGE OF LEP OR EL STUDENTS ENROLLED1998-99 5% 68% 26% 0% 0%1999-00 8% 64% 27% 0% 0%2000-01 7% 67% 25% 1% 0%
Program Enrollment in Los Angeles Unified School DistrictTable F.3
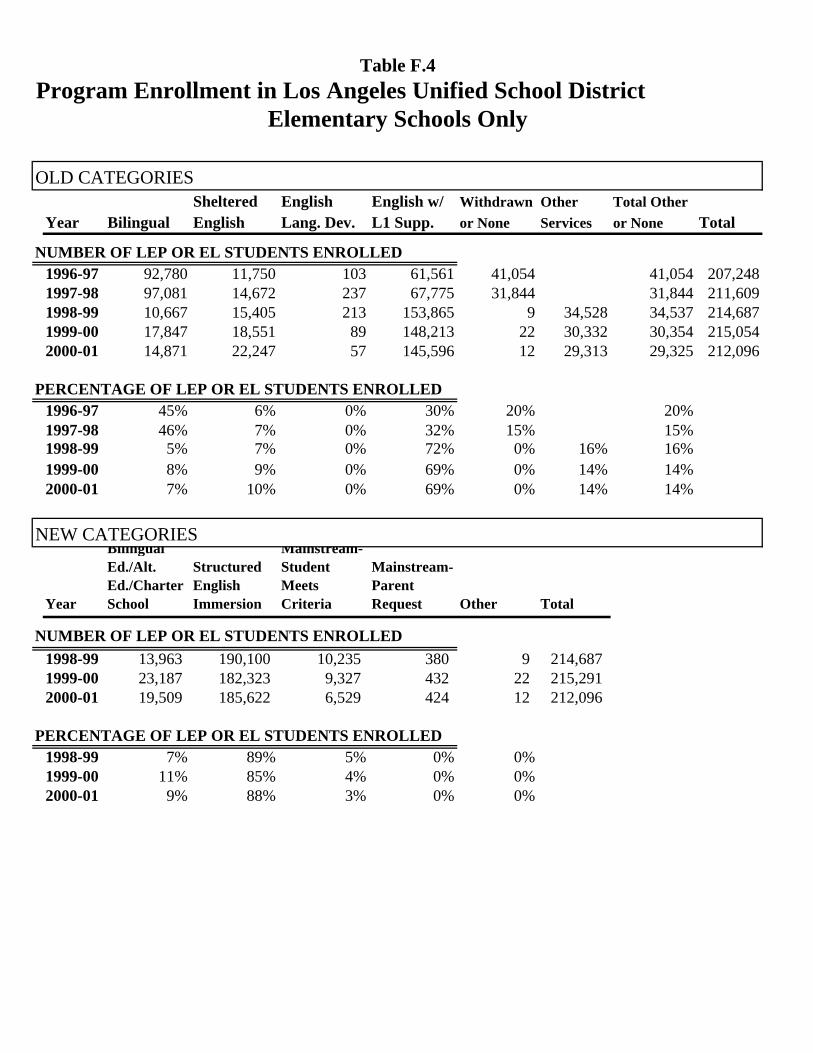
OLD CATEGORIESSheltered English English w/ Withdrawn Other Total Other
Year Bilingual English Lang. Dev. L1 Supp. or None Services or None Total
NUMBER OF LEP OR EL STUDENTS ENROLLED1996-97 92,780 11,750 103 61,561 41,054 41,054 207,2481997-98 97,081 14,672 237 67,775 31,844 31,844 211,6091998-99 10,667 15,405 213 153,865 9 34,528 34,537 214,6871999-00 17,847 18,551 89 148,213 22 30,332 30,354 215,0542000-01 14,871 22,247 57 145,596 12 29,313 29,325 212,096
PERCENTAGE OF LEP OR EL STUDENTS ENROLLED1996-97 45% 6% 0% 30% 20% 20%1997-98 46% 7% 0% 32% 15% 15%1998-99 5% 7% 0% 72% 0% 16% 16%1999-00 8% 9% 0% 69% 0% 14% 14%2000-01 7% 10% 0% 69% 0% 14% 14%
NEW CATEGORIES
Year
Bilingual Ed./Alt. Ed./Charter School
Structured English Immersion
Mainstream-Student Meets Criteria
Mainstream-Parent Request Other Total
NUMBER OF LEP OR EL STUDENTS ENROLLED
1998-99 13,963 190,100 10,235 380 9 214,687 1999-00 23,187 182,323 9,327 432 22 215,291 2000-01 19,509 185,622 6,529 424 12 212,096
PERCENTAGE OF LEP OR EL STUDENTS ENROLLED1998-99 7% 89% 5% 0% 0%1999-00 11% 85% 4% 0% 0%2000-01 9% 88% 3% 0% 0%
Table F.4
Program Enrollment in Los Angeles Unified School DistrictElementary Schools Only

OLD CATEGORIESSheltered English English w/ Withdrawn Other Total Other
Year Bilingual English Lang. Dev. L1 Supp. or None Services or None TotalNUMBER OF LEP OR EL STUDENTS
1989-90 6,142 1,810 7,438 3,512 3,419 3,419 22,321 1990-91 8,420 1,945 6,987 3,720 3,963 3,963 25,035 1991-92 10,500 3,704 6,335 2,009 5,260 5,260 27,808 1992-93 9,609 4,532 5,329 4,099 7,241 7,241 30,810 1993-94 10,410 6,984 7,207 3,019 5,777 5,777 33,397 1994-95 9,902 5,443 5,922 5,384 7,710 7,710 34,361 1995-96 11,546 7,287 5,482 5,795 5,944 5,944 36,054 1996-97 12,462 7,833 6,151 6,389 4,578 4,578 37,413 1997-98 12,704 10,173 4,013 7,248 4,404 4,404 38,542 1998-99 6,703 14,838 4,291 8,527 2,161 2,248 4,409 38,768 1999-00 10,231 21,294 1,584 3,144 1,748 1,490 3,238 39,491 2000-01 10,820 25,125 159 1,937 232 594 826 38,867
PERCENTAGE OF LEP OR EL STUDENTS1989-90 28% 8% 33% 16% 15% 15%1990-91 34% 8% 28% 15% 16% 16%1991-92 38% 13% 23% 7% 19% 19%1992-93 31% 15% 17% 13% 24% 24%1993-94 31% 21% 22% 9% 17% 17%1994-95 29% 16% 17% 16% 22% 22%1995-96 32% 20% 15% 16% 16% 16%1996-97 33% 21% 16% 17% 12% 12%1997-98 33% 26% 10% 19% 11% 11%1998-99 17% 38% 11% 22% 6% 6% 11%1999-00 26% 54% 4% 8% 4% 4% 8%2000-01 28% 65% 0% 5% 1% 2% 2%
NEW CATEGORIES
Year
Bilingual Ed./Alt. Ed./Charter School
Structured English Immersion
Mainstream-Student Meets Criteria
Mainstream-Parent Request Other Total
NUMBER OF LEP OR EL STUDENTS ENROLLED
1998-99 6,702 23,253 4,406 537 3,870 38,768 1999-00 10,863 15,364 10,699 345 2,220 39,491 2000-01 12,399 10,822 14,880 107 659 38,867
PERCENTAGE OF LEP OR EL STUDENTS ENROLLED1998-99 17% 60% 11% 1% 10%1999-00 28% 39% 27% 1% 6%2000-01 32% 28% 38% 0% 2%
Program Enrollment in San Diego City Unified School DistrictTable F.5

OLD CATEGORIESSheltered English English w/ Withdrawn Other Total Other
Year Bilingual English Lang. Dev. L1 Supp. or None Services or None Total
NUMBER OF LEP OR EL STUDENTS ENROLLED
1996-97 10,953 4,341 3,557 4,908 1,032 1,032 24,7911997-98 10,921 5,973 2,016 5,875 814 814 25,5991998-99 6,587 8,641 2,510 6,683 186 657 843 25,2641999-00 9,962 13,740 259 1,477 151 525 676 26,1142000-01 10,391 14,686 3 552 7 187 194 25,826
PERCENTAGE OF LEP OR EL STUDENTS ENROLLED
1996-97 44% 18% 14% 20% 4% 4%1997-98 43% 23% 8% 23% 3% 3%1998-99 26% 34% 10% 26% 1% 3% 3%1999-00 38% 53% 1% 6% 1% 2% 3%2000-01 40% 57% 0% 2% 0% 1% 1%
NEW CATEGORIES
Year
Bilingual Ed./Alt. Ed./Charter School
Structured English Immersion
Mainstream-Student Meets Criteria
Mainstream-Parent Request Other Total
NUMBER OF LEP OR EL STUDENTS ENROLLED
1998-99 6,586 15,224 1,602 422 1,430 25,2641999-00 10,362 9,639 5,408 267 438 26,114
2000-01 10,393 5,103 5,103 87 63 25,826
PERCENTAGE OF LEP OR EL STUDENTS ENROLLED1998-99 26% 60% 6% 2% 6%1999-00 40% 37% 21% 1% 2%2000-01 40% 20% 20% 0% 0%
Table F.6
Program Enrollment in San Diego City School DistrictElementary Schools Only

OLD CATEGORIESSheltered English English w/ Withdrawn Other Total Other
Year Bilingual English Lang. Dev. L1 Supp. or None Services or None TotalNUMBER OF LEP OR EL STUDENTS ENROLLED
1989-90 5,146 4,420 2,625 4,083 1,361 1,361 17,635 1990-91 4,563 3,981 2,791 4,182 1,597 1,597 17,114 1991-92 5,394 4,697 2,319 3,765 1,391 1,391 17,566 1992-93 5,614 5,350 2,397 3,100 1,365 1,365 17,826 1993-94 5,730 5,557 1,892 2,511 1,983 1,983 17,673 1994-95 7,956 5,501 1,065 1,809 1,291 1,291 17,622 1995-96 7,986 5,689 674 1,603 2,587 2,587 18,539 1996-97 7,699 2,480 5,814 0 3,466 3,466 19,459 1997-98 8,210 7,919 1,429 0 1,320 1,320 18,878 1998-99 7,985 6,763 259 1,719 1,289 737 2,026 18,752 1999-00 6,663 5,426 1,877 1,661 2,368 631 2,999 18,626 2000-01 6,186 6,822 239 2,065 2,027 698 2,725 18,037
PERCENTAGE OF LEP OR EL STUDENTS ENROLLED1989-90 29% 25% 15% 23% 8% 8%1990-91 27% 23% 16% 24% 9% 9%1991-92 31% 27% 13% 21% 8% 8%1992-93 31% 30% 13% 17% 8% 8%1993-94 32% 31% 11% 14% 11% 11%1994-95 45% 31% 6% 10% 7% 7%1995-96 43% 31% 4% 9% 14% 14%1996-97 40% 13% 30% 0% 18% 18%1997-98 43% 42% 8% 0% 7% 7%1998-99 43% 36% 1% 9% 7% 4% 11%1999-00 36% 29% 10% 9% 13% 3% 16%2000-01 34% 38% 1% 11% 11% 4% 15%
NEW CATEGORIES
Year
Bilingual Ed./Alt. Ed./Charter School
Structured English Immersion
Mainstream-Student Meets Criteria
Mainstream-Parent Request Other Total
NUMBER OF LEP OR EL STUDENTS ENROLLED
1998-99 7,993 8,755 0 1,290 714 18,7521999-00 6,663 8,964 0 1,201 1,798 18,6262000-01 9,126 6,186 0 1,306 1,419 18,037
Program Enrollment in San Francisco Unified School DistrictTable F.7

OLD CATEGORIES
Sheltered English English w/ Withdrawn Other Total OtherYear Bilingual English Lang. Dev. L1 Supp. or None Services or None Total
NUMBER OF LEP OR EL STUDENTS ENROLLED1996-97 6,513 0 4,647 0 786 786 11,9461997-98 6,504 5,072 154 0 330 330 12,0601998-99 6,154 4,014 0 1,036 347 266 613 11,8171999-00 5,577 4,818 0 728 473 255 728 11,8512000-01 5,234 4,190 0 1,100 588 314 902 11,426
PERCENTAGE OF LEP OR EL STUDENTS ENROLLED
1996-97 55% 0% 39% 0% 7% 7%1997-98 54% 42% 1% 0% 3% 3%1998-99 52% 34% 0% 9% 3% 2% 5%1999-00 47% 41% 0% 6% 4% 2% 6%2000-01 46% 37% 0% 10% 5% 3% 8%
NEW CATEGORIES
Year
Bilingual Ed./Alt. Ed./Charter School
Structured English Immersion
Mainstream-Student Meets Criteria
Mainstream-Parent Request Other Total
NUMBER OF LEP OR EL STUDENTS ENROLLED
1998-99 6,154 5,050 0 347 266 11,8171999-00 5,577 5,546 0 349 379 11,8512000-01 5,234 5,290 0 340 562 11,426
PERCENTAGE OF LEP OR EL STUDENTS ENROLLED1998-99 52% 43% 0% 3% 2%1999-00 47% 47% 0% 3% 3%2000-01 46% 46% 0% 3% 5%
Table F.8
Program Enrollment in San Francisco Unified School DistrictElementary Schools Only

APPENDIX G
BILINGUAL EDUCATION ENROLLMENT IN THE LARGEST SCHOOL DISTRICTS IN CALIFORNIA

97-98 98-99 99-00 00-01 00-01 00-01 1 Yr. 3 Yr. 1 Yr. 3 Yr.Bil. Bil. Bil. Bil. 00-01 Spanish Total 97-98 98-99 99-00 00-01 Change Change Change Change
DISTRICT COUNTY Ed. Ed. Ed. Ed. LEP/EL LEP/EL Enrollment % Bil. % Bil. % Bil. % Bil. # Bil. # Bil. % Bil. % Bil.ABC Unified Los Angeles 1,856 487 475 472 4,859 3,178 22,303 36% 10% 10% 10% -1,369 -1,384 -26% -26%Anaheim Elementary Orange 0 0 91 77 13,761 13,114 22,275 0% 0% 1% 1% 0 77 0% 1%Anaheim Union High Orange 215 7 28 0 8,256 6,951 29,363 3% 0% 0% 0% -208 -215 -2% -3%Antioch Unified Contra Costa 0 0 0 0 1,237 998 20,018 0% 0% 0% 0% 0 0 0% 0%Bakersfield City ElementaryKern 1 1 616 520 8,103 7,880 27,674 0% 0% 8% 6% 0 519 0% 6%Capistrano Unified Orange 959 216 254 222 6,537 5,175 45,074 19% 4% 4% 3% -743 -737 -15% -15%Chino Valley Unified San Bernardi 583 0 0 0 4,026 3,508 31,763 15% 0% 0% 0% -583 -583 -15% -15%Chula Vista Elementary San Diego 3,523 1668 2,437 2757 7,718 7,240 23,132 50% 23% 33% 36% -1,855 -766 -27% -14%Clovis Unified Fresno 375 0 0 0 2,959 914 32,717 12% 0% 0% 0% -375 -375 -12% -12%Colton Joint Unified San Bernardi 584 0 0 0 4,051 3,867 22,118 16% 0% 0% 0% -584 -584 -16% -16%Compton Unified Los Angeles 3,996 621 436 292 18,861 18,727 31,037 35% 5% 3% 2% -3,375 -3,704 -30% -33%Conejo Valley Unified Ventura 0 0 0 0 1,643 1,416 20,999 0% 0% 0% 0% 0 0 0% 0%Corona-Norco Unified Riverside 1,054 369 389 382 5,866 5,613 37,487 20% 7% 7% 7% -685 -672 -13% -14%Desert Sands Unified Riverside 2,483 827 621 423 6,720 6,612 23,500 44% 14% 10% 6% -1,656 -2,060 -30% -38%Downey Unified Los Angeles 229 234 228 157 5,779 5,447 21,474 4% 4% 4% 3% 5 -72 0% -2%East Side Union High Santa Clara 269 145 151 274 4,612 2,676 24,282 5% 3% 3% 6% -124 5 -2% 1%Elk Grove Unified Sacramento 0 0 0 0 9,692 3,116 47,736 0% 0% 0% 0% 0 0 0% 0%Fairfield-Suisun Unified Solano 214 225 242 255 2,721 1,985 22,263 9% 9% 10% 9% 11 41 0% 0%Fontana Unified San Bernardi 1,756 0 0 0 12,692 12,560 37,244 19% 0% 0% 0% -1,756 -1,756 -19% -19%Fremont Unified Alameda 511 569 475 559 3,792 1,226 31,078 14% 15% 12% 15% 58 48 1% 1%Fresno Unified Fresno 4,215 2,755 2,677 2910 24,491 14,033 79,007 17% 11% 11% 12% -1,460 -1,305 -6% -5%Garden Grove Unified Orange 633 0 0 0 24,847 16,270 48,742 3% 0% 0% 0% -633 -633 -3% -3%Glendale Unified Los Angeles 1,410 547 450 308 11,846 3,921 30,329 11% 4% 4% 3% -863 -1,102 -6% -8%Grossmont Union High San Diego 0 0 0 0 1,266 834 23,639 0% 0% 0% 0% 0 0 0% 0%Hacienda la Puente Unified Los Angeles 2,249 16 11 34 6,411 5,438 24,646 38% 0% 0% 1% -2,233 -2,215 -37% -37%Hayward Unified Alameda 1,881 1971 1,985 2276 7,451 5,553 24,205 32% 31% 28% 31% 90 395 -1% -1%Irvine Unified Orange 0 0 0 0 2,660 277 23,961 0% 0% 0% 0% 0 0 0% 0%Kern Union High Kern 152 0 0 0 3,440 3,232 29,333 5% 0% 0% 0% -152 -152 -5% -5%Lodi Unified San Joaquin 655 109 74 58 8,030 3,971 27,339 9% 1% 1% 1% -546 -597 -8% -8%Long Beach Unified Los Angeles 12,093 942 2,007 998 31,697 26,046 93,694 39% 3% 6% 3% -11,151 -11,095 -36% -36%Los Angeles Unified Los Angeles 107,706 14,575 19,983 17066 307,594 287,648 721,346 34% 5% 6% 6% -93,131 -90,640 -30% -29%Montebello Unified Los Angeles 10,896 7,837 7,156 7145 15,910 15,525 34,794 63% 47% 43% 45% -3,059 -3,751 -16% -18%Moreno Valley Unified Riverside 1,973 571 584 689 8,094 7,246 32,730 32% 9% 8% 9% -1,402 -1,284 -23% -23%Mt. Diablo Unified Contra Costa 581 360 339 336 4,333 3,221 36,648 16% 10% 9% 8% -221 -245 -6% -8%Newport-Mesa Unified Orange 972 0 0 0 6,183 5,721 21,658 18% 0% 0% 0% -972 -972 -18% -18%Norwalk-La Mirada UnifiedLos Angeles 2,244 155 397 385 4,807 4,483 23,610 44% 3% 8% 8% -2,089 -1,859 -41% -36%Oakland Unified Alameda 3,447 7,728 7,090 6835 19,362 12,516 54,863 19% 41% 37% 35% 4,281 3,388 22% 16%Oceanside Unified San Diego 2,409 0 0 0 5,348 5,140 22,354 54% 0% 0% 0% -2,409 -2,409 -54% -54%Ontario-Montclair ElementarySan Bernardi 2,488 2,938 2,817 1745 13,471 13,015 26,407 21% 23% 21% 13% 450 -743 3% -8%Orange Unified Orange 0 0 0 55 7,338 6,555 31,097 0% 0% 0% 1% 0 55 0% 1%Palm Springs Unified Riverside 1,676 790 682 532 5,886 5,715 20,847 34% 15% 12% 9% -886 -1,144 -19% -25%Palmdale Elementary Los Angeles 580 600 544 544 4,441 4,313 20,853 18% 17% 14% 12% 20 -36 -1% -6%Pasadena Unified Los Angeles 3,498 110 75 52 5,988 5,588 23,559 53% 2% 1% 1% -3,388 -3,446 -51% -52%Placentia-Yorba Linda UnifiedOrange 1,100 714 841 1236 4,295 3,874 26,046 28% 18% 20% 29% -386 136 -11% 0%Pomona Unified Los Angeles 5,461 3,766 3,495 3231 16,153 15,404 34,479 36% 24% 22% 20% -1,695 -2,230 -12% -16%
Table G.1Bilingual Education Pre and Post Proposition 227 in Largest (at or above 20,000 in 2000-01) School Districts in California
G.1 - 1

97-98 98-99 99-00 00-01 00-01 00-01 1 Yr. 3 Yr. 1 Yr. 3 Yr.Bil. Bil. Bil. Bil. 00-01 Spanish Total 97-98 98-99 99-00 00-01 Change Change Change Change
DISTRICT COUNTY Ed. Ed. Ed. Ed. LEP/EL LEP/EL Enrollment % Bil. % Bil. % Bil. % Bil. # Bil. # Bil. % Bil. % Bil.
Table G.1Bilingual Education Pre and Post Proposition 227 in Largest (at or above 20,000 in 2000-01) School Districts in California
Poway Unified San Diego 108 53 56 62 2,234 640 32,532 6% 3% 3% 3% -55 -46 -3% -3%Rialto Unified San Bernardi 1,827 61 64 76 6,165 5,853 28,060 34% 1% 1% 1% -1,766 -1,751 -33% -33%Riverside Unified Riverside 1,708 172 132 1474 6,272 5,845 38,124 32% 3% 2% 24% -1,536 -234 -29% -8%Sacramento City Unified Sacramento 1,318 626 656 776 15,389 6,081 52,702 9% 4% 4% 5% -692 -542 -5% -4%Saddleback Valley Unified Orange 114 123 127 145 2,415 1,937 35,199 5% 5% 5% 6% 9 31 0% 1%San Bernardino City UnifiedSan Bernardi 4,888 3,451 3,073 4067 12,990 12,208 52,031 49% 31% 26% 31% -1,437 -821 -19% -18%San Diego City Unified San Diego 12,704 6,703 10,231 10820 38,867 30,787 141,804 33% 17% 26% 28% -6,001 -1,884 -16% -5%San Francisco Unified San Francisc 8,210 7,985 6,663 6186 18,037 6,895 59,979 43% 43% 36% 34% -225 -2,024 -1% -9%San Jose Unified Santa Clara 4,560 3,358 3,205 3091 8,916 7,560 33,015 50% 38% 35% 35% -1,202 -1,469 -13% -16%San Juan Unified Sacramento 87 0 0 0 3,456 1,024 50,240 3% 0% 0% 0% -87 -87 -3% -3%San Ramon Valley Unified Contra Costa 0 0 0 0 416 54 20,742 0% 0% 0% 0% 0 0 0% 0%Santa Ana Unified Orange 11,029 5,894 6,149 6302 39,934 38,917 60,643 29% 15% 16% 16% -5,135 -4,727 -14% -13%Simi Valley Unified Ventura 27 0 0 0 1,387 1,162 21,181 2% 0% 0% 0% -27 -27 -2% -2%Stockton City Unified San Joaquin 1,678 197 264 334 9,723 6,126 37,573 16% 2% 3% 3% -1,481 -1,344 -14% -12%Sweetwater Union High San Diego 1,989 1,216 1,592 1872 7,699 7,283 35,330 29% 17% 20% 24% -773 -117 -12% -4%Torrance Unified Los Angeles 95 0 0 0 3,371 914 24,118 3% 0% 0% 0% -95 -95 -3% -3%Vallejo City Unified Solano 86 0 0 38 2,933 1,816 20,270 4% 0% 0% 1% -86 -48 -4% -3%Visalia Unified Tulare 1,144 661 897 694 5,228 4,060 23,989 21% 12% 17% 13% -483 -450 -9% -8%Vista Unified San Diego 3,582 3,532 3,186 3414 6,599 6,395 27,651 58% 54% 47% 52% -50 -168 -4% -6%West Contra Costa Unified Contra Costa 1,843 1,755 1,761 1825 8,699 6,448 34,499 25% 22% 21% 21% -88 -18 -3% -4%TOTALS 243,924 87,640 95,706 94,001 885,957 739,747 2,939,405 29% 10% 11% 11% -156,284 -149,923 -19% -18%
G.1 - 2

97-98 98-99 99-00 00-01 00-01 00-01 1 Yr. 3Yr. 1 Yr. 3 Yr.Biling. Biling. Biling. Biling. 00-01 Spanish District 97-98 98-99 99-00 00-01 Change Change Change Change
DISTRICT COUNTY Educ. Educ. Educ. Educ. LEP/EL LEP/EL Enrollment % Bil. % Bil. % Bil. % Bil. # Bil. # Bil. % Bil. % Bil.ABC Unified Los Angeles 1,817 487 475 472 3,419 2,288 22,303 50% 13% 13% 14% -1,330 -1345 -36% -36%Anaheim Elementary Orange 2 0 91 77 13,761 13,114 22,275 0% 0% 1% 1% -2 75 0% 1%Antioch Unified Contra Costa 0 0 0 0 814 671 20,018 0% 0% 0% 0% 0 0 0% 0%Bakersfield City Elementary Kern 20 987 614 498 6,282 6,120 27,674 0% 16% 10% 8% 967 478 16% 8%Capistrano Unified Orange 959 205 254 222 4,222 3,377 45,074 26% 5% 6% 5% -754 -737 -21% -21%Chino Valley Unified San Bernardi 547 0 0 0 2,504 2,219 31,763 22% 0% 0% 0% -547 -547 -22% -22%Chula Vista Elementary San Diego 3,524 1,668 2,437 2,757 7,718 7,240 23,132 50% 23% 33% 36% -1,856 -767 -27% -14%Clovis Unified Fresno 329 0 0 0 1,828 566 32,717 16% 0% 0% 0% -329 -329 -16% -16%Colton Joint Unified San Bernardi 496 0 0 0 2,735 2,608 22,118 20% 0% 0% 0% -496 -496 -20% -20%Compton Unified Los Angeles 3,270 503 400 292 11,605 11,511 31,037 43% 6% 4% 3% -2,767 -2978 -37% -40%Conejo Valley Unified Ventura 0 0 0 0 1,148 1,006 20,999 0% 0% 0% 0% 0 0 0% 0%Corona-Norco Unified Riverside 1,015 369 389 382 3,918 3,762 37,487 28% 10% 10% 10% -646 -633 -18% -18%Desert Sands Unified Riverside 2,105 690 502 263 4,114 4,065 23,500 59% 18% 13% 6% -1,415 -1842 -41% -53%Downey Unified Los Angeles 215 234 228 157 3,063 2,894 21,474 7% 7% 7% 5% 19 -58 0% -2%Elk Grove Unified Sacramento 0 0 0 0 5,831 2,074 47,736 0% 0% 0% 0% 0 0 0% 0%Fairfield-Suisun Unified Solano 214 225 242 255 1,749 1,390 22,263 15% 15% 15% 15% 11 41 0% 0%Fontana Unified San Bernardi 1,198 0 0 0 8,139 8,062 37,244 20% 0% 0% 0% -1,198 -1198 -20% -20%Fremont Unified Alameda 512 569 475 559 2,361 796 31,078 22% 23% 19% 24% 57 47 2% 2%Fresno Unified Fresno 3,545 2,589 2,329 2,525 15,323 9,188 79,007 21% 15% 15% 16% -956 -1020 -5% -4%Garden Grove Unified Orange 633 0 0 0 16,989 11,326 48,742 4% 0% 0% 0% -633 -633 -4% -4%Glendale Unified Los Angeles 1,410 547 450 308 7,631 2,703 30,329 17% 7% 6% 4% -863 -1102 -10% -13%Hacienda la Puente Unified Los Angeles 2,122 0 0 0 4,162 3,633 24,646 52% 0% 0% 0% -2,122 -2122 -52% -52%Hayward Unified Alameda 1,743 1,885 1,955 2,196 5,010 3,900 24,205 43% 43% 40% 44% 142 453 0% 1%Irvine Unified Orange 0 0 0 0 1,532 153 23,961 0% 0% 0% 0% 0 0 0% 0%Lodi Unified San Joaquin 630 84 66 30 4,970 2,677 27,339 14% 2% 1% 1% -546 -600 -12% -14%Long Beach Unified Los Angeles 10,821 876 1,763 916 20,185 16,864 93,694 52% 4% 8% 5% -9,945 -9905 -48% -48%Los Angeles Unified Los Angeles 97,081 10,667 17,847 14,871 212,096 199,869 721,346 46% 5% 8% 7% -86,414 -82210 -41% -39%Montebello Unified Los Angeles 8,074 6,602 6,331 6,082 8,863 8,653 34,794 88% 72% 69% 69% -1,472 -1992 -16% -19%Moreno Valley Unified Riverside 1,784 425 414 541 4,854 4,365 32,730 49% 11% 10% 11% -1,359 -1243 -38% -38%Mt. Diablo Unified Contra Costa 530 360 339 336 2,371 1,854 36,648 25% 18% 16% 14% -170 -194 -7% -11%Newport-Mesa Unified Orange 972 0 0 0 3,893 3,665 21,658 27% 0% 0% 0% -972 -972 -27% -27%Norwalk-La Mirada Unified Los Angeles 1,856 155 386 385 2,649 2,492 23,610 59% 5% 13% 15% -1,701 -1471 -53% -44%Oakland Unified Alameda 2,906 6,525 6,154 6,265 11,583 7,979 54,863 26% 57% 54% 54% 3,619 3359 30% 28%Oceanside Unified San Diego 1,820 0 0 0 3,743 3,623 22,354 52% 0% 0% 0% -1,820 -1820 -52% -52%Ontario-Montclair Elementary San Bernardi 2,299 2,798 2,626 1,745 10,717 10,366 26,407 24% 28% 24% 16% 499 -554 4% -7%Orange Unified Orange 0 0 0 0 4,636 4,250 31,097 0% 0% 0% 0% 0 0 0% 0%Palm Springs Unified Riverside 1,511 722 627 502 4,453 4,324 20,847 42% 19% 15% 11% -789 -1009 -23% -31%Palmdale Elementary Los Angeles 580 600 544 498 3,753 3,660 20,853 21% 19% 17% 13% 20 -82 -1% -7%Pasadena Unified Los Angeles 2,985 110 75 52 3,612 3,362 23,559 70% 3% 2% 1% -2,875 -2933 -67% -68%Placentia-Yorba Linda UnifiedOrange 1,100 714 841 1,212 2,845 2,595 26,046 43% 26% 29% 43% -386 112 -17% -1%Pomona Unified Los Angeles 5,068 3,455 3,400 3,166 9,860 9,511 34,479 53% 35% 34% 32% -1,613 -1902 -18% -21%Poway Unified San Diego 95 53 56 62 1,517 424 32,532 7% 4% 4% 4% -42 -33 -3% -3%Rialto Unified San Bernardi 1,727 61 64 76 3,225 3,098 28,060 52% 2% 2% 2% -1,666 -1651 -50% -49%Riverside Unified Riverside 1,592 61 35 1,344 4,268 4,008 38,124 40% 1% 1% 31% -1,531 -248 -39% -9%Sacramento City Unified Sacramento 1,052 626 656 776 10,271 4,324 52,702 11% 6% 7% 8% -426 -276 -4% -3%
Table G.2Elementary Bilingual Education Pre and Post Proposition 227 in Largest (at or above 20,000 in 2000-01) School Districts in California
G.2 - 1
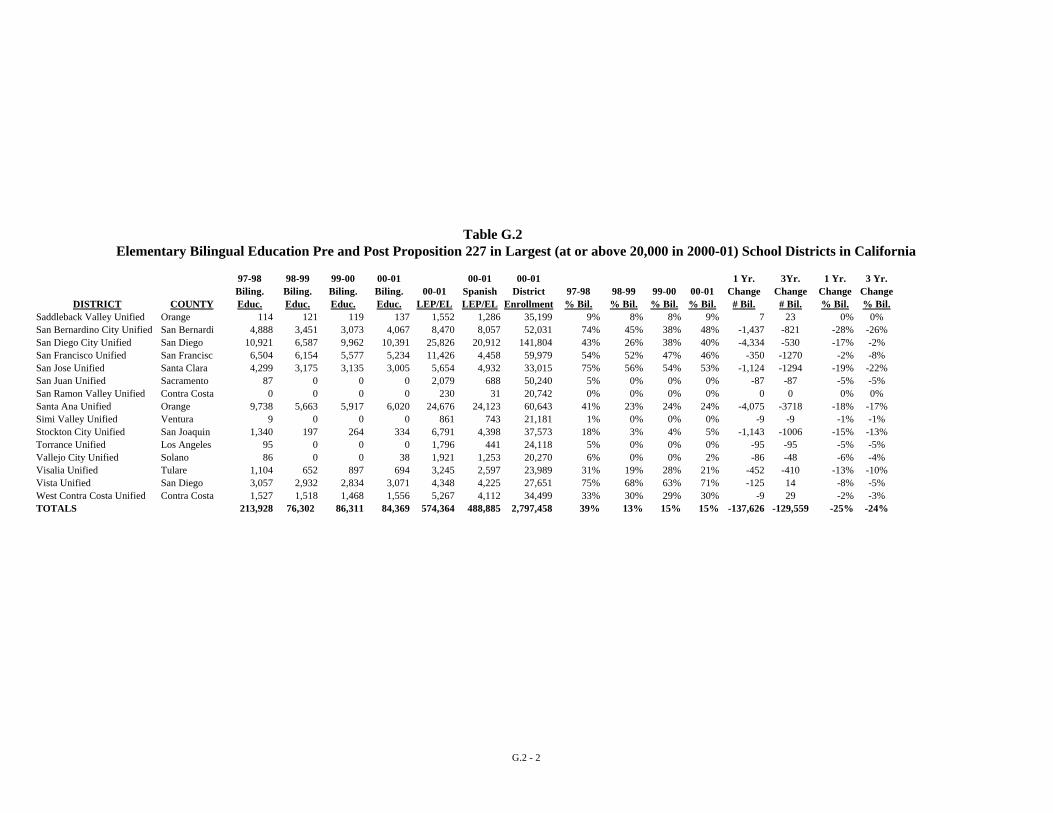
97-98 98-99 99-00 00-01 00-01 00-01 1 Yr. 3Yr. 1 Yr. 3 Yr.Biling. Biling. Biling. Biling. 00-01 Spanish District 97-98 98-99 99-00 00-01 Change Change Change Change
DISTRICT COUNTY Educ. Educ. Educ. Educ. LEP/EL LEP/EL Enrollment % Bil. % Bil. % Bil. % Bil. # Bil. # Bil. % Bil. % Bil.
Table G.2Elementary Bilingual Education Pre and Post Proposition 227 in Largest (at or above 20,000 in 2000-01) School Districts in California
Saddleback Valley Unified Orange 114 121 119 137 1,552 1,286 35,199 9% 8% 8% 9% 7 23 0% 0%San Bernardino City Unified San Bernardi 4,888 3,451 3,073 4,067 8,470 8,057 52,031 74% 45% 38% 48% -1,437 -821 -28% -26%San Diego City Unified San Diego 10,921 6,587 9,962 10,391 25,826 20,912 141,804 43% 26% 38% 40% -4,334 -530 -17% -2%San Francisco Unified San Francisc 6,504 6,154 5,577 5,234 11,426 4,458 59,979 54% 52% 47% 46% -350 -1270 -2% -8%San Jose Unified Santa Clara 4,299 3,175 3,135 3,005 5,654 4,932 33,015 75% 56% 54% 53% -1,124 -1294 -19% -22%San Juan Unified Sacramento 87 0 0 0 2,079 688 50,240 5% 0% 0% 0% -87 -87 -5% -5%San Ramon Valley Unified Contra Costa 0 0 0 0 230 31 20,742 0% 0% 0% 0% 0 0 0% 0%Santa Ana Unified Orange 9,738 5,663 5,917 6,020 24,676 24,123 60,643 41% 23% 24% 24% -4,075 -3718 -18% -17%Simi Valley Unified Ventura 9 0 0 0 861 743 21,181 1% 0% 0% 0% -9 -9 -1% -1%Stockton City Unified San Joaquin 1,340 197 264 334 6,791 4,398 37,573 18% 3% 4% 5% -1,143 -1006 -15% -13%Torrance Unified Los Angeles 95 0 0 0 1,796 441 24,118 5% 0% 0% 0% -95 -95 -5% -5%Vallejo City Unified Solano 86 0 0 38 1,921 1,253 20,270 6% 0% 0% 2% -86 -48 -6% -4%Visalia Unified Tulare 1,104 652 897 694 3,245 2,597 23,989 31% 19% 28% 21% -452 -410 -13% -10%Vista Unified San Diego 3,057 2,932 2,834 3,071 4,348 4,225 27,651 75% 68% 63% 71% -125 14 -8% -5%West Contra Costa Unified Contra Costa 1,527 1,518 1,468 1,556 5,267 4,112 34,499 33% 30% 29% 30% -9 29 -2% -3%TOTALS 213,928 76,302 86,311 84,369 574,364 488,885 2,797,458 39% 13% 15% 15% -137,626 -129,559 -25% -24%
G.2 - 2

DISTRICT COUNTY 1997-98 1998-99 1999-00 2000-01 1997-98 1998-99 1999-00 2000-01ABC Unified Los Angeles 91% 94% 91% 94% 88% 95% 90% 90%Anaheim Elementary Orange 81% 93% 93% 100% 82% 93% 93% 100%Anaheim Union High Orange N/A N/A N/A N/A 60% 71% 78% 70%Antioch Unified Contra Costa 76% 91% 88% 86% 80% 89% 89% 80%Bakersfield City Elementary Kern 87% 85% 89% 80% 85% 85% 87% 80%Capistrano Unified Orange 71% 73% 65% 65% 70% 70% 66% 60%Chino Valley Unified San Bernardi 88% 90% 88% 89% 87% 88% 89% 90%Chula Vista Elementary San Diego 81% 79% 90% 96% 81% 79% 90% 90%Clovis Unified Fresno 87% 90% 92% 91% 87% 88% 92% 90%Colton Joint Unified San Bernardi 42% 46% 92% 76% 37% 46% 95% 80%Compton Unified Los Angeles 57% 34% 66% 83% 42% 28% 61% 80%Conejo Valley Unified Ventura 68% 89% 91% 86% 72% 89% 92% 80%Corona-Norco Unified Riverside 40% 39% 88% 89% 35% 34% 85% 80%Desert Sands Unified Riverside 86% 88% 90% 97% 81% 85% 87% 90%Downey Unified Los Angeles 72% 77% 83% 87% 72% 74% 81% 80%East Side Union High Santa Clara N/A N/A N/A N/A 41% 81% 85% 80%Elk Grove Unified Sacramento 86% 96% 96% 100% 81% 91% 93% 90%Fairfield-Suisun Unified Solano 69% 72% 83% 88% 67% 75% 85% 90%Fontana Unified San Bernardi 90% 93% 96% 100% 95% 92% 95% 100%Fremont Unified Alameda 75% 86% 88% 88% 70% 86% 85% 90%Fresno Unified Fresno 85% 88% 90% 91% 82% 86% 87% 90%Garden Grove Unified Orange 84% 88% 90% 93% 84% 88% 89% 90%Glendale Unified Los Angeles 92% 93% 93% 95% 92% 92% 92% 90%Grossmont Union High San Diego N/A N/A N/A N/A 68% 85% 80% 70%Hacienda la Puente Unified Los Angeles 68% 86% 88% 93% 70% 89% 87% 90%Hayward Unified Alameda 62% 64% 71% 77% 51% 67% 71% 80%Irvine Unified Orange 88% 91% 91% 83% 91% 93% 93% 80%Kern Union High Kern N/A N/A N/A N/A 72% 85% 90% 90%Lodi Unified San Joaquin 85% 86% 87% 94% 82% 84% 77% 90%Long Beach Unified Los Angeles 90% 94% 96% 100% 87% 91% 93% 90%Los Angeles Unified Los Angeles 61% 82% 83% 86% 62% 78% 78% 80%Montebello Unified Los Angeles 42% 28% 65% 84% 64% 54% 78% 90%Moreno Valley Unified Riverside 58% 54% 74% 87% 43% 62% 77% 90%Mt. Diablo Unified Contra Costa 78% 85% 82% 87% 76% 82% 80% 80%
Appendix HPercentage of English Learners Tested in Reading
Pre and Post Proposition 227 in Largest (at or above 20,000 in 2000-01) School Districts in California
Elementary Schools Only District
H - 1

DISTRICT COUNTY 1997-98 1998-99 1999-00 2000-01 1997-98 1998-99 1999-00 2000-01
Appendix HPercentage of English Learners Tested in Reading
Pre and Post Proposition 227 in Largest (at or above 20,000 in 2000-01) School Districts in California
Elementary Schools Only District
Newport-Mesa Unified Orange 81% 93% 89% 92% 82% 90% 87% 90%Norwalk-La Mirada Unified Los Angeles 75% 83% 95% 100% 72% 66% 94% 90%Oakland Unified Alameda 68% 43% 85% 88% 62% 52% 82% 80%Oceanside Unified San Diego 57% 89% 92% 88% 48% 87% 89% 90%Ontario-Montclair Elementary San Bernardi 71% 88% 95% 99% 70% 89% 94% 100%Orange Unified Orange 78% 87% 87% 93% 76% 86% 86% 90%Palm Springs Unified Riverside 77% 87% 91% 94% 74% 83% 80% 90%Palmdale Elementary Los Angeles 67% 80% 90% 90% 66% 78% 89% 90%Pasadena Unified Los Angeles 72% 88% 90% 96% 72% 84% 85% 90%Placentia-Yorba Linda Unified Orange 61% 67% 79% 93% 68% 74% 80% 90%Pomona Unified Los Angeles 53% 68% 67% 94% 51% 70% 74% 90%Poway Unified San Diego 81% 83% 90% 74% 76% 79% 91% 70%Rialto Unified San Bernardi 82% 91% 97% 96% 70% 90% 93% 90%Riverside Unified Riverside 70% 77% 86% 89% 66% 79% 84% 90%Sacramento City Unified Sacramento 9% 81% 91% 94% 6% 82% 88% 90%Saddleback Valley Unified Orange 82% 83% 83% 85% 81% 86% 84% 90%San Bernardino City Unified San Bernardi 77% 94% 95% 95% 76% 91% 93% 90%San Diego City Unified San Diego 69% 77% 79% 91% 74% 77% 80% 90%San Francisco Unified San Francisc 42% 62% 67% 92% 40% 58% 64% 90%San Jose Unified Santa Clara 66% 87% 89% 87% 68% 87% 86% 80%San Juan Unified Sacramento 3% 69% 81% 100% 2% 73% 87% 100%San Ramon Valley Unified Contra Costa 90% 74% 84% 91% 90% 72% 89% 90%Santa Ana Unified Orange 87% 87% 90% 92% 86% 87% 89% 90%Simi Valley Unified Ventura 81% 83% 84% 86% 81% 83% 85% 80%Stockton City Unified San Joaquin 85% 87% 89% 98% 81% 85% 85% 90%Sweetwater Union High San Diego N/A N/A N/A N/A 62% 91% 93% 100%Torrance Unified Los Angeles 78% 94% 93% 90% 68% 93% 93% 90%Vallejo City Unified Solano 65% 83% 80% 92% 62% 75% 73% 80%Visalia Unified Tulare 78% 79% 95% 96% 78% 79% 95% 90%Vista Unified San Diego 76% 79% 81% 87% 78% 77% 80% 90%West Contra Costa Unified Contra Costa 72% 72% 76% 86% 70% 70% 77% 80%
TOTAL 68% 80% 85% 91% 67% 79% 82% 86%
H - 2

Signif. Signif. Signif. Signif. Signif.Dependant Variable= Mean b Beta Level Mean b Beta Level Mean b Beta Level Mean b Beta Level Mean b Beta Level% of EL Tested 68 75 81 84 87
Constant 56.847 0.000 * 62.492 0.000 * 71.765 0.000 * 74.737 0.000 * 77.642 0.000 *No. Enrolled in Bil. Ed. 75 -0.031 -0.16 0.000 * 30 -0.045 -0.15 0.000 * 31 -0.030 -0.13 0.000 * 30 -0.014 -0.06 0.000 * 30 -0.008 -0.03 0.017 *% on AFDC or Calworks 20 -0.067 -0.04 0.008 * 17 0.047 0.03 0.038 * 17 0.094 0.07 0.000 * 14 0.154 0.11 0.000 * 14 0.150 0.11 0.000 *Total School Enrollment 617 0.024 0.23 0.000 * 615 0.022 0.23 0.000 * 621 0.014 0.18 0.000 * 616 0.013 0.18 0.000 * 616 0.011 0.17 0.000 *
Adjusted r2 0.038 0.060 0.042 0.046 0.042
N 4,998 4,998
* Statistically significant at .05 or better.
2000-01MATHREADING
Appendix IPredictors of the Percentage of English Learners Tested in Reading
in California Elementary Schools Enrolling English Learners in Tested Grades,
1997-98, 1998-99, 1999-00, 2000-01 and Math in 2000-01
2000-011997-98 1998-99
4,840 4,905 4,862
1999-00

Percentage of Methodologically Acceptable Studies* Demonstrating Program Superiority, Equality, or Inferiority by Achievement Test Outcome
(N=72)
READING** LANGUAGE MATH
TBE v. Submersion (Do Nothing)TBE Better 22% 7% 9%No Difference 45% 29% 56%TBE Worse 33% 64% 35%
Total N 60 14 34
TBE v. ESLTBE Better 0% 0% 25%No Difference 71% 67% 50%TBE Worse 29% 33% 25%
Total N 7 3 4
TBE v. Submersion/ESLTBE Better 19% 6% 11%No Difference 48% 35% 55%TBE Worse 33% 59% 34%
Total N 67 17 38
TBE v. Structured ImmersionTBE Better 0% 0% 0%No Difference 17% 100% 63%TBE Worse 83% 0% 38%
Total N 12 1 8
Structured Immersion v. ESLImmersion Better 100% 0% 0%No Difference 0% 0% 0%
Total N 3 0 0
TBE v. Maint. BETBE Better 100% 0% 0%
Total N 1 0 0* Studies are listed in more than one category if there were different effects for different grades or cohorts.** Oral English achievement for preschool programs.SOURCE: C. Rossell and K. Baker, "The Educational Effectiveness of Bilingual Education," Research in theTeaching of English, 30 (1), February 1996: 1-74.
Appendix J

Bibliography-1
BIBLIOGRAPHY Alexander, Susan and Keith Baker. 1992. “Some Ethical Issues in Applied Social Psychology: the Case of Bilingual Education and Self-Esteem,” Journal of Applied Social Psychology, vol. 22, November 16-30: 1741:1757. Baker, Keith. 1987. "Comment on Willig's `A Meta-Analysis of Selected Studies in the Effectiveness of Bilingual Education'." Review of Educational Research. 57(3):351-362. Baker, Keith and de Kanter, Adriana. 1981. The effectiveness of bilingual education programs: A review of the literature. Final draft report. Washington, DC: U.S. Department of Education. Baker, Keith and de Kanter, Adriana. 1983a. "An answer from research on bilingual education." American Education 56(4):157-169. Baker, Keith and de Kanter, Adriana. 1983b. "Federal Policy and the Effectiveness of Bilingual Education." In Keith A. Baker, Adriana A. de Kanter, eds., Bilingual Education. Lexington, MA: D.C. Heath and Company. Baker, Keith and Christine Rossell. 1987. "An Implementation Problem: Specifying the Target Group for Bilingual Education." Educational Policy 1 (2): 249-270. Bali, Valentina. 2000. "'Sink or Swim': What Happened to California's Bilingual Students After Proposition 227?" Unpublished paper, Pasadena, CA: California Institute of Technology. Bali, Valentina. 2001. "'Sink or Swim': What Happened to California's Bilingual Students After Proposition 227?" State Politics and Policy Quarterly, forthcoming. Baral, D.P. 1983. “Self Concept Studies in Bilingual Education: a Review and Critique,” paper presented at the Annual International Bilingual Bicultural Education Conference, Washington, D.C. Barik, H., and Swain, M. 1975. "Three year evaluation of a large scale early grade French immersion program: the Ottawa study." Language Learning 25(1). Berdan, Robert, Alvin So, and Angel Sanchez. 1982. "Language Among the Cherokee, Patterns of Language Use in Northeastern Oklahoma, Part 1, The Preliminary Report." Los Alamitos, CA: National Center for Bilingual Research. Bruck, Margaret, Jola Jakimik, and G. Richard Tucker. 1971. "Are French Immersion Programs Suitable for Working-Class Children? A Follow-up Investigation." Word 27:311-341. Bruck, M., Lambert. W., and Tucker, R. 1977. "Cognitive consequences of bilingual schooling: The St. Lambert project through grade six." Linguistics :13-32.

Bibliography-2
Burkheimer, Jr., G.J., Conger, A., Dunteman, G., Elliott, B., and Mowbray, 1989. Effectiveness of services for language minority limited English proficient students. Raleigh-Durham, NC.: Research Triangle Institute. California, Department of Finance. 2000. Legal Immigration to California in Federal Fiscal Year 1997 and 1998. Sacramento, California, October. (http://www.dof.ca.gov/html/Demograp/Legim98.pdf). California, Department of Education. 2000. “Report on the Investigation of Complaints Against the Oceanside Unified School District/Deborah Escobedo, Attorney, META, Inc., File #518, Sacramento, California, September. Carroll, J.B. 1976. "Commentary." In The Ottawa-Carleton French project: Issues, conclusions, and policy implications. Ed. Stern, H.H. Canadian Modern Language Review 32:283-294. Cervantes, Robert A. 1982. "Entry into and Exit from Bilingual Education Programs." Washington, D.C.: E.H. White Inc. Clauset, K. and Gaynor, A.. 1980. Closing the Learning Gap: Effective Schooling for Initially Low Achievers. Boston University, Boston, Mass. Cohen, Andrew D. 1975. A Sociolinguistic Approach to Bilingual Education. Rowley, MA: Newbury House Press, Publishers, Inc. Cummins, J. 1978. "Educational implications of mother tongue maintenance in minority language groups." Canadian Modern Language Review 34:395-416. Cummins, Jim. 1980a. "The Construct of Language Proficiency in Bilingual Education." In Current Issues in Bilingual Education. Ed. J.E. Alatis. Washington, D.C.: Georgetown University Press. Cummins, Jim. 1980b. "The Entry and Exit Fallacy in Bilingual Education." NABE Journal (Spring) 4 (3): 25-59. Cziko, Gary A. 1975. "The Effects of Different French Immersion Programs on the Language and Academic Skills of Children from Various Socioeconomic Backgrounds". M.A. thesis, McGill University. DeCos, Patricia L. 1999. “Educating California’s Immigrant Children: An Overview of Bilingual Education,” Sacramento, CA: California Research Bureau.

Bibliography-3
Del Vecchio, Ann and Michael Guerrero, 1995. “Handbook Of English Language Proficiency TestsEvaluation,” Assistance Center - Western Region New Mexico Highlands University Albuquerque, New Mexico. (http://www.ncbe.gwu.edu/miscpubs/eacwest/elptests.htm) Duncan, Sharon E. and Edward A. De Avila. 1979. "Relative Language Proficiency and Field Dependence/Independence." Paper presented at the annual meeting of TESOL, Boston. Genesee, Fred. 1976. "The Suitability of Immersion Programs for all Children." Canadian Modern Language Review 32:494-515. Gersten, Russell and John Woodward. 1995. "A Longitudinal Study of Transitional and Immersion Bilingual Education Programs in One District." Elementary School Journal, vol. 95, 1995, pp. 223-39. Gersten, Russell, Baker, Scott and Otterstedt, Janet. 1998. “Further Analysis of: A meta-analysis of the effectiveness of bilingual education, by J.P. Greene (1989),” Eugene, OR: Eugene Research Institute. Gillmore, G. and A. Dickerson. 1979. "The Relationship Between Instruments Used for Identifying Children of Limited English Speaking Ability in Texas." Houston, TX: Education Service Center [Region IV]. Glenn, Charles L. and De Jong, Ester J. 1996. “Educating Immigrant Children: Schools and Language Minorities in Twelve Nations.” Garland Reference Library of Social Science. V.921. Gold, Norm. 2000. "Bilingual Schools Make Exceptional Gains on the State's Academic Performance Index (API)," Unpublished report, Californians Together: a Roundtable for Quality Education. http://californiatomorrow.org/archive/. Greene, Jay P. 1998. “A Meta-Analysis of the Effectiveness of Bilingual Education,” Unpublished paper of the Tomas Rivera Policy Institute, Claremont Graduate School. Greene, Jay P. 1997. “A Meta-Analysis of The Rossell And Baker Review Of Bilingual Education Research, 21 (2 and 3), Bilingual Research Journal, Spring and Summer. Haager, Diane, Gersten, Russell, Baker, Scott, Graves, Anne. 2001. An Observational Study of First Grade Reading Instruction for English Language Learners Using Sheltered Immersion Methodology. Paper presented at Pacific Coast Research Conference. February, La Jolla, CA.
Heckman, J.J. (1979). Sample Selection Bias as a Specification Error, Econometrica, 47, January, 153-161.
Huberman, A. M., and Miles, M. B. (1984). Innovation up close: How school improvement works.

Bibliography-4
New York: Plenum Press. Kitchen, Jeffrey. 1999. “Proposition 227 Survey.” Sacramento, CA: Department of Education, Language Policy and Leadership. Los Angeles Unified School District. 1998. “Clarification of English Academic Testing Results for Spanish-Speaking LEP Fifth Graders.” McDonnell, Lorraine M. and Hill, Paul T. 1993. Newcomers in American Schools: Meeting the Educational Needs of Immigrant Youth. Santa Monica, CA: Rand Corporation. Miles, M. B., and Huberman, A. M. (1994). Qualitative data analysis: An expanded sourcebook (2nd ed.). Thousand Oaks, CA: Sage. Newton, Jim and Doug Smith. 1998. “Riordan Backs Move to End Bilingual Classes,” Los Angeles Times, April 10, section A. Okada, Masahito., et al. 1983. Synthesis of Reported Evaluation and Research Evidence on the Effectiveness of Bilingual Education Basic Projects. Los Alamitos, CA: National Center for Bilingual Research. Pelavin, Sol and Keith Baker. 1987. "Improved Methods of Identifying Who Needs Bilingual Education." Paper prepared for delivery at the annual meeting of the American Educational Research Association, Washington, D.C. Perlman, C. and W. Rice Jr. 1979. "A Normative Study of a Test of English Language Proficiency." Paper presented at the annual meeting of the American Educational Research Association, San Francisco, CA. Porter, Rosalie P. 1996. “Forked Tongue.” Transaction Publishers. New Brunswick, NJ. Ramirez, J.David, Sandra D. Yuen and Dena Ramey. 1986. "Second Year Report: Study of Immersion Programs for Language Minority Children." Alexandria, VA: Sra Technologies, Inc. Ramirez, J. David, Pasta, David J., Yuen, Sandra D., Billings, David K., Ramey, Dena R. 1991. Final Report: Longitudinal Study of Structured Immersion Strategy, Early-Exit and Late-Exit Transitional Bilingual Education Programs for Language-Minority Children. San Mateo, CA: Aguirre International, report to the U.S. Department of Education, Washington, D.C. Rossell, Christine. 2001. “All That Glitters is Not Gold: the Limits of the California Department of Education's English Learner Achievement Data,” Read Perspectives, vol. 8, Fall: 151-168. Rossell, Christine. 2000c. "Different Questions, Different Answers: A Critique of the Hakuta, Butler and Witt Report, 'How Long Does it Take English Learners to Attain Proficiency?'," READ

Bibliography-5
Perspectives,Volume VII, October: 134-154.
Rossell, Christine. 2000b. “Teaching Language Minorities: Theory and Reality,” in City Schools: Lessons From New York, edited by Diane Ravitch and Joseph Viteritti, Baltimore: Johns Hopkins University Press. Rossell, Christine. 2000a. "The Federal Bilingual Education Program," in Brookings Papers on Education Policy, 2000, edited by Diane Ravitch, Washington, D.C.: Brookings Institution Press. Rossell, Christine and Keith Baker. 1988. "Selecting and Exiting Students in Bilingual Educational Programs." Journal of Law and Education 17 (4): 589-623. Rossell, Christine and J. Michael Ross. 1986, "The Social Science Evidence on Bilingual Education." The Journal of Law and Education, 15, Fall: 385-419. Rossell, Christine and Baker, Keith 1996(a). Bilingual Education in Massachusetts: the Emperor Has No Clothes. Boston, MA: Pioneer Institute. Rossell, Christine and Baker, Keith 1996(b). “The Educational Effectiveness of Bilingual Education,” Research in the Teaching of English, 30(1): 7-74. Rossell, Christine and Baker, Keith 1996(c). “Response,” Research in the Teaching of English, 30 (3): 70-86. Rotberg, Iris. 1984. “Bilingual Education Policy in the United States, Prospects, XIV, (1) 134-137. Russell, Nancy L. and Alba A. Ortiz. 1989. "Assessment of Pragmatic Skills of Kindergarten Limited English Proficient Children in a Dialogue Model of Communication," Paper presented at the annual meeting of the American Educational Research Association, San Francisco, CA. Southwest Educational Regional Laboratories (SWERL). 1980. "Designers Manual: Resources For Developing a Student Placement System for Bilingual Programs." Austin, TX: Southwest Educational Regional Laboratory. Traub, James. 1999. New York Times Magazine. January 31, 1999. 32-35. Tucker, G. Richard., Wallace E. Lambert, and A. d'Anglejan. 1973. "French Immersion Programs: A Pilot Investigation." Language Sciences 25:19-26. Ulibarri, D., M. Spencer, and G. Rivas. 1980. Comparability of Three Oral Language Proficiency Instruments and Their Relationship to Achievement Variables." Report submitted to the California State Department of Education.

Bibliography-6
U.S. Bureau of the Census, Data for the Office of Planning, Budget and Evaluation, Decision Resources. 1984. "1984 Analysis." Washington, D.C.: Department of Education. Valdés, G. and Figueroa, R. (1994). Bilingualism and testing A special case of bias. Norwood, NJ: Ablex Publishing Corporation cited in del Vecchio and Guerrero. Willig, Ann C. 1985. "A Meta-Analysis of Selected Studies on the Effectiveness of Bilingual Education." Review of Educational Research. 55(3):269-317. Yin, Robert K. 1994. Case Study Research : Design and Methods (Applied Social Research Methods, Vol 5). Thousand Oaks, CA: Sage Publications. Zhou, Min and Portes, Alejandro. 1995. Chinatown : The Socioeconomic Potential of an Urban Enclave (Conflicts in Urban and Regional Development) . Philadelphia: Temple University Press. Zhou, Min and Bankston, Carl L. III. 1998. Growing Up American : How Vietnamese Children Adapt to Life in the United States. New York: Russell Sage Foundation.