disparities in post-acute stroke rehabilitation
TRANSCRIPT

DISPARITIES IN POST-ACUTE STROKE REHABILITATION UTILIZATION
BY
KRISTEN PENLAND
A Thesis Submitted to the Graduate Faculty of
WAKE FOREST UNIVERSITY GRADUATE SCHOOL OF ARTS AND SCIENCES
in Partial Fulfillment of the Requirements
for the Degree of
MASTER OF SCIENCE
Health Disparities in Neuroscience-related Disorders
August 2017
Winston-Salem, North Carolina
Approved By:
Cheryl Bushnell, M.D., M.H.S., Advisor
Amy M. Pastva, P.T., M.A., Ph.D., Chair
Matthew Psioda, Ph.D.

ii
TABLE OF CONTENTS
List of Illustrations and Tables iii
List of Abbreviations iv
Abstract v
Introduction 1
Methods 6
Results 7
Discussion 10
Conclusion 17
References 18
Appendix 24
Curriculum Vitae 41

iii
LIST OF ILLUSTRATIONS AND TABLES
Table 1. 24
Summary of the Cohort
Table 2. 25
Summary of Demographics Characteristics for Enrolled Patients Who Did Not Withdraw
Table 3a. 27
Analysis of Discharge Rehabilitation Referral Status
Table 3b. 30
Analysis of Clinic Visit Rehabilitation Referral Status for Patients not Referred at
Discharge
Table 4a. 33
Analysis of Receipt of All Recommended Home Health Rehabilitation
Table 4b. 36
Analysis of Receipt of All Recommended Outpatient Rehabilitation
Table 5. 39
Summary of Select Characteristics Identified at the Clinic Visit for Patients Receiving
Home Health Rehabilitation Recommendations
Table 6. 40
Summary of Select Characteristics Identified at the Clinic Visit by Receipt Status of All
Recommended Rehabilitation

iv
LIST OF ABBREVIATIONS
ADL- Activities of Daily Living
COMPASS- COMprehensive Post-Acute Stroke Services
IADL- Independent Activities of Daily Living
NIHSS- National Institute of Health Stroke Scale
OT- Occupational Therapy
PAC- Post-Acute Coordinator
PT- Physical Therapy
ST- Speech Therapy
TIA- Transient Ischemic Attack
WFBMC- Wake Forest Baptist Medical Center

v
ABSTRACT
Despite the fact that rehabilitation services are integral in the recovery of an individual’s
functional abilities after stroke, the method by which these services are recommended and then
utilized are ill-defined. This study analyzes data from the ongoing COMprehensive Post-Acute
Stroke Services (COMPASS) pragmatic clinical trial to explore factors that may influence
referrals to rehabilitation services at hospital discharge and clinic follow-up visits and receipt of
those recommended rehabilitation services for patients who have experienced an acute stroke.
Out of 1,695 enrolled COMPASS participants, 604 (35.6%) were referred to rehabilitation at
hospital discharge. Factors that influenced referral included age, stroke severity category
[National Institute of Health Stroke Scale (NIHSS)], and ambulatory status. Elderly participants
(≥age 65) had the greatest odds referral at discharge (81%). Those with NIHSS scores in the
minor category (NIHSS 1-4) had more than double the odds (OR=2.65) and those in the moderate
to severe category (NIHSS 5-42) had more than five times the odds (OR=5.61) of being referred
at discharge than those with no stroke symptoms (NIHSS 0). Participants unable to ambulate at
discharge had more than eight times the odds (OR=8.81) of being referred than those who
independently ambulated. Receipt of recommended rehabilitation, however, was low. Only 50
(44%) and 29 (35%) of participants referred for home health or to outpatient rehabilitation,
respectively, actually received all the care to which they were referred, which limited the
robustness of data analysis. Non-white participants had a 78% decreased odd of receiving
recommended outpatient services. Ethnicity, gender, or hospital location did not influence receipt
of services, even after adjusting for stroke severity, ambulatory status at admission and age.
These findings indicate that a significant gap exists between referral to and receipt of
recommended post-acute stroke rehabilitation services; mechanisms to bridge the gap are
required to optimize functional outcomes and qualities of life of survivors of stroke.

1
INTRODUCTION
Stroke is the 2nd leading cause of death worldwide, and the 5th leading cause of death in
the United States (Mozaffarian et al., 2015). Although the actual number of stroke deaths has
declined 18.2% from 2003, 795,000 people continue to experience a new or recurring stroke each
year (Mozaffarian et al., 2015), and the prevalence of stroke is expected to increase nearly 20%
by the year 2030 (Ovbiagele et al., 2013). The majority of strokes are first events, accounting for
610,000 of the total stroke occurrences (Mozaffarian et al., 2015). Stroke is one of the major
causes of disability in adults in the U.S(Mozaffarian et al., 2015). General recovery guidelines
show that only 10% of stroke survivors recover completely, 25% recover with minor
impairments, 40% have moderate to severe impairments requiring special care, and 10% require
care in a long term facility (Winstein et al., 2016). Participation in rehabilitation is associated
with improved outcomes such as reduced risk for functional disability (Veerbeek et al., 2014) and
for recurrent stroke (Pollock et al., 2014a) (Cohen et al., 2010).
Health disparities are defined as any differences in health care processes or health
outcomes amongst a specific population group (Braveman, 2006) . Disparities in stroke burden
have been well documented (McNaughton et al., 2011). For example, African Americans are
impacted more from stroke than any other minority group in the American population, having an
almost doubled stroke mortality rate, earlier stroke onset, and higher stroke severity than their
Caucasian counterparts (Cruz-Flores et al., 2011). Low socioeconomic status is associated with
poorer outcomes after stroke, as well as more severe deficits and decreased likelihood of
receiving evidence based stroke services (Chen et al., 2015). The majority (87%) of stroke deaths
worldwide occur in low and middle income countries (Johnson, Onuma, Owolabi, & Sachdev,
2016). Geographic disparities exist in the United States, with highest stroke incidence and
mortality in the southeast part of the country known as the “stroke belt.” This eleven-state region
of the U.S. has a 34% increased risk of stroke compared to the general population (Howard et al.,
2016).

2
Though the disparities in stroke incidence and outcome are well-recognized, post-stroke
rehabilitative care received by individuals across differing demographic groups remains ill
defined. According to Medicare data, 42% of patients are not referred any post-acute care
(Bogasky, Gage, Morley, Spain, & Ingber, 2009), and 65% of patients under the age of 65 are
discharged home without post-acute services (Prvu Bettger et al., 2015). Approximately 80% to
90% of stroke survivors have residual movement impairment after stroke, and are more at risk for
inactivity, falls, and hospital readmission (Freburger, Li, Johnson, & Fraher, 2017). Also, quality
of life significantly declines after each ischemic stroke an individual experiences (Dhamoon et
al., 2010).
Physical rehabilitation services are the primary mechanism by which function and
mobility recovery and the achievement of independence are promoted in patients with acute
stroke (Pollock et al., 2014b). Services delivered in home health and outpatient settings, include
the three major disciplines of stroke care- physical, occupational, and speech and language
therapies. Physical therapy (PT) addresses neuromuscular problems that affect an individual’s
ability to move. Occupational therapy (OT) is commonly used to regain skills needed for
activities of daily living (ADLs), such as personal hygiene, dressing, and feeding. Speech and
language therapy addresses deficits in producing speech, understanding others speech, paying
attention or problem solving, and feeding or swallowing, all of which are residual deficits after
stroke. The specific deficits of each individual determine what types of rehabilitation services are
needed (Pollock et al., 2014b).
The purpose of this study was to compare referrals to and receipt of those recommended
services for post-stroke rehabilitative care among a diverse group of stroke survivors. We used
data from a current ongoing trial, the COMprehensive Post-Acute Stroke services (COMPASS)
Large Pragmatic Trial funded by the Patient Centered Outcomes Research Institute
(NCT02588664).

3
COMPASS is a cluster randomized pragmatic trial, with hospital as the randomization
unit and not the individual patient. The objective of the COMPASS trial is to compare the
effectiveness of comprehensive post-acute stroke services on the primary outcome of functional
status 90 days after stroke to usual care in patients discharged from 41 hospitals in North
Carolina. The COMPASS model is a combination of early supported discharge and transitional
care management for stroke survivors who are discharged home with a goal to assess how this
affects functional outcomes post stroke compared to usual care. Although there is no specific
standard for post-acute care delivery, transitional care management has been shown to be
effective for the general medicine and geriatric populations (Naylor, Aiken, Kurtzman, Olds, &
Hirschman, 2011) and early supported discharge has been shown to impact the gaps in care for
stroke patients, but these studies were conducted in Europe (Langhorne et al., 2007). Early
supported discharge has never been implemented in the U.S. health care system.
The COMPASS trial has three main objectives, with the first being to address the needs
of stroke survivors as well as their caregivers in order to reach optimal recovery outcomes. The
other objectives include bridging the gap between hospitals and community providers to better
manage chronic disease, as well as working to develop an individualized patient specific care
plan for each stroke patient. The model is first implemented in the hospital when a Post-Acute
Coordinator (PAC) meets with the patient prior to discharge, followed by phone call to the patient
and/or caregiver two days post discharge. Thereafter, a follow up appointment in the post-acute
stroke clinic is scheduled for 7-14 days after patient discharge. Following the clinic visit, 30 and
60-day follow up calls are made to patients to determine if care that was referred has actually
been received. The primary outcome of the COMPASS trial as a whole is the Stroke Impact
Scale 16, a brief measure of functional status that is patient-reported (Duncan, Lai, Bode, Perera,
& DeRosa, 2003).
The COMPASS model includes four main directions for patients and caregivers to find
their way toward recovery, independence, and health. These directions include N for Numbers

4
(knowledge of blood pressure, for example), E for Engage (rehabilitation and recovery,
depression, cognition, communication), W for Willingness to manage medications and lifestyle
change, and S for Support (community and caregiver support for services). An iPad application
is used to administer the post-stroke functional assessment at the 7-14 day clinic visit, which
includes multiple questions related to the functional, social, and medical determinants of health to
identify areas of concern. After the assessment is completed, proprietary algorithms produce
results that are individualized based on the patient’s answers to the questions in the assessment.
The concerns are organized into the four directions.
Our focus for this project is on Engage, since this domain identifies patients who would
benefit from rehabilitation services based on concerns identified in the post-stroke functional
assessment (the basis for assessing referrals for these services). The engage domain stresses the
need for individuals to be physically active for multiple reasons, the first being to manage stress
and mood. This aspect of the domain encourages stroke patients to engage in physical activity
and support groups to alleviate mental stress, as well as build effective relationships with family
members and caregivers. The second aspect of the Engage domain promotes physical activity
and safe mobility. This encourages the use of therapy to improve use of affected limbs, decrease
muscle stiffness and spasticity, as well as decrease risk of falling. This domain also stresses that
movement matters in stroke recovery, and being active decreases risk of another stroke. The final
components of the Engage domain include managing communication recovery, and being
engaged with your health care team. These components allow for addressing needs for aphasia,
as well as managing doctor appointments to help manage stroke risk factors.
With the purpose of this study being to identify disparities among referrals and receipt of
rehabilitation services, we hypothesized that disparities would exist within the characteristics of
age, race, ethnicity, NIHSS score, ambulatory status at discharge, and insurance status. Among
those patients who were referred at discharge or in the clinic, we used data obtained from the
5
clinic visit, and 30-day follow up calls to determine which individuals received the rehabilitation
services. The hypothesis was tested in the following aims:
Aim 1: Identify COMPASS patient characteristics associated with referral to
rehabilitation services.
Aim 1a assesses referral at hospital discharge and Aim 1b assesses
referral at the follow-up clinic visit. The outcome of this aim is referral
to any type of rehab at each time point, with explanatory variables
including race, gender, ethnicity, age, insurance, hospital location, stroke
severity, and ambulatory status at admission.
Aim 2: Estimate associations between patient characteristics and receipt of any
type of home health and outpatient rehabilitation services at discharge or the
clinic visit. Aim 2 will use the same explanatory variables listed in aim 1.
Aim 3: Describe the frequencies of physical and communication deficits
identified at the clinic visit among patients referred to home health rehabilitation
services. Variables from the ENGAGE domain of the post-stroke functional
assessment include falls risk, ADL limitations, physical and mobility and safety,
and speech and language deficits.
Aim 4: Describe the relationships between the receipt of all referred rehab
services and psychosocial determinants of health. Variables from the ENGAGE
domain include depression, stress experienced by the patient, stress on
relationships, and lack of transportation.
The use of the aims stated above determined the characteristics of individuals who were
referred or not referred or who received or not received rehabilitative care, and whether race,

6
gender, or geographic disparities exist, and if so, whether the disparity was independently
associated with the actual receipt of rehab after pre-stroke disability status is taken into account.
The rationale for this was to evaluate the general patterns of utilization of referrals identified in
the post-stroke functional assessment. When the COMPASS trial is concluded, we will be able to
determine whether the receipt of referred rehabilitation and the associated patient characteristics
ultimately impact the primary outcome, physical function.
METHODS
We examined data obtained from the COMPASS trial. A total of 1,695 participants were
included in the initial analysis. To address aim 1a, we computed unadjusted odds ratios and 95%
confidence intervals to measure the strength of the association between explanatory variables and
outcomes. This population included participants that were enrolled in the COMPASS
intervention, excluding those who withdrew or those who had missing data for the outcome or
any explanatory variable. We also computed adjusted odds ratios and 95% confidence intervals
using logistic regression where possible in order to analyze the influence of potential
confounders. The same methods of analysis were used to address Aim 1b as well as Aim 2. Aim
1b included participants enrolled in COMPASS intervention who were not referred rehabilitation
at discharge, and who had completed the clinic visit. Exclusion criteria for this Aim were
participants who had withdrawn, or who had clinic non-consent. Aim 2 included populations of
participants enrolled in COMPASS who were referred to either 1) to home health or 2) outpatient
rehabilitation at discharge or the clinic visit. This analysis excluded participants with a missing
clinic visit, an incomplete 30-day call, or who had clinic non-consent. For Aim 3, a descriptive
analysis was performed to calculate the frequency of physical and speech deficits identified at the
clinic visit among participants that were recommended home health rehabilitation services. This
population included participants enrolled in the COMPASS trial intervention who had a
recommendation on the eCare plan for home health PT/OT/SL. The exclusion criteria for this

7
population were individuals who had withdrawn, or had a missing eCare plan. Aim 4 also used a
descriptive analysis to estimate relationships among receipt of referred rehabilitation services and
depression, stress on patients and caregivers, and transportation limitations. This population
included participants enrolled in COMPASS who received a referral to any rehabilitation at
discharge or the clinic visit. The rehabilitation referral included any type of outpatient or home
health rehabilitation. Patients in this population also had a completed 30-day call. Exclusions for
this Aim were patients who had withdrawn or had missing outcome or variable data. Receipt of
care was considered to be receipt of all care exactly as it had been referred.
RESULTS
Description of the cohort
Table 1. The total number of participants enrolled who did not withdraw was 1,695. Out
of these participants who did not withdraw, 604 (35.6%) were referred to rehabilitation at
discharge. There were 659 (38.9%) participants that completed the clinic visit out of the total
population and out of those participants, 399 (60.5%) were not referred rehabilitation at
discharge. Out of the group of 399 participants not referred rehabilitation at discharge, 52
(13.0%) were referred rehabilitation at the clinic visit. There were 369 (21.8%) individuals out of
the total 1,695 that completed the clinic visit as well as a 30-day follow up call. Out of the
individuals that completed the clinic visit and the 30-day call, 176 (48%) had documented
rehabilitation recommendations.
Summarized demographic characteristics in Table 2 shows out of the total participant
population of 1695, 686 (40.5%) were <age 65 and 1009 (59.5%) were ≥65. The population was
52.5% male, and 47.5% female. A large percentage, 97.8%, of the population identified their
ethnicity as non-Hispanic. The majority of the population at 78.3% identified their race as white,

8
with 18.3% identifying as African American, and 1.4% identified as “other.” Over half of the
population, 60.8%, was treated at a hospital considered to be in a metropolitan area. Ischemic
stroke was the diagnosis of 60.5% of the population, with the next frequent diagnosis of TIA at
32.5%. Seventy-two participants were diagnosed with intracerebral hemorrhage, accounting for
4.2% of the population, followed by 40 (2.4%) participants having a nonspecific ischemic stroke
documented, and 7 (0.4%) participants with documented ischemic stroke with hemorrhage.
Ambulatory status at admission in this cohort was 94.5% that were able to ambulate without
assistance upon admission, and only 1.4% completely unable to ambulate at admission. At
discharge, 69.9% of participants were able to ambulate without assistance, and 22.5% had
missing reports of discharge ambulatory status. Of the participants with NIHSS scores, 26.6% of
the population had a score of 0, meaning no stroke symptoms, with the next highest percentage at
20.6% missing the stoke scale score. Participants with an NIHSS score of one accounted for
16.7% of the population, 10.9% scored a two, 12.0% scored between three and four, 7.3% scored
between five and seven, and 6.0% of the population had a score greater than seven. One of the
most critical explanatory variables was insurance, and in our cohort, 58.4% had Medicare, 9.1%
Medicaid, 31% private, 3.1% VA/Champus insurance, and 9.1% self-pay or uninsured.
Our first analysis was conducted in order to measure associations between chosen
variables and rehabilitation referral status at discharge, as displayed in Table 3a. After
Bonferroni correction, and adjustment for age, NIHSS, and ambulatory status at admission, only
ambulatory status at discharge was significantly associated with referrals. Age greater than 65
was associated with an 81% increased odds of receiving a referral to rehabilitation at discharge
compared with those less than age 65 (OR = 1.81, 95% CI 1.42, 2.31). Participants with minor
severity (NIHSS scores of 1-4), had a more than double the odds (OR 2.64, 95% CI 2.01-3.49),
and those with the moderate to severe category (NIHSS 5 – 42) had more than five times the odds
(OR 6.61, 95% CI 3.90-8.06) of referral to rehabilitation compared to those with NIHSS scores of

9
0. Participants who were unable to ambulate independently at discharge had more than eight
times the odds of being referred rehabilitation at discharge compared to those who were
independent (OR 8.81 95% CI 4.45, 17.43). The subsequent analysis, Table 3b, presents
associations between rehabilitation referrals made not at discharge but at the clinic visit. For each
age category, it is reported that only 13% of individuals who attended the clinic visit were
actually referred for rehabilitative care. While no significant associations were identified in
analysis, it is consistent throughout all characteristics of interest that less than half in each
category were referred rehab.
After analyzing the receipt of recommended home health rehabilitation, represented in
Table 4a, our study found that less than half (43.5%) of participants received recommended home
health rehabilitation. Of participants less than age 65, 44.1% actually received recommended
home health rehabilitation, as well as only 43.2% in the greater than 65 age category. The
analysis of receipt of recommended outpatient services, Table 4b, revealed that even smaller
percentages, 34% in each age category, actually received recommended outpatient rehabilitation
services. Although these analyses showed less than half of our participants received actual
referred care, they did not reveal significant associations between characteristics of interest and
the receipt of actual care from home health or outpatient recommendations. Non-white
participants were less likely to receive recommended outpatient services than whites, with only
15.0% reporting receipt of recommended outpatient services. While this does not meet statistical
significance after a conservative Bonferroni correction, there still appears to be an association
(unadjusted p-value=0.04, OR 0.22 95% CI 0.05-0.95).
Table 5 summarizes select characteristics from the ENGAGE domain within the
population that was receiving home health rehabilitation recommendations at the time of or after
the clinic visit. We found that 42.9% were classified as having a fall risk, 38.3% had limitations

10
in ADLs, 67.1% had physical mobility and safety limitations, and 16.11% had communication
deficits.
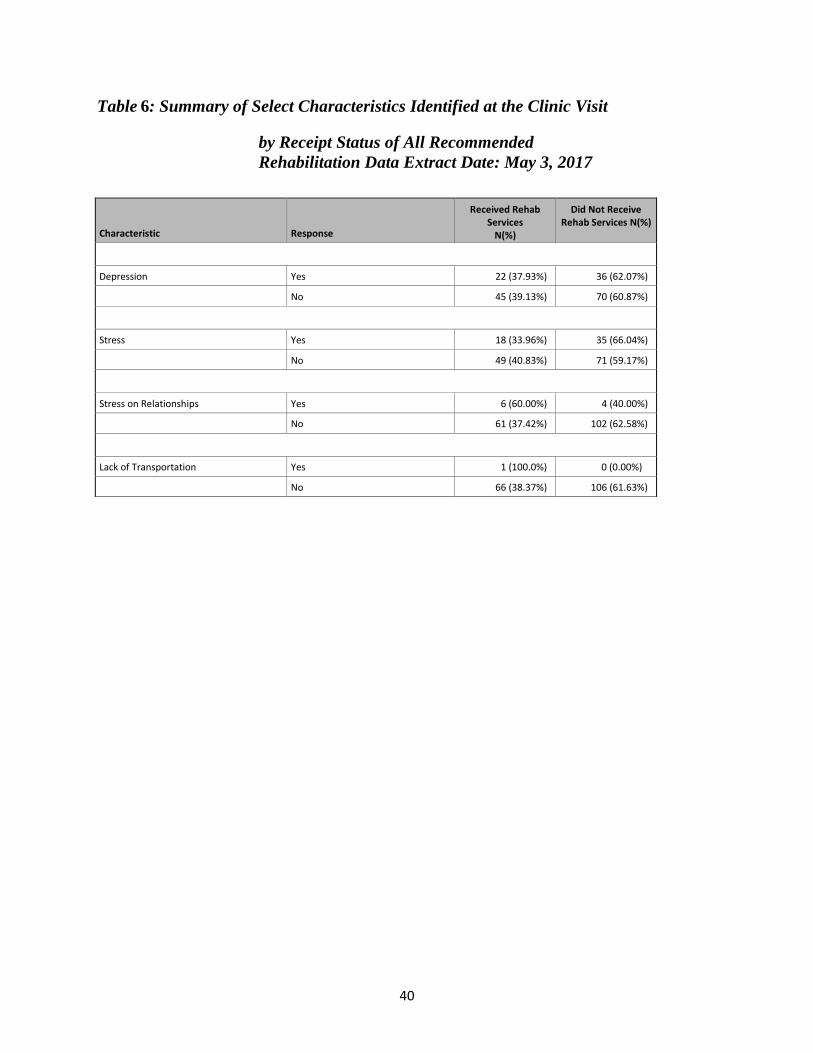
A summary of characteristics identified at the clinic visit of individuals that received all
recommended rehabilitation services, Table 6, demonstrated that of 173 participants, (33.5%)
reported depression. Out of 58 participants who reported depression, 36 (62.07%) did not receive
all recommended rehabilitation services. Out of participants reporting stress, 66.04% did not
receive therapy. Out of participants that received recommended rehabilitation, 60% reported
stress on their relationships. Only one participant reported having a lack of transportation;
however, they still reported receipt of all recommended rehabilitation.
DISCUSSION
Assessment of utilization of rehabilitation referrals and actual receipt of rehabilitation
from that referral is critical to understanding how health systems deliver care to stroke patients in
the post-acute setting. The primary factors in this study that influenced this process include the
severity of the stroke, residual deficits and disability, and pre-stroke disability. Our study also
found that having a non-independent ambulatory status at discharge was positively associated
with receiving a referral for rehabilitation at discharge, and that negative associations exist within
insurance statuses and discharge referral status, as well as non-white race and receipt of
recommended outpatient rehabilitation services. Results also display that less than half of our
study population who were referred to either home health or outpatient rehabilitation services
actually received those services by the 30-day follow up call.
The process of receiving rehabilitation services, whether in the home health or outpatient
setting, begins with a rehabilitation referral. It is important to note that the rehabilitation services
delivered to stroke patients in the United States are broad and heterogenous, varying in both the
type of care setting used, and interventions delivered (Winstein et al., 2016). That being said,
11
patient-level characteristics may serve as causes for health care providers to refer rehabilitation.
Characteristics of age and stroke severity displayed significant associations, and as also expected,
ambulatory status at discharge significantly influenced receiving a rehabilitation referral. Prior
research has shown that use of a standardized assessment of ambulatory status could better
predict the need and direction of post-acute stroke care and help limit the variability in addressing
stroke care needs (Stein et al., 2015). Capturing ambulatory status at discharge could also be
pivotal to a patient receiving a referral to rehabilitation by first showing a need and justification
for rehabilitation to insurance providers. Medicare policies state that home health care payments
are determined by a patient’s condition and expected use of services, and Medicare does not
require a copayment or payment to coinsurance from the patient for home health services (Buntin,
Colla, Deb, Sood, & Escarce, 2010). This could serve as an explanation of why patients with
Medicare were more likely to be referred services at discharge.
Because of the nature of the disease, stroke patient’s conditions may improve or worsen
after being discharged home from the hospital, which in turn changes the type and amount of
rehabilitation services they may have originally needed. The COMPASS trial accounts for these
changes by assessing needs of participants at the clinic visit 7-14 days after discharge from the
hospital, and provides a second opportunity to refer participants to rehabilitation who may have a
need. Similarly, many patients are not aware of deficits they may have until they are trying to
complete everyday tasks at home, and would have a missed opportunity for a rehabilitation
referral without attending the clinic visit. It is also crucial to note that out of the total sample, less
than half of participants in the cohort received a referral for rehabilitation services. The majority
of patients also fell into the NIHSS categories of showing no stroke symptoms, or having only
minor stroke symptoms, which would likely not leave them with deficits requiring therapy. The
substantial amount of TIA diagnoses in the cohort likely influenced the amount of patients

12
referred rehabilitation services due to their symptoms subsiding and not leaving residual effects
that require therapy services (Winstein et al., 2016).
An important utilization metric is whether or not participants are actually receiving
recommended care after the rehabilitation referral. While current literature suggests that
disparities in stroke care exist, surveillance of rehabilitation referrals translating into actual
receipt of care for a patient is not well documented. Because the primary outcome of the
COMPASS trial is physical function, utilization of recommended stroke services is important to
capture with the expectations that receiving rehabilitation services will improve an individual’s
functional deficits. After the analysis of the receipt of all recommended home health
rehabilitation, the same patient characteristics that influenced a referral (age, NIHSS score,
ambulatory status at discharge) did not have a significant impact on the receipt of care. This data
is consistent with prior studies that suggest there are other factors aside from patient
characteristics that influence utilization of rehabilitation, such as patient and family preferences,
availability of services, and the patients’ geographic location (Buntin et al., 2010). Access and
availability of services has been shown to be associated with use of referred rehabilitation
services in prior studies (Buntin et al., 2005), so we could infer that participants in the cohort who
were treated in a non-metropolitan hospital reside in a rural area and may have less access to
post-acute rehabilitation. Geographic location could also influence where home health care was
offered (Benjamin, 1986), in conjunction with insurance, and may have shown more of an
association between receiving home health had we known where individuals were residing. Prior
research has found that Medicare data shows that only 15% of stroke patients insured with
Medicare receive home health services, and different insurance accounts for variance in care
coverages (Shen & Washington, 2007) (Cormier, Frantz, Rand, & Stein, 2016). Medicare
policies also claim to provide full coverage of home health services, while only covering 80% of
outpatient rehabilitation visits (Buntin et al., 2010). With a large portion of the cohort reported

13
being covered by Medicare insurance, being costlier to the patient could serve as an explanation
as to why less than half of individuals actually received recommended outpatient rehabilitation.
It is essential to note that inclusion of patients in the receipt of recommended care analyses
required that subjects received all services referred by the 30-day call, and those that received
partial referred services were treated the same as those receiving none. Table 1, the summary of
the cohort, implies that there are 17 patients that received a referral for both home health and
outpatient rehabilitation. This supports the possibility of change in a patient’s functional status,
as they may have been referred to home health at discharge and switched to outpatient at the
clinic visit.
Racial and ethnic disparities in health care in the United States, especially in stroke care,
are long standing (Ellis & Egede, 2009). Our data supports these disparities with evidence
showing that non-white patients were less likely to receive recommended outpatient
rehabilitation. The absence of significant differences in referral status of racial minorities
compared to the association found in receiving outpatient rehabilitation suggests that this racial
disparity likely originates after a rehabilitation recommendation has been made. This finding
suggests that patient characteristics other than medical necessity influence receiving
recommended outpatient rehabilitation, and are likely caused by interrelationships between
socioeconomic status, geographic location, and cultural factors rather than race alone (Sandel et
al., 2009). Significant racial disparities in functional outcomes have been reported, and
understanding why the racial disparity in stroke rehabilitation utilization exists will help future
studies improve functional outcomes for racial minorities (Howard et al., 2016) .
The use of home health services allows physicians and practitioners to utilize the concept
of early supported discharge from the hospital after experiencing an acute stroke (Gonalves-
Bradley et al., 2017). The recommendation of home health services is appropriate for patients
who are stable enough to return home, but meet home-bound criteria making the patient not

14
appropriate for outpatient therapy. In order to meet Medicare home-bound criteria, a patient must
need the help of another person or medical equipment to leave their home and their condition is
likely to worsen if they leave their home. Summarizing physical characteristics of patients
identified at the clinic visit for patients receiving recommended home health rehabilitation in
Table 5 revealed which characteristics, when present, could serve as indicators for the need of
home health services. Our study identified participants with a fall risk, ADL limitations, IADL
limitations, physical mobility and safety concerns, and communication deficits, which when
flagged, allowed for our rehabilitation algorithm to recommend home health services as
appropriate. Questions on the post-stroke functional assessment identified fall risks by asking
how many falls the participant had within the last three months, if injuries resulted from a fall that
required a doctor or emergency department visit, and if the participant had fallen since their
stroke or discharge. Qualifiers for the ADL limitation category were derived from questions on
the post-stroke functional assessment that queried participants on their ability to bathe/shower and
dress themselves independently, as well as any difficulties controlling their bladder or bowels.
IADL questions assessed a participant’s ability to use a telephone, prepare meals and do
housework without assistance, and drive to and from places since their stroke. The post-stroke
functional assessment addressed a participant’s physical mobility and safety by asking if they
could walk without feeling unsteady, and if they could walk for 15 minutes without getting short
of breath or needing to rest. Communication deficits were captured from an advanced practice
provider assessment, which asked if there were any communication deficits such as severe
dysarthria, expressive or receptive aphasia that required speech therapy. Our data found that over
half (67.1%) of participants who were receiving home health rehabilitation had documented
physical mobility and safety limitations. Although this was descriptive data, future statistical
analysis could test for significant associations between receiving recommended care versus not.

15
After experiencing a stroke, one-third of stroke survivors report suffering from post-
stroke depression (Hackett & Pickles, 2014), and it is well documented that functional outcomes
in stroke survivors experiencing depression are lower than those who do not report depression
(Watkins, Daniels, Jack, Dickinson, & Van Den Broek, 2001). Studies have shown that most
stroke survivors did not notice the onset of their depression until they returned home and realized
they could not perform their everyday tasks or do things they previously enjoyed around their
home due to their new functional impairment (Paolucci, 2008). Predictors of post-stroke
depression include physical disability, stroke severity, cognitive impairment, and pre-stroke
depression(Towfighi et al., 2016) When summarizing several neuropsychiatric characteristics of
the cohort, we found that out of those who reported depression, 62.07% did not receive
recommended rehabilitation services, however 60% of those who reported no depression
symptoms also did not receive rehabilitation.
We also summarized our cohort as those experiencing personal stress, as well as
perception of stress on relationships. These characteristics revealed that of individuals reporting
personal stress, 66.04% did not receive rehabilitation services. Stress that patients experience is
likely to come from the life-changing event of a stroke, limited resources for help and support, as
well as limited or no insurance coverage. Again, this supports prior data that suggest receiving
rehabilitation and gaining physical and mental function could limit stress on patients by helping
them care for themselves and return to their prior quality of life (Lökk & Delbari, 2010).
Increasing a patient’s independence could also have a positive effect on stress patients experience
within their relationships. Having a functional impairment leads to many stroke survivors relying
on their caregivers or family members to provide care and help for tasks that were once done
independently. It is also well documented that many stroke survivors experience stress within
their family or close relationships because the significant others are unable to relate to the life
change the survivor is experiencing (Ostwald, Bernal, Cron, & Godwin, 2009).

16
Limitations
The sample size of participants in our cohort was small, and decreased with each set of
inclusion criteria for analyses. Our sample was limited to patients who were referred
rehabilitation services, which decreased the original sample size substantially due to the majority
having minor stroke severity scores. In order to receive the 30-day call patients had to attended
the clinic visit, which less than half who were not referred rehabilitation at discharge actually
attended. Without the 30-day call, receipt of rehabilitation recommendations could not be
assessed. Since the trial is ongoing, patients without the clinic visit and 30-day call will still be
assessed at the 90-day call for functional outcomes for the COMPASS project.
Analysis of receiving recommended rehabilitation services for home health as well as
outpatient required that participants received all services to which they were referred.
Participants whose functional status changed may have influenced a change in home health
rehabilitation to outpatient rehabilitation, which would have also put them in the category of not
receiving all recommended services.
Ambulatory status at discharge was associated with receiving a rehabilitation referral;
however, nearly 22% of the cohort did not have ambulatory statuses at discharge scores recorded.
Missing discharge ambulatory statuses could account for participants not receiving a referral for
rehabilitative care who show medical necessity for rehabilitation.
A final limitation in our study interpretation of a participant’s geographic location. We
let the location of the hospital where an individual received treatment, categorized as
metropolitan or other, represent where the participant resided and in turn where they were
referred care. We expected being in an urban area would imply greater access to rehabilitation
services, however the issue is participants may not live in the same area as the hospital.

17
Future Research
Future directions of research that could build upon these findings are analyzing actual
functional outcomes of stroke patients who received rehabilitation services versus those who did
not. This study serves as a preliminary analysis to determine the status of COMPASS patients
who attended clinic and received care plans, which is a focus of quality improvement for the
remainder of the intervention enrollment period for the COMPASS trial.
CONCLUSION
Understanding the limitations and deficits of patients who have experienced a stroke are
critical in developing a targeted rehabilitative care plan. Prior research has established that stroke
patients are able to achieve pre-stroke quality of life and function through rehabilitation service
supports; however, the factors that influence referral and receipt of recommended services for
equitable health care are ill-defined. Our results demonstrate that ambulatory status influences
referral to rehabilitation services, and that an association between racial minorities and receipt of
outpatient therapy exists. Our study has also expressed the need for future studies and analyses to
focus on actual functional outcome comparisons of patients who are receiving recommended
rehabilitation compared to those not receiving the recommended rehabilitation services. This
could be beneficial to the stroke population, as well as other health care systems, by helping to
identify disparities that exist within stoke care and improving the methods behind receiving
recommended services, with the possibility of improving functional outcomes and qualities of life
for stroke survivors.
18
REFERENCES
Benjamin, A. E. (1986). State variations in home health expenditures and utilization under
Medicare and Medicaid. Home Health Care Services Quarterly, 7(1), 5–28.
https://doi.org/10.1300/J027v07n01_02
Bogasky, S., Gage, B., Morley, M., Spain, P., & Ingber, M. (2009). Examining Post Acute Care
Relationships in an Integrated Hospital System Final Report, March 2009.
Braveman, P. (2006). HEALTH DISPARITIES AND HEALTH EQUITY: Concepts and
Measurement. Annual Review of Public Health, 27(1), 167–194.
https://doi.org/10.1146/annurev.publhealth.27.021405.102103
Buntin, M. B., Colla, C. H., Deb, P., Sood, N., & Escarce, J. J. (2010). Medicare spending and
outcomes after postacute care for stroke and hip fracture. Medical Care, 48(9), 776–84.
https://doi.org/10.1097/MLR.0b013e3181e359df
Buntin, M. B., Garten, A. D., Paddock, S., Saliba, D., Totten, M., & Escarce, J. J. (2005). How
much is postacute care use affected by its availability? Health Services Research, 40(2),
413–434. https://doi.org/10.1111/j.1475-6773.2005.0i366.x
Chen, R., Crichton, S., McKevitt, C., Rudd, A. G., Sheldenkar, A., & Wolfe, C. D. A. (2015).
Association Between Socioeconomic Deprivation and Functional Impairment After Stroke.
Stroke, 46(3).
Cohen, M. D., Dilworth-Anderson, P., G Felix, A. C., Daniel Lee, S.-Y., Stearns, S. C., &
Williams, S. W. (2010). THE EFFECT OF RACE ON REHABILITATION UTILIZATION
AMONG STROKE PATIENTS IN NORTH CAROLINA. Gillings School of Global Public
Health (Health Policy and Management). Chapel Hill.

19
Cormier, D. J., Frantz, M. A., Rand, E., & Stein, J. (2016). Physiatrist referral preferences for
postacute stroke rehabilitation. Medicine, 95(33), e4356.
https://doi.org/10.1097/MD.0000000000004356
Cruz-Flores, S., Rabinstein, A., Biller, J., Elkind, M. S. V., Griffith, P., Gorelick, P. B., …
Valderrama, A. L. (2011). Racial-Ethnic Disparities in Stroke Care: The American
Experience. Stroke, 42(7).
Dhamoon, M. S., Moon, Y. P., Paik, M. C., Boden-Albala, B., Rundek, T., Sacco, R. L., &
Elkind, M. S. V. (2010). Quality of life declines after first ischemic stroke. The Northern
Manhattan Study. Neurology, 75(4), 328–34.
https://doi.org/10.1212/WNL.0b013e3181ea9f03
Duncan, P. W., Lai, S. M., Bode, R. K., Perera, S., & DeRosa, J. (2003). Stroke Impact Scale-16:
A brief assessment of physical function. Neurology, 60, 291–296.
https://doi.org/10.1212/01.WNL.0000041493.65665.D6
Ellis, C., & Egede, L. E. (2009). Racial/ethnic differences in poststroke rehabilitation utilization
in the USA. Expert Review of Cardiovascular Therapy, 7(4), 405–410.
https://doi.org/10.1586/erc.09.6
Freburger, J. K., Li, D., Johnson, A. M., & Fraher, E. P. (2017). Physical and Occupational
Therapy From the Acute to Community Setting After Stroke: Predictors of Use, Continuity
of Care, and Timeliness of Care. Archives of Physical Medicine and Rehabilitation.
https://doi.org/10.1016/j.apmr.2017.03.007
Gon?alves-Bradley, D. C., Iliffe, S., Doll, H. A., Broad, J., Gladman, J., Langhorne, P., …
Shepperd, S. (2017). Early discharge hospital at home. In S. Shepperd (Ed.), Cochrane
Database of Systematic Reviews (Vol. 6, p. CD000356). Chichester, UK: John Wiley &
20
Sons, Ltd. https://doi.org/10.1002/14651858.CD000356.pub4
Hackett, M. L., & Pickles, K. (2014). Part I: Frequency of Depression after Stroke: An Updated
Systematic Review and Meta-Analysis of Observational Studies. International Journal of
Stroke, 9(8), 1017–1025. https://doi.org/10.1111/ijs.12357
Howard, G., Moy, C. S., Howard, V. J., McClure, L. A., Kleindorfer, D. O., Kissela, B. M., …
Wadley, V. G. (2016). Where to Focus Efforts to Reduce the Black–White Disparity in
Stroke Mortality. Stroke, 47(7).
Johnson, W., Onuma, O., Owolabi, M., & Sachdev, S. (2016). Stroke: a global response is
needed. Bulletin of the World Health Organization, 94(9), 634–634A.
https://doi.org/10.2471/BLT.16.181636
Langhorne, P., Widen-Holmqvist, L., Taylor, G., Murray, G., Askim, T., Dennis, M., … Wolfe,
C. (2007). Early supported discharge after stroke. Journal of Rehabilitation Medicine.
https://doi.org/10.2340/16501977-0042
Lökk, J., & Delbari, A. (2010). Management of depression in elderly stroke patients.
Neuropsychiatric Disease and Treatment, 6, 539. https://doi.org/10.2147/ndt.s7637
McNaughton, H., Feigin, V., Kerse, N., Barber, P. A., Weatherall, M., Bennett, D., … Anderson,
C. (2011). Ethnicity and Functional Outcome After Stroke. Stroke, 42(4).
Mozaffarian, D., Benjamin, E. J., Go, A. S., Arnett, D. K., Blaha, M. J., Cushman, M., … Turner,
M. B. (2015). Heart Disease and Stroke Statistics—2016 Update. Circulation.
Naylor, M. D., Aiken, L. H., Kurtzman, E. T., Olds, D. M., & Hirschman, K. B. (2011). The care
span: The importance of transitional care in achieving health reform. Health Affairs, 30(4),
746–754. https://doi.org/10.1377/hlthaff.2011.0041

21
Ostwald, S. K., Bernal, M. P., Cron, S. G., & Godwin, K. M. (2009). Stress experienced by stroke
survivors and spousal caregivers during the first year after discharge from inpatient
rehabilitation. Topics in Stroke Rehabilitation, 16(2), 93–104.
https://doi.org/10.1310/tsr1602-93
Ovbiagele, B., Goldstein, L. B., Higashida, R. T., Howard, V. J., Johnston, S. C., Khavjou, O. A.,
… Trogdon, J. G. (2013). Forecasting the Future of Stroke in the United States. Stroke,
44(8). Retrieved from http://stroke.ahajournals.org/content/44/8/2361.long
Paolucci, S. (2008). Epidemiology and treatment of post-stroke depression. Neuropsychiatric
Disease and Treatment, 4(1), 145–54. Retrieved from
http://www.ncbi.nlm.nih.gov/pubmed/18728805
Pollock, A., Baer, G., Campbell, P., Choo, P. L., Forster, A., Morris, J., … Langhorne, P.
(2014a). Physical Rehabilitation Approaches for the Recovery of Function and Mobility
After Stroke. Stroke, 45(10). Retrieved from
http://stroke.ahajournals.org/content/45/10/e202
Pollock, A., Baer, G., Campbell, P., Choo, P. L., Forster, A., Morris, J., … Langhorne, P.
(2014b). Physical rehabilitation approaches for the recovery of function and mobility
following stroke. In A. Pollock (Ed.), Cochrane Database of Systematic Reviews.
Chichester, UK: John Wiley & Sons, Ltd.
https://doi.org/10.1002/14651858.CD001920.pub3
Prvu Bettger, J., McCoy, L., Smith, E. E., Fonarow, G. C., Schwamm, L. H., & Peterson, E. D.
(2015). Contemporary trends and predictors of postacute service use and routine discharge
home after stroke. Journal of the American Heart Association, 4(2).
https://doi.org/10.1161/JAHA.114.001038

22
Sandel, M. E., Wang, H., Terdiman, J., Hoffman, J. M., Ciol, M. A., Sidney, S., … Chan, L.
(2009). Disparities in stroke rehabilitation: results of a study in an integrated health system
in northern California. PM & R : The Journal of Injury, Function, and Rehabilitation, 1(1),
29–40. https://doi.org/10.1016/j.pmrj.2008.10.012
Shen, J. J., & Washington, E. L. (2007). Disparities in Outcomes Among Patients With Stroke
Associated With Insurance Status. Stroke, 38(3).
Stein, J., Bettger, J. P., Sicklick, A., Hedeman, R., Magdon-Ismail, Z., & Schwamm, L. H.
(2015). Use of a standardized assessment to predict rehabilitation care after acute stroke.
Archives of Physical Medicine and Rehabilitation, 96(2), 210–217.
https://doi.org/10.1016/j.apmr.2014.07.403
Towfighi, A., Ovbiagele, B., El Husseini, N., Hackett, M. L., Jorge, R. E., Kissela, B. M., …
Williams, L. S. (2016). Poststroke Depression: A Scientific Statement for Healthcare
Professionals From the American Heart Association/American Stroke Association. Stroke.
Retrieved from
http://stroke.ahajournals.org/content/early/2016/12/08/STR.0000000000000113
Veerbeek, J. M., van Wegen, E., van Peppen, R., van der Wees, P. J., Hendriks, E., Rietberg, M.,
& Kwakkel, G. (2014). What is the evidence for physical therapy poststroke? A systematic
review and meta-analysis. PloS One, 9(2), e87987.
https://doi.org/10.1371/journal.pone.0087987
Watkins, C., Daniels, L., Jack, C., Dickinson, H., & Van Den Broek, M. (n.d.). Accuracy of a
single question in screening for depression in a cohort of patients after stroke: comparative
study. Retrieved from http://www.bmj.com/content/bmj/323/7322/1159.full.pdf
Winstein, C. J., Stein, J., Arena, R., Bates, B., Cherney, L. R., Cramer, S. C., … Zorowitz, R. D.

23
(2016). Guidelines for Adult Stroke Rehabilitation and Recovery: A Guideline for
Healthcare Professionals from the American Heart Association/American Stroke
Association. Stroke (Vol. 47). https://doi.org/10.1161/STR.0000000000000098

24
APPENDIX
Table 1: Summary of Cohort
Data Extract Date: May 3,
2017
Criteria N %
Enrolled and Did Not Withdraw 1695 100.0%
Referred to Rehab at Discharge 604 35.6%
Not Referred to Rehab at Discharge 1091 64.4%
Completed Clinic Visit [1] 659 38.9%
Not Referred to Rehab at Discharge 399 23.5%
Referred to Rehab at Clinic Visit and Not Discharge 52 3.1%
Completed 30-Day Call and Clinic Visit [1] 369 21.8%
w/Documented Rehab Recommendations 176 10.3%
w/Documented Home Health Rehab Recommendations 114 6.7%
w/Documented Outpatient Rehab Recommendations 79 4.6%
[1] Excludes patients who did not provide consent for research at the clinic visi

Table 2: Summary of Demographics Characteristics
for Enrolled Patients Who Did Not Withdraw
Data Extract Date: May 3, 2017
25
N %
Age Category <65 686 40.5%
>=65 1009 59.5%
Sex Male 890 52.5%
Female 805 47.5%
Ethnicity Hispanic 31 1.8%
Non-Hispanic 1657 97.8%
Unknown 7 0.4%
Race White 1327 78.3%
African American 310 18.3%
American Indian/Native AL 11 0.6%
Asian 5 0.3%
Native HA/Pacific Islander 1 0.1%
Multi-race 7 0.4%
Other 24 1.4%
Unknown 10 0.6%
Hospital Location Metropolitan 1030 60.8%
Other 665 39.2%
Diagnosis Ischemic Stroke 1025 60.5%
ICH 72 4.2%
Ischemic Stroke with Hemorrhage 7 0.4%
Stroke, NOS 40 2.4%
TIA 551 32.5%
Ambulatory Status at Admission Independent 1601 94.5%
With assistance 58 3.4%
Unable to ambulate 23 1.4%
Missing 13 0.8%
Ambulatory Status at Discharge Independent 1185 69.9%
With assistance 116 6.8%
Unable to ambulate 12 0.7%
Missing 382 22.5%

Table 2: Summary of Demographics Characteristics
for Enrolled Patients Who Did Not Withdraw
Data Extract Date: May 3, 2017
26
N %
NIH Stroke Score Category 0 451 26.6%
1 283 16.7%
2 185 10.9%
3 to 4 203 12.0%
5 to 7 123 7.3%
>7 101 6.0%
Missing 349 20.6%
Medicare Insurance[1] No 694 40.9%
Yes 990 58.4%
Missing 11 0.6%
Medicaid Insurance[1] No 1529 90.2%
Yes 155 9.1%
Missing 11 0.6%
Private Insurance[1] No 1153 68.0%
Yes 531 31.3%
Missing 11 0.6%
VA/Champus Insurance[1] No 1631 96.2%
Yes 53 3.1%
Missing 11 0.6%
Self-Pay/No Insurance[1] No 1530 90.3%
Yes 154 9.1%
Missing 11 0.6%

Table 3a: Analysis of Discharge Rehab Referral Status
Data Extract Date: May 3, 2017
27
Odds Ratio[1]
Characteristic
Value
N
Referred to Rehab at
Discharge n(%)
Not Referred to Rehab at Discharge
n(%)
Unadjusted
(95% CI) [2]
Adjusted (95%
CI) [3]
p-value [4]
Age (years) <65 686 216 (31.49%) 470 (68.51%) 1.36 (1.10,1.68) 1.81 (1.42,2.31) <0.0001*
>=65 1009 388 (38.45%) 621 (61.55%)
Gender Male 890 292 (32.81%) 598 (67.19%) 1.30 (1.06,1.59) 1.40 (1.10,1.76) 0.0052
Female 805 312 (38.76%) 493 (61.24%)
Ethnicity Non-Hispanic 1657 598 (36.09%) 1059 (63.91%) 0.34 (0.10,0.91) 0.26 (0.09,0.77) 0.0152
Hispanic 31 5 (16.13%) 26 (83.87%)
Race White 1333 467 (35.03%) 866 (64.97%) 1.15 (0.90,1.48) 1.10 (0.83,1.47) 0.5099
Non-white 352 135 (38.35%) 217 (61.65%)
Hospital Location Metropolitan 1030 426 (41.36%) 604 (58.64%) 0.52 (0.42,0.64) 0.53 (0.26,1.05) 0.0672
Other 665 178 (26.77%) 487 (73.23%)
NIH Stroke Score[5] 0 - No Stroke Symptoms 451 98 (21.73%) 353 (78.27%)
1-4 - Minor 671 278 (41.43%) 393 (58.57%) 2.55 (1.93,3.38) 2.65 (2.01,3.49) <0.0001*
5-42 - Moderate to Severe 224 132 (58.93%) 92 (41.07%) 5.15 (3.60,7.43) 5.61 (3.90,8.06) <0.0001*
Missing 349 96 (27.51%) 253 (72.49%)

Table 3a: Analysis of Discharge Rehab Referral Status
Data Extract Date: May 3, 2017
28
Odds Ratio[1]
Characteristic
Value
N
Referred to Rehab at
Discharge n(%)
Not Referred to Rehab at Discharge
n(%)
Unadjusted
(95% CI) [2]
Adjusted (95%
CI) [3]
p-value [4]
Ambulatory Status at Admission[6]
Independent 1601 553 (34.54%) 1048 (65.46%) 2.49 (1.55,4.03) 1.78 (1.02,3.13) 0.0429
With assistance 58 35 (60.34%) 23 (39.66%)
Unable to ambulate 23 11 (47.83%) 12 (52.17%)
Unknown 13 5 (38.46%) 8 (61.54%)
Ambulatory Status at Discharge[6]
Independent 1185 442 (37.30%) 743 (62.70%) 8.57 (5.23,14.60) 8.81 (4.45,17.43) <0.0001*
With assistance 116 99 (85.34%) 17 (14.66%)
Unable to ambulate 12 8 (66.67%) 4 (33.33%)
Unknown 382 55 (14.40%) 327 (85.60%)
Medicare Insurance[7] No 694 211 (30.40%) 483 (69.60%) 1.48 (1.20,1.83) 1.48 (1.07,2.06) 0.0177
Yes 990 389 (39.29%) 601 (60.71%)
Medicaid Insurance[7] No 1529 530 (34.66%) 999 (65.34%) 1.55 (1.09,2.19) 1.70 (1.13,2.55) 0.0106
Yes 155 70 (45.16%) 85 (54.84%)
Private Insurance[7] No 1153 444 (38.51%) 709 (61.49%) 0.66 (0.53,0.83) 0.89 (0.68,1.17) 0.4077
Yes 531 156 (29.38%) 375 (70.62%)

Table 3a: Analysis of Discharge Rehab Referral Status
Data Extract Date: May 3, 2017
29
Odds Ratio[1]
Characteristic
Value
N
Referred to Rehab at
Discharge n(%)
Not Referred to Rehab at Discharge
n(%)
Unadjusted
(95% CI) [2]
Adjusted (95%
CI) [3]
p-value [4]
VA/Champus Insurance[7] No 1631 579 (35.50%) 1052 (64.50%) 1.19 (0.65,2.15) 1.14 (0.59,2.18) 0.7027
Yes 53 21 (39.62%) 32 (60.38%)
Self-Pay/No Insurance[7] No 1530 556 (36.34%) 974 (63.66%) 0.70 (0.47,1.02) 0.63 (0.40,1.01) 0.0546
Yes 154 44 (28.57%) 110 (71.43%)

Table 3b: Analysis of Clinic Visit Rehab Referral Status for Patients not Referred at Discharge
Data Extract Date: May 3, 2017
30
Odds Ratio[1]
Characteristic
Value
N
Referred to Rehab at Clinic Visit
n(%)
Not Referred to Rehab at Clinic Visit
n(%)
Unadjusted
(95% CI) [2]
Adjusted (95%
CI) [3]
p-value [4]
Age (years) <65 188 25 (13.30%) 163 (86.70%) 0.96 (0.51,1.79) 0.78 (0.40,1.49) 0.4466
>=65 211 27 (12.80%) 184 (87.20%)
Gender Male 223 30 (13.45%) 193 (86.55%) 0.92 (0.48,1.72) 0.92 (0.48,1.78) 0.8133
Female 176 22 (12.50%) 154 (87.50%)
Ethnicity Non-Hispanic 387 51 (13.18%) 336 (86.82%) 0.94 (0.02,7.58) 0.75 (0.09,6.52) 0.7981
Hispanic 8 1 (12.50%) 7 (87.50%)
Race White 314 40 (12.74%) 274 (87.26%) 1.14 (0.52,2.36) 1.00 (0.46,2.21) 0.9941
Non-white 84 12 (14.29%) 72 (85.71%)
Hospital Location Metropolitan 255 35 (13.73%) 220 (86.27%) 0.84 (0.42,1.62) 0.59 (0.22,1.57) 0.2871
Other 144 17 (11.81%) 127 (88.19%)
NIH Stroke Score[5] 0 - No Stroke Symptoms 156 11 (7.05%) 145 (92.95%)
1-4 - Minor 156 28 (17.95%) 128 (82.05%) 2.87 (1.32,6.67) 2.86 (1.37,5.99) 0.0052
5-42 - Moderate to Severe 27 4 (14.81%) 23 (85.19%) 2.28 (0.49,8.57) 2.17 (0.63,7.45) 0.2179
Missing 60 9 (15.00%) 51 (85.00%)

Table 3b: Analysis of Clinic Visit Rehab Referral Status for Patients not Referred at Discharge
Data Extract Date: May 3, 2017
31
Odds Ratio[1]
Characteristic
Value
N
Referred to Rehab at Clinic Visit
n(%)
Not Referred to Rehab at Clinic Visit
n(%)
Unadjusted
(95% CI) [2]
Adjusted (95%
CI) [3]
p-value [4]
Ambulatory Status at Admission[6]
Independent 386 49 (12.69%) 337 (87.31%) 2.58 (0.43,11.18) 1.06 (0.12,9.04) 0.9580
With assistance 4 0 (0.00%) 4 (100.0%)
Unable to ambulate 7 3 (42.86%) 4 (57.14%)
Unknown 2 0 (0.00%) 2 (100.0%)
Ambulatory Status at Discharge[6]
Independent 269 42 (15.61%) 227 (84.39%) 2.16 (0.20,13.70) 0.00 (0.00,I) 0.9871
With assistance 5 0 (0.00%) 5 (100.0%)
Unable to ambulate 2 2 (100.0%) 0 (0.00%)
Unknown 123 8 (6.50%) 115 (93.50%)
Medicare Insurance[7] No 197 26 (13.20%) 171 (86.80%) 0.94 (0.50,1.78) 0.79 (0.30,2.02) 0.6174
Yes 199 25 (12.56%) 174 (87.44%)
Medicaid Insurance[7] No 368 44 (11.96%) 324 (88.04%) 2.45 (0.83,6.42) 2.63 (0.94,7.36) 0.0664
Yes 28 7 (25.00%) 21 (75.00%)
Private Insurance[7] No 246 36 (14.63%) 210 (85.37%) 0.65 (0.32,1.27) 0.66 (0.31,1.38) 0.2659
Yes 150 15 (10.00%) 135 (90.00%)

Table 3b: Analysis of Clinic Visit Rehab Referral Status for Patients not Referred at Discharge
Data Extract Date: May 3, 2017
32
Odds Ratio[1]
Characteristic
Value
N
Referred to Rehab at Clinic Visit
n(%)
Not Referred to Rehab at Clinic Visit
n(%)
Unadjusted
(95% CI) [2]
Adjusted (95%
CI) [3]
p-value [4]
VA/Champus Insurance[7] No 386 51 (13.21%) 335 (86.79%)
Yes 10 0 (0.00%) 10 (100.0%)
Self-Pay/No Insurance[7] No 355 44 (12.39%) 311 (87.61%) 1.46 (0.51,3.61) 1.15 (0.41,3.24) 0.7921
Yes 41 7 (17.07%) 34 (82.93%)

Table 4a: Analysis of Receipt of All Recommended Home Health Care
Data Extract Date: May 3, 2017
33
Odds Ratio[1]
Characteristic
Value
N
Received Home
Health Care n(%)
Did Not Receive Home Health Services n(%)
Unadjusted
(95% CI) [2]
Adjusted (95%
CI) [3]
p-value [4]
Age (years) <65 34 15 (44.12%) 19 (55.88%) 0.96 (0.40,2.35) 1.09 (0.44,2.72) 0.8517
>=65 81 35 (43.21%) 46 (56.79%)
Gender Male 43 17 (39.53%) 26 (60.47%) 1.29 (0.56,3.01) 1.74 (0.75,4.03) 0.1945
Female 72 33 (45.83%) 39 (54.17%)
Ethnicity Non-Hispanic 114 50 (43.86%) 64 (56.14%) Not Estimable Not Estimable Not Estimable
Hispanic 1 0 (0.00%) 1 (100.0%)
Race White 92 40 (43.48%) 52 (56.52%) 1.00 (0.35,2.76) 1.10 (0.39,3.08) 0.8535
Non-white 23 10 (43.48%) 13 (56.52%)
Hospital Location Metropolitan 69 22 (31.88%) 47 (68.12%) 3.32 (1.42,7.81) 3.50 (0.88,13.91) 0.0750
Other 46 28 (60.87%) 18 (39.13%)
NIH Stroke Score[5] 0 - No Stroke Symptoms 14 5 (35.71%) 9 (64.29%)
1-4 - Minor 63 26 (41.27%) 37 (58.73%) 1.26 (0.33,5.37) 1.36 (0.40,4.68) 0.6257
5-42 - Moderate to Severe 27 14 (51.85%) 13 (48.15%) 1.91 (0.43,9.32) 2.20 (0.54,8.94) 0.2698
Missing 11 5 (45.45%) 6 (54.55%)

Table 4a: Analysis of Receipt of All Recommended Home Health Care
Data Extract Date: May 3, 2017
34
Odds Ratio[1]
Characteristic
Value
N
Received Home
Health Care n(%)
Did Not Receive Home Health Services n(%)
Unadjusted
(95% CI) [2]
Adjusted (95%
CI) [3]
p-value [4]
Ambulatory Status at Admission[6]
Independent 106 47 (44.34%) 59 (55.66%) 0.63 (0.10,3.14) 0.43 (0.08,2.42) 0.3391
With assistance 7 2 (28.57%) 5 (71.43%)
Unable to ambulate 2 1 (50.00%) 1 (50.00%)
Ambulatory Status at Discharge[6]
Independent 84 38 (45.24%) 46 (54.76%) 0.66 (0.18,2.18) 0.73 (0.15,3.68) 0.7049
With assistance 15 5 (33.33%) 10 (66.67%)
Unable to ambulate 2 1 (50.00%) 1 (50.00%)
Unknown 14 6 (42.86%) 8 (57.14%)
Medicare Insurance[7] No 32 14 (43.75%) 18 (56.25%) 0.98 (0.40,2.45) 0.93 (0.29,2.91) 0.8947
Yes 83 36 (43.37%) 47 (56.63%)
Medicaid Insurance[7] No 100 42 (42.00%) 58 (58.00%) 1.58 (0.46,5.53) 1.35 (0.40,4.52) 0.6253
Yes 15 8 (53.33%) 7 (46.67%)
Private Insurance[7] No 91 42 (46.15%) 49 (53.85%) 0.58 (0.20,1.63) 0.58 (0.20,1.67) 0.3141
Yes 24 8 (33.33%) 16 (66.67%)

Table 4a: Analysis of Receipt of All Recommended Home Health Care
Data Extract Date: May 3, 2017
35
Odds Ratio[1]
Characteristic
Value
N
Received Home
Health Care n(%)
Did Not Receive Home Health Services n(%)
Unadjusted
(95% CI) [2]
Adjusted (95%
CI) [3]
p-value [4]
VA/Champus Insurance[7] No 113 48 (42.48%) 65 (57.52%) Not Estimable Not Estimable Not Estimable
Yes 2 2 (100.0%) 0 (0.00%)
Self-Pay/No Insurance[7] No 110 48 (43.64%) 62 (56.36%) 0.86 (0.07,7.84) 0.85 (0.12,6.14) 0.8684
Yes 5 2 (40.00%) 3 (60.00%)

Table 4b: Analysis of Receipt of All Recommended Outpatient Care
Data Extract Date: May 3, 2017
36
Odds Ratio[1]
Characteristic
Value
N
Received Outpatient
Care n(%)
Did Not Receive Outpatient Services
n(%)
Unadjusted
(95% CI) [2]
Adjusted (95%
CI) [3]
p-value [4]
Age (years) <65 44 15 (34.09%) 29 (65.91%) 1.00 (0.37,2.70) 0.92 (0.34,2.46) 0.8674
>=65 41 14 (34.15%) 27 (65.85%)
Gender Male 47 15 (31.91%) 32 (68.09%) 1.24 (0.46,3.36) 1.05 (0.39,2.79) 0.9282
Female 38 14 (36.84%) 24 (63.16%)
Ethnicity Non-Hispanic 83 29 (34.94%) 54 (65.06%) Not Estimable Not Estimable Not Estimable
Hispanic 1 0 (0.00%) 1 (100.0%)
Race White 64 25 (39.06%) 39 (60.94%) 0.28 (0.05,1.11) 0.22 (0.05,0.95) 0.0428
Non-white 20 3 (15.00%) 17 (85.00%)
Hospital Location Metropolitan 64 19 (29.69%) 45 (70.31%) 2.15 (0.69,6.63) 3.64 (0.98,13.43) 0.0527
Other 21 10 (47.62%) 11 (52.38%)
NIH Stroke Score[5] 0 - No Stroke Symptoms 21 5 (23.81%) 16 (76.19%)
1-4 - Minor 42 17 (40.48%) 25 (59.52%) 2.15 (0.60,8.97) 2.14 (0.65,7.06) 0.2104
5-42 - Moderate to Severe 12 4 (33.33%) 8 (66.67%) 1.58 (0.24,9.85) 1.59 (0.33,7.62) 0.5614
Missing 10 3 (30.00%) 7 (70.00%)

Table 4b: Analysis of Receipt of All Recommended Outpatient Care
Data Extract Date: May 3, 2017
37
Odds Ratio[1]
Characteristic
Value
N
Received Outpatient
Care n(%)
Did Not Receive Outpatient Services
n(%)
Unadjusted
(95% CI) [2]
Adjusted (95%
CI) [3]
p-value [4]
Ambulatory Status at Admission[6]
Independent 82 29 (35.37%) 53 (64.63%) Not Estimable Not Estimable Not Estimable
With assistance 1 0 (0.00%) 1 (100.0%)
Unable to ambulate 1 0 (0.00%) 1 (100.0%)
Unknown 1 0 (0.00%) 1 (100.0%)
Ambulatory Status at Discharge[6]
Independent 72 24 (33.33%) 48 (66.67%) 1.00 (0.08,7.56) 1.06 (0.16,7.03) 0.9514
With assistance 6 2 (33.33%) 4 (66.67%)
Unknown 7 3 (42.86%) 4 (57.14%)
Medicare Insurance[7] No 46 15 (32.61%) 31 (67.39%) 1.21 (0.44,3.27) 1.32 (0.39,4.48) 0.6586
Yes 38 14 (36.84%) 24 (63.16%)
Medicaid Insurance[7] No 79 27 (34.18%) 52 (65.82%) 1.28 (0.10,11.89) 1.10 (0.16,7.44) 0.9248
Yes 5 2 (40.00%) 3 (60.00%)
Private Insurance[7] No 53 16 (30.19%) 37 (69.81%) 1.67 (0.60,4.63) 1.55 (0.55,4.39) 0.4078
Yes 31 13 (41.94%) 18 (58.06%)

Table 4b: Analysis of Receipt of All Recommended Outpatient Care
Data Extract Date: May 3, 2017
38
Odds Ratio[1]
Characteristic
Value
N
Received Outpatient
Care n(%)
Did Not Receive Outpatient Services
n(%)
Unadjusted
(95% CI) [2]
Adjusted (95%
CI) [3]
p-value [4]
VA/Champus Insurance[7] No 81 29 (35.80%) 52 (64.20%) Not Estimable Not Estimable Not Estimable
Yes 3 0 (0.00%) 3 (100.0%)
Self-Pay/No Insurance[7] No 72 27 (37.50%) 45 (62.50%) 0.33 (0.03,1.76) 0.31 (0.06,1.76) 0.1877
Yes 12 2 (16.67%) 10 (83.33%)

39
Table 5 : Summary of Select Characteristics Identified at the Clinic Visit
for Patients Receiving Home Health Rehabilitation Recommendations
Data Extract Date: May 3, 2017
Characteristic Response N(%)
Fall Risk Yes 64 (42.95%)
No 85 (57.05%)
ADL Limitations Yes 57 (38.26%)
No 92 (61.74%)
IADL Limitations Yes 48 (32.21%)
No 101 (67.79%)
Physical Mobility and Safety Yes 100 (67.11%)
No 49 (32.89%)
Communication Deficits Yes 24 (16.11%)
No 125 (83.89%)
40
Table 6: Summary of Select Characteristics Identified at the Clinic Visit
by Receipt Status of All Recommended
Rehabilitation Data Extract Date: May 3, 2017
Characteristic
Response
Received Rehab Services
N(%)
Did Not Receive Rehab Services N(%)
Depression Yes 22 (37.93%) 36 (62.07%)
No 45 (39.13%) 70 (60.87%)
Stress Yes 18 (33.96%) 35 (66.04%)
No 49 (40.83%) 71 (59.17%)
Stress on Relationships Yes 6 (60.00%) 4 (40.00%)
No 61 (37.42%) 102 (62.58%)
Lack of Transportation Yes 1 (100.0%) 0 (0.00%)
No 66 (38.37%) 106 (61.63%)
41
CURRICULUM VITAE
Kristen N. Penland
Education
Master of Science: Health Disparities in Neuroscience-related Disorders
August 2017
Wake Forest University, Winston-Salem, NC
Bachelor of Science: Exercise Science
May 2012
Appalachian State University, Boone, NC
Experience
Clinical Research Coordinator, DJL Clinical Research, PLLC., Charlotte, NC
2017-Present
• Identified and enrolled eligible patients into appropriate clinical trials.
• Maintained accurate patient records in compliance with company SOP and FDA
standards.
• Conducted subject visits according to protocol.
• Preformed quality assurance checks on patient and regulatory binders.
• Communicated with project team management in regards to queries and adverse events in
timely manner.
Wellness Coordinator, Homestead Hills Senior Living, Winston-Salem, NC
2015-2015
• Managed and instructed aquatic and land based wellness program.
• Developed wellness classes for Memory Care Facility.
• Developed participation and retention strategies.
Rehab Aide, CarePartners Rehabilitation Hospital, Asheville, NC
2013-2015
• Assisted in patient therapy.
• Co-managed and developed aquatic wellness program.
• Tracked individual patient plan of care.
Certifications
• CITI- Human Research Biomedical Investigators
• CITI- Good Clinical Practice (GCP)
• CITI- International Conference on Harmonization (ICH)