distance as a barrier to child and adolescent mental
TRANSCRIPT

Louisiana State UniversityLSU Digital Commons
LSU Master's Theses Graduate School
2008
Distance as a barrier to child and adolescent mentalhealth service access in post-Katrina Orleans ParishRob HarrisonLouisiana State University and Agricultural and Mechanical College, [email protected]
Follow this and additional works at: https://digitalcommons.lsu.edu/gradschool_theses
Part of the Social Work Commons
This Thesis is brought to you for free and open access by the Graduate School at LSU Digital Commons. It has been accepted for inclusion in LSUMaster's Theses by an authorized graduate school editor of LSU Digital Commons. For more information, please contact [email protected].
Recommended CitationHarrison, Rob, "Distance as a barrier to child and adolescent mental health service access in post-Katrina Orleans Parish" (2008). LSUMaster's Theses. 3113.https://digitalcommons.lsu.edu/gradschool_theses/3113

DISTANCE AS A BARRIER TO CHILD AND ADOLESCENT MENTAL HEALTH
SERVICE ACCESS IN POST-KATRINA ORLEANS PARISH
A Thesis
Submitted to the Graduate Faculty of the Louisiana State University and
Agricultural and Mechanical College in partial fulfillment of the
requirements for the degree of Master of Social Work
in
The School of Social Work
by Rob Harrison
B.G.S., Nicholls State University, 2004 December 2008

TABLE OF CONTENTS
LIST OF TABLES ................................................................................................................ iv
LIST OF FIGURES ............................................................................................................... v
ABSTRACT .......................................................................................................................... vi
CHAPTER 1 INTRODUCTION .......................................................................................... 1
CHAPTER 2 REVIEW OF LITERATURE .......................................................................... 5 Social Vulnerability .......................................................................................................... 5 General Social Service Barriers ........................................................................................ 7 Mental Health Service Barriers ......................................................................................... 8 Child and Adolescent Mental Health Service Barriers ................................................... 10 Barriers to Service Following Disaster ........................................................................... 11 Mental Health Crisis in Orleans Parish ........................................................................... 12 GIS and Social Work ...................................................................................................... 14 CHAPTER 3 METHODS .................................................................................................... 18 Measurement ................................................................................................................... 18 Population and Unit of Analysis ................................................................................. 18 Variable Definition ..................................................................................................... 18 Data Analysis .............................................................................................................. 21 Descriptive Statistics ...................................................................................................... 21 Descriptive Mapping ...................................................................................................... 22 Bivariate and Statistics ................................................................................................... 23 Multivariate Statistics .................................................................................................... 24 CHAPTER 4 RESULTS AND DISCUSSION .................................................................... 25 Results ............................................................................................................................. 25 Descriptive Statistics .................................................................................................... 25 Descriptive Mapping .................................................................................................... 27 Bivariate Statistics ....................................................................................................... 33 Multivariate Statistics .................................................................................................. 35 Discussion ....................................................................................................................... 38 African American ......................................................................................................... 38 Poverty ......................................................................................................................... 39 Female-Headed Households with Children Under 18 Years Old ................................ 40 CHAPTER 5 IMPLICATIONS AND CONCLUSION ....................................................... 42 Implication ...................................................................................................................... 42 Conclusion ...................................................................................................................... 45 REFERENCES .................................................................................................................... 47 APPENDIX .......................................................................................................................... 51
ii

VITA .................................................................................................................................... 52
iii

LIST OF TABLES
Table 1. Block groups means, standard deviation, and range for variables ........................ 26
Table 2. Correlation of mean block group linear distance from mental health facilities and the 3 measures of social vulnerability ................................................................................. 36 Table 3. OLS Regression ..................................................................................................... 38
iv

LIST OF FIGURES
Figure 1. Location of Outpatient Child and Adolescent Mental Health Facilities ............. 28
Figure 2. Percent African American in Orleans Parish Block Groups ............................... 30
Figure 3. Percent Poverty in Orleans Parish Block Groups ................................................. 32 Figure 4. Percent Female-Headed Households with Children Under 18 Years Old in Orleans Parish Block Groups ............................................................................................................ 34
v

ABSTRACT
Socially vulnerable populations are more susceptible to the impacts of natural disasters
than other groups. An aspect of social vulnerability is lack of access to resources following a
disaster. Distance is one barrier that prevents socially vulnerable populations from accessing
services. Using 2000 U.S. Census Bureau data and current outpatient child and adolescent mental
health facilities in post-Katrina Orleans Parish, Louisiana, this thesis seek to understand if those
facilities are located farther from block groups with higher percentages of demographically
disadvantaged residents than from block groups with lower percentages of demographically
disadvantaged residents. Block group demographic disadvantage is defined in terms of the
percent of residents who are African American, the percent of individuals living in poverty, and
the percent of households headed by females with children under 18 years old.
The sample had 483 block groups in Orleans Parish. Pearson’s r and OLS regression
were run comparing linear distance (dependent variable) with the independent variables of
percent African American, percent poverty, and percent female-headed households with children
under 18 years old. In the bivariate analysis, percent African American and female-headed
households were not significantly correlated with linear distance. Percent poverty had a
significant negative correlation with linear distance. While the negative association between
poverty and distance remained in the in the multivariate analysis, percent African American and
percent female-headed were positively correlated, as predicted.
ArcGIS was used to create maps showing the percent African American, poor, and
female-headed households in Orleans Parish. The location of the outpatient child and adolescent
mental health services were mapped out as well. Analyzing the locations of these facilities
showed that there is a lack of facilities in the east of Orleans Parish.
vi

vii
Policy planners should consider alternative approaches to providing mental health care for
children and adolescents that may reside in non-poor areas with large percentages of African
American. Current locations should be maintained since they are near the poorest block groups
in the parish. More study is needed for understanding why distance becomes significant for block
groups with higher percentages African American or female-headed households with children
under 18 years old.

CHAPTER 1
INTRODUCTION
Disasters have a tendency to magnify prevailing economic, social, and political processes
in their wake (Kates, 1977). The long-term recovery following a disaster tends to be very
difficult for the populations that are more vulnerable to disasters and hazards because their
resiliency depends not only on individual factors, but also on the infrastructure available to
support recovery (Wisner, Blaikie, Cannon, & Davis, 2004). The infrastructure that enables
recovery can be assistance programs that help people cope by supplying basic needs easily
obtained pre-disaster, and can include long-term assistance programs. The theory of social
vulnerability explains socially created vulnerabilities to natural disasters and hazards due to
adverse socio-economic and political factors that increase the probability of loss, injury, death,
and the difficulties that occur during the recovery process (Cutter & Emrich, 2006; Drabek,
2007;Wisner et al., 2004). According to this theory, many groups are vulnerable in the context of
a natural disaster. These groups include female-headed households with children, ethnic
minorities, and low-income people (Cutter & Emrich; Drabek, 1986; Elliott & Pais, 2006;
Zakour & Harrell, 2003). Recognition of the importance of social context and related
vulnerabilities is a defining feature of the field of social work and is demonstrated in the person-
in-environment (PIE) system which is used to assess a person’s ability to interact and function in
the living environment (Ashford, LeCroy, & Lortie, 2006).
The person-in-environment (PIE) system was developed by and for social workers to help
assess clients’ social functioning (Ashford et al., 2006). PIE theory views problems faced by
individuals as a part of a complex social dynamic where different aspects of people’s lives have
negative or positive effects on each other. PIE theory categorizes aspects of people’s lives into
social-role problems, environmental problems, mental disorders, and physical disorders (Ashford
1

et al.). According to this system, environmental problems and mental disorders have a link that
can affect each other (Asford et al.). In the case of natural disasters, symptoms of post-traumatic
stress disorder (PTSD) surface as a direct result of the trauma experienced during and after a
disaster (Peacock, Morrow, & Gladwin, 1997). Understanding the interaction of environmental
problems and mental disorders provides insight into obstacles that vulnerable populations face as
a result of disasters.
Since social workers often deal with vulnerable populations in their roles as brokers and
case managers (Minahan & Pincus, 1977), understanding the environmental constraints facing
clients in the wake of a natural disaster is of interest to the field. One such challenge discussed in
the pathways to care literature is access to social services. Pathways to care refer to the different
avenues that a person may use to find treatment for a physical or mental aliment. Examples of
pathways to care include cost of care, location of services, and referrals (Sayal, 2006). For
vulnerable groups, these pathways can also become hindrances to accessing care.Therefore,
helping clients access resources often requires social workers to remove barriers clients face
along their pathways to care.
Several common barriers that disadvantaged groups face are transportation, lack of
childcare, lack of knowledge, and a lack of people that can provide services (Steele, Dewa, &
Lee, 2007). Also, the location or placement of social service organizations have an impact on
low-income people being able to access the services (Coulton, 2005). In the context of a disaster,
new barriers emerge, such as changes in location or elimination of social services.
In the wake of Hurricane Katrina, prevalence of adult mental illness increased in
metropolitan New Orleans (Kessler, Galea, Jones, & Parker, 2006). While no current data are
available enumerating the increases of child and adolescent mental illness in Orleans Parish post
Hurricane Katrina, an increase in mental health problems in children and adolescents can be
2

inferred, since past research has found that mental illnesses in children and adolescents increase
following natural disasters elsewhere (Drabek & Key 1986; Thienkrua et al., 2004). One reason
for the increase in mental health problems is because children and adolescents need help coping
with the stressors following a natural disaster (Ashford et al., 2006). Children and adolescents
are less likely to have developed coping strategies than adults (Abramson & Garfield, 2006), and
they need more assistance identifying the need for and accessing mental health services (Sayal,
2006).
Distance is one type of barrier that can provide obstacles in obtaining services because of
problems with transportation, scheduling, and tolerance (Dear, 1977; Steele et al. 2007). This
research aims to increase our understanding about disparities in post-disaster service accessibility
faced by individuals living in communities characterized as vulnerable. Specifically, it asks if
children living in poor, predominately African American neighborhoods with large percentages
of female-headed households face the barrier of distance to outpatient child and adolescent
mental health services more than those living in wealthier, predominantly white neighborhoods
with fewer female headed households.
The unit of analysis is the block group. This thesis uses block group demographic data
from the 2000 decennial U. S. Census to identify the percent of African American individuals,
poor individuals, and female-headed households in each Orleans Parish block group. The street
addresses of outpatient children and adolescent mental health services came from the Louisiana
Office of Mental Health website's list of Facilities and Clinics and the City of New Orleans
website (City of New Orleans, n.d.; Louisiana Department of Health and Hospitals, n.d.). These
institutional addresses are used for mapping purposes and to compute distance measure
In this research, linear distance from a central point within block groups to the nearest child
and adolescent outpatient mental health services is the dependent variable. The independent
3

variables are percentage African Americans, percentage poor, and percentage female-headed
household with children under 18 years old. These characteristics were selected because prior
research identified them as having susceptibility to natural disasters and poor disaster recovery
(Drabek & Key, 1986; Cutter, Boruff, & Shirley, 2003; Cutter & Emrich, 2006; Wisner et al.,
2004; Zakour & Harrell, 2003).
Chapter 2 summarizes related literature and explains the rationale for this research on
distance as a barrier to accessing child and adolescent mental health services in post-Katrina
Orleans Parish. The literature review covers the theory of social vulnerability, PIE, service
barriers in general, barriers to mental health services faced by children and adolescents in urban
areas, barriers following disasters, and, specifically, the mental health service context of Orleans
Parish. Finally, it explains the role of Geographic Information System (GIS) in studying access
barriers, and its role in social work.
Chapter 3 explains the research methodology including variable definitions and identifies
the child and adolescent mental health facilities used in this research and the rationale for their
selection. It explains how and why univariate, bivariate, and multivariate statistics were used.
Furthermore, this chapter explains how maps were created and the purpose of the maps.
Chapter 4 provides the results from the univariate, the bivariate, and multivariate statistical
analyses undertaken. It also provides the maps generated for this research and discusses findings
related to the maps and statistical analyses. It presents discussion of the results from the previous
chapter. It will also discuss the results and if they support the hypothesis.
Chapter 5 explains the implications and conclusion of this research. This includes how the
research contributes to theory, policy and practice. It will also include implications for future
research and limitation of this research.
4

CHAPTER 2
REVIEW OF LITERATURE
The literature review provides the rationale for the distance as vulnerability hypothesis by
summarizing relevant research about the theory of social vulnerability, service barriers in
general, barriers to mental health services, barriers to mental health services faced by children
and adolescents in urban areas, barriers following disasters, and, specifically, the mental health
service context of Orleans Parish. It then explains the role of Geographic Information System
(GIS) technology in the field of social work and, specifically, in studying service access.
Social Vulnerability
The theory of social vulnerability is a concept that has stemmed from a variety of fields in
the natural and social sciences (Cutter & Emrich, 2006). Research on social vulnerability studies
populations, the damage caused to vulnerable populations, and their abilities to recover from
natural disasters, rather than exclusively focusing on the physical damage following natural
disasters. According to previous studies, the root causes of social vulnerability to natural disaster
are economic, demographic, and political processes, which have systemic inequalities that affect
resource allocation and distribution to different groups (Bankoff, 2003; Cutter & Emrich; Wisner
et al., 2004). Within the theory of social vulnerability there are two types of inequalities- social
and place (Cutter & Emrich). Place inequalities are characterized by communities and built
locations, such as “level of urbanization, growth rates, and economic vitality that contribute to
social vulnerabilities” (Cutter, Boruff, & Shirley, 2003, p. 243). The social inequalities shape the
susceptibility of various groups to harm and the ability to recover (Cutter et al., 2003). In other
words, those communities and areas that are in poor social and physical conditions pre-disaster
will continue to be disadvantaged after a disaster because reconstruction will attempt to rebuild
the infrastructure in accordance with the pre-disaster status quo and not take strides to a more
5

socially equitable community (Cutter & Emrich). Previous studies have shown that resources
(e.g. funds, services, volunteer help) disproportionately go to those that are not considered
vulnerable pre-storm because of power relations (Bankoff; Cutter et al.; Drabek, 1986; Peacock,
Morrow, & Gladwin, 1997; Wisner et al., 2004).
Cutter et al. (2003) define the three main tenets of social vulnerability research as (a) “the
identification of conditions that make people or places vulnerable to extreme natural events, an
exposure model,” (b) “the assumption that vulnerability is a social condition, a measure of
societal resistance or resilience to hazards,” and 3) integrates “of potential exposures and societal
resilience with a specific focus on particular places or regions” (pp. 242-243). Orleans Parish
pre-Katrina was observed as an area that was becoming increasingly susceptible to a “natural
disaster that would cost hundreds of billions of dollars and probably take thousands of lives”
(Wisner et al., 2004, p. 248). The basis for this conclusion is the lack of natural coastal barriers,
depletion of silt without replenishment, low sea level, and demographic growth (Wisner et al).
In addition to place vulnerabilities, Cutoff and Emrich (2006) found that compared to
other coastal areas affected by Hurricane Katrina, Orleans Parish was more socially vulnerable
than any other parish/county in Louisiana, Mississippi, or Alabama. Cutoff and Emrich used the
Social Vulnerability Index (SoVI) to determine the levels of vulnerability per parish at the census
tract level. SoVI is a predictive model that utilizes a subset of forty-two socio-economic,
demographic, and built environment variables that encapsulates factors and characteristics of
past research on disaster vulnerability (Cutter &Emrich). The variables were gathered at the
census tract level from 1960 to 2000 at decadal intervals for all the coastal parishes/counties
affected by Hurricane Katrina in Louisiana, Mississippi, and Alabama. Using factor analysis and
applying the variables to each decade beginning in 1960, a smaller set of independent factors
were found that accounted for the majority of the overall variance (Cutter & Emrich). From there
6

eleven to twelve components were “assigned a general socioeconomic or demographic title based
on which factors loaded highest on each component” (Cutter &Emrich, p. 107). These eleven to
twelve composite factors explained 74 to78 % of the total variation in social vulnerability among
the counties/parishes over five decades (Cutter & Emrich). Furthermore, the three primary
contributing factors for social vulnerability in Orleans Parish were race, gender, and class (Cutter
& Emrich).
In social work, the person-in-environment (PIE) system utilizes four factors to describe a
client’s problem. The four factors are (a) “social-role problem,” (b) “environmental problems,”
(c) “mental disorders,” and (d) “physical disorders” (Ashford, LeCroy, & Lortie, 2006, p.25).
Comprehension that all the factors are interconnected and can have effects on one another, either
negative or positive, is important. For example, natural disasters cause environmental problems
by destruction of homes, property, etc. The lack of home and property, feelings of frustration,
and fear about not knowing how to obtain assistance are stressful. Thus, access to help with
coping becomes important (Drabek, 1986). Moreover, the destruction and the violence of the
storm can cause trauma, which may lead to the mental disorder post-traumatic stress disorder
(PTSD) (Peacock et al. 1997). This can also cause difficulty coping with the situation post-
disaster. Barriers to care that prevent individuals from accessing the help they need represent
another link between environmental problems and mental disorders.
General Social Service Barriers
The types of barriers to services faced by clients along their pathways to care include,
acceptability, availability, and accessibility (Steele et al., 2007). Steele et al.’s description of
acceptability as a barrier includes people preferring to manage problems themselves, believing
outside services will not help, fear of stigmas, or language barriers for people who do not speak
fluent English. Availability as a barrier is a lack of services or people that can provide the desired
7

service or long waits for services. Accessibility as a barrier includes situations where
transportation, lack of childcare, or cost of care prevents someone from receiving
services.(Steele et al.). Research demonstrates that the presence and/or importance of each type
of barrier vary depending on the group being studied or the type of service being accessed
(Steele et al.).
Furthermore, one barrier can create another type of barrier. For example, Luo and Wang
(2002) studied accessibility to health care facilities. A shortage of physicians in impoverished
urban communities provided a greater distance travel in order to utilize health care services (Luo
& Wang). Yet, the lack of health services in an area first denotes an availability barrier.
Therefore, to acquire services people search outside of their area. This is when accessibility as a
barrier can become an issue, when the group accepts the fact that they need health services and
must search for the needed help. For many areas at the census tract level not having a car
provided an unrealistic travel distance to receive health care services and would also mean
increased travel time if using public transportation (Luo & Wang).
Also, the placement of social service organizations can have an impact on the accessibility
vulnerable populations trying to acquire the services needed (Coulton, 2005; Drabek, 1986).
Many social service organizations exist to provide services for those that need them but cannot
afford them, and quality services are often located far from those that have fewer resources
(Coulton, 2005).
Mental Health Service Barriers
Research on mental health service access reveals that it is a complex issue. For example,
Steele et al. (2007) assessed adults with an anxiety or affective disorder, and whether or not they
pursued or received mental health treatment for their disorder. The researchers controlled for
potential confounding variables such as level of education, living arrangements, and income.
8

They categorized the barriers to mental health services in the dimensions noted above:
acceptability, availability, and accessibility. Steele et al. found that acceptability was the most
common reason found for low-income people not acquiring mental health services (Steele et al.).
On the other hand, Chow, Jaffee, and Snowden (2003) found what could be described as
availability is more of a problem for acquiring mental health service. They found that poor areas
that have a high proportion of minority residents often are unable to have the resources needed to
maintain a minimal community service (Chow, Jaffee, & Snowden, 2003). The lack of services
in these majority minority areas increases mental health problems in these communities because
of feelings of neglect and mental illnesses that continue without treatment become exacerbated
(Chow et al., 2004). Both studies point to issues that are pervasive and problematic to fully
resolve, and shows the complexity faced in providing and acquiring mental health services.
Understanding mental health service barriers faced by African Americans is of particular
concern since this population has been neglected, and misdiagnosed, has an over reliance on
medication, and experiences disparities in service utilization and access (Chow et. al, 2004;
Lawson, Helpler, Holladay, & Cuffell, 1994; Zito, Safer, dosReis, & Riddle, 1998). Racial and
ethnic disparities in the accessibility, availability, and quality of mental health services in the
United States are evidence of barriers to these services (U.S. Department of Health and Human
Services [DHHS], 2001). Following the Surgeon General’s first report exclusively concerning
mental health, a supplemental report was created to observe in depth the disparity in mental
health services for minorities. The Surgeon General’s Supplemental Report states that most
minority groups are less likely to access mental health facilities and have poorer quality mental
health care than whites; even though they have similar mental health disorders (DHHS, 2001).
Furthermore, African American disparities in access to mental health services occurred within
high poverty and low poverty neighborhoods (Chow et al.). African Americans living in high
9
poverty neighborhoods mainly used emergency services because of a lack of available services
(Chow et al.), which is an availability barrier.
Child and Adolescent Mental Health Service Barriers
Children and adolescents also face barriers to mental health services that exceed those
faced by adults. Recently, Belfar (2008) found that globally, 20% of children and adolescents
suffer from a disabling mental illness, and that there are availability barriers in services due to a
lack of funds, poor policies, and lack of qualified mental health professionals (Belfar). Similarly,
nearly a decade earlier, the U.S. Surgeon General's first report focusing exclusively on mental
health in the United States concluded that there are large numbers of children with mental health
problems but few mental health services to fill the need (U.S. Department of Health and Human
Services [DHHS], 1999). Availability of services is one type of barrier that children and
adolescents face, but another type barrier is accessibility. The U.S. Surgeon General’s report also
found that one of the immediate problems for children in need of mental health services is that
they rely on adults (i.e. their parents and/or teachers) to identify the problem and take appropriate
steps towards initiating care (DHHS, 1999).
Parents initiating care is the beginning of the process of the pathway to care for children.
Sayal (2006) defines the pathway to care for children as (a) parental perception of problem, (b)
primary care use, (c) management in primary care, and (d) Specialist Health Service Use. In
contrast, an adult can skip the first three and seek professional help without the need of
intervening entities. However, children are dependent on more factors beyond their control.
General Practitioners (GPs) are often the initial pathway for children to acquire some
assistance for a mental health problem; however, this is inadequate in promoting a continuum of
mental healthcare for children and adolescents (Sayal, 2006). Harpaz-Rotem, Leslie, and
Rosenheck (2004) found that a continuum of mental health service would occur for children if
10
the service was conducted by a mental health professional. The study recognized the role that a
GP initially plays in helping, but found that a mental health professional is needed in order for a
continuation of care to prevail (Harpaz-Rotem et al., 2004). Furthermore, the rate at which the
primary care practitioners are able to properly recognize a mental health disorder is low, which
lays the foundation for a complicated path for children to receive mental health services (Sayal,
2006). Similarly, Chow et al.'s (2003) findings that African American’s primary means of mental
health services are though emergency services. It is through these services that they would
encounter a physician who would initiate their mental health care. Utilizing emergency care
services may result in a temporary relief of mental health problems, but they will not access a
continuum of care or will receive a referral for an involuntary inpatient care facility.
Barriers to Services Following Disaster
The inability to obtain needed services by vulnerable populations can be exacerbated by a
disaster. People that live in low-income areas have less ability to obtain relief sources and may
be socially isolated from needed relief services (Zakour, 1996). Following a disaster networks
are strained and the barriers of acceptability, accessibility, and availability intensify (Mileti,
1999). In terms of availability, Zakour and Harrel (2003) found that poor inner-city areas lack
resources and have atrophied resources following a disaster; however, the lack of resources pre-
dates disasters (Cutter &Emrich, 2006). Lacking the resources to rebuild the physical
environment (i.e. housing, levees) has a direct relationship with building the social environment
for communities to emerge after the wake of a disaster (Brunsma, Overfelt, & Picou, 2007;
Cutter et al., 2003). Areas that had more wealth pre-disaster have less difficulty in acquiring
resources for recovery, thus services are more inclined to be provided in areas that have an
established client base (Brunsma et al., 2007).
11

Zakour and Harrell (2003) found that metropolitan areas densely populated by block
groups of African Americans are most susceptible to natural disasters and are the "least served
by a network of disaster-relevant organizations" (p.40). Further disadvantaged are block groups
of African American women with children under five since they have the fewest organizations
that serve them (Zakour & Harrell). This study focused on 67 organizations that had formal
disaster relief training and an additional 25 organizations, which were willing to provide disaster
relief services but did not have formal disaster relief functions. Using 1990 U.S. Census block
groups, updated through a trend analysis to 1998, maps were created, and analyses on three
particular variables were calculated, a) percentage of African Americans, b) percentage of the
population over 75 years of age, and c) percentage of households which are female-headed and
include children under 5 years of age (Zakour& Harrell, p. 39).
Contributing to the disaster-related disadvantages are the power and wealth differences
between poor inner-cities and more affluent suburbs (Hartman & Squires, 2006). The absence of
connections with those of socio-political power and wealth puts at a disadvantage poor inner city
residents who lack social services (Zakour & Harrell). Illustrating such disadvantages, social
service relief difficulties in Orleans parish after hurricane Katrina began in the immediate
aftermath of the storm and has continued in the days, and now years that followed. Of specific
interest here is the mental health network, which has been slow to rebuild (Tell Me More, 2007).
Mental Health Crisis in Orleans Parish
Hurricane Katrina had a devastating effect on South Louisiana and its mental health system
further complicating pathways to mental health services. This is of particular concern since
children are not often taught coping skills to deal with the anxieties of a traumatic event such as a
major disaster (Drabek, 1986) and behavioral disorders in children increase after a disaster
(Brunsma et al., 2007). Although there are no studies on child and adolescent mental health post-
12

Katrina and its long-term effects, a report was released concerning survivors of the tsunami in
southern Thailand (Thienkrua et al., 2004). The tsunami had similar characteristics as Hurricane
Katrina, in that both had uncontrollable flooding, fear of drowning, loss of homes, and separation
of families. Surveys of both children and adults were taken two and nine months after the
tsunami. It found that children and adults had similar levels of Post-Traumatic Stress Disorder
(PTSD) based on geographic region (Thienkrua et al.). With the similarities of events, there may
be a similar mental health occurrence taking place in Orleans Parish with children and
adolescents.
The mental health service system in New Orleans prior to the storm was extensive but
faced challenges. New Orleans was the main location where people were sent from throughout
Louisiana for treatment of serious mental health problems. Even then the mental health system in
the city lacked sufficient funding according to Dr. Kathleen Crapanzano, Director of Louisiana
Office of Mental Health (Tell Me More, 2007). Now the mental health situation in New Orleans
post-Hurricane Katrina is dire. Currently, the city lacks both facilities and the skilled
professionals needed to provide services (Brunsma, Overfelt, & Picou, 2007). Furthermore, the
private sector has not responded sufficiently to the mental health needs of the city's residents in
part due to the high uninsured rate (Tell Me More, 2007). Without insurance it is difficult for
private sector mental health providers to get reimbursed for services and people cannot afford
services out-of-pocket (Tell Me More, 2007).
Currently, the demand for mental health services in the city greatly overwhelms supply.
While the number of facilities has declined post-Katrina, the number of people with mental
illnesses more than doubled (Kessler et al., 2006). A study of 1,043 adult survivors of Hurricane
Katrina living in areas deemed eligible for assistance by the Federal Emergency and
Management Agency (FEMA)found that 73.9% had one or more chronic illnesses, including
13

psychiatric problems in the year before Katrina (Kessler, 2007). Of those with a chronic illness,
21.3% either cut back treatment or ceased receiving treatment after the storm. Problems in
accessing physicians and transportation were noted by these survivors as reasons for treatment
reduction or termination (Kessler, 2007). While no research has been done on children in the
area, these findings justify cause for concern.
GIS and Social Work
The research literature identifies numerous barriers to mental health services for
disadvantaged populations. One useful categorized of barriers separates those related to services
accessibility, acceptability and availability barriers (Steele et al., 2007). Several of the studies
noted above report that distance from services and transportation to services are barriers for
different groups of people (Coulton, 2005; Sayal, 2006; Steele et al., 2007; Zakour, 1996;
Zakour& Harrell, 2003). Geographic Information Systems (GIS) can help understand such
spatial relationships. GIS are computer software programs that develop maps to conduct
research, and provide visual representation to the research. GIS helps by capturing, storing,
manipulating, analyzing, displaying, and integrating spatial and non-spatial information
(Maguire, 1991). Social science professions such as geography, sociology, geology, and urban
planning mostly utilize GIS (Hillier, 2007). While social workers have traditionally overlooked
the influences of proximity and distance for the well being of the community, a number of recent
examples in social work literature demonstrate the growing relevance of spatial analysis
(Coulton, 2005; Zakour, 1996).
In fact, the fit of GIS in social work's theoretical traditions is quite natural. As previously
mentioned, at the heart of social work is the idea of person-in-environment, and GIS helps look
at the role of the environment and the spatial relation it has on human behavior (Hillier, 2007).
Information about family and households can be integrated with information concerning the
14

community to produce a map visually depicting the relationships among these factors. GIS can
depict many different spatial relations, such as person or group proximity to social service
agencies or to hazardous conditions (Hillier, 2007). These elements have direct effects on
people’s lives and give social workers another picture of a person in his or her environment.
GIS can also help agencies better understand the needs of clients. Human service
organizations typically derive a service area within a radius of the physical location of the
institution (Bielefeld, Murdoch, & Waddell, 1997). The perspective of an organization being the
focal point from which to judge the communities and areas it serves can provide an erroneous
result. An organization could optimize its work by locating near the population at-risk and using
the population's ability to get to the services as the determining factor for main organizational
and satellite locations. In addition to documenting a need GIS can document where the need is to
inform policy decisions and intervention strategies (Hillier, 2007). Such visual representations
help punctuate ideas displayed through numbers and graphs.
Research from the field of geography done decades ago illustrates how location relates to
mental health service access. Dear (1977) researched the location of mental health facilities in
Lancaster County Pennsylvania. He was interested in the relative importance of location in
determining mental health utilization. The study found that people traveled a mean distance of
seven miles from residence to service. The mean distance for the white population to travel was
7.3; whereas, the African American population had a shorter mean distance of 2.3 miles to travel
to services. However, the majority of mental health facilities are located in Lancaster City where
it has a 40% minority rate, and the individuals that the study covered were those that were able to
access the facilities (Dear, 1977). A limitation to the study was that only 10% (N=106) of the
study sample were African American, but there were roughly 60,000 African Americans that
lived in Lancaster County during the time of the study. The study also examined the tolerance, or
15

ease of overcoming distance from residence to services, and distances traveled to the mental
health facilities. Dear (1977) found that the white population did not consider distance to inhibit
utilization of the mental health facilities. Conversely, the African American population did have
a problem with the distance to travel to a mental health facility and found it to be an inhibiting
factor in acquiring services. Dear (1977) concluded that the African American population had
more difficulty because of transportation to the facilities.
Thus, the literature reveals that barriers to services are characterized in terms of
accessibility, acceptability, and availability (Chow et al., 2003; Steele et al., 2007). African
Americans, people living in poverty, and female-headed households have difficulty accessing
mental health services, and a common reason is distance. Children have more barriers because of
the reliance on others to identify a need for mental health services. GIS can provide a visual
representation of location, distance, and other environmental factors that hinder these groups
from receiving mental health services. Moreover, Orleans Parish has an increase in mental health
problems, but is dealing with a shortage of service providers (Tell Me More, 2007).
Vulnerable populations face numerous barriers to services based on accessibility. For
example, areas that are densely populated by African Americans and female-headed households
with children under 5 years of age are most at risk of a lack of access to services in disasters
(Zakour & Harrell 2003). Moreover, the minority populations find it more difficult to travel
greater distances from their residence to mental health services (Dear, 1977).
Given the tendency of vulnerable populations to face service accessibility barriers
combined with the dire condition of the mental health service system of post-Katrina New
Orleans, concern about the extent to which vulnerable populations have access to child and
adolescent mental health services is understandable. In this thesis I assess whether and to what
extent areas of the city characterized by disadvantage face one mental health service accessibility
16

barrier (distance) in comparison to more advantaged areas. Three specific hypotheses are
derived from this general research question:
• H1. Block groups with higher percentages of African Americans are located
farther from outpatient children and adolescent mental health facilities than block
groups with fewer African Americans.
• H2. Block groups that have higher individual poverty rates are located farther
from outpatient children and adolescent mental health facilities than areas with
lower poverty rates.
• H3. Block groups with higher percentages of female-headed households with
children less than 18 years old are located farther from outpatient children and
adolescent mental health facilities than block groups with fewer female-headed
households with children less than 18 years old.
17

CHAPTER 3
METHODS
Measurement
Population and Unit of Analysis
This study assesses the extent to which pre-Katrina block groups in Orleans Parish
predict availability of the resource of child and adolescent mental health facilities returning to
these block groups after the storm. The unit of analysis is the 2000 U. S. Census Bureau’s block
group. A block group is a cluster of street blocks designated by the U.S. Census Bureau (an
average 39 blocks make up a block group). Block groups generally contain between 600 and
3,000 people, with an optimum size of 1,500 people (U.S. Department of Commerce, 1994.).
This study uses the entire population of block groups in Orleans Parish, not a sample. There are
485 block groups in Orleans Parish; however, two of the block groups have a population of zero.
These block groups were eliminated from the analysis. This leaves an N of 483 for analysis in
this study.
Variable Definitions
The dependent variable in this study is the linear distance in miles between outpatient
child and adolescent mental health facilities, and the center of each block group, which is at the
ratio level of measurement. At the time of this study, there were 7 outpatient facilities in Orleans
Parish that met the criteria to be included in this study. The criteria for inclusion in this study are
that a facility (a) provides outpatient mental health care to children and adolescents (regardless of
whether or not inpatient care is provided), (b) is a public entity, and (c) is located within Orleans
Parish. The information was retrieved from the Louisiana Department of Health and Hospitals
(Louisiana Department of Health and Hospitals, n.d) and the City of New Orleans (City of New
Orleans, n.d) websites. A list of all the facilities and addresses can be found in the appendix.
18

Street address information for each facility was entered into ArcGIS 9.2. ArcGIS 9.2 was used to
compute the linear distance between each block group and the nearest outpatient child and
adolescent mental health facility.
In finding the linear distance from block groups to the nearest outpatient child and
adolescent mental health facility, the block groups were arranged into two different types of
vector data; polygon shapefiles and point shapefiles within ArcGIS 9.2. Polygon and point
shapefiles are geometrical forms. Polygons represent boundaries and are coordinates that have
lines that meet. Points, on the other hand, are single coordinates that are smaller than polygons to
represent a single location (Ormsby, Napoleon, Burke, Groessl, & Feaster, 2001). Orleans parish
and block groups are polygons and the center of the block groups and the child and adolescent
menta health facilites are points. To ensure uniformity in the shapefiles, Universals Transverse
Mercator (UTM) 15 defined the polygon shapefiles and point shapefiles. UTM is a system of
world coordinates that are measured in meters and UTM lines are orthogonal. All UTM grids
divide the globe into narrow longitude zones. UTM 15 was chosen because Orleans Parish is
located within this zone (Ormsby et al.). The block group polygon shapefile was converted into a
point shapefile, which are located in the center of the block group polygon. Distance was
measured using miles from the block group point shapefile to the nearest outpatient child and
adolescent mental health facility street addresses. The mental health facilities are represented as
point shapefiles as well.
The information for the independent variables is obtained from U.S. Decennial Census
STF-3 files (U.S. Census Bureau, 2000). The independent variables are percent African
American living in block group, percent of people living at and below the individual poverty
rate, and percent of households headed by females with children under 18 years old. These
independent variables were chosen because past research has found these groups to have high
19

social vulnerability in the context of natural disasters (Cutter & Emrich, 2006; Wisner et al.,
2004).
The first independent variable is the percent of the population in the block group
identified as African Americans. The U.S. Census Bureau defines black and African American as
people having origins in any of the Black race groups of Africa. It includes people who reported
‘Black, African American, or Negro’ or wrote in entries such as African American, Afro
American, Nigerian, or Haitian” (McKinnon, 2001).
The next independent variable is the block group poverty rate. This rate refers to the
percent of individuals living in block groups whose income falls below the federal poverty
threshold. The poverty threshold used for this paper is the U.S. Census Bureau’s graduated
poverty statistics of annual income thresholds for 2000. The U.S. Census Bureau’s poverty
threshold is calculated using the Orshansky Poverty Thresholds (for historical backgrounds on
development of Orhansky Method see Fisher, 1997). Since1968, the federal poverty threshold
has been calculated by multiplying three times the cost of purchasing food outlined in the U.S.
Department of Agriculture’s economy (most basic) food plan. Families earning below this
amount are considered poor. Following the creation of the poverty threshold in 1968, it is
adjusted in accordance with the Consumer Price Index (CPI). CPI measures the average price of
consumer goods and services purchased by households, and are a measure of inflation
(Anderson, Sweeney, & Williams, 2005).There are 48 poverty thresholds that vary according to
size of the family and ages of family members (Simmons & O’Neill, 2001). If a family’s total
income is less than the poverty threshold, then that family, and every individual in it, is
considered poor. Only monetary income is included in these computations. Food stamps,
regional adjustments for cost of living and seasonal adjustments are not taken into consideration
when determining poverty (Simmons & O’Neill).
20

The third independent variable is percent of households headed by females with children
under 18 years old. The U.S. Census Bureau defines household as including “all the people who
occupy a housing unit as their usual place of residence and a person, or one of the people, in
whose name the home is owned, being bought, or rented. If there is no such person present, any
household member 15 years old and over can serve as the householder for the purposes of the
census” (Woodward & Damon, 2001, p. 2). Female-headed households are those households
where a female provides the main source of income.
Data Analysis
Data analysis in this thesis includes standard descriptive statistics for dependent and
independent variables, descriptive mapping, a bivariate analysis of the relationships among
dependent and independent variables and a multivariate analysis in which all independent
variables predict the dependent variable.
Descriptive Statistics
The mean, standard deviation, and range (minimum and maximum) for the dependent
variable and each of the independent variables were calculated. The first univariate statistic to be
calculated is the mean linear distance (in miles) from each block group to the nearest outpatient
child and adolescent mental health facilities. Following the calculation of the mean linear
distance, the mean percentage for each of the independent variables, percentage African
Americans, percentage poverty rate, and percentage of households headed by females with
children under 18 years old, was calculated. The next analysis calculates the range of the highest
percentage and the lowest percentage for each of the independent variables and the dependent
variable. The final univariate statistic to be computed for all variables was the standard deviation.
21

Descriptive Mapping
Maps were created on ArcGIS 9.2 to illustrate the demographic characteristics of Orleans
Parish block groups and provided a visual reference location of the child and adolescent
outpatient mental health facilities. Four maps were created. The first map provided the names
and locations of all 7 outpatient child and adolescent mental health facilities. The street
addresses of the child and adolescent outpatient mental health facilities that provide mental
health treatment for children and adolescence were geocoded into ArcGIS 9 and plotted on maps.
Geocoding is the process of creating map features with street addresses (Ormsby, et al., 2001).
To do this, a text file with a table of the addresses of each mental health facility was created, and
uploaded to a map that had a street file as a layer on ArcGIS. The geocoding feature was used to
match the addresses from the text table to the street layer to create points on the map that show
the location of the child and adolescent mental health services. Each map is followed with a
written analysis of what is depicted in it.
Map 1 provided the names and locations of all seven children and adolescent outpatient
mental health services in Orleans Parish used in this research. The locations can also be seen in
maps 2, 3, and 4 without the name of the agencies. Maps 2, 3, and 4 provided a visual depiction
of the values each independent variable for each block group. Map 2 presents the block groups
shaded to represent the percentage of African Americans living there. Map 3 presents the block
groups shaded to represent the percentage of poverty. Map 4 presents the block groups shaded to
depict the percentage of female-headed households with children under 18 years old.
To show the distribution of each independent variable, a graduated color scale is utilized.
A graduated color scale helps identify where percentages of independent variables lie in relation
to one another on a continuous scale (Ormsby et al., 2001). A graduated color scale requires that
continuous data be placed in categories to show the distribution on a map. Means and standard
22
deviations were used to create the categories for each independent variable. Category 1 includes
all block groups in which the value of the independent variable falls between one and two
standard deviations above the mean. Block groups that have an independent variable percentage
that exceeds two standard deviations above the mean are included in Category 1 since the
includes very few block groups. Category 2 includes all block groups in which the value of the
independent variable falls between the mean and one standard deviation above the mean.
Category 3 includes all block groups in which the value of the independent variable falls
between the mean and one standard deviation below the mean. Category 4 includes all block
groups in which the value of the independent variable falls between one and two standard
deviations below the mean. Block groups that have an independent variable percentage that
exceeds two standard deviations below the mean are included in Category 4. This process
ensures uniformity for every map. Values associated with each category are included in Chapter
4. Maps are expected to reveal visual patterns in which large numbers of Category 1 block
groups are located further away from facilities that Category 4 block groups for each of the
independent variables of percent African American, percent poverty, and percent female-headed
households with children under 18 years old.
Bivariate Statistics
Pearson’s r was calculated to assess the strength of association between the independent
variables and the dependent variable. Significance was held at p <.05. Positive significant
correlations are expected between each independent variable and the dependent variable. Such
findings would indicate that block groups with more disadvantaged populations face greater
distance barriers that those with more advantaged populations.
23

Multivariate Statistics
Preliminary correlations had unexpected findings which led to an additional multivariate
analysis to further explore these. The poverty rate was negatively and significantly correlated
with linear distance, whereas the other two independent variables were not found to have a
significant correlation with linear distance. The independent variables were also moderately to
strongly correlate with one another. Therefore, it is possible that the unexpected negative
correlation between linear distance and percent poverty had a suppressing effect on the
correlations between percent African Americans and percent female-headed households with
children under 18 years old and the linear distance. Therefore, Ordinary Least Squares (OLS)
regression was run to control for any moderating effects that independent variables have on the
relationship between other independent variables and the dependent variable. OLS was the
appropriate form of regression to use since the dependent and all three independent variables are
at the ratio level of measurement. It is expected that once other independent variables are
controlled positive and significant correlations between percent African American and percent of
households headed by single females and distance from outpatient child and adolescent mental
health facilities will be found indicating that these forms of disadvantage are associated with the
distance service barrier.
24

CHAPTER 4
RESULTS AND DISCUSSION
Results
This chapter reports univariate, bivariate, and multivariate findings assessing the relative
socially vulnerability of Orleans parish block groups and how this relates to the linear distance
from the nearest outpatient child and adolescent mental health facility. It also provides a
descriptive map for each of the three independent variables and the location of all outpatient
child and adolescent mental health facilities.
Descriptive Statistics
The results for descriptive statistics for the dependent variable and three independent
variables are presented in Table 1.
Dependent Variable. On average block groups in Orleans parish are 2.18 miles from the
nearest public child or adolescent mental health facility with a standard deviation nearly as large
(2.05). The closest linear distance to a facility for any block group center is .11 miles while the
farthest is 18.70 miles.
Independent Variables. The percent African American in block groups in the parish range
from 0% to 100%, with a mean of 65.73% and a standard deviation of 34.49%. Of the three
independent variables, percent African American has the highest mean and is the only
independent variable where some block groups have 100% of this demographic feature. All
block groups fall within one standard deviation above the mean and two standard deviations
below the mean.
On average block groups in Orleans Parish have a 28.40% poverty rate, and the poverty
rate in block groups ranges from 0% to 89.07%. However, the standard deviation is 18.23%,
25
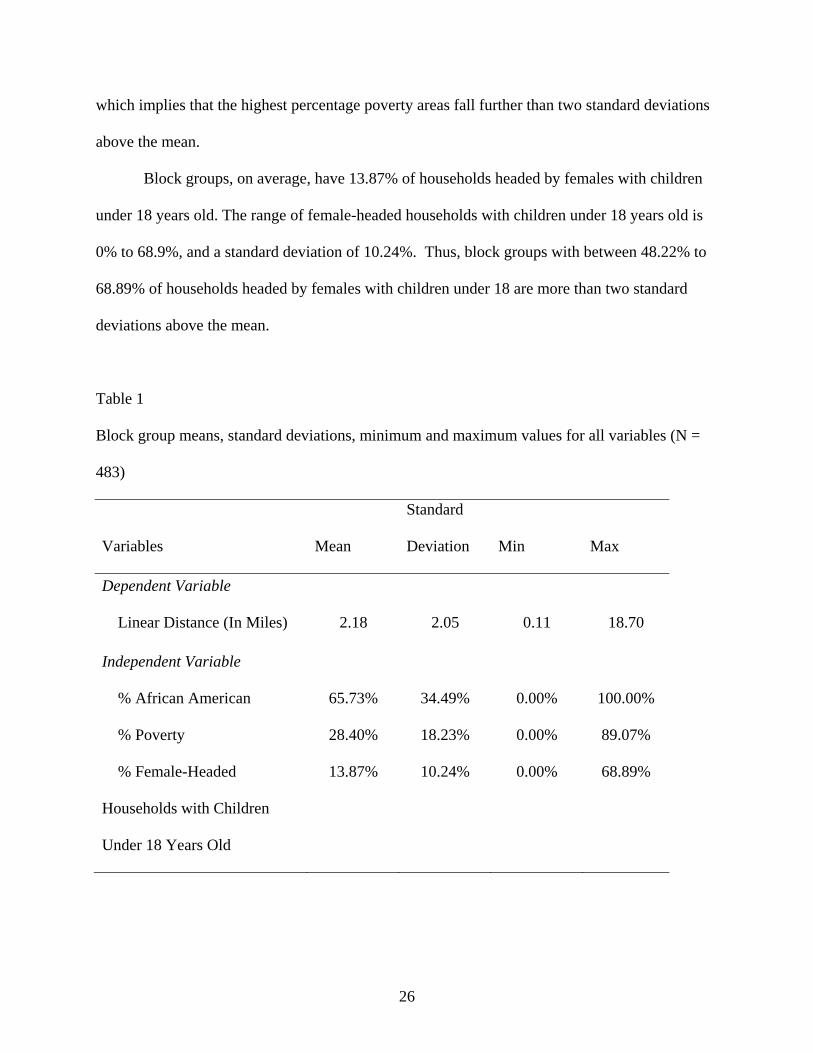
which implies that the highest percentage poverty areas fall further than two standard deviations
above the mean.
Block groups, on average, have 13.87% of households headed by females with children
under 18 years old. The range of female-headed households with children under 18 years old is
0% to 68.9%, and a standard deviation of 10.24%. Thus, block groups with between 48.22% to
68.89% of households headed by females with children under 18 are more than two standard
deviations above the mean.
Table 1
Block group means, standard deviations, minimum and maximum values for all variables (N =
483)
Variables Mean
Standard
Deviation Min Max
Dependent Variable
Linear Distance (In Miles) 2.18 2.05 0.11 18.70
Independent Variable
% African American 65.73% 34.49% 0.00% 100.00%
% Poverty 28.40% 18.23% 0.00% 89.07%
% Female-Headed
Households with Children
Under 18 Years Old
13.87% 10.24% 0.00% 68.89%
26

Descriptive Mapping
The following maps provide visual information on the location of the facilities and the
distribution geographically of the independent variables. Also, the analysis views the block that
the outpatient child and adolescent mental health facilities are located in and the block groups
that have a direct boundary with that block group.
Overall, as can be seen in figure 1, the outpatient child and adolescent mental health
facilities are mostly located in southwest Orleans Parish. Of the locations, New Orleans
Adolescent Hospital and Community Services is the farthest south. Nearby, Milestone Mental
Health Agency is east of New Orleans Adolescent Hospital and Community Services. Family
Care, Inc. is the agency that is farthest east, and is not as closely located in terms of distance to
another agency. The four outpatient mental health facilities, Holistic Concepts, RTC Providers,
Inc., are located near each other. Enhanced Destiny Services and Integrated Family Services are
the nearest with roughly half of a mile from each other.
The next map (Figure 2) shows the location of the mental health facilities in relation to
the percent African American in each block group. There are three categories of percent African
American based on the mean (65.73%) and standard deviation (34.49%). Category 1 (65.73% -
100%) includes all block groups in which percent African American falls between the mean and
one standard deviation above the mean. This category is shaded the darkest. There are 302
block groups in this category. Category 2 (31.24% - 65.72%) contains block groups in which the
percent African American ranges from the mean to one standard deviation below the mean.
There are 72 block groups in this category. Category 3 (0% - 31.23%) is between one standard
deviation below the mean and two standard deviations below the mean. There are 109 block
groups that fall into this category. This category is shaded the lightest. There are only three
27

Figure 1 Location of Outpatient Child and Adolescent Mental Health Facilities in Orleans Parish
Holistic Concepts
Family Care, Inc.
RTC Providers, INC
Milestone Mental Health Agency
Enhanced Destiny Services, LLCIntegrated Family Services, LLC
New Orleans Adolescent Hospital & Community Services
Location of Outpatient Child and Adolescent Mental Health Facilities in
Orleans Parish
0 1 20.5 Miles
Ê
LegendOutpatient Child and Adolescent Mental Health Facilities
Mississippi River
Inner Harbor N
avigation Canal
28

categories for this independent variable because all block groups are accounted for with these
three categories.
The mean, as previously stated, of the independent variable percent African American
was 65.73%, which means in many block groups the population is more than fifty percent
African American. Therefore, block groups that fall into Category 1 are considered having a high
percentage of African Americans. Map 2 shows that six of the seven children and adolescent
outpatient mental health facilities are located within or adjacent to block groups that have high
percentage of African Americans. New Orleans Adolescent Hospital and Community Services is
the located in where the surrounding block groups have low percentages of African Americans.
Of the seven, five are within block groups that have high percentages of African Americans.
New Orleans Adolescent Hospital and Community Services facility is located in a block group
that falls within Category 2 and Milestone Mental Health Agency is located in a block group
within a Category 3 block group low percentage African Americans. Of the 73 block groups east
of the Inner Harbor Navigation Canal, 67 contain more than 65.73% African Americans.
Figure 3 displays the percentage of poverty distributed in Orleans Parish and the location
of the seven mental health facilities. The mean is 28.40% and one standard deviation is 18.23%.
There are 4 categories indicating poverty rates in figure 3. Category 1 (46.64 - 89.07%) includes
block groups between one standard deviation above the mean two standard deviations or more
above the mean. This category includes the block groups with the highest percentage of poverty,
but only 79 block groups fall into this category. Category 2 (28.40% - 46.63%) contains block
groups with poverty rates falling between one and two standard deviations above the mean, and
139 block groups fall within this category. As previously stated, block group poverty rates above
the mean are considered high; therefore, Category 2 contains block groups with high percentage
29

Figure 2 Percent African American in Orleans Parish Block Groups
Inner Harbor N
avigation
London Avenue Canal
Orleans Avenue C
anal
Mississippi River
Gulf Intercoastal Waterway
Lake Pontchartrain
Percent African American in Orleans Parish Block Groups
LegendOrleans Parish Block GroupsPercent African American
0% - 31.24%
31.25% - 65.72%
65.73% - 100%
0 2 41 Miles
Ê
Category 1
Category 3
Category 2
30

of poverty. Category 3 (10.17% - 28.39%) contains 176 block groups with poverty rates
between the mean and one standard deviation below the mean. Category 4 (0% - 10.16%)
includes 88 block groups with poverty rates between one standard deviation below and two
standard deviations below the mean.
On average, block groups in Orleans Parish are poor. However, two facilities, New
Orleans Adolescent Hospital and Community Services and Milestone Mental Health Agency, are
located in block groups that fall within Category 4, which has very low poverty (0%-10.16%). A
cluster of 25 block groups that fall within Category 1, which are areas that have the highest
poverty, are located in central Orleans Parish are near RTC Providers, Enhanced Destiny,
Integrated Family Services, and Holistic Concepts.
Figure 4 displays the percentage of female-headed households with children under 18
years old in Orleans Parish block groups and the location of the seven mental health facilities.
There are four female household headship categories depicted in figure 4. The mean is 13.87%
and standard deviation is 10.24%. Category 1 (24.12% - 68.89%) has the highest percentage of
female-headed households with children under 18 years old. This category includes block groups
between one standard deviation above the mean to two standard deviations above the mean.
Forty block groups are included in this category. Category 1 has the darkest color. Category 2
(13.87% - 24.11%) contains block groups with values between the mean and one standard
deviation above the mean, and 186 block groups fall within this category. As with the previous
two independent variables, block groups that are above the mean are considered high
percentages. Therefore, block groups that are within Categories 1 or 2 have high percentages of
female-headed households with children under 18 years old. Category 3 (3.63%- 13.86%) is
31
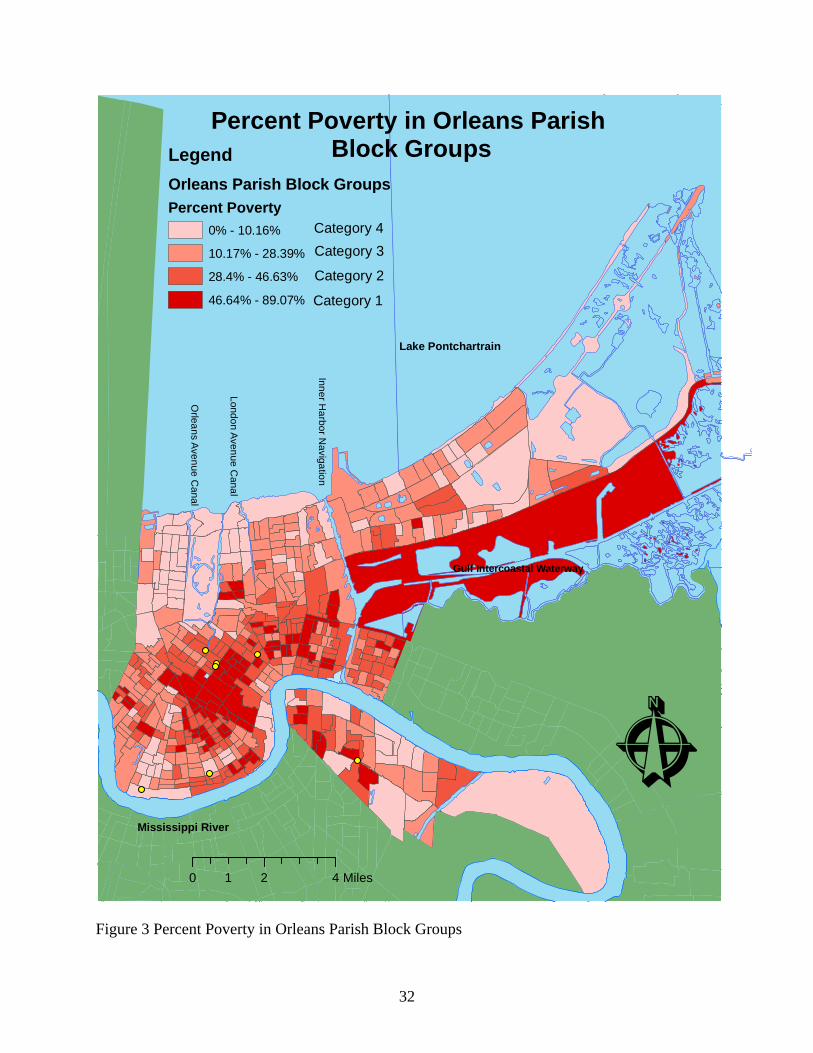
Figure 3 Percent Poverty in Orleans Parish Block Groups
Inner Harbor N
avigation
London Avenue Canal
Orleans Avenue C
anal
Mississippi River
Gulf Intercoastal Waterway
Lake Pontchartrain
Percent Poverty in Orleans Parish Block GroupsLegend
Orleans Parish Block GroupsPercent Poverty
0% - 10.16%
10.17% - 28.39%
28.4% - 46.63%
46.64% - 89.07%
0 2 41 Miles
Ê
Category 1
Category 3
Category 2
Category 4
32

between the mean and one standard deviation below the mean, and the most block groups (196)
fall within this category. Category 4 (0% - 3.62%) is between one standard deviation and two
standard deviations below the mean and there are 51 block groups that are included in this
category.
There are only 47 block groups of the 483 block groups that fall within the highest
percentages of female-headed households with children under 18 years old. RTC Providers,
Enhanced Destiny, Integrated Family Services, and Holistic Concepts are located near block
groups with high percentages of female-headed households with children under 18 years old.
Family Care, Inc. is the only facility that is in a block group that falls into Category 1. New
Orleans Adolescent Hospital and Community Services is adjacent to one block group that falls
into Category 2. In the southwest of Orleans Parish, four block groups are clustered together
which fall within Category 4.
Bivariate Statistics
Pearson's product-moment correlation coefficient was the first statistical test used to test
the hypothesis that block groups with more vulnerable populations are farther away from
outpatient child and adolescent mental health facilities than block groups with less vulnerable
populations. Table 2 provides the correlation coefficients and significance for the dependent
variable (linear distance) and the three independent variables (percent African American, percent
poverty, and percent female-headed household with children under 18 years old).
Percent African American is not significantly correlated with linear distance in miles (r=.15;
p=.07). Therefore, the bivariate analysis leads to a rejection of hypothesis 1: linear distance is
positively associated with percentage African American.
33

Figure 4 Percent Female-Headed Households with Children Under 18 Years Old in Orleans
Parish
Inner Harbor N
avigation
London Avenue Canal
Orleans Avenue C
anal
Mississippi River
Gulf Intercoastal Waterway
Lake Pontchartrain
Percent Female-Headed Households with Children Under 18 Years Old in Orleans Parish Block Groups
LegendOrleans Parish Block GroupsPercent Female-Headed Households with Children Under 18 Years old
0% - 3.62%
3.63% - 13.86%
13.87% - 24.11%
24.12% - 68.89%
0 2 41 Miles
Ê
Category 1
Category 3
Category 2
Category 4
34

There was a significant correlation found between percent poverty and linear distance
(p=.00). However, the strength of association was negative (r=-.28). The higher the poverty rate
in a block group the closer the block group is to an outpatient children and adolescent mental
health facility. Once again, bivariate results call for a rejection of hypothesis 2. In fact, in the
case of poverty the null hypothesis is also rejected since there is an association in the opposite
direction rather than no relationship.
A significant correlation between female headed household with children under 18 years
old and linear distance was not found (r= -.02; n= 483; p= .62). Therefore, looking at the
bivariate association alone, hypothesis 3 is also rejected.
Table 2 also contains correlation coefficients representing the association among
independent variables. All the independent variables have a significant correlation with each
other at p < .01 level. Percent poor and percent female-headed households with children under 18
years old had the strongest association with r= .72. There was also an association between
percent poor and percent African American (r= .59). Also, the strongest association greatest for
percent African American was with percent female-headed households with children under 18
years old with r =.68. All three have near the same strength of association with each other, but
only percent poverty has a significant correlation with the dependent variable of linear distance.
Furthermore, the negative correlation could be interfering with the results of the other
independent variable.
Multivariate Analysis
An Ordinary Least Squares (OLS) Regression was used to assess the effect of each
independent variable on the dependent variable while holding the other independent variables
constant. Thus, the hypotheses can be tested once again taking other block group characteristics
35

Table 2 Correlations of mean block group linear distance from the nearest outpatient child and
adolescent mental health facility and three measures of block group social vulnerability
(N= 483).
Subscale 1 2 3 4
1. Linear Distance
(Miles) ‐‐
2. % African American 0.07 ‐‐
3. % Poverty ‐0.28** 0.59 ‐‐
4. % Female‐Headed
Households with
Children Under 18 Years
Old
0.02 0.68 0.72 ‐‐
**p< .01
into account. In the multivariate analysis, all three independent variables were associated with
distance and these associations were statistically significant. However, the direction of the
relationship is not the same for all independent variables.
At the bivariate level, no relationship was found between linear distance and percent
African American. In contrast, controlling for other measures of social vulnerability a positive
association between percent African American and linear distance was found. Table 3 shows that
when the effect of percent female-headed households with children under 18 years old and
percent poverty on linear distance in each block group is held constant, a one percent increase in
the percent African American population in a block group is associated with a .02 mile increase
36

in distance to the nearest outpatient child or adolescent mental health facility. The strength of
association provides the rationale to reject the null hypothesis associated with hypothesis 1.
In contrast, the independent variable percent poverty was found to be significantly correlated
with linear distance after running both Pearson’s r and OLS regression. When holding constant
the effects of percent African American and percent female-headed household with children
under 18 years old, for every one percent increase in poverty there was a .06 mile decrease in
distance to the nearest outpatient child or adolescent mental health facility. Therefore, those in
poorer block groups are closer to outpatient children and adolescent mental health facilities in
Orleans Parish. Since the association was negative for both analyses, hypothesis 2, that block
groups with higher percentages of poor are further from outpatient child and adolescent mental
health facilities is rejected, as is the null hypothesis.
At the bivariate level, no association was found between percent female-headed
households with children under 18 years and linear distance. On the other hand, the OLS
regression holding percent African American and percent poverty constant revealed a positive,
significant association between percent female-headed households with children under 18 years
and linear distance. For every one percent increase in female headed households with children
under 18 years old in a block group, distance to the nearest child or adolescent outpatient mental
health facility increases by .05 miles. Percent female headed households with children under 18
years old had a stronger positive strength of association with linear distance than percent African
American, thus providing the rationale for rejecting the null hypothesis associated with
hypothesis 3.
Ordinary Linear Square (OLS) regression showed that there was a positive significant
association between the independent variables of percent African American and percent female-
headed households with children under 18 years old, and the dependent variable of linear
37

Table 3 OLS Regression N=483
Variable B SE B Significance
African American 0.02 0.003 .00 **
Poverty -0.07 0.007 .00**
Female Headed Households
with Children Under 18 Years
Old 0.05 0.013 .00**
** p< .01
distance. It also confirmed that linear distance is not a barrier that increases social vulnerability
for those block groups that have high percentages of poverty in Orleans Parish.
Discussion
Social groups that are more susceptible to natural disasters and hazards and their lasting
effects are considered socially vulnerable (Cutter &Emrich, 2006). An aspect of social
vulnerability is the lack of resilience following a natural disaster because of many factors,
including barriers to service access (Wisner et al., 2004). This study assessed whether linear
distance impedes certain groups that are considered socially vulnerable in Orleans Parish from
accessing outpatient mental health facilities in a post-Katrina environment. Results differed
depending on the type of social vulnerability group examined and whether or not other the other
two groups considered socially vulnerable is held constant.
African American
The first group that prior research found to be socially vulnerable following a natural
disaster is African American (Cutter et al., 2003; Drabek, 1986; Peacock, 1997; Zakour&
Harrell, 2003). Although the bivariate analysis reveals no association between linear distance and
percent African American in a block group, a significant positive association emerges when the
38

other independent variables are held constant. This shows that the presence of the other
conditions of social vulnerability masks the relationship between African American and distance.
The multivariate analysis shows that block groups with higher percentages of African Americans
are located farther from outpatient child and adolescent mental health services than block groups
with fewer African Americans in post Katrina Orleans Parish, as hypothesized. This finding is
congruent with past findings that social vulnerability is higher for non-whites. For example,
Cutter et al. (2003) found that non-white and non-Anglo are indicators of an increase of social
vulnerability. Moreover, Cutter and Emrich (2006) found race was one of three factors for
driving social vulnerability in Orleans Parish, thus increasing the difficulty in accessing
resources and recovering after a natural disaster.
In Orleans Parish, block groups in which African Americans comprised more than 65%
of the population accounted for 63% of all the block groups. The map shows the outpatient child
and adolescent mental health facilities are located in the southwest Orleans Parish, and that there
is an absence of facilities in the east and northeast. This is important because as one of the main
findings of the thesis indicates, African Americans have difficulty accessing child and adolescent
mental health facilities, thus creating another difficulty in the ability to recover post-disaster. It is
possible that the lack of facilities in the east may be related to this. Further study is needed to
examine if this is the case.
Poverty
Zakour and Harrell (2003) found that poorer places have less access toservices following
a disaster due to living further from needed services. This study does not find this to be true of
outpatient child and adolescent mental health facilities in Orleans Parish; rather, the block groups
with higher percentages of poverty are closer to these facilities than block groups with lower
poverty rates. This finding is supported visually in the descriptive maps, and in the bivariate and
39

multivariate statistics. The block group map containing poverty and facility location information
reveals that most block groups with high percentages of poverty are located in southwest Orleans
Parish as are most mental health facilities. More conclusive evidence comes from the statistical
tests of Pearson’s r and OLS regression. Block groups with higher percentages of poverty had a
linear distance that was closer to child and adolescent mental health facilities than those with
lower percentages of poverty. According to bivariate correlations (r= -.28) and multivariate OLS
regression (b=-.07), distance to outpatient child and adolescent mental health facilities is not a
factor creating social vulnerability of these groups to recover following a Hurricane Katrina
whether or not other block group demographics are taken into consideration. In fact, it is an asset
whereby poor areas have a proximal access to these facilities.
Female-Headed Households with Children Under 18 Years Old
The final hypothesis states that block groups with higher percentages of female-headed
households with children under 18 years old are farther away from mental health facilities than
block groups with fewer such households. The correlation with female-headed households with
children under 18 years old and linear distance revealed no association between the two, but the
OLS regression did show a significant positive association when the other independent variables
were held constant. Cutter and Emrich (2006) found that gender is a factor in driving social
vulnerability. When discussing gender in terms of disaster recovery, women are considered more
socially vulnerable often due to lower wages and family care responsibilities (Wisner et al.,
2004).
The map shows that half of the block groups that have a high percentage, the mean and
above, of female-headed households with children under 18 years old are located in the east and
northeast. There are no outpatient child and adolescent mental health facilities located in these
areas of the parish. In the southwest, aside from ten block groups that fall into the highest
40

category the majority of the block groups fall into the low to middle percent categories.
However, the southwest is the location of the majority of outpatient child and adolescent mental
health facilities.
41

CHAPTER 5
IMPLICATIONS AND CONCLUSION
Implications
The profession of social work seeks to understand “resources and interactions between
people and the social environment” (Minhan & Pincus, 1977, p. 147). When resources exist,
linkage to the resources may be absent (Minhan & Pincus). Conceptually, social workers help
develop resources, assist in linking people with resources, facilitate networks of resources to
improve effectiveness, and help individuals develop their own internal coping strategies (Minahn
& Pincus). Socially vulnerable groups post-disaster lack resources that enable them to cope with
a disaster and rebuild their lives after a disaster (Wisner, et al., 2004). Person-in-environment
theory asserts that an environmental disturbance impacts all areas of people’s lives, including
mental health (Ashford et al. 2007). Therefore, based on Minhan and Pincus’s concept and
person-in-environment, socially vulnerable groups are a concern for social workers because they
understand the dynamics of social vulnerability and its impact on people’s lives. Social workers
also help link people to resources that enable self-determination.
The three demographic independent variables chosen for the current study (percent
African American, percent poverty, and percent female-headed households with children under
18 years old) are based on past research about social vulnerability, which shows that in instances
of natural disasters there some groups lack of available resources to help people cope and rebuild
their homes and lives more than other groups. This is the case even though vulnerable
populations may not be as near to the physical disaster as other groups. The likelihood for the
effects of a disaster to be compounded by a lack of a sustaining infrastructure is a problem faced
by socially vulnerable groups (Cutter & Emrich). Available mental health service can help those
42

affected by a natural disaster build a foundation for coping with the disaster and minimize its
effect on the rest of a person’s life (Drabek, 1986).
This current research expected to find that all indicators of vulnerability would be
correlated with greater distance. What was found was that the indicators of vulnerability had
different relationships with distance. The relationship between distance and two indicators,
percent African American and percents female-headed household with children under 18 years
old, were masked unless each of the other indicators were controlled. Moreover, percent poverty
was negatively correlated with distance at the bivariate and multivariate levels.
The first socially vulnerable block group attribute addressed in this study was percentage
of African Americans located in a block group. Cutter and Emrich’s (2006) research on social
vulnerability over time found that race, specifically African Americans, is an indicator of
vulnerable to disasters in Orleans Parish. This current study found that when holding constant the
other two indicators of social vulnerability poverty and female-headed households, block groups
with more African Americans were in fact located further from outpatient child and adolescent
mental health facilities in Orleans Parish than block groups with fewer of this group. However,
when these other social vulnerability characteristics were not considered a correlation was not
found. This shows congruence with Cutter and Emrich’s findings as long as this characteristic is
disentangled from social vulnerability indicators.
The second block group characteristic assessed in the analysis was the poverty rate.
Block groups with higher percentage poverty were not found to be farther from outpatient child
and adolescent mental health facilities. In fact, block groups with higher percentage of poverty
were closer to outpatient child and adolescent mental health facilities than those with less
poverty. This is inconsistent with past findings related to social vulnerability indicator that says
that poverty is an indicator of social vulnerability and have problems post-disasters (Cutter &
43

Emrich, 2006; Cutter et al. 2003; Peacock et al., 1997). Moreover, these facilities are located in
the correct places for block groups with high percentages of poverty.
The third socially vulnerable block group attribute addressed in this study was percentage
of female-headed households with children less than 18 years old are farther from child and
adolescent outpatient mental health services than those with less. Cutter et al. (2003) found that
females are more socially vulnerable due to problems such as lower wages. Zakour and Harrell
(2003) found that block groups with women with children under 5 were least likely to have
access to resources following a disaster. The current research found that block groups with
higher percentage of female-headed households were farther from outpatient child and
adolescent mental health facilities than block group that had less in Orleans Parish when the
other two independent variables were held constant. The distance to travel increases the
difficulty of female-headed households with children under 18 years old to recover after a
disaster, thus increasing social vulnerability. Moreover, the distance increased more for percent
female-headed households with children under 18 years old than percent African American for
every one percent increase in the block group. When percent female-headed households with
children under 18 were not considered apart for the other social vulnerability indicators, no
association was found.
Maps were included in this study to provide a visual and spatial understanding of the
location of the outpatient child and adolescent mental health facilities. Figure 1 reveals there are
outpatient child and adolescent mental health facilities in central and southwest Orleans Parish.
There is a lack of facilities in the east of Orleans Parish. Furthermore, considering that block
groups with higher percentages of African American and female-headed households are
correlated with distance when each is held constant, placing outpatient child and adolescent
mental health facilities near blocks with both indicators in the east of Orleans Parish should be a
44

consideration. Also another possibility to help socially vulnerable groups with recovery are
mobile units that provide services, such as access to communications, i.e. telephone, internet,
health care, and initial mental health care. This would need further exploration.
Hillier (2007) states that utilization of geographic information systems needs to be
incorporated more into social work research. Although this current study does not make the
mapping a primary focus, it does provide more information and understanding as an addition to
the bivariate and multivariate analysis of the independent variables.
The current research did not find that those living poor areas in Orleans Parish from
experiencing social vulnerability; rather, this study shows that this group has an advantage of
having a closer linear distance to these facilities. There are other ways, which the poor are more
socially vulnerable. Peacock et al. (1997) point to the difficulty for people in poverty to acquire
adequate funds to repair homes or replace items due to bureaucracies. Furthermore, African
Americans and female-headed households may encounter the same difficulties in acquiring
needed resources for recovery. Also, this current research did not study the utilization rate of the
outpatient child and adolescent mental health facilities, which is a limitation of this study.
Although there might be facilities near these block groups with higher percentage of poverty that
does not mean that they are being utilized. Further research is needed.
Conclusion
Vulnerability indicators are a myriad of factors that have been proven to reduce the
ability to recover after a natural disaster (Cutter et al., 2003). African Americans, poverty, and
female-headed households are three types of indicators that have different barriers for recovery.
One barrier that can have an impact is distance, and the distance to outpatient child and
adolescent mental health facility can have an impact on the ability for these groups to recovery.
45

There are limitations to the current research. Even considering distance, the implications
for this are not known. Dear (1977) found that African Americans in Lancaster County,
Pennsylvania were less tolerant of distance than whites, this is not necessarily true for Africans
Americans in Orleans Parish, nor is it known for female-headed households with children under
18 years old. Furthermore, this study did not look at utilization rates. Although block groups with
larger percentages of poverty are located closer to child and adolescent mental health facilities, it
is not know the utilization rate of the better located facilities.
Furthermore, the measure of distance is an approximation. The distance calculated is not
based on streets or routes, rather a linear distance from one point to another. Distance may
become an issue if the distance is actually increased due to streets, or traffic increases the amount
of time.
In sum, as the multivariate analysis shows, block groups with higher percentages of
female-headed households with children under 18 years old and African Americans are further
from outpatient child and adolescent mental health facilities. These findings are consistent with
the broader literature on social vulnerability. However, poverty was found to be closer to mental
health facilities, which is not consistent with the literature concerning social vulnerability. Linear
distance as a barrier that increases social vulnerability is one among many other barriers that
inhibit populations from accessing outpatient child and adolescent mental health services.
46

REFERENCES
Abramson, D., & Garfield, R. (2006). On the edge: Children and families displaced by hurricane
Katrina and Rita a looming medical and mental health crisis. Retrieved January 23, 2008 from http://www.childrenshealthfund.org
Anderson, D.R., Sweeney, D.J., & Williams, T.A. (2005). Statistics for business and economics.
Ohio: Thomson-South-Western. Ashford, J.B., LeCroy, C.W., & Lortie, K.L. (2006). Human behavior in the social
environmental: A multidimensional perspective (3rd ed.). Belmont: Thomson. Bankoff, G. (2003). Cultures of disaster: Society and natural hazards in the Philippines. New
York: Routledge. Barker, R.L. (1999).The social work dictionary (3rd ed.). Washignton D.C.: NASW Press.
Belfar, M.L. (2008). Child and adolescent mental disorders: The magnitude of the problem across the globe. Journal of Child Psychology and Psychiatry, 49(3), 226-236.
Brunsma, D.L., Overfelt, D., Picou, S.I. (2007). The sociology of Katrina: Perspectives on a
modern catastrophe. New York: Rowman & Littlefield. Chaskin, R. J. (1997). Perspectives on neighborhood and community: A review of the literature.
Social Service Review, 71(4), 521-547. Chow, J.C.C., Jaffee, K., & Snowden, L. (2003). Racial/ethnic disparities in the use of mental
health services in poverty areas.American Journal of Public Health, 93(5), pp 792-797. City of New Orleans (n.d.).New Orleans adolescent centers. Retrieved July 15, 2007, from City
of New Orleans website: http://www.cityofno.com/Portals/Portal48/portal.aspx?tabid=29. Coulton, C. (2005). The Place of Community in Social Work Practice Research: Conceptual and
Methodological Developments. Social Work Research, 29(2), 73-86. Cutter, S.L., Boruff, B.J., & Shirley, W.L. (2003). Social vulnerability to environmental
hazards.Social Science Quarterly, 84(2), pp 242- 261. Cutter, S.L. & Emrich, C.T. (2006). Moral hazards social catastrophe: The changing face of
vulnerability along the hurricane coasts. The Annals of the American Academy of Political and Social Sciences, 604, 102-112.
Davenport, D.D., Richey, J., & Westbrook, L. (2008). E-government access to social service
information: State web resources for domestic violence survivors[Electronic version]. Journal of the American Society for Information Science and Technology, 59(6), 903-915.
47

Drabek, T.E. (1986). Human systems responses to disaster: An inventory of sociological findings. New York: Springer-Verlag.
Drabek, T.E (2007). Sociology, disasters and emergency management: History, contributions,
and future agenda. In D.A. McEntire (Ed.), Disciplines, disasters and emergency management: The convergence and divergence of concepts, issues and trends from the research literature (pp. 61-74). Illinois: Charles C. Thomas.
Drabek, T.E. & Key, W.H. (1984). Conquering disasters: Family recover and long-term
consequences. New York: Irvington. Dear, M. (1977). Locational factors in the demand for mental health care.Economic Geography,
53(3), 223-240. Harpaz-Rotem, I., Leslie, D., & Rosenheck, R.A. (2004).Treatment retention among children
entering a new episode of mental health care.Psychiatric Services, 55(9) pp 1022-1028. Hartman, C. & Squires, G.D. (2006). There is no such thing as a natural disaster: Race, class,
and Hurricane Katrina. New York: Routledge. Hillier, A. (2007). Why social work needs mapping. Journal of Social Work Education, 43(2),
205-221. Horwitz, S. M., Kelleher, K., Boyce, T., Jensen, P., Murphy, M., Perrin, E., et al. (2002).Barriers
to Health Care Research for Children and Youth With Psychosocial Problems.Journal of the American Medical Association, 288(12), 1508.
Kates, R.W. (1977). Major insights: A summary and recommendation. In Reconstruction
following disaster, eds J.E. Haas, R.W. Kates and M.J. Bowden, 261-93. Cambridge, MA MIT Press.
Kessler, R. C. (2007). Hurricane Katrina's Impact on the Care of Survivors with Chronic Medical
Conditions.Journal of General Internal Medicine, 22(9), 1225-1230. Kessler, R. C., Galea, S., Jones, R. T., & Parker, H. A. (2006). Mental illness and suicidality
after Hurricane Katrina.Bulletin of the World Health Organization, 84(12), 930-939. Kalmuss, D., &Fennelly, K. (1990). Barriers to Prenatal Care Among Low-Income Women in
New York City.Family Planning Perspectives, 22(5), 215-231. Lawson, W.B., Helpler, N., Holladay, J., & Cuffell, B. (1994). Race as a factor in inpatient and
outpatient admissions and diagnosis. Hospital Community Psychiatry, (45) 1, 72-74. Lichter, D. T., & Johnson, K. M. (2007). The Changing Spatial Concentration of America's
Rural Poor Population. Rural Sociology, 72(3), 331-358. Luo, W. & Wang, F. (2003, March 14). Measures of spatial accessibility to health care in a GIS
environment: Synthesis and a case study in the Chicago region. Environment and
48

Planning B: Planning and Design, 30, pp 865-884 from http://www.envplan.com.libezp.lib.lsu.edu/abstract.cgi?id=b29120.
Louisiana State Department of Health and Hospitals (n.d.) Community mental health clinics,
Retrieved July 15, 2007 from http://www.dhh.louisiana.gov/offices/locations.asp?ID=62. McEntire, David A. 2004. “Tenets of Vulnerability: An Assessment of a Fundamental Disaster
Concept.” Journal of Emergency Management 2 (2):23-29. McKinnon, J. (2001). The black population: 2000. Census 2000 Brief. Retrieved August 28, 2007,
from http://www.census.gov/prod/2001pubs/c2kbr01-5.pdf. Mileti, D.S. (1999). Disaster by design: A reassessment of Natural hazards in the United States.
Washington, DC: Joseph Henry Press. Minahan, A., &Pincus, A. (1977). Conceptual framework for social work practice.Social Work,
22(5), 347-352. Nelson, M. K. (2006).Ongoing Challenges in the Understanding of Rural Poverty.Journal of
Poverty, 10(4), 89-108. Ormsby, T., Napoleon E., Burke, R., Grossel, C., Feaster, L. (2001). Getting to know ArcGIS
desktop. Redlands, California: ESRI Press. Peacock, W.G., Morrow, B.H., & Gladwin, H. (1997). Ethnicity, gender, and the sociology of
disaster. New York: Routledge. Sayal, K. (2006). Annotation: Pathways to care for children with mental health problems.
Journal of Child Psychology & Psychiatry, 47(7), 649-659. Simmons, T. & O’Neill, G. (2001) Household and families.Census 2000 Brief. Retrieved August
28, 2007, from http://www.census.gov/prod/2001pubs/c2kbr01-8.pdf. Steele, L., Dewa, C., & Lee, K. (2007). Socioeconomic Status and Self-Reported Barriers to
Mental Health Service Use. Canadian Journal of Psychiatry, 52(3), 201-206. Thienkrua, W., Cardoza, B.L., Chakkraband, M.L.S., Guadamuz, T.E., Pengjuntr, W.,
Tantipiwatanaskul, P. & et al. (2006). Symptoms of posttraumatic stress disorder and depression among children in tsunami-affected areas in Southern Thailand. I Journal of the American Medical Association, 296(5), pp 549-558.
U.S. Department of Commerce (1994).Census blocks and block groups.Geographic areas
reference manual (pp 11-1 – 11-19). Retrieved February 12, 2008. U.S. Census Bureau (2000), - Decennial Census: 2000- Summary Files [Data Files]. Retrieved
October 12, 2007 from, http://factfinder.census.gov/servlet/DatasetMainPageServlet?_program=DEC&_submenuId=&_lang=en&_ts= .
49

U.S. Department of Health and Human Services (1999). Mental health: A report of the surgeon general- Executive summary. Retrieved August 20, 2007 from http://mentalhealth.samhsa.gov/features/surgeongeneralreport/home.asp.
U.S. Department of Health and Human Services. (2001). Mental health: Culture,
race, and ethnicity—A Supplement to Mental Health: A Report of the Surgeon General. Retrieved August 20, 2007 from http://mentalhealth.samhsa.gov/cre/default.asp.
Wisner, B., Blaikie, P., Cannon, T., & Davis, I. (2004). At risk: Natural hazards, people’s vulnerability and disasters (2nded). New York: Routledge.
Woodward & Damon (2001).Housing characteristics: 2000. Census 2000 Brief. Retrieved
December 12, 2007, from U.S. Census Bureau website: http://www.census.gov/prod/2001pubs/c2kbr01-13.pdf.
Zito, J.M., Safer, D.J., dosReis, S., & Riddle, M.A. (1998). Racial disparity in psychotropic
medication prescribed for youths with Medicaid insurance in Maryland. Journal of the American Academy of Child and Adolescent Psychiatry, 37(2), pp 179-184 [Electronic Version].
Zakour, M.J. (1996). Geographic and social distance during emergencies: A path model of
interorganizational links. Social Work Research, 20(1), 19-30. Zakour, M.J., & Harrell, E.B. (2003). Access to disaster services: Social work interventions for
vulnerable populations. Journal of Social Service Research, 30(2), 27-54.
50

APPENDIX
Children and Adolescent Mental Health Facilities in Orleans Parish
Name Of Facility
Address City State Zip
Enhanced Destiny
Services, LLC
2740 Iberville Street
New Orleans
LA 70119
Family Care, Inc.
3520 General Degaulle
New Orleans
LA 70114
Holistic Concepts
1433 North Claiborne Avenue
New Orleans
LA 70116
Integrated Family
Services, LLC
2714 Canal Street New Orleans
LA 70119
Milestone Mental Health
Agency
3606 Magazine Street
New Orleans
LA 70115
RTC Providers, INC
330 North Jefferson Davis
Parkway
New Orleans
LA 70119
New Orleans Adolescent Hospital & Community
Services
210 State Street New Orleans
LA 70118
51

52
VITA
Rob Harrison was born in Metairie, Louisiana. He obtained a Bachelor of General
Studies Degree in 2004 from Nicholls State University. He will receive his Master of Social
Work from Louisiana State University in December 2008. He currently lives in Baton Rouge.