distributed vs. concentrated rapid frequency … · distributed vs. concentrated rapid frequency...
TRANSCRIPT

Distributed vs. Concentrated Rapid FrequencyResponse Provision in Future Great Britain System
Inmaculada Martınez-Sanz, Balarko Chaudhuri, Adria Junyent-Ferre, Vincenzo Trovato and Goran StrbacDept. of Electrical and Electronic Engineering, Imperial College London
London, United KingdomEmail: [email protected]
Abstract—Two major sources of rapid frequency response(RFR) to counter the reducing system inertia problem of theGreat Britain (GB) system are “synthetic inertia” from windturbines and fast demand response (FDR). In this paper, weconsider a future low inertia scenario to show the effectivenessof RFR provision from the large offshore wind farms (OWFs)planned in the North Sea (concentrated response) against FDRfrom loads spread across the GB system (distributed response).The spatial variation in transient frequencies, which can bepronounced in the aftermath of a disturbance and is criticalfor the response activation of these actuators, is accounted. Casestudies using a reduced GB system model show the effectivenessof distributed FDR and concentrated support from OWFs inproviding RFR when disturbances occur in different areas of thesystem where different inertia levels are present.
I. INTRODUCTION
The task of balancing generation and demand in AC systemsis one of the main duties of the transmission system operators(TSOs). It relies on different mechanisms operating at differenttime scales to ensure stable operation. Long term stability(from months to day ahead) is taken care by long term systemplanning and energy markets. Intraday stability is ensuredthrough real-time generation reserve management by the TSO.At sub-minute scale, stability is ensured by having decen-tralized primary controllers implemented in the power plantgovernors [1]. At even smaller time scale, the inertial responseof synchronous machines ensures that the instantaneous powerdemand is matched by generation. The inertial response relieson the kinetic energy stored in the spinning mass of thegenerators, which is spontaneously delivered to the grid whendemand exceeds generation. This causes generators to slowdown, making the frequency of the AC system decrease. Theinertial response plays a key role during the first few secondswhen a short-circuit or a disconnection of a large generatorhappens at transmission level.
While all synchronous power plants provide inertialresponse inherently, non-synchronous generation systems(NSGs), such as photo-voltaic (PV) and wind power gen-erators, do not. With the prospect of having more NSGsdisplacing conventional generation, concerns about frequencytransients becoming worse, arise. This issue is especially
This work was supported by the Engineering and Physical Science ResearchCouncil, U.K., under grants EP/K006312/1 and EP/K036327/1. Supportingdata is available on request: please contact [email protected].
worrying in relatively small systems such as the Irish or theGreat Britain (GB) network [2].
In the mid 2000’s, following the rapid growth of windgeneration in Europe, the inertial response from wind powerbecame an active topic of research [3], [4], [5] that eventuallyled to some of the biggest wind turbine manufacturers im-plementing their own strategies to supply so-called “syntheticinertia” [6]. That is, a fully-controlled artificial mechanismto enable wind turbines to deliver rapid frequency response(RFR) in a similar way as synchronous generators do. Thisfeature has been made available in commercial wind turbinesfor some time and multiple demonstrations of the concept havebeen performed. However, no gridcode has made this featuremandatory as yet [7]. Real-time identification of frequencyevents requiring inertial support is not a trivial task and thereare concerns about current procedures for Rate of Change ofFrequency (RoCoF) measurement not being fit for purpose[8]. The consequences of wrongly identifying localized volt-age transients as incipient frequency events requiring inertialsupport are not well understood yet but may potentially causenetwork stability issues.
Whilst synthetic inertia is seen as a feature that will certainlyplay a role in the control of the power system at some stage,other alternative mechanisms to provide RFR have also beenproposed. One notable idea is the use of fast demand response(FDR) triggering a drop in load to produce a similar effect asa boost of generated power [9], [10]. The implementation ofFDR for inertial support presents several practical challenges.For instance, how the amount of support available at a certaintime can be estimated and what is the best mechanism torelease the RFR are currently being discussed [11].
One big difference between the characteristics of the RFRwind power can provide against FDR is the geographicalspread of the support. While wind power represents relativelylarge power injections in specific windy locations, DR isspread across the entire AC network. The analysis of howthis geographical spread affects the frequency transient hasnot been discussed before and is the aim of the present paper.
II. REDUCED DYNAMIC EQUIVALENT MODEL OF THE GBTRANSMISSION SYSTEM
The comparison between distributed and concentrated rapidfrequency response (RFR) is evaluated on a reduced dynamicequivalent model of the GB transmission system, shown

Fig. 1. Reduced dynamic model of the GB transmission network with plannedoffshore wind farms connections.
in Fig. 1. This system has been developed in DIgSILENTPowerFactory by National Grid (NG) for academic researchpurposes [12]. It consists of 64 lines corresponding to themain transmission corridors in the actual system (at 400 kV)and 36 zones (or buses) representing the principal generationand demand centers. We consider an operating scenario inwhich the total system demand is 40GW. All synchronousgenerators are equipped with generic models of governorcontrol (except the nuclear power plants), AVR and PSS andcorrespond to clusters of generators of the same type locatedclose by geographically. The inertia constants of gas, coal andbiomass machines are 4.5s, 3s for hydro units and 5.5s fornuclear generators. The system spinning reserve is kept equalto 1.8GW, according to the maximum possible infeed loss [13].
The total system level inertia for the considered operatingcondition is 124.7GWs (99.5GWs in England, 25.2GWs inScotland) in line with NG projected future scenarios [14].
Modelling Rapid Frequency Response Actuators
A. Distributed RFR: Fast Demand Side Response (FDR)
The total system demand is formed by two types ofaggregate loads at each bus. One is a generic load (P -constant current, Q-constant impedance) and the other oneis a controllable load (P -constant power, Q-constant power)which can represent demand side resources. In particular,we would be only considering domestic refrigerators, whichcan be controlled to collectively follow a pre-defined powersignal [15]. In our study, their aggregate power consumptionis approximately 2.56 GW (65 million devices).
B. Concentrated RFR: Offshore Wind Farms (OWF)
Four offshore wind farms (OWF) are connected through DClinks to the onshore system at zones Z12, Z16, Z24 and Z25A.These connection points emulate injections from future Round3 offshore locations: East Anglia (in zone 12), Hornsea (inzone 16) and Dogger Bank (in zones 24 and 25A). It wasconsidered that each OWF generates 2.5GW, totalling 10GWoffshore production, in line with NG future scenarios [14]. In
addition, 6GW of distributed asynchronous generation is alsopresent across the system.
III. CONTROLLER FOR RAPID FREQUENCY RESPONSE
A. Frequency Measurement and Fast Response Activation
A generic control scheme is considered to activate the dif-ferent rapid frequency response (RFR) from the concentratedand distributed resources. The scheme is shown in Fig. 2 andit represents the main characteristics of an inertial supportcontroller. Frequency is measured locally through a phaselocked loop and then filtered with a low pass filter (withT=100ms) which also accounts for any communication delay.Each support element activates its response according to theavailable frequency measurement. A frequency dead-band of±0.1Hz is initially assumed to trigger the response.
Fig. 2. Overview of generic controller for rapid frequency response.
The new power P ∗ injected (OWF) or consumed (FDR) toprovide grid support is considered proportional (with gain K)to the measured frequency derivative, approximated by its rateof change (RoCoF), in order to improve the transient frequencyresponse. Hence:
P ∗ = K ·RoCoF (t) ≈ Kdf(t)
dtwith K = k0 · Pres (1)
where Pres is the power reserve of each support elementand k0 is a weight factor equal for all of them that marksthe reserves deployment. The power P ∗ is bounded for eachactuator between 0 (no frequency support provision) and Pres
(maximum provision). In the simulations presented next weconsidered that the total power reserve from either distributedor concentrated RFR is 1GW in each case. For each OWF,Pres is 10% (increase) of its nominal power output, which intotal provides 1GW reserve. In case of FDR, Pres for eachaggregate load is equal to 39% (reduction) of its nominalpower consumption, which is a reasonable value for theconsidered refrigerators [16]. In addition, k0 is 1/0.3 (s/Hz).
We define RoCoF in (1) as the rate of change of frequencyevaluated over a sliding window size ∆x as in (2):
RoCoF (xi) =f(xi)− f(xi −∆x)
∆x(2)
The RoCoF employed by the control law (1) is calculatedover a 1ms window, which is the sampling period.
B. System Regional RoCoFs
The effectiveness of concentrated and distributed RFR to-wards enhancing the overall system inertial response is com-pared in terms of RoCoF (see (2)) improvement. It is importantto monitor the system RoCoF at the different buses as high
RoCoF values could trigger the protections of distributedgenerators accelerating the frequency fall even further.
Typical time windows for RoCoF based protection variesbetween 100ms and 500ms [2] and so these values are used forthe comparison. Regionality of RoCoF has been identified asa major concern to be accounted in future low inertia systems,as it can vary significantly across the system depending on thefault location and the level of non-synchronous generation con-nected to the grid. By choosing such longer window lengths, alower discrepancy between the RoCoF values measured acrossthe system is ensured, as opposed to instantaneous frequencyderivative values or shorter window lengths.
IV. SIMULATION RESULTS: PRIMARY RESPONSE
The contribution to RFR provision during the primaryresponse period (which covers up to 30s after the frequencyevent) is evaluated in this section for the generic controlscheme presented in Fig. 2. We consider the reduced equiva-lent model of the GB transmission system under the operatingscenario previously described in Section II. Two differentinfeed loss events are investigated -one in the Scottish and onein the English system. The amount of infeed loss correspondsto 1.8GW for the GB grid.
A. Generator outage in the Scottish System
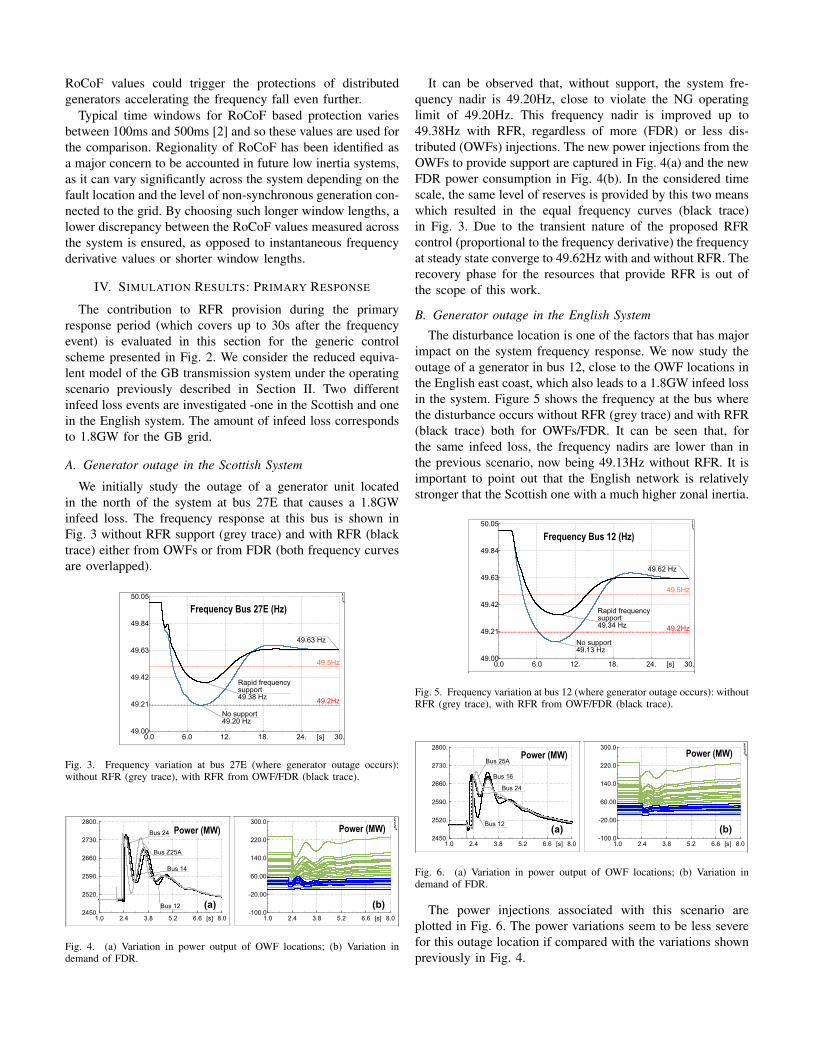
We initially study the outage of a generator unit locatedin the north of the system at bus 27E that causes a 1.8GWinfeed loss. The frequency response at this bus is shown inFig. 3 without RFR support (grey trace) and with RFR (blacktrace) either from OWFs or from FDR (both frequency curvesare overlapped).
Fig. 3. Frequency variation at bus 27E (where generator outage occurs):without RFR (grey trace), with RFR from OWF/FDR (black trace).
Fig. 4. (a) Variation in power output of OWF locations; (b) Variation indemand of FDR.
It can be observed that, without support, the system fre-quency nadir is 49.20Hz, close to violate the NG operatinglimit of 49.20Hz. This frequency nadir is improved up to49.38Hz with RFR, regardless of more (FDR) or less dis-tributed (OWFs) injections. The new power injections from theOWFs to provide support are captured in Fig. 4(a) and the newFDR power consumption in Fig. 4(b). In the considered timescale, the same level of reserves is provided by this two meanswhich resulted in the equal frequency curves (black trace)in Fig. 3. Due to the transient nature of the proposed RFRcontrol (proportional to the frequency derivative) the frequencyat steady state converge to 49.62Hz with and without RFR. Therecovery phase for the resources that provide RFR is out ofthe scope of this work.
B. Generator outage in the English System
The disturbance location is one of the factors that has majorimpact on the system frequency response. We now study theoutage of a generator in bus 12, close to the OWF locations inthe English east coast, which also leads to a 1.8GW infeed lossin the system. Figure 5 shows the frequency at the bus wherethe disturbance occurs without RFR (grey trace) and with RFR(black trace) both for OWFs/FDR. It can be seen that, forthe same infeed loss, the frequency nadirs are lower than inthe previous scenario, now being 49.13Hz without RFR. It isimportant to point out that the English network is relativelystronger that the Scottish one with a much higher zonal inertia.
Fig. 5. Frequency variation at bus 12 (where generator outage occurs): withoutRFR (grey trace), with RFR from OWF/FDR (black trace).
Fig. 6. (a) Variation in power output of OWF locations; (b) Variation indemand of FDR.
The power injections associated with this scenario areplotted in Fig. 6. The power variations seem to be less severefor this outage location if compared with the variations shownpreviously in Fig. 4.

V. SIMULATION RESULTS: INERTIAL RESPONSE
The simulation results described in the previous section pre-sented a similar RFR contribution level from distributed FDRresources and big OWFs in the tens of seconds time frame,provided the same activation mechanisms and total level ofreserves. Since the spatial variation of transient frequenciescan be very pronounced during the initial second after the dis-turbance event, we focus now in a narrower inertial responsetime interval of 1 second. The location of the disturbance,the distribution of effective inertia across different regions(mainly caused by non-synchronous generation penetration)and the size of the infeed loss would significantly affect thefrequency and its RoCoF during this transient period. We focusnow on the RFR contribution to improve the system RoCoFconsidering again the outage of the same generating unitsconnected to buses 27E and 12.
A. Generator outage in the Scottish System
The initial frequency transients caused by the 1.8GW lossof infeed at bus 27E are plotted in Fig. 7. Since the disturbanceoccurs in the Scottish part of the network, which has a lowregional inertial, the frequency variation across the differentbuses is pronounced. However, the measuring and filteringprocedure has smoothen these responses, which for future lowinertia scenarios can be expected to be more disperse.
Fig. 7. Frequency variations at the different buses during inertial period(measurements after filtering stage). Blue traces: generators in Scotland (buses27E-33), Green traces: generators in England (buses 01-26).
The benefits of distributed RFR through FDR and con-centrated RFR from OWFs in the inertial response frame isevaluated next. The RoCoF after the outage in different systembuses is calculated according to (2) and shown separately inFig. 8 and Fig. 9 using a 100ms and a 500ms measuring win-dow, respectively. Some general conclusions can be extractedfrom these simulation results:
• RoCoF values can differ a lot across the system, but theuse of longer slidding windows to calculate them (e.g.500ms) tend to homogenize these values. The minimumRoCoF that appears in bus 27E is significantly reducedin Fig. 9(b) compared to Fig. 8(b).
• The RFR contribution from OWF (orange traces) andFDR (black traces) can improve the measured RoCoF.This contribution is clear (in both Figs. 8 and 9) for the
Fig. 8. RoCoF measurements at different system buses using a 100ms timewindow for a 1.8GW loss of infeed at bus 27E. Grey traces: without RFR;Orange traces: RFR from OWF locations; Black traces: RFR from FDR.
buses of the English system (subplots (c)-(f)) and quitereduced (or non existent) for the buses in the Scottishsystem where the inertia is low (subplots (a)-(b)).
• Comparing the effectiveness of concentrated RFR (orangetraces) with the distributed RFR (black traces), the lastseem to provide an overall benefit on the system RoCoFs(subplots (e)-(f) in Figs. 8 and 9), apart from the locationswhere the OWFs are connected (subplots (c)-(d)). This isparticularly evident in the subplots (e) and (f) of Fig. 8when, for the 100ms measuring window, not all the RFRfrom OWFs has been deployed (refer to the activationdead-band in Fig. 7).
B. Generator outage in the English System
Finally, the RFR contribution in the inertia time scale for thegenerator outage in bus 12 is also reported. This disturbancein the English system with relatively high inertia. As a resultthe spatial variation in transient frequencies is less severe thanthe previous case as seen in Fig. 10. Under this scenario, theresponses from the TCLs and OWFs on the calculated RoCoFsare very similar, as shown in Fig. 11 for the slidding windowlength of 500ms. These results follow the general conclusionsextracted in the previous subsection and also demonstrate theRFR RoCoF improvement across the system.
VI. CONCLUSION
Case studies on a reduced equivalent of the GB transmissionsystem (from National Grid) have been presented to show thatRFR from FDR and OWF would both improve the frequencynadir. On the time scale of inertial response, the extent of

Fig. 9. RoCoF measurements at different system buses using a 500ms timewindow for a 1.8GW loss of infeed at bus 27E. Grey traces: without RFR;Orange traces: RFR from OWF locations; Black traces: RFR from FDR.
Fig. 10. Frequency variations at the different buses during inertial period(measurements after filtering stage). Blue traces: generators in Scotland (buses27E-33), Green traces: generators in England (buses 01-26).
RFR provision from highly distributed FDR and relativelyconcentrated OWF could vary depending on the disturbancelocation and the geographical distribution of effective inertiawhich among other factors is set by the wind speed condition.
Future work should focus on other problems arising infuture low inertia systems such as fault ride-through, angleand voltage stability.
REFERENCES
[1] P. Kundur, Power system stability and control. McGraw-Hill New York,1994.
[2] (2013) Rate of Change of Frequency (ROCOF) - Review of TSOand Generator Submissions - final report. [Online]. Available: http://www.cer.ie/docs/000260/cer13143-(a)-ppa-tnei-rocof-final-report.pdf
[3] J. Ekanayake and N. Jenkins, “Comparison of the response of doublyfed and fixed-speed induction generator wind turbines to changes innetwork frequency,” Energy conversion, IEEE Transactions on, vol. 19,no. 4, pp. 800–802, 2004.
Fig. 11. RoCoF measurements at different system buses using a 500ms timewindow for a 1.8GW loss of infeed at bus 12. Grey traces: without RFR;Orange traces: RFR from OWF locations; Black traces: RFR from FDR.
[4] J. Morren, J. Pierik, and S. W. De Haan, “Inertial response of variablespeed wind turbines,” Electric power systems research, vol. 76, no. 11,pp. 980–987, 2006.
[5] O. Anaya-Lara, F. Hughes, N. Jenkins, and G. Strbac, “Contribution ofDFIG-based wind farms to power system short-term frequency regula-tion,” IEE Proceedings-Generation, Transmission and Distribution, vol.153, no. 2, pp. 164–170, 2006.
[6] N. Miller, K. Clark, and R. Walling, “WindINERTIA: controlled inertialresponse from GE wind turbine generators,” in 45th annual Minnesotapower systems conference, Minneapolis, Minnesota, 2009.
[7] M. Altin, O. Goksu, R. Teodorescu, P. Rodriguez, B.-B. Jensen, andL. Helle, “Overview of recent grid codes for wind power integration,”in OPTIM, 12th International Conference on, May 2010, pp. 1152–1160.
[8] P. Ashton, G. Taylor, A. Carter, M. Bradley, and W. Hung, “Applicationof phasor measurement units to estimate power system inertial frequencyresponse,” in PES General Meeting, 2013 IEEE, July 2013, pp. 1–5.
[9] F. C. Schweppe, “Frequency adaptive, power-energy re-scheduler,”February 1982, US Patent 4,317,049.
[10] J. Short, D. Infield, and L. Freris, “Stabilization of grid frequencythrough dynamic demand control,” Power Systems, IEEE Transactionson, vol. 22, no. 3, pp. 1284–1293, 2007.
[11] V. Trovato, S. Tindemans, and G. Strbac, “Demand response contributionto effective inertia for system security in the GB 2020 gone greenscenario,” in ISGT EUROPE, 2013 4th IEEE/PES, Oct 2013, pp. 1–5.
[12] H. Urdal, R. Ierna, J. Zhu, C. Ivanov, A. Dahresobh, and D. Rostom,“System strength considerations in a converter dominated power sys-tem,” Renewable Power Generation, IET, vol. 9, no. 1, pp. 10–17, 2015.
[13] (2012) NETS Security and Quality of Supply Standard, version 2.2,National Grid. [Online]. Available: http://www2.nationalgrid.com/UK/Industry-information/Electricity-codes/SQSS/The-SQSS/
[14] (2013) Electricity Ten Year Statement (TYS), NationalGrid. [Online]. Available: http://www2.nationalgrid.com/UK/Industry-information/Future-of-Energy/Electricity-Ten-Year-Statement/
[15] S. Tindemans, V. Trovato, and G. Strbac, “Decentralized control ofthermostatic loads for flexible demand response,” Control SystemsTechnology, IEEE Transactions on, vol. 23, no. 5, pp. 1685–1700, 2015.
[16] V. Trovato, S. Tindemans, and G. Strbac, “Designing effective frequencyresponse patterns for flexible thermostatic loads,” in EEEIC, 2015 IEEE15th International Conference on, June 2015, pp. 1003–1008.