distribution, above-ground biomass and carbon...
TRANSCRIPT
THE MALAYSIAN FORESTER 2017, 80 (1): 73-84
73
DISTRIBUTION, ABOVE-GROUND BIOMASS AND CARBON STOCK OF THE VEGETATION IN
TAMAN BERINGIN URBAN FOREST, MEDAN CITY, NORTH SUMATRA, INDONESIA
RAHMAWATY 1*, NOVITA ARIANI SITORUS1
AND ABDUL RAUF2
1Forestry Study Program, Faculty of Forestry, University of Sumatera Utara, Jl. Tri Dharma
Ujung No. 1 Kampus USU, Medan 20155, Indonesia 2Agroecotechnology Study Program, Faculty of Agriculture, University of Sumatera Utara, Jl.
A. Sofyan No. 3 Kampus USU, Medan 20155, Indonesia
*Corresponding author:
Email: [email protected]
Abstract: One type of green open space located in Medan City is the Taman
Beringin Urban Forest. This study aimed to map the distribution of vegetation
and to calculate carbon stocks of vegetation and above-ground biomass (AGB)
at the Taman Beringin Urban Forest. A tree inventory was conducted using a
census method to determine the types and number of tree species and to measure
the diameter and height of the trees. A non-destructive sampling method was
conducted to estimate the biomass, using an allometric formula. The
calculation of biomass and carbon stocks or carbon was conducted for above
ground level—that is, only for living vegetation. The types of flora in the urban
forest include trees (34 species), ornamental plants (five species) and bamboo
(two species). Overall, 676 trees were found. The total biomass was 218.82
ton/ha and the carbon stock was 100.68 ton/ha.
Key words: AGB, allometric model, carbon stock, Urban Forest
INTRODUCTION
The Indonesian Government’s (2002) Regulation No. 63 on urban forests explains
that the urban forest is an expanse of land where compact and dense trees grow in
urban areas on both state and public land that has been designated as urban forest by
the government for the purposes of sustainability, harmony and balancing the urban
ecosystem; the urban forest yields environmental, social and cultural benefits. Further,
the Regulation of the Ministry of Forestry (2009) No. 71 stipulating guidelines for the
implementation of urban forest mentions that urban forest should cover at least 0.25
ha of each compact area. The urban forest is a very important element for maintaining
balance in the city (Zmelik et al. 2011). The urban forest is the main element in the
form of natural vegetation that absorbs pollutants in the form of gas and dust particles
through the leaves (Rawat & Banerjee 1996; Dahlan 2011).
THE MALAYSIAN FORESTER
74
Green open space is an absorber of carbon (carbon sink) and are effective in
reducing carbon emissions in the atmosphere (Shannigrahi et al. 2003; Basri 2009).
According to Dahlan (2011), one of the efforts to reduce emissions and air pollution
in urban areas is the presence of green open space. Based on data provided by the
Environment Agency of North Sumatra Province (2015), the amount of green open
space in Medan City is not currently sufficient. Green open space in Medan City
encompasses 2,120.8 ha or 8% of the total area of Medan City (26.510 ha).
The provision of green open space is regulated by the Law on Spatial
Planning No. 26 (2007). Further, the provision of the supply and use of green open
space is contained in the Regulation of the Minister of Public Works No. 5 (2008), a
guideline for the provision and use of green open space in urban area, and the Regional
Regulation of Medan City (Perda Kota Medan) No. 13 (2011). Under the regulation,
the proportion of green open space in the urban area should be at least 30% and
composed of 20% of public green open space and 10% of private green open space.
This policy on the minimum proportions of green open space is intended to support
the balancing of urban ecological systems and to ensure the requisite availability of
clean air for the community; it can also provide aesthetic value to the spatial structure
of the city.
Taman Beringin Urban Forest is a green open space located in the centre of
Medan City (Jalan Sudirman). As it is clean, airy, easily accessible and does not
require an entrance fee, the park is frequented by the public. The existence of urban
forests is very important for creating a comfortable urban terrain, especially in terms
of the absorption of carbon dioxide (CO2) and the provision of oxygen (O2): the green
belt of Medan City serves as a CO2 sink. Given the lack of information regarding the
distribution, the above-ground biomass (AGB) and the carbon stock of the vegetation
at Taman Beringin Urban Forest in Medan City, North Sumatra, Indonesia, a study is
essential for providing information about the current state of the forest and planning
future development. This study aimed to map the distribution of vegetation in Taman
Beringin Urban Forest and to calculate its carbon stocks and its AGB. It is anticipated
that this research will provide information that can be used to determine management
plans for the environmental development of Medan City.
MATERIALS AND METHODS
This study was conducted in Taman Beringin Urban Forest, Medan City, which is
located in the Medan Maimun Subdistrict and comprises an area of 1.304 ha. Data
analysis was performed in the Laboratory of Integrated Forest Management in the
Faculty of Forestry at the University of Sumatra Utara. Census methods were used to
determine the type and number of species, as well as to measure the diameters and
heights of the vegetation in Taman Beringin Urban Forest. Thirty plots with areas of
20 m square were created and all trees in these plots were recorded. A global
positioning system (GPS) was used to record the coordinates of the trees and a
geographic information system (GIS) was used to map the distribution of trees. A non-
destructive sampling method that did not cause harm to vegetation during the
estimation of biomass was employed; it entailed the use of an allometric formula that
was either general or specific to a certain type of vegetation. The calculation of
biomass and carbon stocks or carbon was conducted solely above ground on the
AGB—that is, only on living vegetation.
THE MALAYSIAN FORESTER
75
The primary data taken from Taman Beringin Urban Forest included the
types, numbers, diameters and heights of the vegetation. Secondary data used as
supportive data in this study comprised an administrative map of Medan and several
existing allometric models (Table 1). The diameters of trees were measured to
ascertain the growth-rate of vegetation (Manuri et al. 2016; Manuri et al. 2014;
Krisnawati et al. 2012). Measurements were obtained at a fixed diameter breast height
(DBH) or at 1.3 m from the ground’s surface (Hairiah et al. 2011; Krisnawati et al.
2012; Manuri et al. 2014). The parameters used for estimating the biomass of bamboo,
palms and bananas were height and diameter—or DBH—according to the allometric
formula used (Table 1). All trees were measured in the standing position. The
calculation of the value of biomass and carbon stocks or carbon stored is achieved
using allometric models.
Table 1. The allometric formula used in this study
Flora Allometric equation model Reference
Swietenia
macrophylla Y=0,048 D2,68 Adinugroho &
Sidiyasa, 2006
Swietenia mahagony Bt=0,9029(D2.H)0,6840 Mugiono, 2009
Acacia auriculiformis Bt = 0,0775(D2.H )0,9018 Mugiono, 2009
Palm (AGB)est = 4.5 + 7.7 x H Frangi & Lugo, 1985
Musa ornata (AGB)est = 0.030 D2.13 Arifin, 2001
Elaeis guineensis (AGB)est = 0,0976 H + 0,0706 Hairiah et al. 2011
Bamboo Y= -3225,8 + 1703,4 DBH Kumar et al. 2005
Tree in Sumatera B = 0,066D2,59 Ketterings et al. 2001
Branching Tree Y=0,11 ρ D2,62 Kettering et al. 2001 Note: Y = tree biomass (kg/ind); Bt = total biomass (kg/ind); (AGB) est = above ground biomass
(kg/ind); B = total biomass (kg/ind); H = total height of vegetation (m); D = diameter at breast height
(cm) at 1.3 m; ρ = wood density (gr/cm3).
The composition of tree species was determined by the important value index
(IVI). The IVI consisted of the sum of the relative frequency, the relative density and
the relative dominance (Mawazin & Subiakto 2013). The mastery level of each
species in the community was indicated by the IVI (Kusmana 2017). The diversity of
species was also calculated using the Shannon-Wiener diversity index (Kent & Paddy
1992).
RESULTS AND DISCUSSION
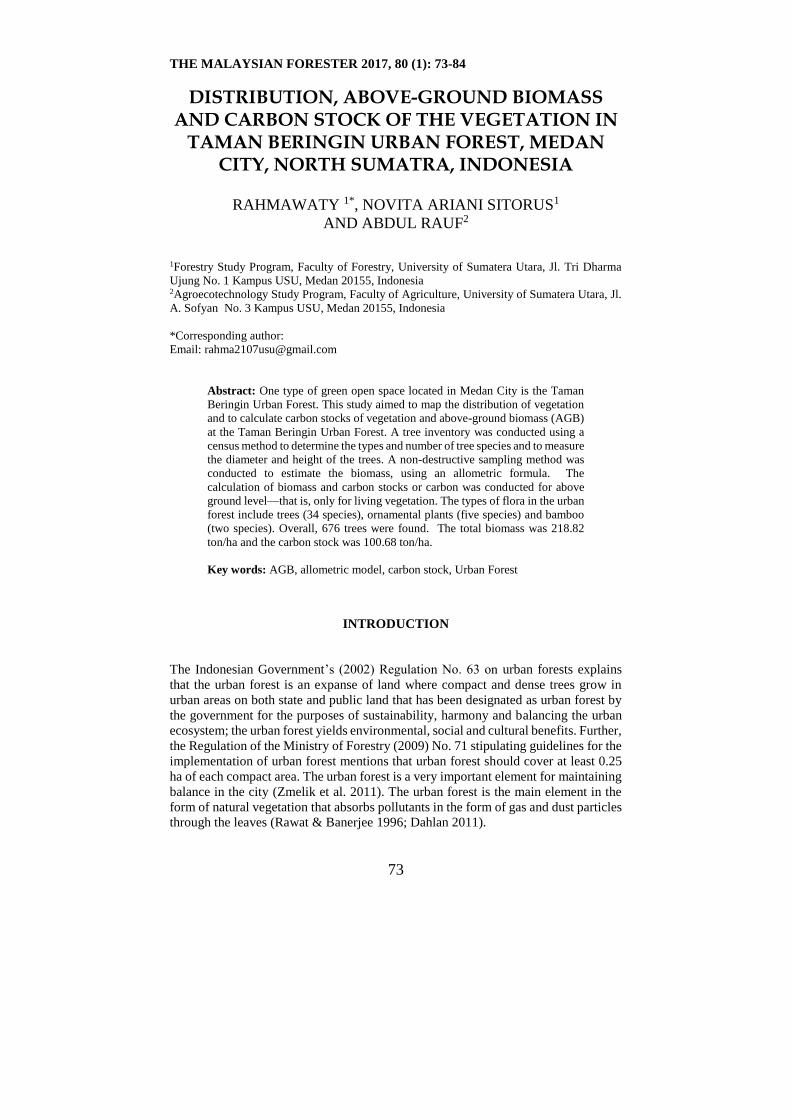
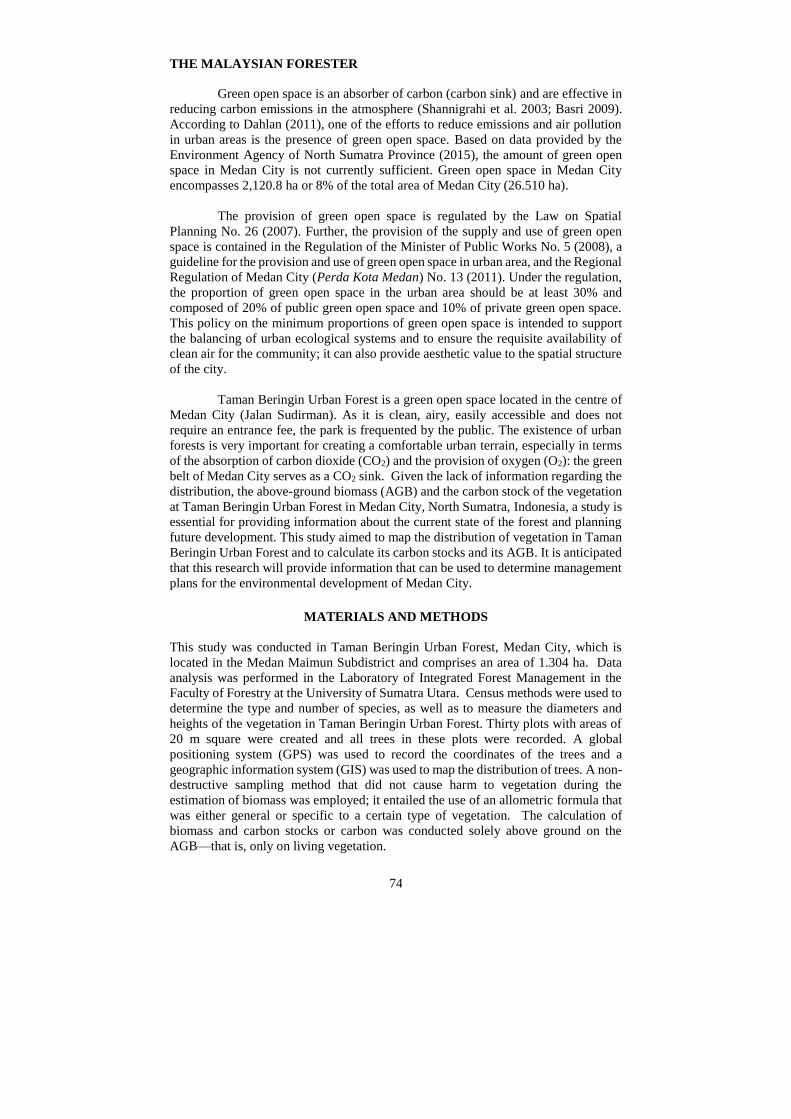
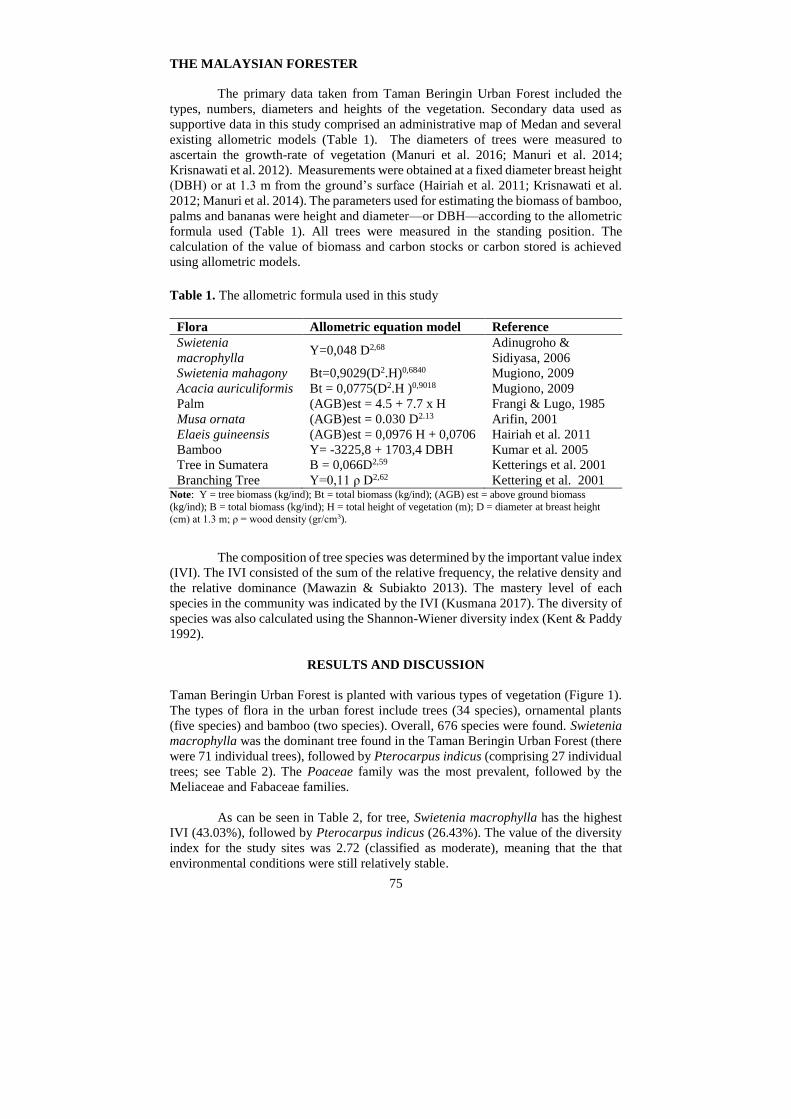
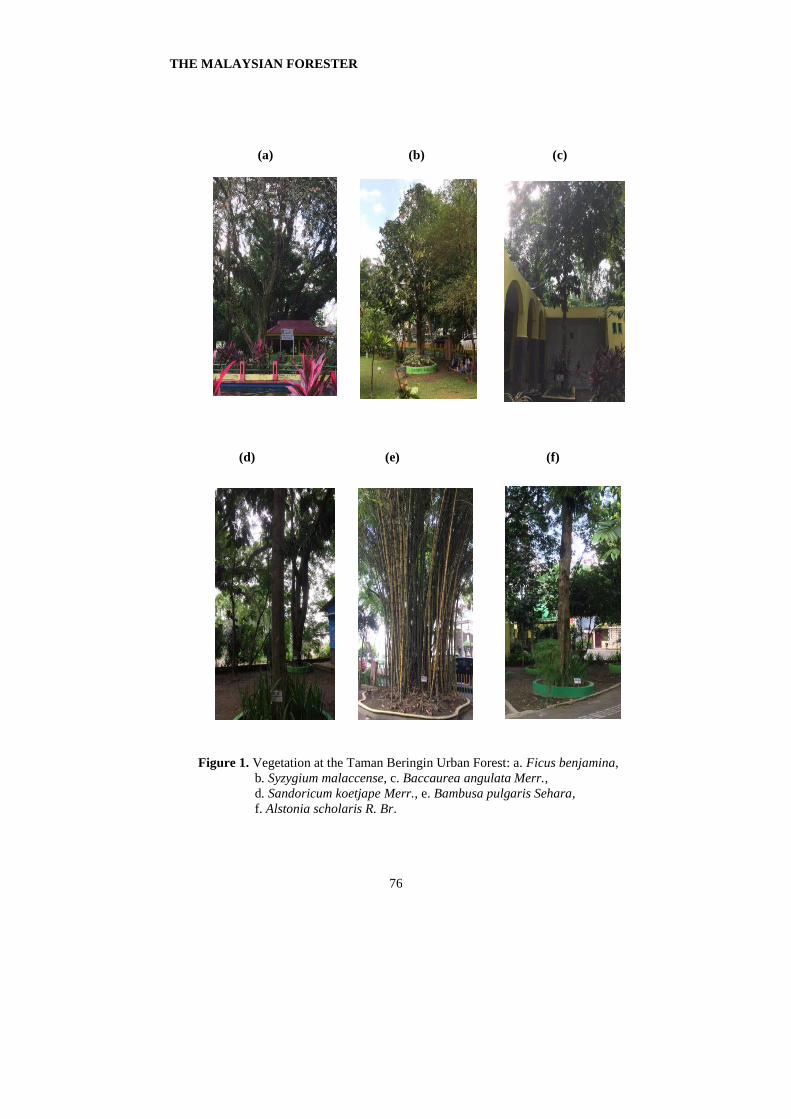
Taman Beringin Urban Forest is planted with various types of vegetation (Figure 1).
The types of flora in the urban forest include trees (34 species), ornamental plants
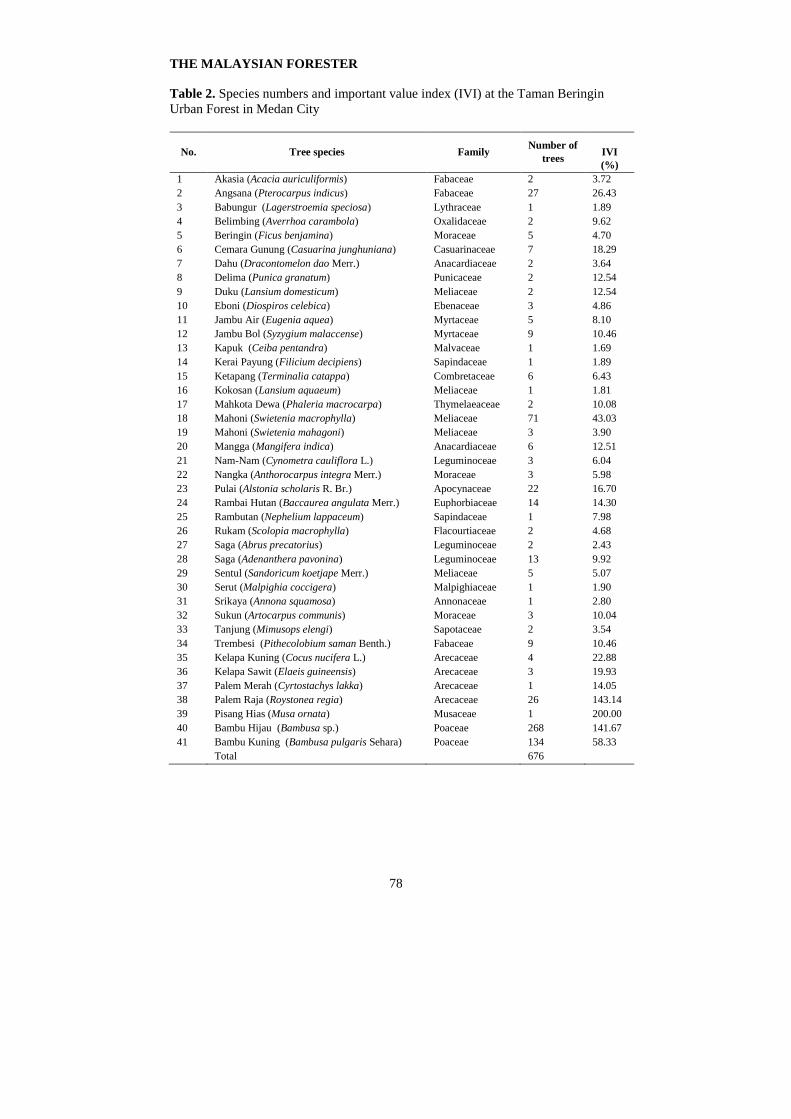
(five species) and bamboo (two species). Overall, 676 species were found. Swietenia
macrophylla was the dominant tree found in the Taman Beringin Urban Forest (there
were 71 individual trees), followed by Pterocarpus indicus (comprising 27 individual
trees; see Table 2). The Poaceae family was the most prevalent, followed by the
Meliaceae and Fabaceae families.
As can be seen in Table 2, for tree, Swietenia macrophylla has the highest
IVI (43.03%), followed by Pterocarpus indicus (26.43%). The value of the diversity
index for the study sites was 2.72 (classified as moderate), meaning that the that
environmental conditions were still relatively stable.
THE MALAYSIAN FORESTER
76
(d) (e) (f)
Figure 1. Vegetation at the Taman Beringin Urban Forest: a. Ficus benjamina,
b. Syzygium malaccense, c. Baccaurea angulata Merr.,
d. Sandoricum koetjape Merr., e. Bambusa pulgaris Sehara,
f. Alstonia scholaris R. Br.
(a) (b) (c)

THE MALAYSIAN FORESTER
77
Vegetation which is grown in Taman Beringin Urban Forest is aesthetic.
Seedlings were planted in Taman Beringin by the Landscape Gardening Services
Agency of Medan City as an effort to improve the quality and quantity of Taman
Beringin urban forest. Plants have a very important role in absorbing CO2 emissions
from transportation activities on the motorway (Berutu 2014). The CO2 emissions can
be categorized into two, namely direct emissions (such as CO2 emissions from motor
vehicles) and indirect emissions (such as electrical energy consumption in
households) (Pradiptiyas 2011; Berutu 2014).
The distribution of the vegetation in Taman Beringin Urban Forest can be
presented on maps using GIS technology. Among their other functions, maps show
the spatial distribution of geographic phenomena, including their different positions
on the surface of the earth. Maps can help to expand the limits of the human eye,
allowing it to see the spatial characteristics of the environment. Based on its form, the
urban forest can be classified into three types:
a. Clustered or accumulated (vegetation concentrated in an area of least 100 trees
with dense and irregular spacing).
b. Spread (no particular pattern; vegetation growing in small, scattered clumps or
clusters).
c. Tracked (vegetation growing in straight or curved lines, following the formation
of rivers, roads, beaches and channels).
The distribution of plant species in the Taman Beringin Urban Forest is presented
in Figure 2. As can be seen in Figure 2, the Taman Beringin Urban Forest is
categorised as ‘spread’.
Figure 2. Distribution of plant species in Taman Beringin Urban Forest
THE MALAYSIAN FORESTER
78
Table 2. Species numbers and important value index (IVI) at the Taman Beringin
Urban Forest in Medan City
No. Tree species Family Number of
trees
IVI
(%)
1 Akasia (Acacia auriculiformis) Fabaceae 2 3.72
2 Angsana (Pterocarpus indicus) Fabaceae 27 26.43
3 Babungur (Lagerstroemia speciosa) Lythraceae 1 1.89
4 Belimbing (Averrhoa carambola) Oxalidaceae 2 9.62
5 Beringin (Ficus benjamina) Moraceae 5 4.70
6 Cemara Gunung (Casuarina junghuniana) Casuarinaceae 7 18.29
7 Dahu (Dracontomelon dao Merr.) Anacardiaceae 2 3.64
8 Delima (Punica granatum) Punicaceae 2 12.54
9 Duku (Lansium domesticum) Meliaceae 2 12.54
10 Eboni (Diospiros celebica) Ebenaceae 3 4.86
11 Jambu Air (Eugenia aquea) Myrtaceae 5 8.10
12 Jambu Bol (Syzygium malaccense) Myrtaceae 9 10.46
13 Kapuk (Ceiba pentandra) Malvaceae 1 1.69
14 Kerai Payung (Filicium decipiens) Sapindaceae 1 1.89
15 Ketapang (Terminalia catappa) Combretaceae 6 6.43
16 Kokosan (Lansium aquaeum) Meliaceae 1 1.81
17 Mahkota Dewa (Phaleria macrocarpa) Thymelaeaceae 2 10.08
18 Mahoni (Swietenia macrophylla) Meliaceae 71 43.03
19 Mahoni (Swietenia mahagoni) Meliaceae 3 3.90
20 Mangga (Mangifera indica) Anacardiaceae 6 12.51
21 Nam-Nam (Cynometra cauliflora L.) Leguminoceae 3 6.04
22 Nangka (Anthorocarpus integra Merr.) Moraceae 3 5.98
23 Pulai (Alstonia scholaris R. Br.) Apocynaceae 22 16.70
24 Rambai Hutan (Baccaurea angulata Merr.) Euphorbiaceae 14 14.30
25 Rambutan (Nephelium lappaceum) Sapindaceae 1 7.98
26 Rukam (Scolopia macrophylla) Flacourtiaceae 2 4.68
27 Saga (Abrus precatorius) Leguminoceae 2 2.43
28 Saga (Adenanthera pavonina) Leguminoceae 13 9.92
29 Sentul (Sandoricum koetjape Merr.) Meliaceae 5 5.07
30 Serut (Malpighia coccigera) Malpighiaceae 1 1.90
31 Srikaya (Annona squamosa) Annonaceae 1 2.80
32 Sukun (Artocarpus communis) Moraceae 3 10.04
33 Tanjung (Mimusops elengi) Sapotaceae 2 3.54
34 Trembesi (Pithecolobium saman Benth.) Fabaceae 9 10.46
35 Kelapa Kuning (Cocus nucifera L.) Arecaceae 4 22.88
36 Kelapa Sawit (Elaeis guineensis) Arecaceae 3 19.93
37 Palem Merah (Cyrtostachys lakka) Arecaceae 1 14.05
38 Palem Raja (Roystonea regia) Arecaceae 26 143.14
39 Pisang Hias (Musa ornata) Musaceae 1 200.00
40 Bambu Hijau (Bambusa sp.) Poaceae 268 141.67
41 Bambu Kuning (Bambusa pulgaris Sehara) Poaceae 134 58.33
Total 676
THE MALAYSIAN FORESTER
79
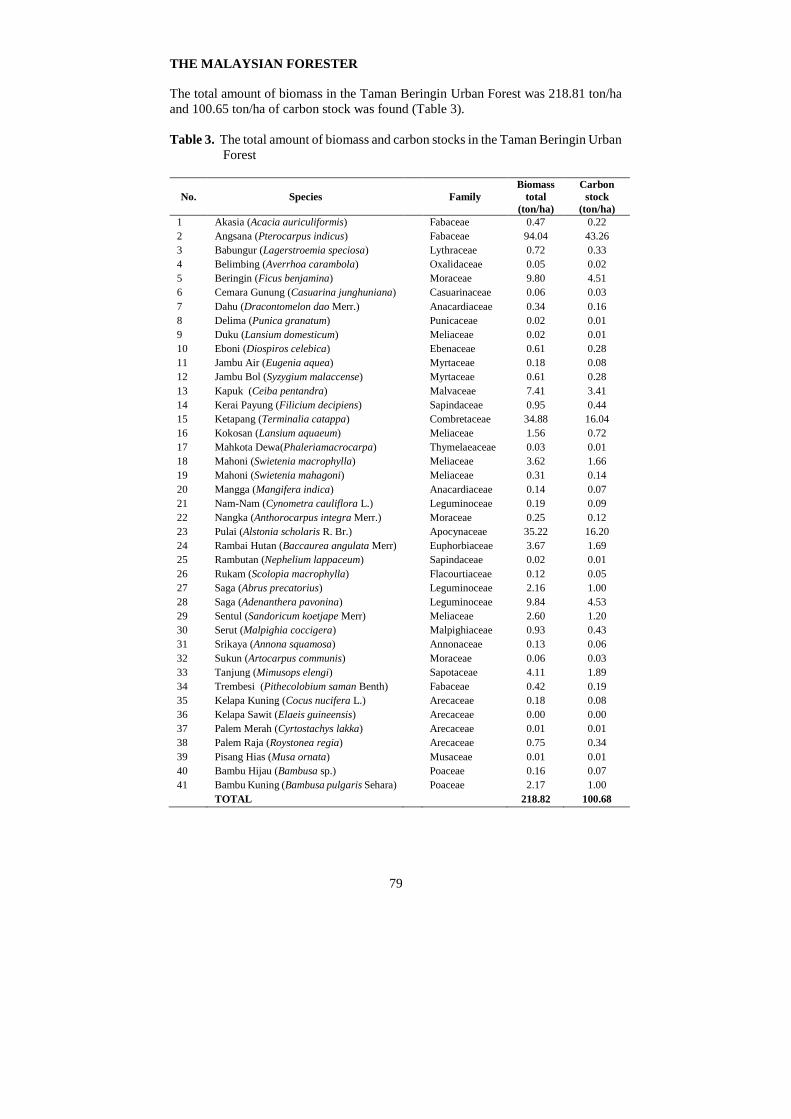
The total amount of biomass in the Taman Beringin Urban Forest was 218.81 ton/ha
and 100.65 ton/ha of carbon stock was found (Table 3).
Table 3. The total amount of biomass and carbon stocks in the Taman Beringin Urban
Forest
No. Species Family
Biomass
total
(ton/ha)
Carbon
stock
(ton/ha)
1 Akasia (Acacia auriculiformis) Fabaceae 0.47 0.22
2 Angsana (Pterocarpus indicus) Fabaceae 94.04 43.26
3 Babungur (Lagerstroemia speciosa) Lythraceae 0.72 0.33
4 Belimbing (Averrhoa carambola) Oxalidaceae 0.05 0.02
5 Beringin (Ficus benjamina) Moraceae 9.80 4.51
6 Cemara Gunung (Casuarina junghuniana) Casuarinaceae 0.06 0.03
7 Dahu (Dracontomelon dao Merr.) Anacardiaceae 0.34 0.16
8 Delima (Punica granatum) Punicaceae 0.02 0.01
9 Duku (Lansium domesticum) Meliaceae 0.02 0.01
10 Eboni (Diospiros celebica) Ebenaceae 0.61 0.28
11 Jambu Air (Eugenia aquea) Myrtaceae 0.18 0.08
12 Jambu Bol (Syzygium malaccense) Myrtaceae 0.61 0.28
13 Kapuk (Ceiba pentandra) Malvaceae 7.41 3.41
14 Kerai Payung (Filicium decipiens) Sapindaceae 0.95 0.44
15 Ketapang (Terminalia catappa) Combretaceae 34.88 16.04
16 Kokosan (Lansium aquaeum) Meliaceae 1.56 0.72
17 Mahkota Dewa(Phaleriamacrocarpa) Thymelaeaceae 0.03 0.01
18 Mahoni (Swietenia macrophylla) Meliaceae 3.62 1.66
19 Mahoni (Swietenia mahagoni) Meliaceae 0.31 0.14
20 Mangga (Mangifera indica) Anacardiaceae 0.14 0.07
21 Nam-Nam (Cynometra cauliflora L.) Leguminoceae 0.19 0.09
22 Nangka (Anthorocarpus integra Merr.) Moraceae 0.25 0.12
23 Pulai (Alstonia scholaris R. Br.) Apocynaceae 35.22 16.20
24 Rambai Hutan (Baccaurea angulata Merr) Euphorbiaceae 3.67 1.69
25 Rambutan (Nephelium lappaceum) Sapindaceae 0.02 0.01
26 Rukam (Scolopia macrophylla) Flacourtiaceae 0.12 0.05
27 Saga (Abrus precatorius) Leguminoceae 2.16 1.00
28 Saga (Adenanthera pavonina) Leguminoceae 9.84 4.53
29 Sentul (Sandoricum koetjape Merr) Meliaceae 2.60 1.20
30 Serut (Malpighia coccigera) Malpighiaceae 0.93 0.43
31 Srikaya (Annona squamosa) Annonaceae 0.13 0.06
32 Sukun (Artocarpus communis) Moraceae 0.06 0.03
33 Tanjung (Mimusops elengi) Sapotaceae 4.11 1.89
34 Trembesi (Pithecolobium saman Benth) Fabaceae 0.42 0.19
35 Kelapa Kuning (Cocus nucifera L.) Arecaceae 0.18 0.08
36 Kelapa Sawit (Elaeis guineensis) Arecaceae 0.00 0.00
37 Palem Merah (Cyrtostachys lakka) Arecaceae 0.01 0.01
38 Palem Raja (Roystonea regia) Arecaceae 0.75 0.34
39 Pisang Hias (Musa ornata) Musaceae 0.01 0.01
40 Bambu Hijau (Bambusa sp.) Poaceae 0.16 0.07
41 Bambu Kuning (Bambusa pulgaris Sehara) Poaceae 2.17 1.00
TOTAL 218.82 100.68
THE MALAYSIAN FORESTER
80
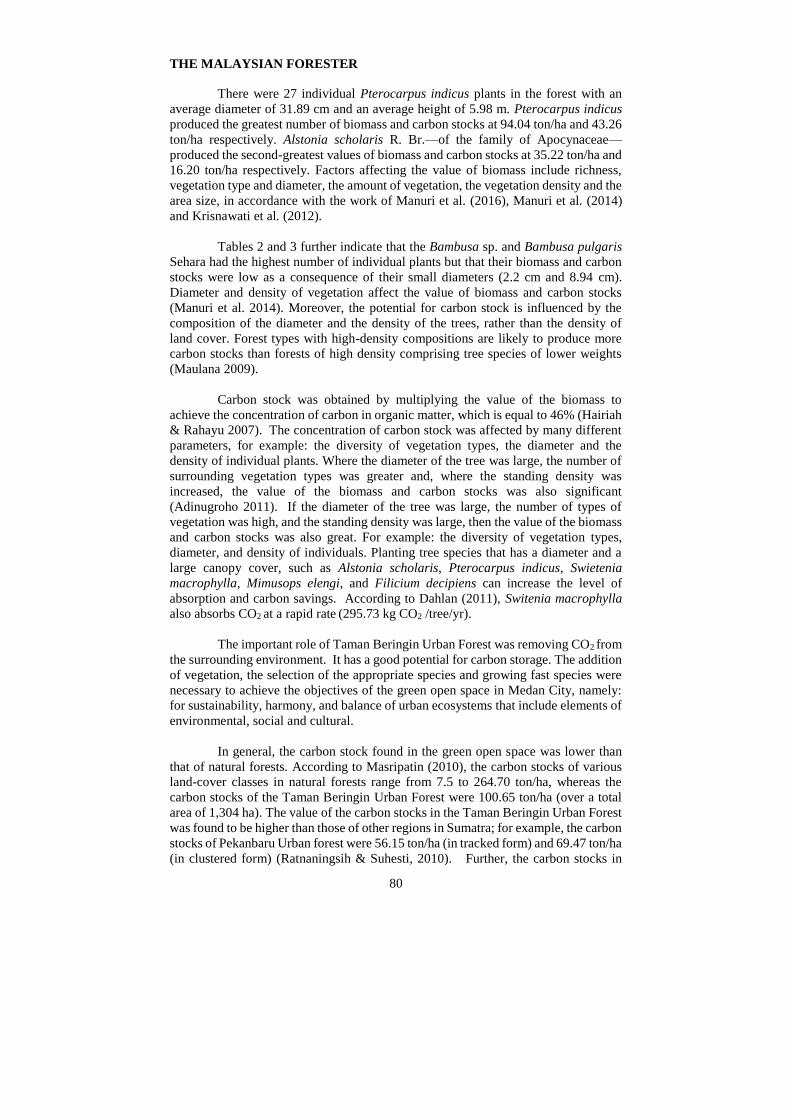
There were 27 individual Pterocarpus indicus plants in the forest with an
average diameter of 31.89 cm and an average height of 5.98 m. Pterocarpus indicus
produced the greatest number of biomass and carbon stocks at 94.04 ton/ha and 43.26
ton/ha respectively. Alstonia scholaris R. Br.—of the family of Apocynaceae—
produced the second-greatest values of biomass and carbon stocks at 35.22 ton/ha and
16.20 ton/ha respectively. Factors affecting the value of biomass include richness,
vegetation type and diameter, the amount of vegetation, the vegetation density and the
area size, in accordance with the work of Manuri et al. (2016), Manuri et al. (2014)
and Krisnawati et al. (2012).
Tables 2 and 3 further indicate that the Bambusa sp. and Bambusa pulgaris
Sehara had the highest number of individual plants but that their biomass and carbon
stocks were low as a consequence of their small diameters (2.2 cm and 8.94 cm).
Diameter and density of vegetation affect the value of biomass and carbon stocks
(Manuri et al. 2014). Moreover, the potential for carbon stock is influenced by the
composition of the diameter and the density of the trees, rather than the density of
land cover. Forest types with high-density compositions are likely to produce more
carbon stocks than forests of high density comprising tree species of lower weights
(Maulana 2009).
Carbon stock was obtained by multiplying the value of the biomass to
achieve the concentration of carbon in organic matter, which is equal to 46% (Hairiah
& Rahayu 2007). The concentration of carbon stock was affected by many different
parameters, for example: the diversity of vegetation types, the diameter and the
density of individual plants. Where the diameter of the tree was large, the number of
surrounding vegetation types was greater and, where the standing density was
increased, the value of the biomass and carbon stocks was also significant
(Adinugroho 2011). If the diameter of the tree was large, the number of types of
vegetation was high, and the standing density was large, then the value of the biomass
and carbon stocks was also great. For example: the diversity of vegetation types,
diameter, and density of individuals. Planting tree species that has a diameter and a
large canopy cover, such as Alstonia scholaris, Pterocarpus indicus, Swietenia
macrophylla, Mimusops elengi, and Filicium decipiens can increase the level of
absorption and carbon savings. According to Dahlan (2011), Switenia macrophylla
also absorbs CO2 at a rapid rate (295.73 kg CO2 /tree/yr).
The important role of Taman Beringin Urban Forest was removing CO2 from
the surrounding environment. It has a good potential for carbon storage. The addition
of vegetation, the selection of the appropriate species and growing fast species were
necessary to achieve the objectives of the green open space in Medan City, namely:
for sustainability, harmony, and balance of urban ecosystems that include elements of
environmental, social and cultural.
In general, the carbon stock found in the green open space was lower than
that of natural forests. According to Masripatin (2010), the carbon stocks of various
land-cover classes in natural forests range from 7.5 to 264.70 ton/ha, whereas the
carbon stocks of the Taman Beringin Urban Forest were 100.65 ton/ha (over a total
area of 1,304 ha). The value of the carbon stocks in the Taman Beringin Urban Forest
was found to be higher than those of other regions in Sumatra; for example, the carbon
stocks of Pekanbaru Urban forest were 56.15 ton/ha (in tracked form) and 69.47 ton/ha
(in clustered form) (Ratnaningsih & Suhesti, 2010). Further, the carbon stocks in

THE MALAYSIAN FORESTER
81
agroforestry at Sei Bingai Subdistrict, Langkat, North Sumatra were 58.438 ton/ha; in
Bahorok Subdistrict, Langkat, North Sumatra, they were 63.005 ton/ha; and in
Wampu Subdistrict, Langkat, North Sumatra, they were 56.76 ton /ha (Malau 2013;
Rauf 2004). Hence, the carbon stocks in the Taman Beringin Urban Forest are capable
of absorbing CO2 from and of providing O2 to Medan City.
CONCLUSION
The Taman Beringin Urban Forest is categorized as ‘spread’. The types of flora in
the forest include trees, ornamental plants and bamboo. Overall, 676 species were
found. The value of the diversity index for the study sites was 2.72. The total amount
of biomass was 218.81 ton/ha and 100.65 ton/ha of carbon stock was found. The
Bambusa sp. and Bambusa pulgaris Sehara had the highest number of individual
plants but that their biomass and carbon stocks were low.
ACKNOWLEDGEMENTS
We are grateful to the University of Sumatera Utara, the organizing committee for the
International Conference on Sustainable Forest Development in View of Climate
Change (SFDCC) 2016 and APAFRI for supporting the presentation of this work on
8-11August 2016, at the Bangi Putrajaya Hotel, Malaysia. We also thank the students
of the Faculty of Forestry at the University of Sumatera Utara who assisted with the
field work.
REFERENCES
Adinugroho, W.C. 2011. Contribute to agroforestry systems to carbon reserves in the
upstream of Bekasi Watershed. Thesis. Bogor Agricultural University.
Bogor.
Arifin, J. 2001. Estimation of carbon storage on different forms of land use in
Ngantang, Malang. Thesis. Brawijaya University. Malang.
Basri, I.S. 2009. The green belt for air pollution control in relation to quality of life in
urban areas. SMARTek Journal 7(2): 113-120.
Berutu, G. 2014. Importance of vegetation role in the green open space to reduce CO2
emissions from transport activity results in highway (a case study of toll road:
Bogor Ring Road, Section I). Accessed on 2016 August 1 from
http://gibranius51e.blogstudent.mb.ipb.ac.id/2014/11/19/
Dahlan, E.N. 2011. The adequacy of urban forests as sinks of CO2 gas to anticipate
the decrease of green open space areas in Bogor City. Forum Geografi 25(2):
164-177.
Environment Agency of North Sumatra Province. 2015. Regional environmental
status in North Sumatra Province. The Environment Agency of North
Sumatra Province, Medan. 122 pp.
THE MALAYSIAN FORESTER
82
Frangi, J.L. & Lugo, A.E. 1985. Ecosystem dynamics of a subtropical flood plain
forest. Ecological Monographs 55:351-369.
Hairiah & Rahayu, S. 2007. Measurement of Carbon Stock in Various Land Use.
World Agroforestry Centre, ICRAF SEA Regional Office. Brawijaya
University. Malang.
Hairiah., Ekadinata, A., Sari, R. & Rahayu, S. 2011. Measurement of carbon stock of
land level to landscape. World Agroforestry Centre, ICRAF SEA Regional
Office. Brawijaya University. Malang.
Irwan, Z.D. 1994. The role of city shape and city structure to environmental quality.
Dissertation. Bogor Agricultural University. Bogor. 73pp.
Kent, M. & Paddy, C. 1992. Vegetation description and analysis: A practical
approach. Belhaven Press, London. 428 pp.
Ketterings, Q.M., Coe, R., Noordwijk, M.V., Ambagau, Y. & Palm, C.A. 2001.
Reducing uncertainty in the use of allometric biomass equations for
predicting above ground tree biomass in mixed secondary forests. Forest
Ecology and Management 146: 199-209.
Krisnawati, H., Adinugroho, W.C. & Imanuddin, R. 2012. Monographs: allometric
models to predict trees biomass in different types of forest ecosystem in
Indonesia. Research and Development Center for Conservation and
Rehabilitation, Forest Research and Development Agency (FORDA). Bogor.
Kumar, B.M., Rajesh, G. & Sudheesh, K.G. 2005. Above ground biomass production
and nutrient uptake of thorny bamboo [Bambusa bambos (L.) Voss in the
home gardens of Thrissur, Kerala. Tropical Agriculture 43 (1-2) : 51-56.
Kusmana, C. 2017. Survey methods and vegetation data interpretation. Bogor: IPB
Press. 68 pp.
Malau, Y. D. P., Rahmawaty. & Riswan. 2013. Carbon stock estimation of above
ground biomass (AGB) in agroforestry land in Langkat. Peronema Forestry
Journal (2) 2: 106-110.
Manuri, S., Brack, C., Nugroho, N.P., Hergoualc’h, K., Novita, N., Dotzauer, H.,
Verchot, L., Putra, C.A.S. & Widyasari, E. 2014. Tree biomass equations for
tropical peat swamp forest ecosystems in Indonesia. Forest Ecology and
Management 334: 241-253.
Manuri, S., Brack, C., Noor’an, F., Rusolono., Anggraini, S.M., Dotzauer, H. &
Kumara, I., 2016. Improved allometric equations for tree aboveground
biomass estimation in tropical dipterocarp forest of Kalimantan, Indonesia.
Forest Ecosystems (2016) 3:28.
THE MALAYSIAN FORESTER
83
Masripatin, N., Ginoga, K., Pari, G. & Dharmawan, W.S. 2010. Carbon reserves in
various forest and plant type in Indonesia. Research and Development Center
on Climate Change and Policy. Bogor: FORDA.
Maulana, S.I. 2009. Carbon density estimation in primary forest in Jayapura, Papua.
Forestry Economic and Social Research (7) 4: 261-274.
Mawazin & Subiakto, A. 2013. Species diversity and composition of logged over peat
swamp forest in Riau. Indonesian Forest Rehabilitation Journal 1(1): 59-73.
Ministry of Law and Human Rights of the Republic of Indonesia. 2007. The Law of
the Republic of Indonesia No. 26 (2007) on spatial planning. Jakarta:
Ministry of Law and Human Rights of the Republic of Indonesia. 95 pp.
Ministry of Public Works. 2008. Guidelines for green open space provision and
utilisation in urban areas. No. 05 / PRT / M / 2008. Jakarta: The Directorate
General of Spatial Planning, Ministry of Public Works. 84 pp.
Ministry of Forestry. 2009. Regulation of the Minister of Forestry of the Republic of
Indonesia No. 71 (2009). The implementation guidelines of urban forest.
Jakarta.
Mugiono, I. S. 2009. Allometric from various type of tree for estimating biomass and
carbon content in community forest. BPKH Wilayah XI Jawa-Madura and
Forest Governance and Multi stakeholder Forestry Programme (MFP II).
Yogyakarta.
Pradiptiyas, D. 2011. Analysis of green open space adequacy as an absorbing CO2
emission in urban using stella program (case study: in North Surabaya and
East Surabaya). Thesis. Environmental Engineering Institute of Teknologi
Sepuluh Nopember Surabaya. Surabaya.
Rauf, A. 2004. Assessment of system and optimization agroforestry land use in
Gunung Leuser National Park buffer zone. Dissertation. Bogor Agricultural
Institute, Bogor.
Rawat, J.S. & Banerjee, S.P. 1996. Urban forestry for improvement of environment.
Energy Environment Monitor 12(2): 109-116.
Regional Development Planning Board of Medan City. 2011. Medan City spatial
management planning related to regional land uses (2011–2031) No. 13
(2011). Regional Development Planning Board of Medan City, Medan. 41
pp.
Shannigrahi, A.S., Sharma, R.C. & Fukushima, T. 2003. Air pollution control by
optimal green belt development for Victoria Memorial Monument, Kolkata
(India). International Journal of Environmental Studies 60(3): 241-249.

THE MALAYSIAN FORESTER
84
Sukoco, M. 1990. Regional planning cartography. Forum Geography. Indonesian
Journal of spatial and Regional Analysis 4 (2):1990.
The Government of the Republic of Indonesia. 2002. The Indonesian Government’s
(2002) Regulation No. 63 about urban forests. Jakarta.
Zmelik, K., Schindler, S. & Wrbka, T. 2011. The European green belt: International
collaboration in biodiversity research and nature conservation along the
former Iron Curtain. Innovation: The European Journal of Social Science
Research 24(3): 273-294.