district database of agricultural statistics - a database management
TRANSCRIPT


District Database of Agricultural Statistics A Database Management System
ICAR - Central Research Institute for Dryland AgricultureSantoshnagar, Hydrabad - 500059
Technical Bulletin 01/2014
B.M.K. Raju, C.A. Rama Rao, K.V. Rao, Josily Samuel, A.V.M. Subba Rao, N. Ravi Kumar, K. Kareemulla, Ravi Dupdal, K.A. Gopinath, K. Ravi Shankar, K. Nagasree, M. Srinivasa Rao,
Manish Tomar, N. Swapna, B. Venkateswarlu, M. Maheswari and Ch. Srinivasa Rao
Citation:Raju B.M.K., Rama Rao C.A., Rao K.V., Josily Samuel, Subba Rao A.V.M., Ravi Kumar N., Kareemulla K., Ravi Dupdal, Gopinath K.A., Ravi Shankar K., Nagasree K., Srinivasa Rao M., Manish Tomar, Swapna N., Venkateswarlu B., Maheswari M. and Srinivasa Rao Ch. 2014. District Database of Agricultural Statistics - A Database Management System. ICAR-Central Research Institute for Dryland Agriculture, Santoshnagar, Hyderabad - 500059, Telangana, India. 42 p.
2014
250 copies
Published byThe Director ICAR-Central Research Institute for Dryland AgricultureSantoshnagar, Hyderabad - 500059Telangana, IndiaPh: 040-24530177, Fax: 040-24531802Email: [email protected]: http://www.crida.in
Cover design : Mr. K V G K Murthy
Disclaimer: Though all precautions were taken to see that the data have been entered, compiled and validated correctly, Central Research Institute for Dryland Agriculture (CRIDA) or the authors of the bulletin assume no responsibility for errors or omissions and accuracy of data. Under no circumstances shall CRIDA or the authors of the bulletin be held liable for any damages, whether direct, incidental, indirect, special, or consequential damages or otherwise arising from use of this data.
Printed at: Balaji Scan Pvt. Ltd., A.C. Guards, Hyderabad. Ph. : 040 - 2330 3424

S.No. Particulars Page No.
Preface v
1 Background 1 2 Estimating district level statistics and targeting development interventions 9
3 Development of database 11
4 Database management system (DBMS) 18
5 Scope and limitations of the database 20
6 References 21
Annexure 23
Contents

Preface
Agricultural research and development planning will be greatly facilitated by having access to information at a scale at which the development planning and administration is done. In India, most of such planning is done at the district level. Considering this, efforts were initiated a few years ago to develop a database of agricultural statistics at the district level and now it is being presented in a user-friendly manner. The database is useful for planning of new development programmes and monitoring the progress made in districts with introduction of developmental programmes/ schemes operated by state and federal governments. The database was designed and built keeping in view of the requirement of scientists engaged in agricultural research, especially those working in socio-economic and policy research and natural resource management in rainfed areas. It will be useful for selecting rainfed regions/ low productivity regions for sample/case studies. The database also aims at meeting information needs of planners and research administrators. We tried to add value to the existing compilations of data in terms of appropriate quality checks and validation. This database also brings together various sources of data for users’ convenience and also lists the districts covered under DPAP/DDP etc. We belive that the planners and researchers will fi nd this information useful. The authors acknowledge with thanks for mutual sharing of data on certain aspects by Dr. P. Parthasarathy Rao, ICRISAT, Hyderabad. We greatly owe to State Directorates of Economics and Statistics and Special Data Dissemination Standard Division, Directorate of Economics & Statistics, Ministry of Agriculture, Govt. of India, India Meteorological Department and Fertiliser Association of India. The authors acknowledge the support received from the project ‘National Initiative on Climate Resilient Agriculture’ in carrying out this work.
August 19, 2014 Authors
1
1. Background
1.1 Need of statistical data for planning and evaluation
In any sphere of life, development is measured in terms of statistics to indicate the extent of economic and social well-being, to serve as a benchmark for future planning, to serve as instruments of monitoring, evaluation and control of on-going programmes, to facilitate spatial and temporal comparisons of development and to serve as a criterion for investment. For design and formulation of any development programme, reliable statistical data are indispensable. A sound database at district level on resources, strengths and opportunities of a district will prove to be handy while targetting various development interventions. It facilatates the planners and administrators in taking informed decissions. The Planning Commission has been focusing on bottom-up approach for developmental planning and emphasizing for formulation of district level plans considering the local resources and needs. In the fi eld of agriculture, planners and administrators often require district level time series information on area sown and production of various crops, crop-wise area under irrigation, land use, rainfall, nutrient use etc. Goverment of India, based on such statistics, designed and launched several area based development programmes from time to time. Some important programmes operated by Govt. of India targetting rainfed areas development and their features are as under.
Drought Prone Area Programme (DPAP) was launched in 1973-74 to address the special problems faced by dryland areas, which encounter frequent droughts. The basic objective of the programme is to minimize the adverse effects of droughts on the production of crops and livestock and improve natural resources like land and water thereby leading to the drought proofi ng of the affected areas. In 1977-78, another special programme viz. Desert Develop-ment Programme (DDP) was started in arid areas of the country. The programme has been conceived as a long term measure for restoration of ecological balance by conserving, devel-oping and harnessing land, water, livestock and human resources. Another programme viz., Rainfed Area Development Programme (RADP) is being implemented as a sub scheme of Rashtriya Krishi Vikas Yojana (RKVY) with the prime objective of increasing agricultural productivity of rainfed areas in a sustainable manner by adopting appropriate farming system based approaches (DAC, 2011). The districts having less than 60% of cultivated area under irrigation and possessing arid (31), semi-arid (133) and sub-humid (175) agro-ecosystems were identifi ed and prioritized for RADP. Backward districts (85) in Kerala & North Eastern States which are under humid agro-eco-systems but having less than 30% cultivated area under irrigation were also covered under the programme. Data like district-wise irrigated and rainfed areas and type of climate are essential for monitoring and evaluation and modifi cation of aforesaid developmental programmes.

2
1.2 Resources of agricultural statistics
The information at district level is mostly available through documents published by state governments. They are often available in scattered form in different sources. Some state governments are making the information available on the internet for use by various stakeholders though such information is related to the recent past. Though such data serve the needs of planners to some extent, planners require historical data as well for understanding the trends. Some important resources and their data coverage are briefed here under.
Directorate of Economics and Statistics (DES), Department of Agriculture & Cooperation, Ministry of Agriculture, Govt. of India: The DES collects, disseminates and publishes statis-tics on diverse facets of agriculture and related sectors required for policy formulation by the government. The dissemination is mainly done through their website http://eands.dacnet.nic.in. It is quite useful to researchers as the data are provided free of cost. Historical data are pro-vided from year 1998-99 onwards, hence largely meets the data needs of various stakeholders. Our study has mostly gathered data from this source. However it is observed that certain state governments make the statistics available before the DES does. Another issue is that, besides data from other sources, data provided by DES were found to have certain quality issues for various reasons. For example one may see in DES data that net irrigated area for Panchkula district of Haryana state for year 2004-05 was much higher than net sown area (23,419 ha). Net irrigated area through tube wells for Kurkshetra district suddenly dips to 2300 ha in 2004-05 from 1,23,400 ha in 2003-04. These errors might have occurred during processing and edit-ing stages. Such inadvertent errors generally happen while dealing with large data sets from various sources. In fact this is one of the reasons for which the present study has been taken up. Other issues with this source of data include data on extent of nutrient use through fertilisers, climate data, etc. are not part of this.
Agricultural Census Division, Department of Agriculture & Cooperation, Ministry of Agri-culture, Govt. of India: Operational holding is taken as the statistical unit of data collection for describing the structure of agriculture. It collects and publishes information on operational holdings. The census is done on quinquennial basis (once in 5 years). So far 8 censuses have been conducted beginning from 1970-71. Ninth agricultural census is going on in the country with 2010-11 as reference year. There are two components involved viz., Agriculture Census and Input Survey. Information is available at http://agcensus.nic.in/. This source was used for gap fi lling in our study (when data for a state for a particular year are not available and agri-cultural census had been conducted with that reference year).
Ministry of Water Resources: Conducts census of minor irrigation schemes and publishes the statistics. Fourth census of minor irrigation was conducted with reference year 2006-07 and data are available at http://micensus.gov.in/
3
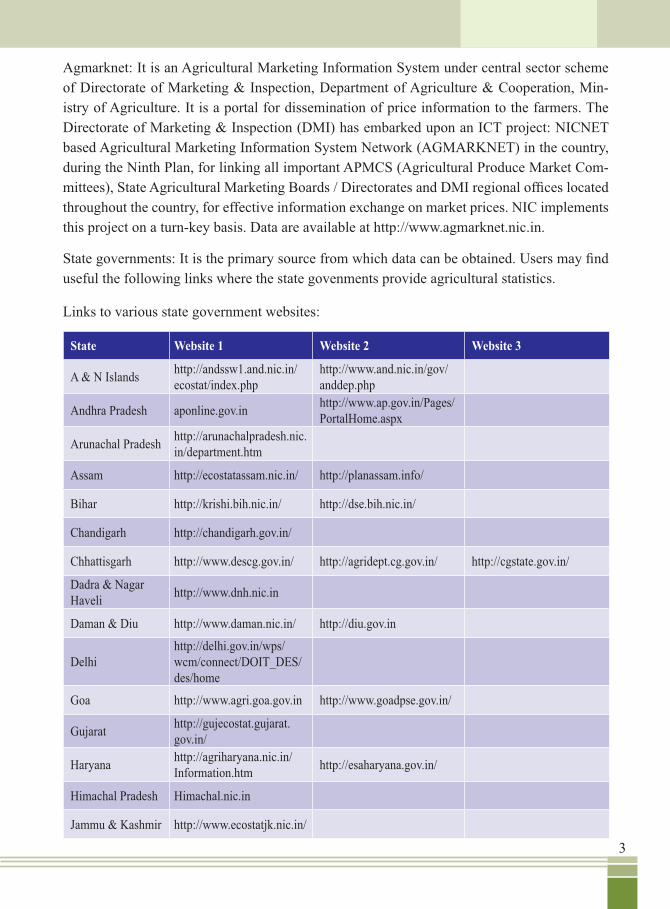
Agmarknet: It is an Agricultural Marketing Information System under central sector scheme of Directorate of Marketing & Inspection, Department of Agriculture & Cooperation, Min-istry of Agriculture. It is a portal for dissemination of price information to the farmers. The Directorate of Marketing & Inspection (DMI) has embarked upon an ICT project: NICNET based Agricultural Marketing Information System Network (AGMARKNET) in the country, during the Ninth Plan, for linking all important APMCS (Agricultural Produce Market Com-mittees), State Agricultural Marketing Boards / Directorates and DMI regional offi ces located throughout the country, for effective information exchange on market prices. NIC implements this project on a turn-key basis. Data are available at http://www.agmarknet.nic.in.
State governments: It is the primary source from which data can be obtained. Users may fi nd useful the following links where the state govenments provide agricultural statistics.
Links to various state government websites:
State Website 1 Website 2 Website 3
A & N Islands http://andssw1.and.nic.in/ecostat/index.php
http://www.and.nic.in/gov/anddep.php
Andhra Pradesh aponline.gov.in http://www.ap.gov.in/Pages/PortalHome.aspx
Arunachal Pradesh http://arunachalpradesh.nic.in/department.htm
Assam http://ecostatassam.nic.in/ http://planassam.info/
Bihar http://krishi.bih.nic.in/ http://dse.bih.nic.in/
Chandigarh http://chandigarh.gov.in/
Chhattisgarh http://www.descg.gov.in/ http://agridept.cg.gov.in/ http://cgstate.gov.in/
Dadra & Nagar Haveli http://www.dnh.nic.in
Daman & Diu http://www.daman.nic.in/ http://diu.gov.in
Delhihttp://delhi.gov.in/wps/wcm/connect/DOIT_DES/des/home
Goa http://www.agri.goa.gov.in http://www.goadpse.gov.in/
Gujarat http://gujecostat.gujarat.gov.in/
Haryana http://agriharyana.nic.in/Information.htm http://esaharyana.gov.in/
Himachal Pradesh Himachal.nic.in
Jammu & Kashmir http://www.ecostatjk.nic.in/

4
State Website 1 Website 2 Website 3
Jharkhand http://desjharkhand.nic.in/
Karnataka http://raitamitra.kar.nic.in/ /ENG/commissioner.asp http://planning.kar.nic.in/
Kerala http://www.keralaagricul-ture.gov.in/
http://www.ecostat.kerala.gov.in/
Lakshadweep http://lakshadweep.nic.in/
Madhya Pradesh http://www.mpkrishi.org/
Maharashtra mahaagri.gov.in
Manipur http://desmani.nic.in/ manipur.gov.in
Meghalaya meghalaya.gov.in http://megplanning.gov.in/
Mizoram http://desmizo.nic.in/
Nagaland nagaland.nic.in
Orissa http://desorissa.nic.in/ http://www.odisha.gov.in/ http://agriodisha.nic.in
Pondicherry http://statistics.puducherry.gov.in/
http://agri.puducherry.gov.in/
Punjab http://www.esopb.gov.in http://pbplanning.gov.in http://agripb.gov.in
Rajasthan http://statistics.rajasthan.gov.in
http://www.krishi.rajasthan.gov.in/
Tamil Nadu http://www.tn.gov.in/deptst/
Telangana http://www.telangana.gov.in/Pages/State_Profi le.aspx
http://aponline.gov.in/tgpor-tal/index.aspx
Tripura http://ecostat.tripura.gov.in/ http://agri.tripura.gov.in/
Uttar Pradesh http://updes.up.nic.in/ spa-trika/spatrika.htm http://planning.up.nic.in/
Uttarakhand http://agriculture.uk.gov.in/ http://des.uk.gov.in/
West Bengal http://www.banglarkrishi. gov.in/ westbengal.gov.in
Though many states publish the statistics annually, some states are not very regular. Dissemination of data through websites is not done by all states. For a given thematic area, the format in which the statistics are provided vary from state to state. The states that provide data through their web sites largely use pdf version fi les. It is time consuming to bring the data sets in pdf versions, downloaded from diffrent state govenment websites, to a common format required for analysis. All these issues make data compilation laborious.
5
1.3 Some compilation works
Some institutions have made an attempt to bring the relavant agricultural statistics at one place.
1.3.1 IndiaAgristat.com: An associate site of indiastat.com, a website of Datanet India Pvt. Ltd. It covers district-wise data on many aspects of agriculture. Subscribers are given access to information on payment basis. It provides required statistics to its customers on query mode. It was observed that the statistics provided are not up to date in many thematic areas of agriculture. Another drawback is that the information is provided in a report format which cannot be directly used for further analysis. Compilation for carrying out further analysis necessitates data entry.
1.3.2 CMIE: Centre for Monitoring Indian Economy (CMIE) Pvt. Ltd. is headquartered in Mumbai, India. They provide information solutions in the form of databases and research reports. CMIE has built database on the Indian economy and companies. Agriculture section is named as Indian Harvest which is a database of a variety of crops cultivated in India. It provides data on agricultural inputs and outputs. The database is disaggregated up to the district level. The subscribers are given access to their database after making necessary payment. The ‘Indian Harvest’ databases were found to have data gaps and data are not up to date on various themes.
1.3.3 CRIDA-ICRISAT database: A district database covering (maximum of) 19 states has been developed by CRIDA-ICRISAT in 2006. The database included data from 1990-91 to latest available data during 2006 (not later than 2004). Another limitation has been that the data of north eastern states, Jammu & Kashmir and Union Territories were not included.
1.4 Genesis and need for the present study
When we were preparing the list of districts in which DPAP and DDP programmes were in operation, we came across certain DPAP/DDP districts where substantial expansion occurred in irrigation (as per latest statistics). As the programmes target rainfed areas with dry climates, we wanted to review the eligibility of various districts to these progrmmes in the light of latest statistical data.
Ministry of Rural Development (MoRD) in 1993 constituted a technical committee under the chairmanship of prof. C.H. Hanumantha Rao to review the DPAP and DDP programmes. The committee developed a criterion based on moisture index and share of net irrigated area to net sown area to identify districts to be covered under DDP and DPAP (MoRD, 1994). According to this criterion, the districts where arid ecosystem exists (moisture index value less

6
than –66.7) and net irrigated area is not more than 50% were eligible to be covered under DDP. The districts with semi-arid ecosystem (with moisture index range –66.7 to –33.3) and net irrigated area not more than 40% were made eligible for coverage under DPAP. The districts with dry sub-humid ecosystem and net irrigated area not more than 30% were also made eligible for coverage under DPAP. The committee considered certain districts for DPAP on exceptional grounds viz., non semi-arid / dry sub-humid districts having blocks with irrigation less than 10% and/or resource degradation was due to high slopes and less developed Bundelkhand / Vindhya districts. Similarly districts having blocks with serious resource degradation, movement of sand and heavy sand deposits in agricultural fi elds and water bodies were considered for DDP. The districts that became ineligible were allowed to continue till the completion of the programme. The committee made a number of recommendations and formulated a set of guidelines that brought DDP, DPAP and Integrated Wastelands Development Programme (IWDP) under a single umbrella called Integrated Watershed Management Programme (IWMP) in 2009-10. The programme is now being implemented as per Common Guidelines for Watershed Development Projects-2008 (NRAA, 2011). The guidelines view the watershed development as an important vehicle to development of wastelands, drought-prone areas and desert areas.
It was found that the MoRD (1994) used the climate assessed at district level by Krishnan (1988) study. The climatic classifi cation given by Krishnan (1988) was based on moisture index of Thornthwaite and Mather (1955) computed using annual average data of rainfall and potential evapotranspiration (PET). The climatic data sets used were related to the period earlier to 1970. The rainfall data used referred to period 1901-1950. Climate change literature pertaining to India showed enough evidence of rising mean temperatures during post-1970 period. Krishna Kumar et al. (2011) observed greater warming (mean annual surface air temperature) of 0.21°C/10 years during post-1970 period as compared to 0.51°C/100 years during the past century. They also observed that all India average monsoon rainfall was trendless over an extended period starting from year 1871 barring signifi cant spatial variations found at division level. Rajeevan and Bhate (2008) provided daily rainfall data for the period 1971-2005 at a spatial resolution of 0.5° x 0.5° grids using data of about 6000 raingauge stations spread all over the country. Potential evapotranspiration data referring to the period 1971–2005 was published by India Meteorological Department (IMD, 2008) for fairly distributed 144 locations in India. As per Govt. of India (2012) statistics, net irrigated area (NIA) as percent of net sown area (NSA) in India rose from 33.58 during 1990-91 to 45.18 during 2009-10. Considering the observed changes in climate and availability of climate data for 1971-2005 which can be brought to district level in GIS environment and the investments made in expanding irrigation, it was thought appropriate to revisit the eligibility of districts to DPAP and DDP as per the criteria given by C.H. Hanumantha Rao committee. It would facilitate the extension of support to those districts that may now meet the requirements to be included in these programmes.

7
While gathering and compiling data on net sown area and net irrigated area at district level, we came across several online resources which provide district level agricultural statistics on various thematic areas. Another thing was that some issues related to quality were observed in the data made available through various resources including print and online. The existing database compilations were found to have huge spatial gaps. If information covering all districts is available at one place, it is out dated. The districtwise data that refer to latest years are available in scattered form. But these statistics are needed for decision making while formulating commodity and area based development programmes. Another issue with the data available online is that the servers at host organisations may, at times, be down for various reasons. In view of this, an attempt was made to bring the important agricultural statistics at one place and compile, integrate, validate and present upto-date statistics in a user friendly and further usable database format for use of the stakeholders in a database management system.
The authors also wanted to document the resources available online for use of young researchers who may fi nd it useful to access various statistics related to agriculture at fi nger tips. Further, we could not provide district-wise climate assessed in the present study based on recent climatic data sets and irrigation statistics in peer reviewed papers published in journals viz.,Current Science and Economic and Political Weekly for limitation on length of article. The district-wise climate and share of irrigated area were provided in the aforesaid papers in the form of maps only. But it is diffi cult for the stakeholders to identify climate of each district from the map (especially for smaller districts). Therefore, it was also intended to provide these details in this bulletin.
The coverge of thematic areas include districtwise time series statistics of net sown area, net irrigated area, source-wise net irrigated area, area sown, production and yield of major rainfed crops, extent of area sown with irrigation in a given crop, land use classifi cation (9 fold), monthly rainfall and extent of nutrient (N, P and K) use through fertilisers. These statistics would be made available through a single window to administrators, planners, researchers and other stake holders of agriculture. We present in this publication a description of the variables included in the database, the source of information and measurement units so that the information is appropriately used.
Rainfed agriculture occupies a prominent place in Indian economy, food security and rural livelihoods. At present, about 55% of the total net sown area is rainfed, contributing 40% of the total foodgrain production and supporting 60% of livestock population. Therefore, while developing the database, an attempt was made to segregate the districts with reference to the development programmes like DPAP/DDP or RADP which have relevance to rainfed agriculture. Hence the database developed in the study presents district-wise time series information specifying clearly whether the district was covered under DPAP /DDP programmes.

8
This enables the users of the database to study the development in DPAP/DDP districts over years as revealed by statistics and make comparison between DPAP/DDP and non-DPAP/DDP districts. The present database distinguishes the districts covered under RADP while providing time series data of districts. The districts in which DPAP, DDP and RADP are in operation are furnished in Annexure (including the districts considered for DPAP and DDP on exceptional grounds).
The present study was carried out under a project entitled ‘Development of a database of rainfed districts’. Initially it was planned to develop the database for rainfed districts alone. Though several researchers demarcated rainfed districts based on parameters like rainfall, irrigation, climate etc. (Bapna et al., 1981; Rangaswamy, 1981; Jodha, 1985; Subbarao, 1985; Shah and Shah, 1993; Thorat, 1993), there was no single criterion agreed upon. The reason being all of these defi nitions suffer from the inability to distinguish between rainfed and irrigated agriculture within districts. Another problem is that the rainfall and irrigation thresholds are defi ned somewhat arbitrarily. Considering the fact that there is no universally accepted defi nition of rainfed district, we chose to include in the database all the districts for which the information is available and fl agged the districts where developmental programmes like DPAP, DDP, RADP, which have relevance to rainfed agriculture, are in operation. Besides, district level data on average annual rainfall (mm) and average net irrigated area as per cent of net sown area were furnished in the Annexure. The users may have their own criteria as per their context. Dryland regions, on the other hand, were defi ned by United Nations Convention to Combat Desertifi cation (UNCCD) based on aridity index (UNCCD, 1994). The present study computed the aridity index for each district and identifi ed the dryland districts. The annexure provided at the end accommodates this information too.

9
2. Estimating district level statistics and targeting development interventions
2.1 Assessing Climate at district level
The daily rainfall data for the period 1971-2005 published by Rajeevan and Bhate (2008) at a spatial resolution of 0.5° x 0.5° grid have been used in the study. Data of about 6000 raingauge stations spread all over the country were used in developing it. Potential evapotranspiration (PET) data referred to the period 1971–2005 published by IMD (2008) for fairly distributed 144 locations in India have been used in the study. The PET was computed using FAO recom-mended Penman-Monteith equation (FAO, 2008). Average of annual rainfall was computed for each grid point within the national boundary. The infl uential area of a grid point was com-puted using Thiessen polygon method in a GIS environment. Further, area of different poly-gons falling in a district was also derived. Rainfall value at district level was estimated using the weighted average of rainfall, with weights proportional to area of polygons falling within that district. As the data of PET for 144 stations were provided as annual average (1971-2005), hence directly brought to GIS environment using their latitude and longitude values. Spatial variability in PET being low, PET values for regular grid of 0.5° x 0.5° were estimated from 144 stations’ data using inverse distance weighting interpolation method. The PET values at district level were estimated using area weighted average as done in case of rainfall.
2.1.1 Climate based on moisture index (Thornthwaite and Mather, 1955)
The rainfall and PET values derived for each district as above were put in to the formula of moisture index given by Thornthwaite and Mather (1955) and simplifi ed by Krishnan (1992) using annual averages as shown below:
Where MI = Moisture index, P = Average annual rainfall, and PET = Average annual potential evapotranspiration. Further, the climate prevailing in each district was assessed as under:
Value of MI Climatic zone< -66.7 Arid-66.6 to -33.3 Semi-arid-33.3 to 0 Dry sub-humid0 to + 20 Moist sub-humid+20.1 to + 99.9 Humid100 or more Per-humid
The annual rainfall (average of 1971-2005) and climate assessed as above are furnished for each district in the Annexure.
MI =[ ](P-PET)PET 100

101 For certain districts, data were available for one year only which was taken as it is without averaging.
2.1.2 Dryland climate as per UNCCD (1994) defi nition
Often the terms ‘drylands’ and ‘rainfed regions’ are used synonymously. Though they overlap to a large extent, rainfed area is a piece of agricultural land hav-ing no source of irrigation including groundwater. UNCCD defi nes drylands based on aridity index (Ia) computed as ratio of mean annual precipitation (P) to mean annual potential evapotranspiration (PET). Ac-cordingly, areas with arid (Ia = 0.05-0.20), semi-arid (Ia = 0.20-0.50) and dry sub-humid (Ia = 0.50-0.65) climates are termed as drylands (UNCCD, 1994). Drylands having restricted access to irrigation will become drought prone. Aridity index was computed using the district level annual rainfall and PET data. Districts having dryland climates (UNCCD, 1994) were identifi ed based on the value of aridity index (Fig. 1). The information is also furnished in An-nexure. Net sown area (mostly average of two years: 2007-08, 2008-09) of districts with dryland climates (UNCCD) adds up to 85 m ha (approximate).
2.2 Revisiting drought prone districts in India
As per the dual criteria of MoRD (1994), besides climate based on moisture index, percent irrigated area to net sown area was required at district level to review the eligibility of districts to DPAP / DDP. Net sown area and net irrigated area statistics of latest two years for which data are available (mostly 2007-08 and 2008-09) were used for the study. Average irrigation statistics1 for the two years and climate assessed as per section 2.1.1 above [published by Raju et al. (2013)] based on recent data sets were fi nally employed in the dual criteria and eligibility of districts to DPAP / DDP was evaluated (Venkateswarlu et al., 2014). District level data on net sown area and net irrigated area were collected from various sources including Department of Agriculture and Cooperation, GoI; Agricultural Census, GoI; State Bureaus/ Directorates of Economics and Statistics; State Planning Departments via State government websites, District websites, CMIE, Ministry of Water Resources etc. For the perusal of readers, percent net irrigated area to net sown area (average of 2007-08 and 2008-09) and the programme to which a district qualifi es as per MoRD (1994) criteria are given in Annexure.
Fig. 1 Districts with dryland climates as per UNCCD defi nition

11
3. Development of database
District-wise time series data were congregated from various sources as given in section-1 covering thematic areas viz., net sown area, net irrigated area, source-wise net irrigated area, area sown, production and yield of major crops, extent of area sown with irrigation in a given crop, land use classifi cation (9 fold), monthly rainfall and extent of nutrient (N, P and K) use through fertilisers.
The database was designed and built in MS-Access platform. It is chosen for its simplicity, user friendliness, and omnipresence. The volume of the data and the number of records does not demand special platform like SQL or Oracle. The number of crops included in the data-base were 27. Following the database principle of normalization, crop was considered as a variable. Otherwise we should have 27 variables, one for each crop. For each crop there were 4 crop based variables. If each crop is considered as a variable, it leads to a total of 27x4 vari-ables. After compiling the data on various thematic areas, it was visualized that the identifi -cation particulars were either district-year or district-crop-year. In view of this, the data were organized into two modules, viz. Crop Statistics and Input & Land Use Statistics. Regarding coding schema the numeric codes allotted to states and districts by Registrar General of India for population census were adopted. New states/districts carved out were given new codes such that uniqueness of codes is maintained. Numeric codes were allotted to crops also. Mas-ter tables were created for identifying state/UT, district and crop using numeric codes.
Crop-wise, district-wise and year-wise area sown, production and yield statistics were pro-vided in ‘Crop Statistics’ module. The other module includes district-wise and year-wise land use classifi cation (9-fold), source-wise net irrigated area, use of nutrients like N, P & K per ha of gross sown area and net sown area, extent of irrigated area to net sown and gross sown area and monthly rainfall. Though data on crop-wise area under irrigation pertain to input & land use statistics, the parameter was included in Crop Statistics module. The authors were of the opinion that users may have convenience in having this parameter along with area sown under the crop and compute district-wise share of irrigated area in area sown under a crop.
3.1 Details of data coverage
Time series data for each district were provided from 1998-99 to latest available year (mostly 2010-11). However monthly rainfall data were provided for the period 1971 - 2005.

12
Variable Description
State State Name
District District Name
DPAP_DDP_Status District status- DPAP/DDP/Blank (none of them)
RADP_Status District status- RADP or Blank (non RADP)
Year Agricultural Year*
Crop Crop Name
*Year was specifi ed as agricultural year (e.g.: 2006-07). However monthly rainfall data were provided for calendar years.
3.1.1 Crop Statistics
The coverage of statistics include crop-wise area sown (ha), production (ton), yield (kg/ha) and area sown with irrigation (ha). The user may select a crop of his/her choice and retrieve data from 1998-99 to latest available year for one or all districts of a state of his/her interest.
The coverage of crops is as under:
Cereals Pulses Oilseeds Others
Rice Chickpea Groundnut Cotton
Wheat Pigeonpea Sesamum Jute
Sorghum Blackgram Linseed Mesta
Pearlmillet Greengram Rapeseed & Mustard Tobacco
Maize Lentil Sunfl ower Sugarcane
Fingermillet Soybean Chillies (dry)
Barley Saffl ower
Castor
Niger
Variables pertaining to identifi cation particulars and their details are listed below.
13
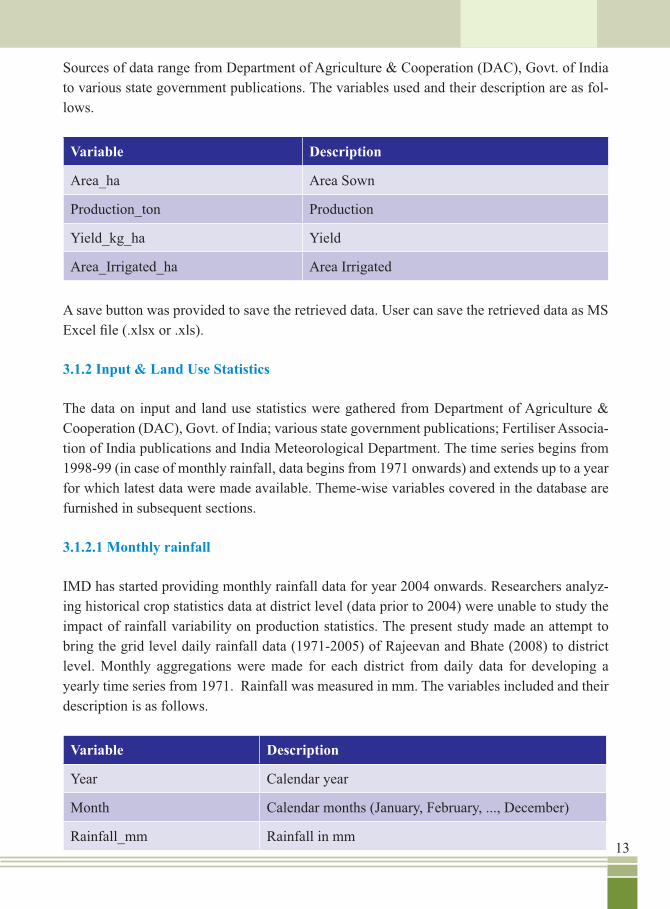
Sources of data range from Department of Agriculture & Cooperation (DAC), Govt. of India to various state government publications. The variables used and their description are as fol-lows.
Variable Description
Area_ha Area Sown
Production_ton Production
Yield_kg_ha Yield
Area_Irrigated_ha Area Irrigated
A save button was provided to save the retrieved data. User can save the retrieved data as MS Excel fi le (.xlsx or .xls).
3.1.2 Input & Land Use Statistics
The data on input and land use statistics were gathered from Department of Agriculture & Cooperation (DAC), Govt. of India; various state government publications; Fertiliser Associa-tion of India publications and India Meteorological Department. The time series begins from 1998-99 (in case of monthly rainfall, data begins from 1971 onwards) and extends up to a year for which latest data were made available. Theme-wise variables covered in the database are furnished in subsequent sections.
3.1.2.1 Monthly rainfall
IMD has started providing monthly rainfall data for year 2004 onwards. Researchers analyz-ing historical crop statistics data at district level (data prior to 2004) were unable to study the impact of rainfall variability on production statistics. The present study made an attempt to bring the grid level daily rainfall data (1971-2005) of Rajeevan and Bhate (2008) to district level. Monthly aggregations were made for each district from daily data for developing a yearly time series from 1971. Rainfall was measured in mm. The variables included and their description is as follows.
Variable Description
Year Calendar year
Month Calendar months (January, February, ..., December)
Rainfall_mm Rainfall in mm

14
3.1.2.2 Land use classifi cation (9 fold)
Land use was reported in ha. The variables and their description are as follows.
Variable Description
Forest_ha Forest area
Non_agril_uses_ha Area under non agricultural uses
Barren_Unculturable_Land_ha Barren and un-culturable land
PermanentPastures_other_grazing_lands_ha Permanent pastures and other grazing lands
MiscTreeCrops_groves_ha Land under miscellaneous tree crops and groves not included in net sown area
Cultivable_waste_ha Culturable waste land
Fallow_lands_other_than_current_fal-lows_ha Fallow lands other than current fallows
Current_Fallows_ha Current fallow
Net_area_sown_ha Net area sown
3.1.2.3 Nutrient use
District-wise use of nitrogen (N), phosphorous (P) and potassium (K) nutrients are published every year by Fertiliser Association of India. It would be more useful if the information is presented as per ha use of these nutrients in various districts. Reporting nutrient use per ha of net sown area would be misleading in districts where cropping intensity is high. Hence the parameter was considered from both net and gross sown area perspectives. The variables used and their description are as follows.
Variable Description
Nitrogen_kg_per_ha_nsa Nitrogen (N) use (kg) per ha of net sown area
Phosphorus_kg_per_ha_nsa Phosphorus (P) use (kg) per ha of net sown area
Potassium_kg_per_ha_nsa Potassium (K) use (kg) per ha of net sown area
Total_NPK_kg_per_ha_nsa N+P+K use (kg) per ha of net sown area
Nitrogen_kg_per_ha_gsa Nitrogen (N) use (kg) per ha of gross sown area

15
Variable Description
Phosphorus_kg_per_ha_gsa Phosphorus (P) use (kg) per ha of gross sown area
Potassium_kg_per_ha_gsa Potassium (K) use (kg) per ha of gross sown area
Total_NPK_kg_per_ha_gsa N+P+K use (kg) per ha of gross sown area
3.1.2.4 Source-wise irrigated area
The breakup of net irrigated area into surface water and groundwater sources adds value in terms of assurance. The statistics were reported with further breakup of canals, tanks and oth-ers under surface water irrigation, and tube wells and others under groundwater irrigation. The area statistics were reported in ha. The variables used and their description are as follows.
Variable Description
Canals_ha Area irrigated from canals
Tanks_ha Area irrigated from tanks
Others_Surface_irrig_ha Area irrigated from other sources of surface water
TubeWells_ha Area irrigated from tube wells
Others_groundwater_ha Area irrigated from other sources of groundwater
Unspecifi ed_Sources_ha Area irrigated from unspecifi ed sources
Total_ha Total net irrigated area
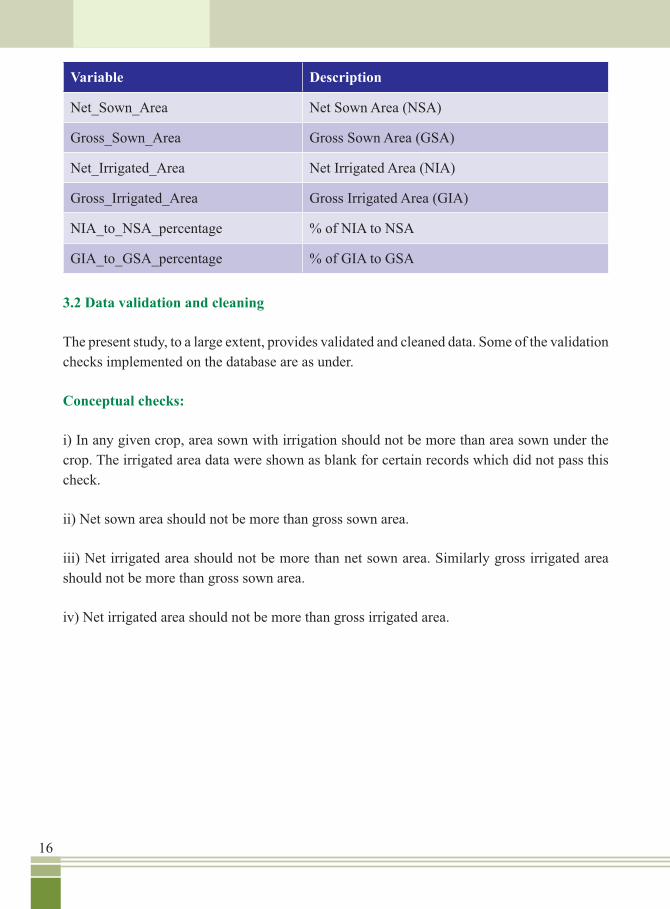
3.1.2.5 Extent of irrigation
Most sought information especially in dryland areas has been the extent of area sown with access to irrigation. This has been a criterion in all developmental programmes like DPAP/DDP or RADP pertinent to rainfed areas. The area statistics were reported in ha and shares as percentage. The variables used and their description are as follows.
16
Variable Description
Net_Sown_Area Net Sown Area (NSA)
Gross_Sown_Area Gross Sown Area (GSA)
Net_Irrigated_Area Net Irrigated Area (NIA)
Gross_Irrigated_Area Gross Irrigated Area (GIA)
NIA_to_NSA_percentage % of NIA to NSA
GIA_to_GSA_percentage % of GIA to GSA
3.2 Data validation and cleaning
The present study, to a large extent, provides validated and cleaned data. Some of the validation checks implemented on the database are as under.
Conceptual checks:
i) In any given crop, area sown with irrigation should not be more than area sown under the crop. The irrigated area data were shown as blank for certain records which did not pass this check.
ii) Net sown area should not be more than gross sown area.
iii) Net irrigated area should not be more than net sown area. Similarly gross irrigated area should not be more than gross sown area.
iv) Net irrigated area should not be more than gross irrigated area.

17
Checks based on admissible range:
The cases with per ha nutrient consumption (N+P+K) as more than 500 kg/ha were fl agged with ‘*’ to exercise caution before using them.
Computational checks:
i) Yield computed from production and area sown should not differ much from yield statistics published. Slight difference may be attributed to rounding off.
Consistency with time series:
i) When area sown under a crop in a year was less than half or more than double as compared to previous year value (for records with area sown > 10,000 ha), the records were fl agged with ‘*’ to exercise caution. The difference may be due to carving out of a new district (at times). Similar cautions were made for other variables like crop-wise irrigated area, net sown area, net irrigated area etc. (for records having respective area statistics in previous year as > 10,000 ha). Users may have a relook before using them. In case of nutrient use per ha, the records where change per year was more than double or less than half were fl agged (as compared to previous record having area sown > 10,000 ha and nutrient use per ha > 10 kg).
Few records which were not conforming to the validation program were verifi ed in alternate sources of data and corrected accordingly. If alternate sources also provide same statistics, the records were either skipped from the database or fl agged for caution.

18
4. Database management system (DBMS)
The front end of the DBMS was designed using VB.Net and the application runs on .net framework 4.0. The DBMS asks the user to choose either ‘Crop Statistics’ or ‘Input & Land Use Statistics’.
Crop Statistics module looks as under.
A screen shot of Input & Land Use Statistics module showing various thematic areas for which data were made available is as follows.

19
Screenshot for theme ‘Monthly Rainfall’ and data retrieved after selecting State: Andhra Pradesh, District: Anantapur, From Year: 1971, To Year: 2005 and clicking ‘Submit’ button looks as under.
We can see a ‘save’ button at the top of retrieved data. User can save the retrieved data as MS Excel fi le (.xlsx or .xls) as shown below.

20
5. Scope and limitations of the database
The database is primarily meant for planners and research managers shaping agricultural research and development. This database will be useful to the stakeholders only when it is regularly updated (at least once in a year). It facilitates the planners and policy makers to monitor the progress of districts after introduction of specifi c developmental programmes like DPAP/DDP, RADP etc. It will also help the policy makers in targeting the on-going programmes or formulating new development programmes. Users of the data may quote the source of data as the primary source mentioned in the document.
The district-wise data may not be used for arriving at state fi gures by aggregating districts’ data. Necessary apportioning of data has to be carried out for time series analysis, depending upon the beginning year of a series, for districts which have undergone reorganization. The district master may contain mother district and the districts carved out of it. The statistics may have been reported for mother district up to a certain year and for newly carved out districts afterwards. Data validation checks on the basis of upper bound were used in case of nutrient use data. Some statistics included in the database which may look unrealistic are fl agged for caution.
Agriculture being a subject of rural areas, urban districts like Mumbai, Hyderabad, Kolkata and Chennai and UTs like Chandigarh and Lakshadweep and the NCT of Delhi, were not considered in the study. The UTs included in the study were considered as single entities (like single district state) depending upon data availability. Though Telangana and Andhra Pradesh were shown as separate states, the data of Khammam district refer to erstwhile Andhra Pradesh.
21
6. References
Bapna, S L, H Binswanger and J Quizon (1984) Systems of output supply and factor demand equations for semi-arid tropical India. Indian Journal of Agricultural Economics 39 (2): 179-202.
DAC (2011) Guidelines for Rainfed Area Development Programme (RADP), Department of Agriculture & Cooperation, Ministry of Agriculture, Govt. of India, New Delhi.
FAO (1998) Crop evapotranspiration, FAO Irrigation and Drainage Paper No.56, FAO, Rome, Italy.
Govt. of India (2012) Land Use Statistics at a glance- State wise: 2000-2001 to 2009-10. Directorate of Economics and Statistics, Dept. of Agriculture & Cooperation, Ministry of Agriculture, Govt. of India, New Delhi.
IMD (2008) Estimation of Weekly Potential Evapotranspiration and Climatic Soil Water Balance for 144 locations in India. Division of Agricultural Meteorology, India Meteorological Department, Pune, p. 294.
Jodha, N S (1985) Development Strategy for rainfed agriculture: Possibilities and constraints. Economics Program, ICRISAT.
Krishnan, A (1988) Delineation of soil climatic zones of India and its application in agriculture. Fertiliser News, 33: 11-19.
Krishnan, A (1992) Climatic Classifi cation and Agricultural Droughts. In: Crops and Weather (eds. Venkataraman, S and A Krishnan). New Delhi: Publications and Information Division, Indian Council of Agricultural Research, p.458-508.
MoRD (1994) Report of the Technical Committee on Drought Prone Areas Programme and Desert Development Programme, Ministry of Rural Development, Govt. of India, New Delhi, p.73.
NRAA (2011) Common Guidelines for Watershed Development Projects-2008, National Rainfed Area Authority, Planning Commission, Govt. of India, New Delhi, p.59.
Rajeevan, M and J Bhate, (2008) A high resolution daily gridded rainfall data set (1971-2005) for mesoscale meteorological studies. National Climate Centre Research Report 9/2008, India Meteorological Department, Pune, p. 12.

22
Raju, B M K, K V Rao, B Venkateswarlu, A V M S Rao, C A Rama Rao, V U M Rao, B Bapuji Rao, N Ravi Kumar, R Dhakar, N Swapna and P Latha (2013) Revisiting climatic classifi cation in India: a district level analysis, Current Science 104(4): 492-495.
Rangaswamy, P (1981) Economics of dry farming in drought prone areas: A case study of Hissar in Haryana. Research Study No. 81/1. Agricultural Econocomics Research Centre, University of Delhi.
Shah, A, and D C Shah (1993) Dryland farming under the changing source environment: A case study of Gujarat. Artha Vijnana 35 (3) (September).
Subbarao, K (1985) Institutions, infrastructure and regional variations in India’s input delivery system. In: Agricultural Markets in the Semi-Arid Tropics: Proceedings of the International Workshop, October 24-28, 198. Patancheru, India: ICRISAT.
Thornthwaite, C W and J R Mather (1955) The water balance, Publications in climatology Vol. 8, No . 1, Drexel Institute of Technology, Laboratory of Climatology, Centerton, N.J., p. 104.
Thorat, S K (1993) Technological Change and Regional Differentiation. New Delhi: Khama Publishers.
UNCCD (1994) United Nations Convention to Combat Desertifi cation in those countries experiencing serious drought and/or desertifi cation. Paris.
Venkateswarlu B, B M K Raju, K V Rao and C A Rama Rao (2014) Revisiting Drought Prone Districts in India. Economic & Political Weekly 49(25): 71-75.
23
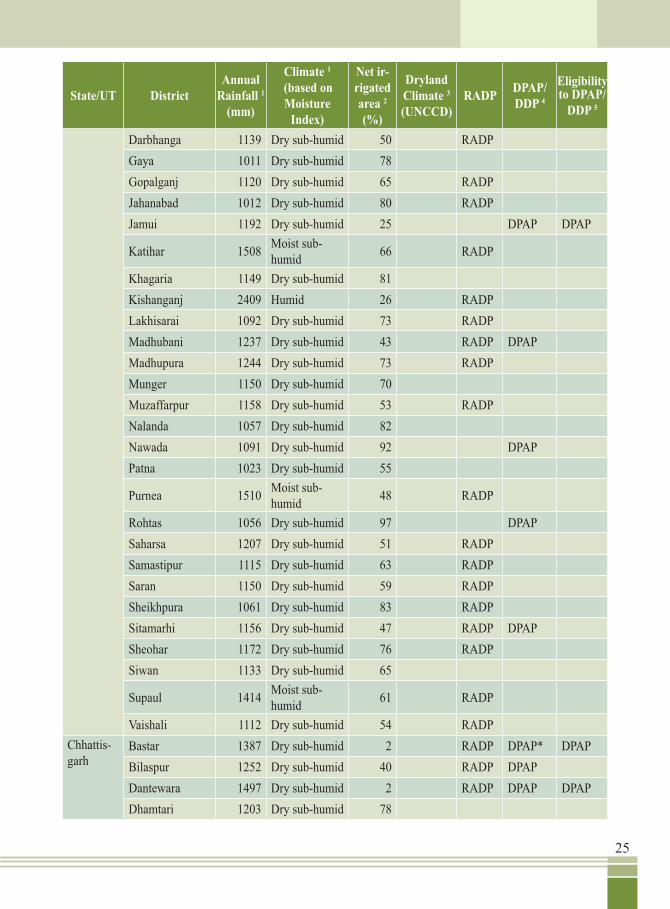
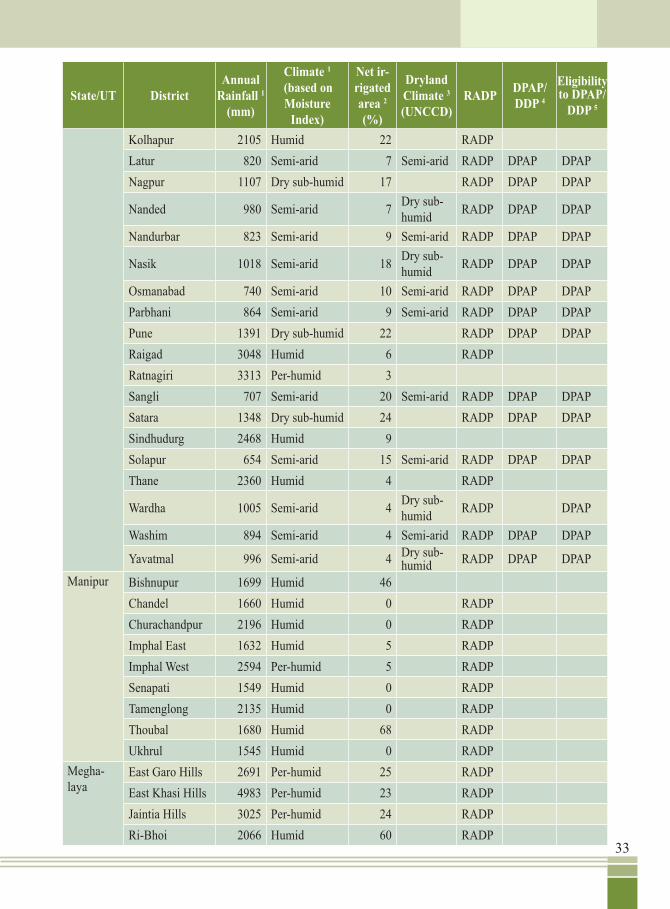
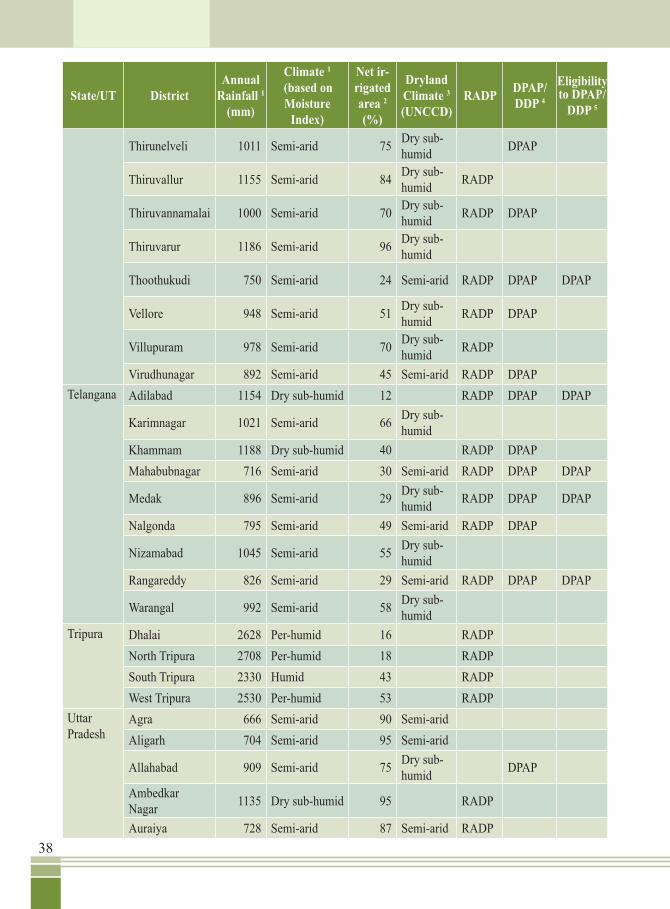
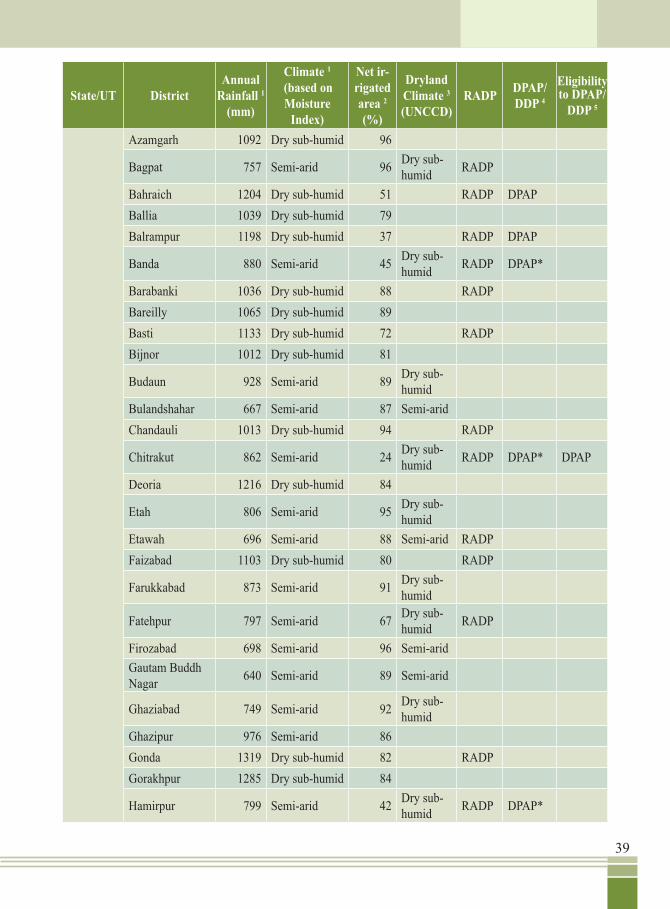
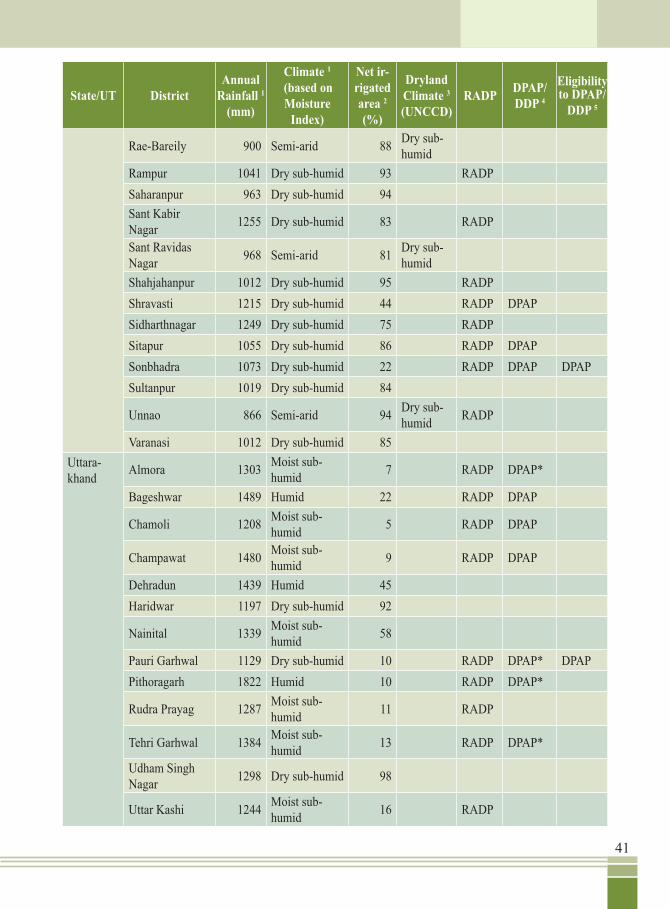
State/UT DistrictAnnual
Rainfall 1 (mm)
Climate 1
(based on Moisture
Index)
Net ir-rigated area 2 (%)
Dryland Climate 3 (UNCCD)
RADP DPAP/DDP 4
Eligibility to DPAP/
DDP 5
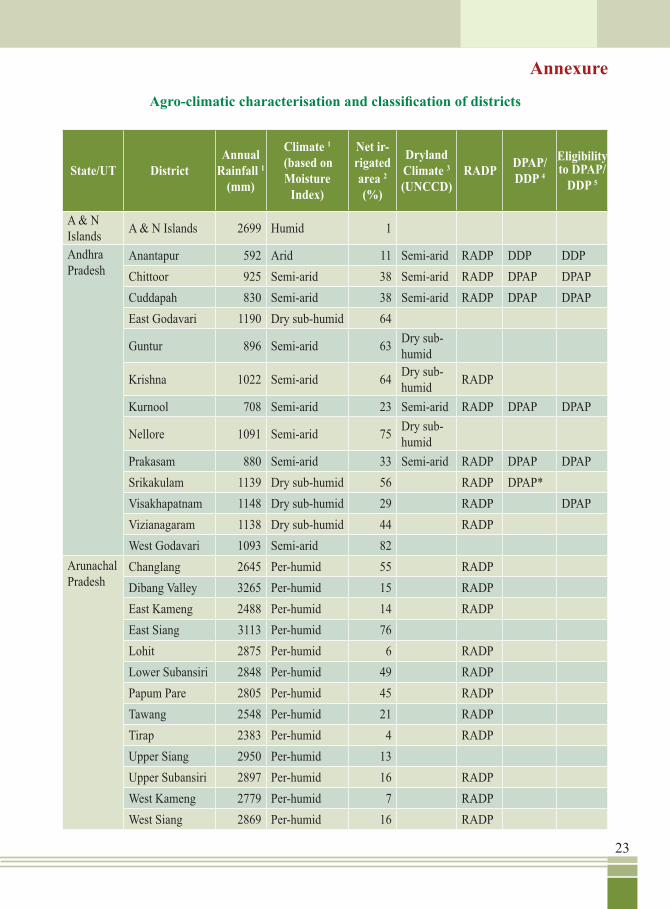
A & N Islands A & N Islands 2699 Humid 1
Andhra Pradesh
Anantapur 592 Arid 11 Semi-arid RADP DDP DDPChittoor 925 Semi-arid 38 Semi-arid RADP DPAP DPAPCuddapah 830 Semi-arid 38 Semi-arid RADP DPAP DPAPEast Godavari 1190 Dry sub-humid 64
Guntur 896 Semi-arid 63 Dry sub-humid
Krishna 1022 Semi-arid 64 Dry sub-humid RADP
Kurnool 708 Semi-arid 23 Semi-arid RADP DPAP DPAP
Nellore 1091 Semi-arid 75 Dry sub-humid
Prakasam 880 Semi-arid 33 Semi-arid RADP DPAP DPAPSrikakulam 1139 Dry sub-humid 56 RADP DPAP* Visakhapatnam 1148 Dry sub-humid 29 RADP DPAPVizianagaram 1138 Dry sub-humid 44 RADP West Godavari 1093 Semi-arid 82
Arunachal Pradesh
Changlang 2645 Per-humid 55 RADP Dibang Valley 3265 Per-humid 15 RADP East Kameng 2488 Per-humid 14 RADP East Siang 3113 Per-humid 76 Lohit 2875 Per-humid 6 RADP Lower Subansiri 2848 Per-humid 49 RADP Papum Pare 2805 Per-humid 45 RADP Tawang 2548 Per-humid 21 RADP Tirap 2383 Per-humid 4 RADP Upper Siang 2950 Per-humid 13 Upper Subansiri 2897 Per-humid 16 RADP West Kameng 2779 Per-humid 7 RADP West Siang 2869 Per-humid 16 RADP
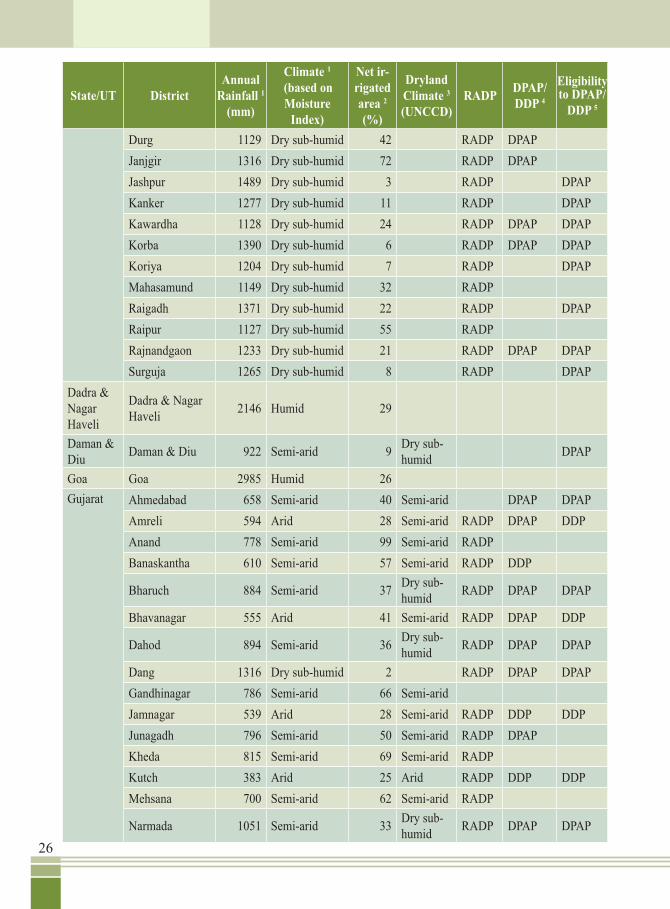
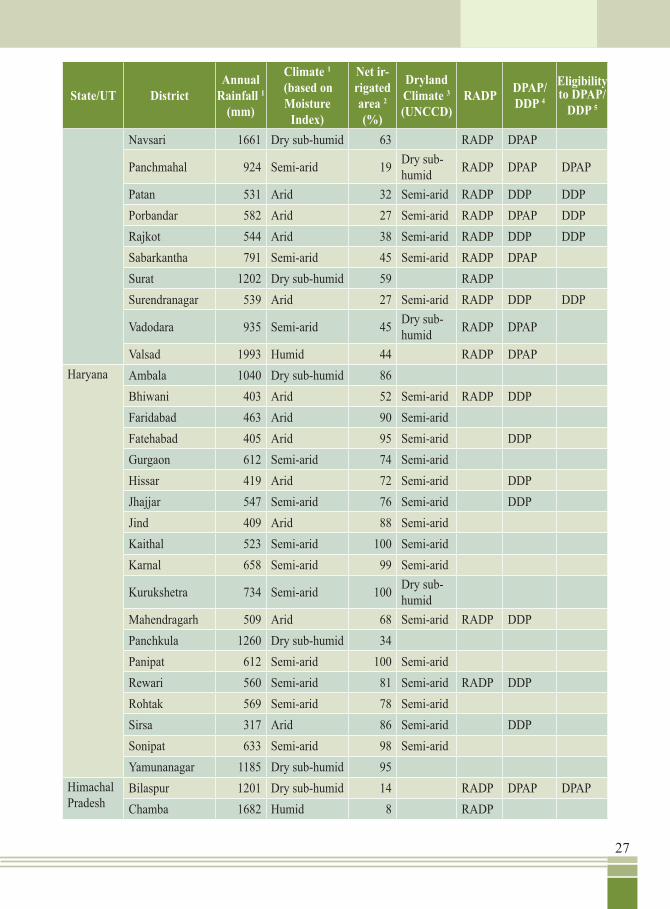
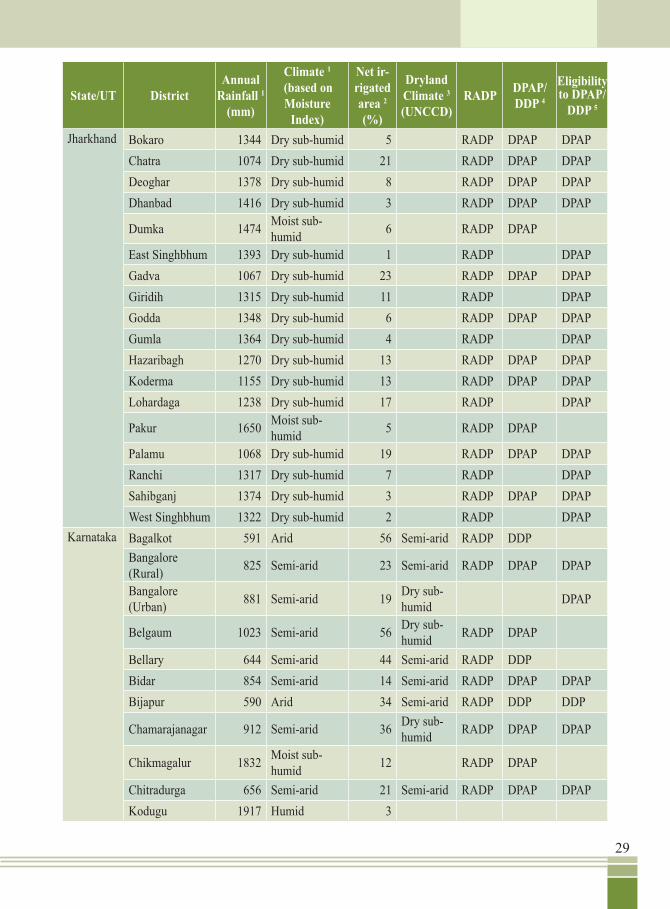
Annexure
Agro-climatic characterisation and classifi cation of districts

24
State/UT DistrictAnnual
Rainfall 1 (mm)
Climate 1
(based on Moisture
Index)
Net ir-rigated area 2 (%)
Dryland Climate 3 (UNCCD)
RADP DPAP/DDP 4
Eligibility to DPAP/
DDP 5
Assam Barpeta 2848 Per-humid 0 RADP Bongaigaon 3211 Per-humid 0 RADP Cachar 2935 Per-humid 0 RADP Darrang 2025 Humid 11 RADP Dhemaji 3152 Per-humid 11 RADP Dhubri 3351 Per-humid 2 RADP Dibrugarh 2634 Per-humid 0 RADP Goalpara 2651 Per-humid 13 RADP Golaghat 1877 Humid 16 RADP Hailakandi 2740 Per-humid 7 RADP Jorhat 2237 Per-humid 0 RADP Kamrup 2084 Humid 3 RADP Karbi-Anglong 1646 Humid 0 RADP Karimganj 2772 Per-humid 11 RADP Kokrajhar 3671 Per-humid 1 RADP Lakhimpur 2933 Per-humid 2 RADP Morigaon 1930 Humid 33 RADP N C Hills 1770 Humid 0 RADP Nagaon 1648 Humid 5 RADP Nalbari 2072 Humid 4 RADP Sibsagar 2194 Humid 3 RADP Sonitpur 2406 Per-humid 8 RADP Tinsukia 3111 Per-humid 0 RADP
Bihar Araria 1650 Humid 42 RADP Aurangabad 1007 Dry sub-humid 87 Banka 1168 Dry sub-humid 67 Begusarai 1164 Dry sub-humid 64 Bhabhua 1033 Dry sub-humid 93 DPAP Bhagalpur 1186 Dry sub-humid 36 RADP Bhojpur 1001 Dry sub-humid 88 Buxar 983 Semi-arid 87 Champaran (East) 1282 Dry sub-humid 45 RADP
Champaran (West) 1509 Moist sub-
humid 42 RADP
25
State/UT DistrictAnnual
Rainfall 1 (mm)
Climate 1
(based on Moisture
Index)
Net ir-rigated area 2 (%)
Dryland Climate 3 (UNCCD)
RADP DPAP/DDP 4
Eligibility to DPAP/
DDP 5
Darbhanga 1139 Dry sub-humid 50 RADP Gaya 1011 Dry sub-humid 78 Gopalganj 1120 Dry sub-humid 65 RADP Jahanabad 1012 Dry sub-humid 80 RADP Jamui 1192 Dry sub-humid 25 DPAP DPAP
Katihar 1508 Moist sub-humid 66 RADP
Khagaria 1149 Dry sub-humid 81 Kishanganj 2409 Humid 26 RADP Lakhisarai 1092 Dry sub-humid 73 RADP Madhubani 1237 Dry sub-humid 43 RADP DPAP Madhupura 1244 Dry sub-humid 73 RADP Munger 1150 Dry sub-humid 70 Muzaffarpur 1158 Dry sub-humid 53 RADP Nalanda 1057 Dry sub-humid 82 Nawada 1091 Dry sub-humid 92 DPAP Patna 1023 Dry sub-humid 55
Purnea 1510 Moist sub-humid 48 RADP
Rohtas 1056 Dry sub-humid 97 DPAP Saharsa 1207 Dry sub-humid 51 RADP Samastipur 1115 Dry sub-humid 63 RADP Saran 1150 Dry sub-humid 59 RADP Sheikhpura 1061 Dry sub-humid 83 RADP Sitamarhi 1156 Dry sub-humid 47 RADP DPAP Sheohar 1172 Dry sub-humid 76 RADP Siwan 1133 Dry sub-humid 65
Supaul 1414 Moist sub-humid 61 RADP
Vaishali 1112 Dry sub-humid 54 RADP Chhattis-garh
Bastar 1387 Dry sub-humid 2 RADP DPAP* DPAPBilaspur 1252 Dry sub-humid 40 RADP DPAP Dantewara 1497 Dry sub-humid 2 RADP DPAP DPAPDhamtari 1203 Dry sub-humid 78
26
State/UT DistrictAnnual
Rainfall 1 (mm)
Climate 1
(based on Moisture
Index)
Net ir-rigated area 2 (%)
Dryland Climate 3 (UNCCD)
RADP DPAP/DDP 4
Eligibility to DPAP/
DDP 5
Durg 1129 Dry sub-humid 42 RADP DPAP Janjgir 1316 Dry sub-humid 72 RADP DPAP Jashpur 1489 Dry sub-humid 3 RADP DPAPKanker 1277 Dry sub-humid 11 RADP DPAPKawardha 1128 Dry sub-humid 24 RADP DPAP DPAPKorba 1390 Dry sub-humid 6 RADP DPAP DPAPKoriya 1204 Dry sub-humid 7 RADP DPAPMahasamund 1149 Dry sub-humid 32 RADP Raigadh 1371 Dry sub-humid 22 RADP DPAPRaipur 1127 Dry sub-humid 55 RADP Rajnandgaon 1233 Dry sub-humid 21 RADP DPAP DPAPSurguja 1265 Dry sub-humid 8 RADP DPAP
Dadra & Nagar Haveli
Dadra & Nagar Haveli 2146 Humid 29
Daman & Diu Daman & Diu 922 Semi-arid 9 Dry sub-
humid DPAP
Goa Goa 2985 Humid 26 Gujarat Ahmedabad 658 Semi-arid 40 Semi-arid DPAP DPAP
Amreli 594 Arid 28 Semi-arid RADP DPAP DDPAnand 778 Semi-arid 99 Semi-arid RADP Banaskantha 610 Semi-arid 57 Semi-arid RADP DDP
Bharuch 884 Semi-arid 37 Dry sub-humid RADP DPAP DPAP
Bhavanagar 555 Arid 41 Semi-arid RADP DPAP DDP
Dahod 894 Semi-arid 36 Dry sub-humid RADP DPAP DPAP
Dang 1316 Dry sub-humid 2 RADP DPAP DPAPGandhinagar 786 Semi-arid 66 Semi-arid Jamnagar 539 Arid 28 Semi-arid RADP DDP DDPJunagadh 796 Semi-arid 50 Semi-arid RADP DPAP Kheda 815 Semi-arid 69 Semi-arid RADP Kutch 383 Arid 25 Arid RADP DDP DDPMehsana 700 Semi-arid 62 Semi-arid RADP
Narmada 1051 Semi-arid 33 Dry sub-humid RADP DPAP DPAP
27
State/UT DistrictAnnual
Rainfall 1 (mm)
Climate 1
(based on Moisture
Index)
Net ir-rigated area 2 (%)
Dryland Climate 3 (UNCCD)
RADP DPAP/DDP 4
Eligibility to DPAP/
DDP 5
Navsari 1661 Dry sub-humid 63 RADP DPAP
Panchmahal 924 Semi-arid 19 Dry sub-humid RADP DPAP DPAP
Patan 531 Arid 32 Semi-arid RADP DDP DDPPorbandar 582 Arid 27 Semi-arid RADP DPAP DDPRajkot 544 Arid 38 Semi-arid RADP DDP DDPSabarkantha 791 Semi-arid 45 Semi-arid RADP DPAP Surat 1202 Dry sub-humid 59 RADP Surendranagar 539 Arid 27 Semi-arid RADP DDP DDP
Vadodara 935 Semi-arid 45 Dry sub-humid RADP DPAP
Valsad 1993 Humid 44 RADP DPAP Haryana Ambala 1040 Dry sub-humid 86
Bhiwani 403 Arid 52 Semi-arid RADP DDP Faridabad 463 Arid 90 Semi-arid Fatehabad 405 Arid 95 Semi-arid DDP Gurgaon 612 Semi-arid 74 Semi-arid Hissar 419 Arid 72 Semi-arid DDP Jhajjar 547 Semi-arid 76 Semi-arid DDP Jind 409 Arid 88 Semi-arid Kaithal 523 Semi-arid 100 Semi-arid Karnal 658 Semi-arid 99 Semi-arid
Kurukshetra 734 Semi-arid 100 Dry sub-humid
Mahendragarh 509 Arid 68 Semi-arid RADP DDP Panchkula 1260 Dry sub-humid 34 Panipat 612 Semi-arid 100 Semi-arid Rewari 560 Semi-arid 81 Semi-arid RADP DDP Rohtak 569 Semi-arid 78 Semi-arid Sirsa 317 Arid 86 Semi-arid DDP Sonipat 633 Semi-arid 98 Semi-arid Yamunanagar 1185 Dry sub-humid 95
Himachal Pradesh
Bilaspur 1201 Dry sub-humid 14 RADP DPAP DPAPChamba 1682 Humid 8 RADP

28
State/UT DistrictAnnual
Rainfall 1 (mm)
Climate 1
(based on Moisture
Index)
Net ir-rigated area 2 (%)
Dryland Climate 3 (UNCCD)
RADP DPAP/DDP 4
Eligibility to DPAP/
DDP 5
Hamirpur 1355 Moist sub-humid 5
Kangra 1680 Humid 32
Kinnaur 872 Dry sub-humid 62 RADP DDP
Kulu 1126 Moist sub-humid 6 RADP
Lahaul & Spiti 1127 Moist sub-humid 100 DDP
Mandi 1290 Moist sub-humid 15
Shimla 1022 Dry sub-humid 3 DPAP
Sirmaur 1298 Moist sub-humid 35 RADP
Solan 1279 Moist sub-humid 28 RADP DPAP
Una 1188 Dry sub-humid 24 RADP DPAP DPAPJammu & Kashmir
Anantnag 1212 Moist sub-humid 59
Baramulla 1022 Moist sub-humid 48 RADP
Budgam 981 Dry sub-humid 65 Doda 1302 Humid 11 RADP DPAP
Jammu 1280 Moist sub-humid 54
Kupwara 1065 Moist sub-humid 53 RADP
Kargil 992 Moist sub-humid 100 RADP DDP
Kathua 1354 Moist sub-humid 33 RADP
Leh 764 Dry sub-humid 100 RADP DDP
Poonch 1114 Moist sub-humid 13 RADP
Pulwama 858 Dry sub-humid 67 RADP
Rajauri 1200 Moist sub-humid 9 RADP
Srinagar 961 Dry sub-humid 78 Udhampur 1335 Humid 6 RADP DPAP
29
State/UT DistrictAnnual
Rainfall 1 (mm)
Climate 1
(based on Moisture
Index)
Net ir-rigated area 2 (%)
Dryland Climate 3 (UNCCD)
RADP DPAP/DDP 4
Eligibility to DPAP/
DDP 5
Jharkhand Bokaro 1344 Dry sub-humid 5 RADP DPAP DPAPChatra 1074 Dry sub-humid 21 RADP DPAP DPAPDeoghar 1378 Dry sub-humid 8 RADP DPAP DPAPDhanbad 1416 Dry sub-humid 3 RADP DPAP DPAP
Dumka 1474 Moist sub-humid 6 RADP DPAP
East Singhbhum 1393 Dry sub-humid 1 RADP DPAPGadva 1067 Dry sub-humid 23 RADP DPAP DPAPGiridih 1315 Dry sub-humid 11 RADP DPAPGodda 1348 Dry sub-humid 6 RADP DPAP DPAPGumla 1364 Dry sub-humid 4 RADP DPAPHazaribagh 1270 Dry sub-humid 13 RADP DPAP DPAPKoderma 1155 Dry sub-humid 13 RADP DPAP DPAPLohardaga 1238 Dry sub-humid 17 RADP DPAP
Pakur 1650 Moist sub-humid 5 RADP DPAP
Palamu 1068 Dry sub-humid 19 RADP DPAP DPAPRanchi 1317 Dry sub-humid 7 RADP DPAPSahibganj 1374 Dry sub-humid 3 RADP DPAP DPAPWest Singhbhum 1322 Dry sub-humid 2 RADP DPAP
Karnataka Bagalkot 591 Arid 56 Semi-arid RADP DDP Bangalore (Rural) 825 Semi-arid 23 Semi-arid RADP DPAP DPAP
Bangalore (Urban) 881 Semi-arid 19 Dry sub-
humid DPAP
Belgaum 1023 Semi-arid 56 Dry sub-humid RADP DPAP
Bellary 644 Semi-arid 44 Semi-arid RADP DDP Bidar 854 Semi-arid 14 Semi-arid RADP DPAP DPAPBijapur 590 Arid 34 Semi-arid RADP DDP DDP
Chamarajanagar 912 Semi-arid 36 Dry sub-humid RADP DPAP DPAP
Chikmagalur 1832 Moist sub-humid 12 RADP DPAP
Chitradurga 656 Semi-arid 21 Semi-arid RADP DPAP DPAPKodugu 1917 Humid 3

30
State/UT DistrictAnnual
Rainfall 1 (mm)
Climate 1
(based on Moisture
Index)
Net ir-rigated area 2 (%)
Dryland Climate 3 (UNCCD)
RADP DPAP/DDP 4
Eligibility to DPAP/
DDP 5
Dakshina Kan-nada 3839 Per-humid 54
Davanagere 705 Semi-arid 42 Semi-arid RADP DDP/ DPAP
Dharwad 911 Semi-arid 17 Dry sub-humid RADP DPAP DPAP
Gadag 626 Semi-arid 23 Semi-arid RADP DPAP DPAPGulbarga 742 Semi-arid 17 Semi-arid RADP DPAP DPAPHassan 1016 Semi-arid 29 RADP DPAP DPAP
Haveri 1037 Semi-arid 20 Dry sub-humid RADP DPAP DPAP
Kolar 718 Semi-arid 21 Semi-arid DPAP DPAPKoppal 604 Arid 31 Semi-arid RADP DDP DDP
Mandya 814 Semi-arid 56 Dry sub-humid RADP
Mysore 874 Semi-arid 48 Dry sub-humid RADP DPAP
Raichur 646 Semi-arid 37 Semi-arid RADP DDP DPAPShimoga 1970 Humid 60 Tumkur 702 Semi-arid 28 Semi-arid RADP DPAP DPAPUdupi 4886 Per-humid 33 Uttara Kannada 2705 Humid 25
Kerala Alappuzha 2683 Humid 41
Eranakulam 2924 Humid 17
Idukki 2952 Humid 11 RADP
Kannur 3192 Per-humid 12
Kasaragod 3502 Per-humid 32
Kollam 1468 Dry sub-humid 3 DPAPKottayam 2931 Humid 9
Kozhikode 2863 Per-humid 4
Malappuram 2626 Humid 14
Palakkad 2091 Humid 46
Pathanamthitta 2486 Humid 8
Thiruvana-thapuram 1648 Moist sub-
humid 5
Thrissur 2499 Humid 52
Wayanad 1590 Moist sub-humid 11 RADP

31
State/UT DistrictAnnual
Rainfall 1 (mm)
Climate 1
(based on Moisture
Index)
Net ir-rigated area 2 (%)
Dryland Climate 3 (UNCCD)
RADP DPAP/DDP 4
Eligibility to DPAP/
DDP 5
Madhya Pradesh
Balaghat 1334 Dry sub-humid 46 RADP Barwani 709 Semi-arid 36 Semi-arid RADP DPAP DPAP
Betul 1076 Semi-arid 30 Dry sub-humid RADP DPAP DPAP
Bhind 692 Semi-arid 41 Semi-arid RADP DPAP
Bhopal 1097 Semi-arid 60 Dry sub-humid
Chhatarpur 1098 Dry sub-humid 50 RADP Chhindwara 1115 Dry sub-humid 29 RADP DPAP DPAPDamoh 1149 Dry sub-humid 38 RADP DPAP*
Datia 806 Semi-arid 87 Dry sub-humid RADP
Dewas 957 Semi-arid 48 Semi-arid RADP DPAP Dhar 848 Semi-arid 55 Semi-arid RADP DPAP Dindori 1318 Dry sub-humid 1 RADP DPAP
Guna 927 Semi-arid 45 Dry sub-humid RADP DPAP
Gwalior 768 Semi-arid 55 Semi-arid
Harda 1104 Semi-arid 84 Dry sub-humid
Hoshangabad 1308 Dry sub-humid 93 Indore 884 Semi-arid 61 Semi-arid Jabalpur 1264 Dry sub-humid 47 RADP DPAP Jhabua 887 Semi-arid 18 Semi-arid RADP DPAP DPAPKatni 1158 Dry sub-humid 35 RADP Khandwa 912 Semi-arid 44 Semi-arid DPAP Khargone 774 Semi-arid 36 Semi-arid RADP DPAP DPAPMandla 1361 Dry sub-humid 10 RADP DPAP
Mandsaur 890 Semi-arid 45 Dry sub-humid RADP
Morena 693 Semi-arid 70 Semi-arid RADP Narsinghpur 1207 Dry sub-humid 60 RADP Neemuch 818 Semi-arid 46 Semi-arid RADP Panna 1103 Dry sub-humid 35 RADP DPAP* Raisen 1195 Dry sub-humid 54 RADP DPAP
Rajgarh 954 Semi-arid 49 Dry sub-humid DPAP

32
State/UT DistrictAnnual
Rainfall 1 (mm)
Climate 1
(based on Moisture
Index)
Net ir-rigated area 2 (%)
Dryland Climate 3 (UNCCD)
RADP DPAP/DDP 4
Eligibility to DPAP/
DDP 5
Ratlam 941 Semi-arid 39 Dry sub-humid RADP DPAP DPAP
Rewa 1052 Dry sub-humid 26 RADP DPAP* DPAPSagar 1154 Dry sub-humid 47 RADP Satna 1053 Dry sub-humid 39 RADP
Sehore 1099 Semi-arid 64 Dry sub-humid RADP
Seoni 1213 Dry sub-humid 32 RADP DPAP Shahdol 1228 Dry sub-humid 8 RADP DPAP* DPAP
Shajapur 946 Semi-arid 48 Dry sub-humid RADP DPAP
Sheopur Kalan 758 Semi-arid 73 Semi-arid
Shivpuri 853 Semi-arid 48 Dry sub-humid RADP DPAP
Sidhi 1099 Dry sub-humid 19 RADP DPAP* DPAP
Tikamgarh 952 Semi-arid 69 Dry sub-humid
Ujjain 915 Semi-arid 47 Semi-arid RADP Umaria 1200 Dry sub-humid 21 RADP DPAP DPAP
Vidisha 1099 Semi-arid 49 Dry sub-humid RADP
Maharash-tra
Ahmednagar 667 Semi-arid 21 Semi-arid RADP DPAP DPAPAkola 789 Semi-arid 3 Semi-arid RADP DPAP DPAP
Amravati 963 Semi-arid 6 Dry sub-humid RADP DPAP DPAP
Aurangabad 702 Semi-arid 10 Semi-arid RADP DPAP DPAPBeed 745 Semi-arid 17 Semi-arid RADP DPAP DPAPBhandara 1273 Dry sub-humid 56 Buldhana 762 Semi-arid 4 Semi-arid RADP DPAP DPAPChandrapur 1222 Dry sub-humid 16 RADP DPAP DPAPDhule 669 Semi-arid 8 Semi-arid RADP DPAP DPAPGadchiroli 1399 Dry sub-humid 26 RADP DPAP DPAPGondia 1473 Dry sub-humid 47 RADP Hingoli 929 Semi-arid 12 Semi-arid RADP DPAP DPAPJalgaon 714 Semi-arid 10 Semi-arid RADP DPAP DPAPJalna 727 Semi-arid 7 Semi-arid RADP DPAP DPAP
33
State/UT DistrictAnnual
Rainfall 1 (mm)
Climate 1
(based on Moisture
Index)
Net ir-rigated area 2 (%)
Dryland Climate 3 (UNCCD)
RADP DPAP/DDP 4
Eligibility to DPAP/
DDP 5
Kolhapur 2105 Humid 22 RADP
Latur 820 Semi-arid 7 Semi-arid RADP DPAP DPAPNagpur 1107 Dry sub-humid 17 RADP DPAP DPAP
Nanded 980 Semi-arid 7 Dry sub-humid RADP DPAP DPAP
Nandurbar 823 Semi-arid 9 Semi-arid RADP DPAP DPAP
Nasik 1018 Semi-arid 18 Dry sub-humid RADP DPAP DPAP
Osmanabad 740 Semi-arid 10 Semi-arid RADP DPAP DPAPParbhani 864 Semi-arid 9 Semi-arid RADP DPAP DPAPPune 1391 Dry sub-humid 22 RADP DPAP DPAPRaigad 3048 Humid 6 RADP Ratnagiri 3313 Per-humid 3 Sangli 707 Semi-arid 20 Semi-arid RADP DPAP DPAPSatara 1348 Dry sub-humid 24 RADP DPAP DPAPSindhudurg 2468 Humid 9 Solapur 654 Semi-arid 15 Semi-arid RADP DPAP DPAPThane 2360 Humid 4 RADP
Wardha 1005 Semi-arid 4 Dry sub-humid RADP DPAP
Washim 894 Semi-arid 4 Semi-arid RADP DPAP DPAP
Yavatmal 996 Semi-arid 4 Dry sub-humid RADP DPAP DPAP
Manipur Bishnupur 1699 Humid 46Chandel 1660 Humid 0 RADP Churachandpur 2196 Humid 0 RADP Imphal East 1632 Humid 5 RADP Imphal West 2594 Per-humid 5 RADP Senapati 1549 Humid 0 RADP Tamenglong 2135 Humid 0 RADP Thoubal 1680 Humid 68 RADP Ukhrul 1545 Humid 0 RADP
Megha-laya
East Garo Hills 2691 Per-humid 25 RADP East Khasi Hills 4983 Per-humid 23 RADP Jaintia Hills 3025 Per-humid 24 RADP Ri-Bhoi 2066 Humid 60 RADP

34
State/UT DistrictAnnual
Rainfall 1 (mm)
Climate 1
(based on Moisture
Index)
Net ir-rigated area 2 (%)
Dryland Climate 3 (UNCCD)
RADP DPAP/DDP 4
Eligibility to DPAP/
DDP 5
South Garo Hills 3252 Per-humid 11 RADP West Garo Hills 2897 Per-humid 11 RADP West Khasi Hills 5519 Per-humid 37 RADP
Mizoram Aizwal 2550 Per-humid 2 RADP Champhai 2573 Per-humid 18 RADP Kolasib 2711 Per-humid 34 RADP Lawngtlai 3051 Per-humid 12 RADP Lunglei 2777 Per-humid 4 RADP Mamit 2590 Per-humid 3 Saiha 3031 Per-humid 6 RADP Serchhip 2654 Per-humid 11 RADP
Nagaland Dimapur 1461 Humid 61 RADP Kohima 1520 Humid 31 RADP Mokokchung 1945 Humid 15 RADP Mon 2105 Humid 10 RADP Phek 1719 Humid 43 RADP Tuensang 1918 Humid 9 RADP Wokha 1794 Humid 14 RADP Zunheboto 1828 Humid 11 RADP
Orissa Angul 1438 Dry sub-humid 24 RADP DPAP
Balasore 1719 Moist sub-humid 49 RADP
Baragarh 1283 Dry sub-humid 49 RADP DPAP
Bhadrak 1560 Moist sub-humid 65 RADP
Bolangir 1229 Dry sub-humid 19 RADP DPAP DPAPBoudh 1372 Dry sub-humid 53 DPAP Cuttack 1478 Dry sub-humid 71 RADP Deogarh 1481 Dry sub-humid 33 RADP Dhenkanal 1469 Dry sub-humid 33 RADP DPAP Gajapati 1301 Dry sub-humid 31 RADP Ganjam 1305 Dry sub-humid 64 RADP Jagatsinghpur 1516 Dry sub-humid 63 RADP
Jajpur 1635 Moist sub-humid 39 RADP

35
State/UT DistrictAnnual
Rainfall 1 (mm)
Climate 1
(based on Moisture
Index)
Net ir-rigated area 2 (%)
Dryland Climate 3 (UNCCD)
RADP DPAP/DDP 4
Eligibility to DPAP/
DDP 5
Jharsuguda 1465 Dry sub-humid 22 RADP DPAPKalahandi 1259 Dry sub-humid 38 RADP DPAP
Kendrapara 1571 Moist sub-humid 49 RADP
Keonjhar 1484 Dry sub-humid 25 RADP DPAPKhurda 1358 Dry sub-humid 47 RADP Koraput 1288 Dry sub-humid 27 RADP DPAPMalkangiri 1323 Dry sub-humid 38 RADP
Mayurbhanj 1553 Moist sub-humid 29 RADP
Nawapara 1152 Dry sub-humid 27 RADP DPAP DPAPNawarangpur 1191 Dry sub-humid 16 RADP DPAPNayagarh 1355 Dry sub-humid 34 RADP Phulbani 1371 Dry sub-humid 22 RADP DPAP DPAPPuri 1369 Dry sub-humid 71 RADP Rayagada 1286 Dry sub-humid 27 RADP DPAPSambalpur 1404 Dry sub-humid 37 RADP Sonepur 1351 Dry sub-humid 70 RADP DPAP Sundargarh 1470 Dry sub-humid 24 RADP DPAP
Pondich-erry Pondicherry 1167 Semi-arid 85 Dry sub-
humid
Punjab Amritsar 705 Semi-arid 100 Dry sub-humid
Bathinda 399 Arid 100 Semi-arid RADP
Faridkot 393 Arid 100 Semi-arid
Fatehgarh Sahib 799 Semi-arid 100 Dry sub-humid
Firozpur 432 Arid 100 Semi-arid
Gurdaspur 1055 Dry sub-humid 89 RADP
Hoshiarpur 1142 Dry sub-humid 91
Jalandhar 776 Semi-arid 99 Dry sub-humid
Kapurthala 712 Semi-arid 100 Dry sub-humid
Ludhiana 756 Semi-arid 100 Dry sub-humid
Mansa 414 Arid 100 Semi-arid
Moga 503 Semi-arid 100 Semi-arid
Muktsar 388 Arid 100 Semi-arid

36
State/UT DistrictAnnual
Rainfall 1 (mm)
Climate 1
(based on Moisture
Index)
Net ir-rigated area 2 (%)
Dryland Climate 3 (UNCCD)
RADP DPAP/DDP 4
Eligibility to DPAP/
DDP 5
Nawan Shehar 909 Dry sub-humid 91
Patiala 785 Semi-arid 100 Dry sub-humid
Roopnagar 986 Dry sub-humid 85 RADP
Sangrur 563 Semi-arid 100 Semi-arid
Rajasthan Ajmer 504 Arid 12 Semi-arid RADP DDP*/DPAP DDP
Alwar 609 Semi-arid 90 Semi-arid
Banswara 917 Semi-arid 42 Dry sub-humid RADP DPAP
Baran 872 Semi-arid 87 Dry sub-humid RADP DPAP
Barmer 285 Arid 8 Arid RADP DDP DDPBharatpur 559 Semi-arid 84 Semi-arid RADP DPAP Bhilwara 632 Semi-arid 34 Semi-arid RADP DPAPBikaner 271 Arid 17 Arid RADP DDP DDPBundi 696 Semi-arid 80 Semi-arid RADP Chittorgarh 785 Semi-arid 58 Semi-arid RADP Churu 384 Arid 6 Semi-arid RADP DDP DDPDausa 661 Semi-arid 73 Semi-arid Dholpur 651 Semi-arid 71 Semi-arid RADP Dungarpur 774 Semi-arid 23 Semi-arid RADP DPAP DPAPGanganagar 244 Arid 76 Arid RADP Hanumangarh 313 Arid 45 Arid RADP DDP* DDPJaipur 577 Semi-arid 46 Semi-arid RADP DDP* Jaisalmer 172 Arid 19 Arid RADP DDP DDPJalore 484 Arid 37 Semi-arid RADP DDP DDP
Jhalawar 953 Semi-arid 66 Dry sub-humid RADP DPAP
Jhunjhunu 460 Arid 53 Semi-arid RADP DDP Jodhpur 289 Arid 17 Arid RADP DDP DDPKarauli 699 Semi-arid 61 Semi-arid RADP DPAP Kota 788 Semi-arid 87 Semi-arid RADP DPAP Nagaur 433 Arid 20 Semi-arid RADP DDP DDPPali 494 Arid 20 Semi-arid RADP DDP DDPRajsamand 586 Semi-arid 39 Semi-arid RADP DDP* DPAPSawai Madhopur 713 Semi-arid 65 Semi-arid RADP DPAP Sikar 497 Arid 46 Semi-arid RADP DDP DDP

37
State/UT DistrictAnnual
Rainfall 1 (mm)
Climate 1
(based on Moisture
Index)
Net ir-rigated area 2 (%)
Dryland Climate 3 (UNCCD)
RADP DPAP/DDP 4
Eligibility to DPAP/
DDP 5
Sirohi 703 Semi-arid 56 Semi-arid RADP DDP* Tonk 590 Semi-arid 44 Semi-arid RADP DPAP
Udaipur 697 Semi-arid 41 Semi-arid RADP DDP*/ DPAP
Sikkim East Sikkim 2832 Per-humid 46 RADP North Sikkim 2657 Per-humid 21 RADP South Sikkim 2650 Per-humid 16 RADP West Sikkim 2808 Per-humid 29 RADP
Tamil Nadu Ariyalur 965 Semi-arid 29 Dry sub-
humid RADP DPAP DPAP
Coimbatore 1103 Dry sub-humid 58 RADP DPAP
Cuddalore 1067 Semi-arid 67 Dry sub-humid
Dharmapuri 812 Semi-arid 34 Semi-arid RADP DPAP DPAPDindigul 829 Semi-arid 48 Semi-arid RADP DPAP
Erode 859 Semi-arid 60 Dry sub-humid RADP
Kancheepuram 1088 Semi-arid 90 Dry sub-humid
Kanya Kumari 1314 Dry sub-humid 35 RADP Karur 751 Semi-arid 58 Semi-arid RADP DPAP
Madurai 930 Semi-arid 62 Dry sub-humid RADP
Nagapattinam 1183 Semi-arid 80 Dry sub-humid
Namakkal 804 Semi-arid 45 Semi-arid RADP DPAP
Perambalur 941 Semi-arid 29 Dry sub-humid RADP DPAP DPAP
Pudukkottai 870 Semi-arid 74 Semi-arid DPAP Ramana-thapuram 808 Semi-arid 36 Semi-arid RADP DPAP DPAP
Salem 846 Semi-arid 50 Semi-arid RADP DPAP Sivagangai 922 Semi-arid 74 Semi-arid DPAP Thanjavur 960 Semi-arid 87 Semi-arid The Nilgiris 1897 Humid 0 RADP
Theni 885 Semi-arid 54 Dry sub-humid RADP
Thiruchirappalli 805 Semi-arid 60 Semi-arid RADP DPAP
38
State/UT DistrictAnnual
Rainfall 1 (mm)
Climate 1
(based on Moisture
Index)
Net ir-rigated area 2 (%)
Dryland Climate 3 (UNCCD)
RADP DPAP/DDP 4
Eligibility to DPAP/
DDP 5
Thirunelveli 1011 Semi-arid 75 Dry sub-humid DPAP
Thiruvallur 1155 Semi-arid 84 Dry sub-humid RADP
Thiruvannamalai 1000 Semi-arid 70 Dry sub-humid RADP DPAP
Thiruvarur 1186 Semi-arid 96 Dry sub-humid
Thoothukudi 750 Semi-arid 24 Semi-arid RADP DPAP DPAP
Vellore 948 Semi-arid 51 Dry sub-humid RADP DPAP
Villupuram 978 Semi-arid 70 Dry sub-humid RADP
Virudhunagar 892 Semi-arid 45 Semi-arid RADP DPAP Telangana Adilabad 1154 Dry sub-humid 12 RADP DPAP DPAP
Karimnagar 1021 Semi-arid 66 Dry sub-humid
Khammam 1188 Dry sub-humid 40 RADP DPAP Mahabubnagar 716 Semi-arid 30 Semi-arid RADP DPAP DPAP
Medak 896 Semi-arid 29 Dry sub-humid RADP DPAP DPAP
Nalgonda 795 Semi-arid 49 Semi-arid RADP DPAP
Nizamabad 1045 Semi-arid 55 Dry sub-humid
Rangareddy 826 Semi-arid 29 Semi-arid RADP DPAP DPAP
Warangal 992 Semi-arid 58 Dry sub-humid
Tripura Dhalai 2628 Per-humid 16 RADP North Tripura 2708 Per-humid 18 RADP South Tripura 2330 Humid 43 RADP West Tripura 2530 Per-humid 53 RADP
Uttar Pradesh
Agra 666 Semi-arid 90 Semi-arid Aligarh 704 Semi-arid 95 Semi-arid
Allahabad 909 Semi-arid 75 Dry sub-humid DPAP
Ambedkar Nagar 1135 Dry sub-humid 95 RADP
Auraiya 728 Semi-arid 87 Semi-arid RADP
39
State/UT DistrictAnnual
Rainfall 1 (mm)
Climate 1
(based on Moisture
Index)
Net ir-rigated area 2 (%)
Dryland Climate 3 (UNCCD)
RADP DPAP/DDP 4
Eligibility to DPAP/
DDP 5
Azamgarh 1092 Dry sub-humid 96
Bagpat 757 Semi-arid 96 Dry sub-humid RADP
Bahraich 1204 Dry sub-humid 51 RADP DPAP Ballia 1039 Dry sub-humid 79 Balrampur 1198 Dry sub-humid 37 RADP DPAP
Banda 880 Semi-arid 45 Dry sub-humid RADP DPAP*
Barabanki 1036 Dry sub-humid 88 RADP Bareilly 1065 Dry sub-humid 89 Basti 1133 Dry sub-humid 72 RADP Bijnor 1012 Dry sub-humid 81
Budaun 928 Semi-arid 89 Dry sub-humid
Bulandshahar 667 Semi-arid 87 Semi-arid Chandauli 1013 Dry sub-humid 94 RADP
Chitrakut 862 Semi-arid 24 Dry sub-humid RADP DPAP* DPAP
Deoria 1216 Dry sub-humid 84
Etah 806 Semi-arid 95 Dry sub-humid
Etawah 696 Semi-arid 88 Semi-arid RADP Faizabad 1103 Dry sub-humid 80 RADP
Farukkabad 873 Semi-arid 91 Dry sub-humid
Fatehpur 797 Semi-arid 67 Dry sub-humid RADP
Firozabad 698 Semi-arid 96 Semi-arid Gautam Buddh Nagar 640 Semi-arid 89 Semi-arid
Ghaziabad 749 Semi-arid 92 Dry sub-humid
Ghazipur 976 Semi-arid 86 Gonda 1319 Dry sub-humid 82 RADP Gorakhpur 1285 Dry sub-humid 84
Hamirpur 799 Semi-arid 42 Dry sub-humid RADP DPAP*

40
State/UT DistrictAnnual
Rainfall 1 (mm)
Climate 1
(based on Moisture
Index)
Net ir-rigated area 2 (%)
Dryland Climate 3 (UNCCD)
RADP DPAP/DDP 4
Eligibility to DPAP/
DDP 5
Hardoi 864 Semi-arid 89 Dry sub-
humid
Hatharas 709 Semi-arid 100 Semi-arid RADP Jyotiba Phule Nagar 925 Semi-arid 72 RADP
Jalaun 772 Semi-arid 62 Semi-arid RADP DPAP* Jaunpur 1003 Dry sub-humid 88
Jhansi 819 Semi-arid 61 Dry sub-humid RADP DPAP*
Kannauj 809 Semi-arid 93 Dry sub-humid RADP
Kanpur (Dehat) 789 Semi-arid 73 Dry sub-humid
Kanpur (Nagar) 850 Semi-arid 72 Dry sub-humid
Kaushambi 886 Semi-arid 70 Dry sub-humid RADP
Kheri 1185 Dry sub-humid 83 RADP DPAP Kushi Nagar 1330 Dry sub-humid 80
Lalitpur 931 Semi-arid 76 Dry sub-humid DPAP*
Lucknow 921 Semi-arid 92 Dry sub-humid
Mahoba 853 Semi-arid 34 Dry sub-humid RADP DPAP* DPAP
Mainpuri 760 Semi-arid 98 Dry sub-humid
Mathura 519 Semi-arid 98 Semi-arid Mau 1160 Dry sub-humid 93
Meerut 871 Semi-arid 96 Dry sub-humid RADP
Maharajganj 1488 Moist sub-humid 81
Mirzapur 1021 Dry sub-humid 62 RADP DPAP Moradabad 1004 Dry sub-humid 84 RADP
Muzaffarnagar 820 Semi-arid 99 Dry sub-humid
Pilibhit 1301 Dry sub-humid 95
Pratapgarh 927 Semi-arid 88 Dry sub-humid
41
State/UT DistrictAnnual
Rainfall 1 (mm)
Climate 1
(based on Moisture
Index)
Net ir-rigated area 2 (%)
Dryland Climate 3 (UNCCD)
RADP DPAP/DDP 4
Eligibility to DPAP/
DDP 5
Rae-Bareily 900 Semi-arid 88 Dry sub-humid
Rampur 1041 Dry sub-humid 93 RADP Saharanpur 963 Dry sub-humid 94 Sant Kabir Nagar 1255 Dry sub-humid 83 RADP
Sant Ravidas Nagar 968 Semi-arid 81 Dry sub-
humid
Shahjahanpur 1012 Dry sub-humid 95 RADP Shravasti 1215 Dry sub-humid 44 RADP DPAP Sidharthnagar 1249 Dry sub-humid 75 RADP Sitapur 1055 Dry sub-humid 86 RADP DPAP Sonbhadra 1073 Dry sub-humid 22 RADP DPAP DPAPSultanpur 1019 Dry sub-humid 84
Unnao 866 Semi-arid 94 Dry sub-humid RADP
Varanasi 1012 Dry sub-humid 85 Uttara-khand Almora 1303 Moist sub-
humid 7 RADP DPAP*
Bageshwar 1489 Humid 22 RADP DPAP
Chamoli 1208 Moist sub-humid 5 RADP DPAP
Champawat 1480 Moist sub-humid 9 RADP DPAP
Dehradun 1439 Humid 45 Haridwar 1197 Dry sub-humid 92
Nainital 1339 Moist sub-humid 58
Pauri Garhwal 1129 Dry sub-humid 10 RADP DPAP* DPAPPithoragarh 1822 Humid 10 RADP DPAP*
Rudra Prayag 1287 Moist sub-humid 11 RADP
Tehri Garhwal 1384 Moist sub-humid 13 RADP DPAP*
Udham Singh Nagar 1298 Dry sub-humid 98
Uttar Kashi 1244 Moist sub-humid 16 RADP

42
State/UT DistrictAnnual
Rainfall 1 (mm)
Climate 1
(based on Moisture
Index)
Net ir-rigated area 2 (%)
Dryland Climate 3 (UNCCD)
RADP DPAP/DDP 4
Eligibility to DPAP/
DDP 5
West Bengal
24-Paraganas (North) 1744 Humid 72
24-Paraganas (South) 1808 Humid 27 RADP
Bankura 1502 Moist sub-humid 55 RADP DPAP
Birbhum 1485 Moist sub-humid 63 RADP DPAP
Burdwann 1470 Moist sub-humid 88 RADP
Cooch Behar 3551 Per-humid 46 Darjeeling 2868 Per-humid 6 Dinajpur (Dakshin) 1677 Humid 53 RADP
Dinajpur (Uttar) 2036 Humid 79
Hooghly 1580 Moist sub-humid 92 RADP
Howrah 1629 Moist sub-humid 67 RADP
Jalpaiguri 3477 Per-humid 41
Malda 1467 Moist sub-humid 58 RADP
Midnapore 1636 Moist sub-humid 60 RADP DPAP
Murshidabad 1498 Moist sub-humid 83 RADP
Nadia 1380 Dry sub-humid 92 RADP Purulia 1304 Dry sub-humid 6 RADP DPAP DPAP
*Considered under exception
1 Based on Raju et al. (2013)
2 Based on Venkateswarlu et al. (2014)
3 As per UNCCD (1994) defi nition
4 DPAP/DDP in operation (including exceptions) obtained from http://watershed.nic.in/ QPRReportingDistrictwise.asp
5 Based on venkateswarlu et al. (2014): Current eligibility of a district to DPAP/DDP

