national agricultural statistics service
TRANSCRIPT

National Agricultural
Statistics Service
Environmental, Economics, and
Demographics Branch
(EEDB)

EEDB Program Areas
Census of Agriculture – Race, Age, Gender, …
Farm Labor
Farm Numbers and Land in Farms
Demographic
Agricultural Chemical Usage
Pest Management Practices
Environmental
Prices Received, Prices Paid, and Price Indexes
Farm Expenditures
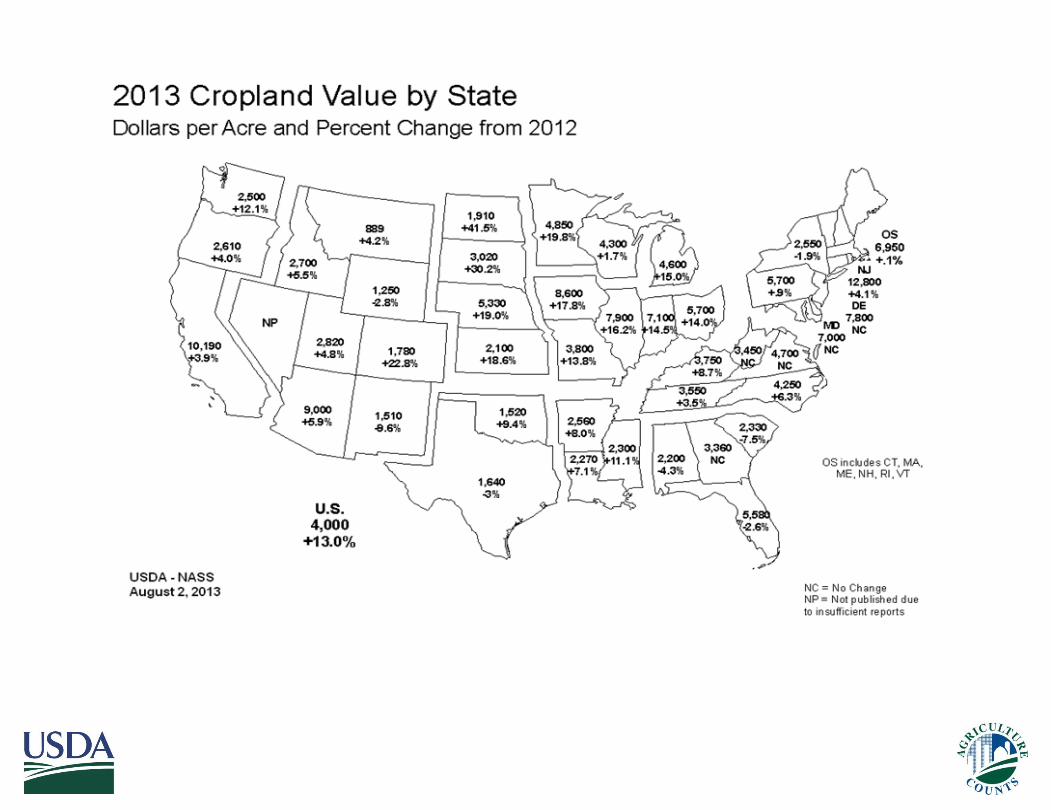
Land Values and Cash Rents
Economic

• Data collected from monthly surveys along with administrative price data (AMS, etc) is used to set monthly estimates for prices at the US and State level (States vary by commodity).
• For major grains, oilseeds & pulse crops, NASS collects data on total quantity purchased and total dollars received from a sample of mills, elevators, and other buyers.
Monthly Prices for Crops


Prices Paid Index
• Purposes
– Collect prices paid for farm inputs.
– Indexes measure relative change of prices paid for
farm inputs. (agricultural chemicals, fuels, feed, farm
machinery, & seed)
• Coverage
– 48 contiguous states.
– Approximately 135 items surveyed.
– Production items represent about 71% of index.
– Family living items represent about 15%.
– Interest, taxes, and wages, represent about 14%.

Prices Paid Indexes
• Frequency
– Survey conducted each year in March.
– Indexes updated in other months.
• Methods
– Target population – retail establishments where farmers purchase farm inputs.
– Survey panel of approximately 8,500 businesses.
– Survey response rates are 75 to 80 percent.


Prices Received Index
• Purpose
– Provides data to estimate prices received by
farmers and ranchers for commodities.
– Determines the Prices Received Indexes.
• Coverage
– Includes all commodities in NASS estimating
program.

Prices Received Index
• Frequency – Survey conducted monthly for grains, oilseeds, pulse
crops, and major livestock.
– Other commodities are collected annually.
• Methods
– Target populations are specific to each commodity.
– Grains, oilseeds, and pulse crops prices are obtained from about 2,000 grain elevators and other buyers.
– Livestock prices are collected from auctions, stockyards, packing plants and other buyers,.
– Fruit and vegetable prices are collected from State Boards, marketing cooperatives, grower associations, processors, canneries and producers.


Other Economic Data • ARMS III / Farm Expenditures
• Annual Farm Numbers and Land In Farms
– Estimates produced from June Area Survey – U.S. And State Level Estimates
• Land Values – Value of Farmland – Produced annually – June Area Survey – U.S. and State Level Estimates
• Annual Average Cash Rents – Rent paid by farmers for Agricultural Land – Produced Annually- June Area Survey and List Survey – U.S., State, and County Level Estimates

Agricultural Resource
Management Survey (ARMS)
Sample Size of Approximately 33,000 Farms
Largest annual project in NASS
The ARMS III utilizes multiple questionnaire versions. Prior to 2012, a
Core version of the questionnaire was used to obtain global farm level
expense, income, and household data. The Costs and Returns Report
asks for the same data as the Core questionnaire in greater detail. A
separate ARMS III questionnaire version is developed for each of the
production practices designated commodity samples with additional
questions relating to the current year’s designated crop and livestock
commodities.

Uses of ARMS III Data
• Farm Financial (Net Farm Income) reporting and forecasts
• Custom Reports for policy makers who affect farmers everyday
• Special Reports that answer questions on current hot topics
• Major information source for Farm Bills and Ag Policy • Agricultural Component of GDP • Part of Formulas to Allocate Tax Dollars • Crop Insurance and Disaster damage estimates • Lenders, Manufacturers, Suppliers, & Retailers decisions • Farm Commodity groups, for analysis and advocacy • Data Summaries Available to all through the web tool


NUMBER OF FARMS - Iowa
• 88,637 farms and ranches
• 4.5 percent fewer than 2007

Current Agricultural Industrial Report
• Cotton Spinning Industry Measurements (monthly)
– Cotton bale consumption – Cotton bale stocks on hand by both warehouses and spinners
• Flour Mill Industry Measurements (quarterly) – Wheat consumption for flour – Flour production – Millfeed production
• Ethanol Production Industry Measurements (monthly) – Inputs consumption (corn, wheat, sorghum, etc.) – Co-products production (Distillers Dried Grains, corn oil, etc.)
• Oilseed Crushings Industry Measurements (monthly) – Production of crude oils (cottonseed oil, cake and meal; peanut oil, cake and meal; etc) – Stocks of oils, cake and meal on hand end of each month
• Oil and fats Processors Industry Measurements (monthly) – Consumption of fats and oils in edible and inedible products (margarine, lubricants, feed, etc) – Production of edible and inedible fats (feather meal, lard, tallow and grease, etc) – Stocks of edible and inedible fats (feather meal, lard, tallow and grease, etc)

National Agricultural
Statistics Service
Environmental, Economics,
and Demographics Branch
Troy Joshua
Chief,
Environmental, Economics and Demographics Branch
Statistics Division