diva-gis: a simple gis and bioclim modeling...
TRANSCRIPT
DIVA-GIS: a simple GIS and BIOCLIM modeling tool
A. Mukherjee & M. Thom
GIS 5306: GIS Applications in Environmental SystemsFall 2010
Dr. Michael Binford
• Biological control overview– Application of ENM in biological control
– Tropical Soda Apple & Gratiana boliviana Spaeth
• Modeling Workflow– Data preparation: Occurrences & Climate data
– Generation of bioclimatic variables
– Bioclim Modeling: Current & Future Climate
– Model Evaluation
Outline of Talk

IPM
Biological
Cultural
Preventive
Herbicide
Adkins (1997)
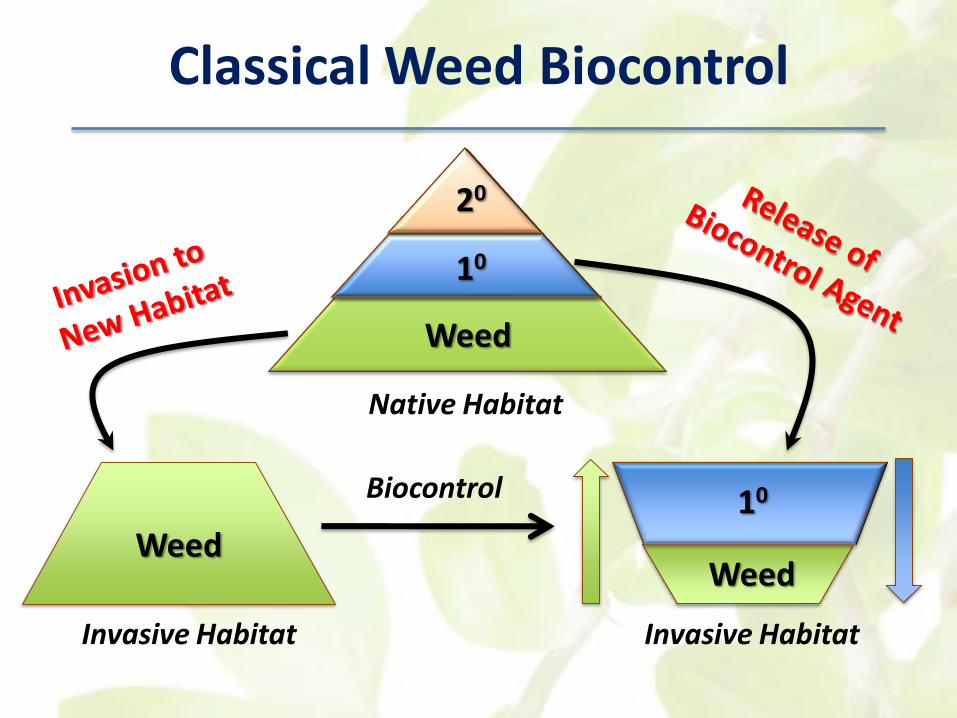
Classical Weed Biocontrol
Weed
10
20
Native Habitat
Weed
Invasive Habitat
Biocontrol
Weed
10
Invasive Habitat
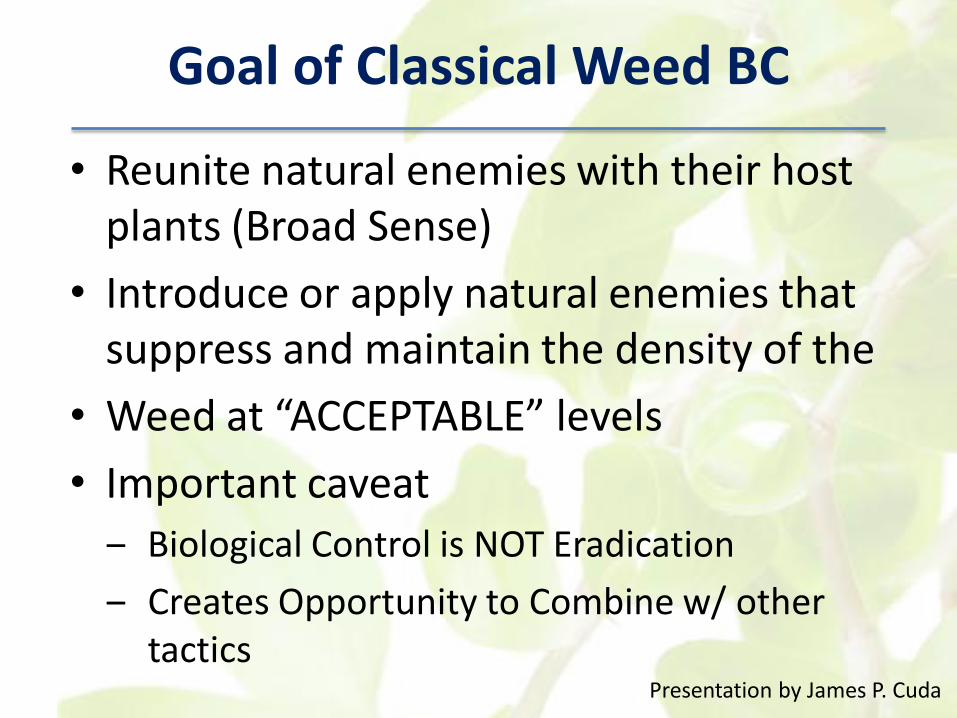
• Reunite natural enemies with their host plants (Broad Sense)
• Introduce or apply natural enemies that suppress and maintain the density of the
• Weed at “ACCEPTABLE” levels
• Important caveat
‒ Biological Control is NOT Eradication
‒ Creates Opportunity to Combine w/ other tactics
Goal of Classical Weed BC
Presentation by James P. Cuda
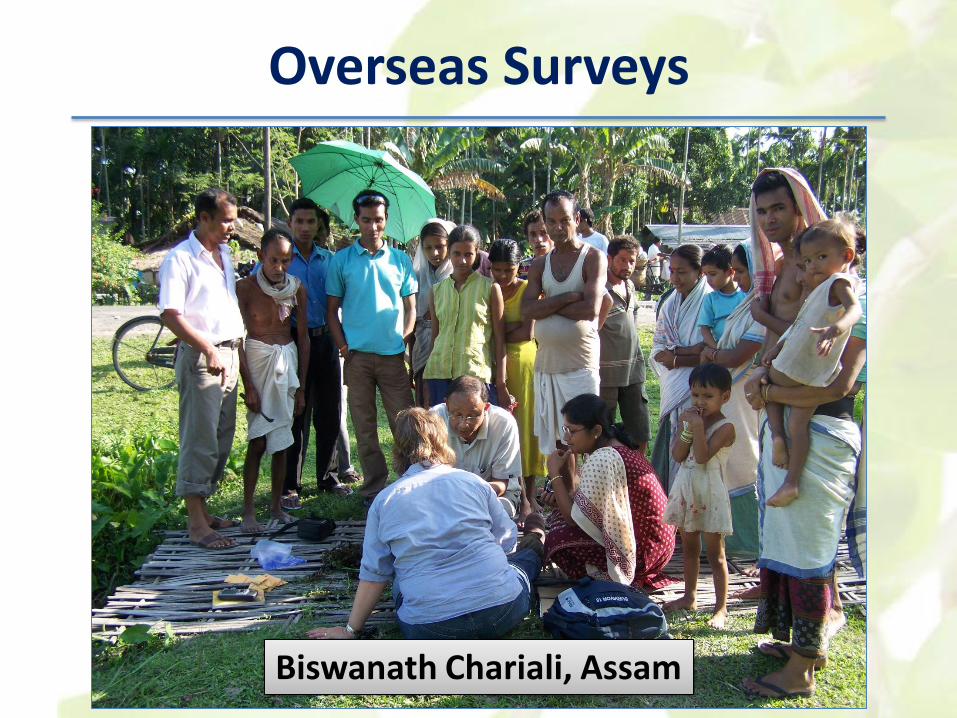
Overseas Surveys
Biswanath Chariali, Assam

Overseas Surveys
Two Happy Pathologists!!
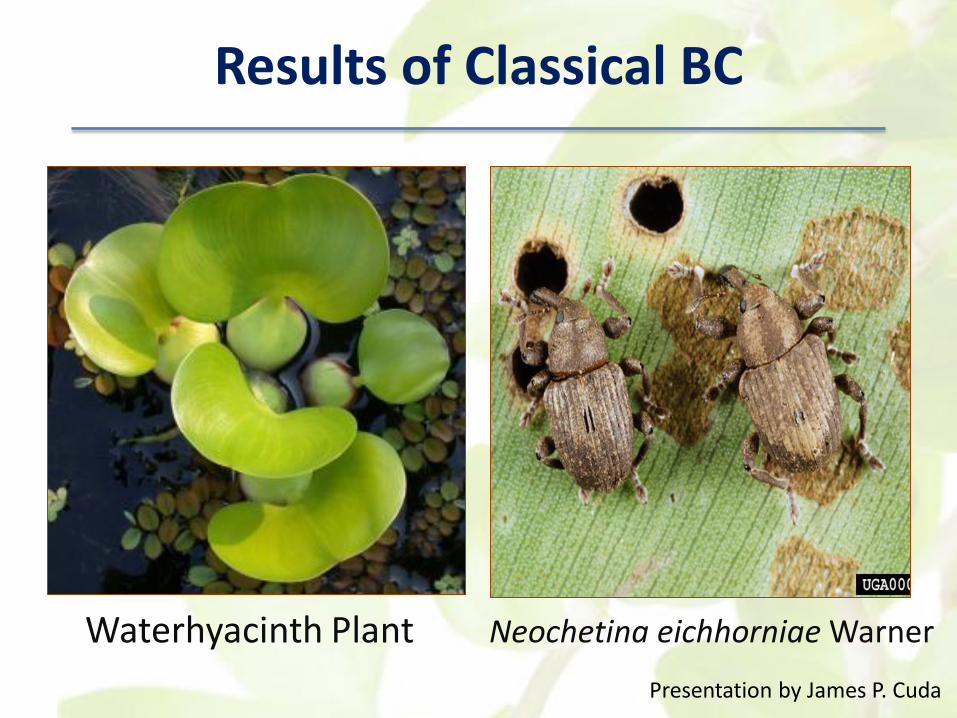
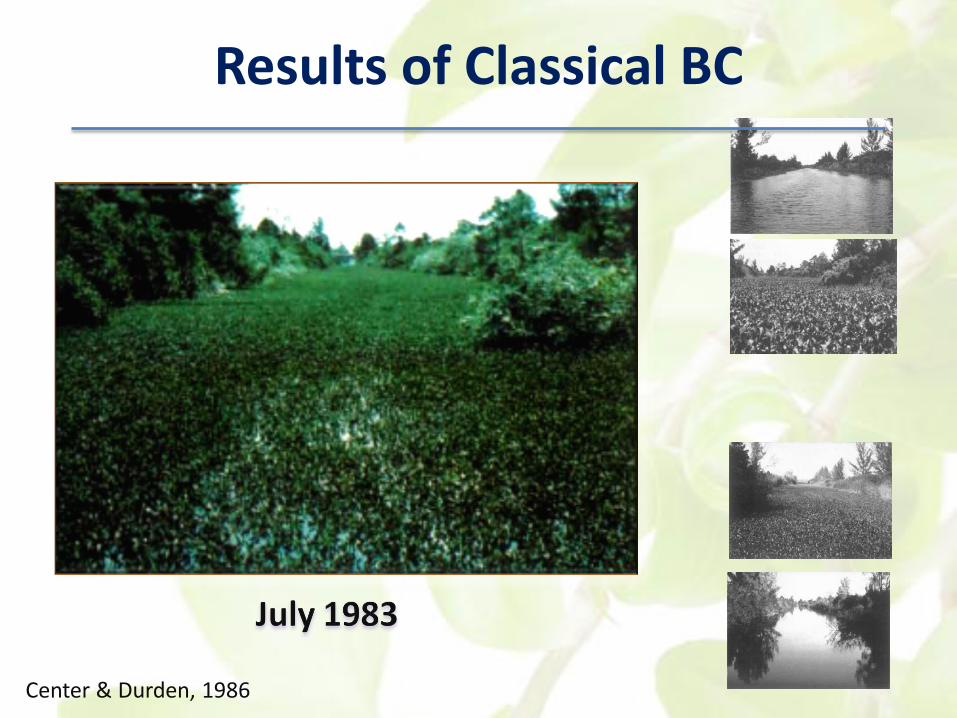
Results of Classical BC
Presentation by James P. Cuda
Waterhyacinth Plant Neochetina eichhorniae Warner
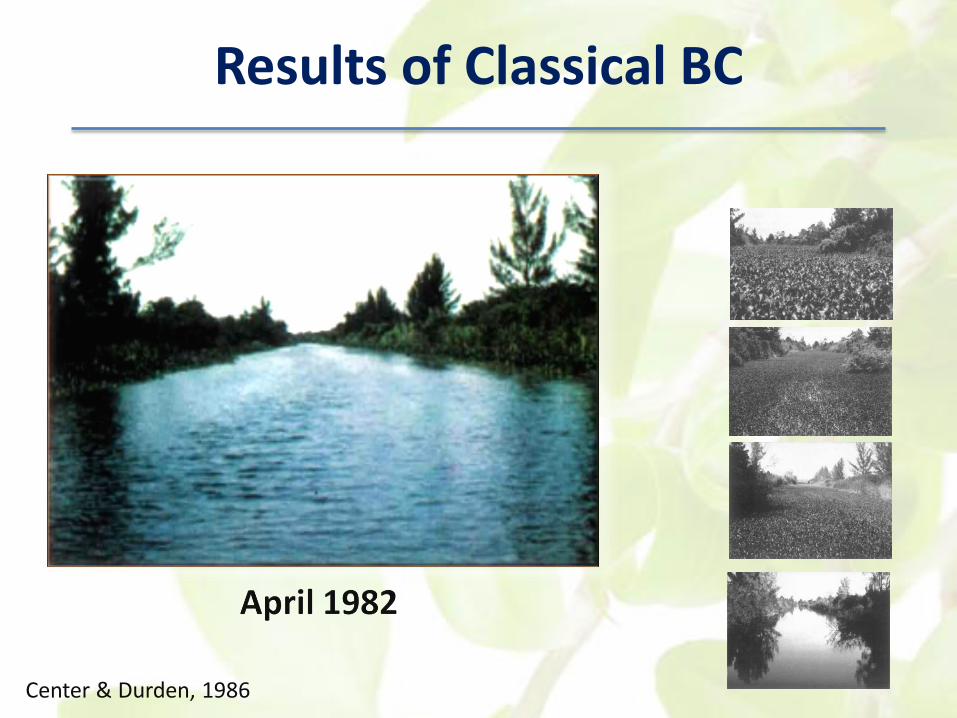
Center & Durden, 1986
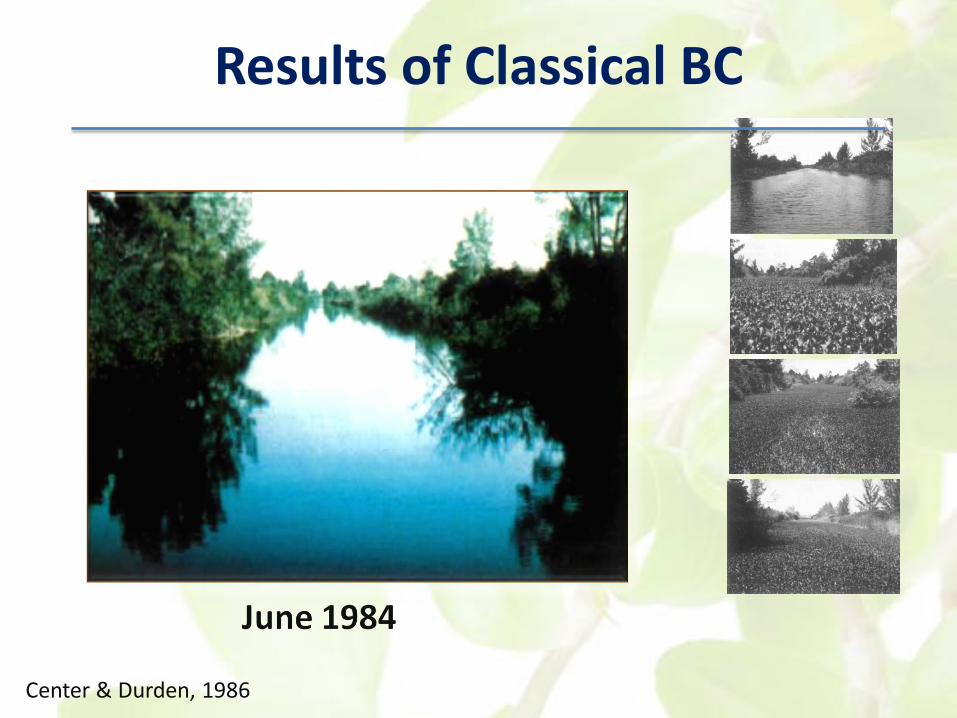
Results of Classical BC
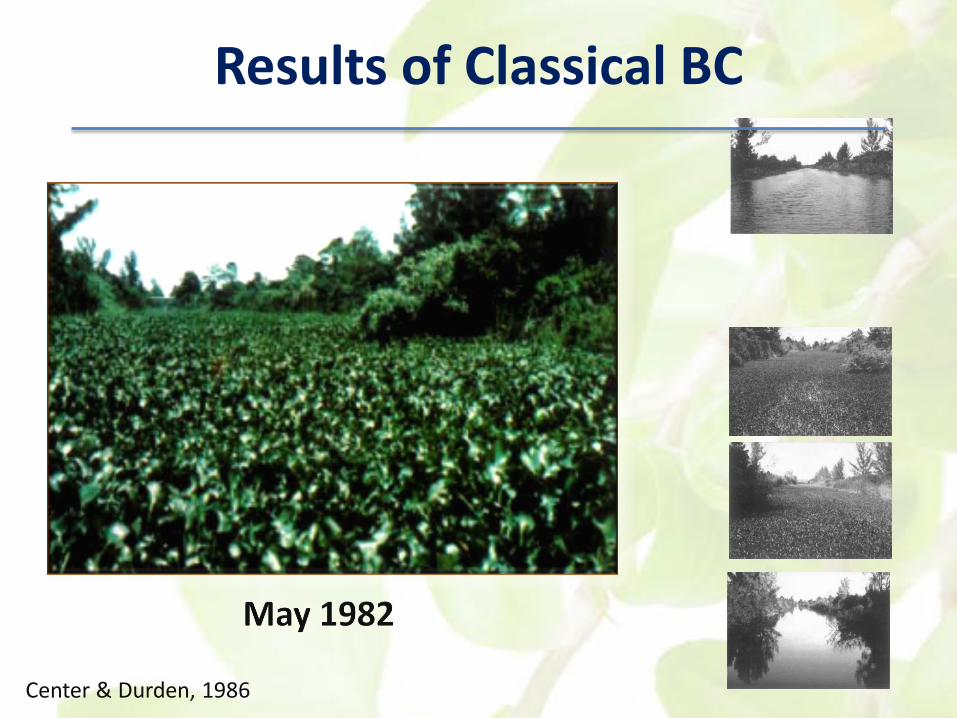
Center & Durden, 1986
Results of Classical BC
Center & Durden, 1986
Results of Classical BC

Center & Durden, 1986
Results of Classical BC
Center & Durden, 1986
Results of Classical BC
• Potential distribution of invasive weed
• Prediction of native distribution
• Identifying areas climatically most suitable for foreign exploration
• Potential spread of biocontrol agents
• Testing niche shift hypothesis
Application of ENM in CBC
Presentation by James P. Cuda
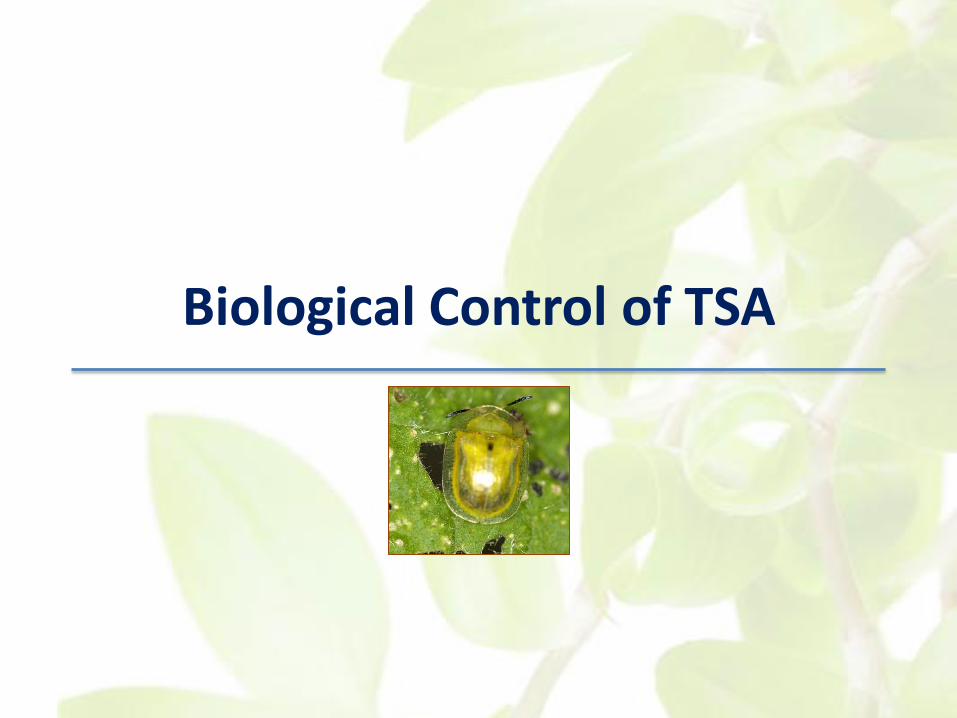
Biological Control of TSA
• Solanum viarum Dunal (Solanaceae)
• Invasive weed of pastures & woody areas in the SE US
• Native to South America
• In Florida, over 1 million acres are currently estimated to be infested
• Biocontrol project started in 1994
Tropical Soda Apple
Medal et al. , EDIS, UF
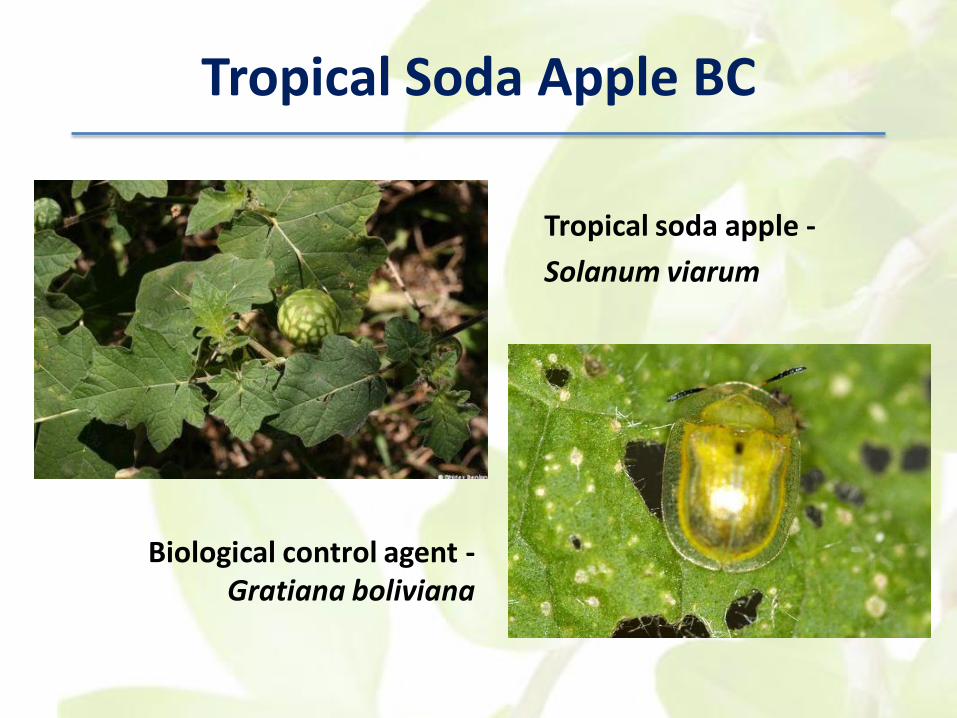
Tropical soda apple -
Solanum viarum
Biological control agent -Gratiana boliviana
Tropical Soda Apple BC
Tropical Soda Apple BC
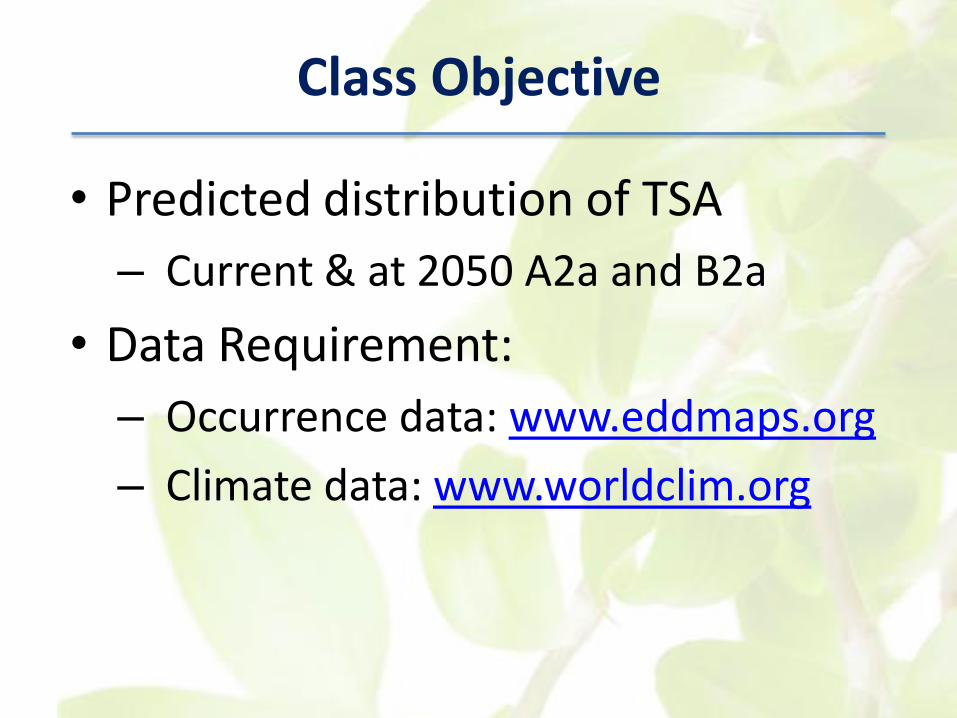
Class Objective
• Predicted distribution of TSA
– Current & at 2050 A2a and B2a
• Data Requirement:
– Occurrence data: www.eddmaps.org
– Climate data: www.worldclim.org
Diva-GIS Desktop
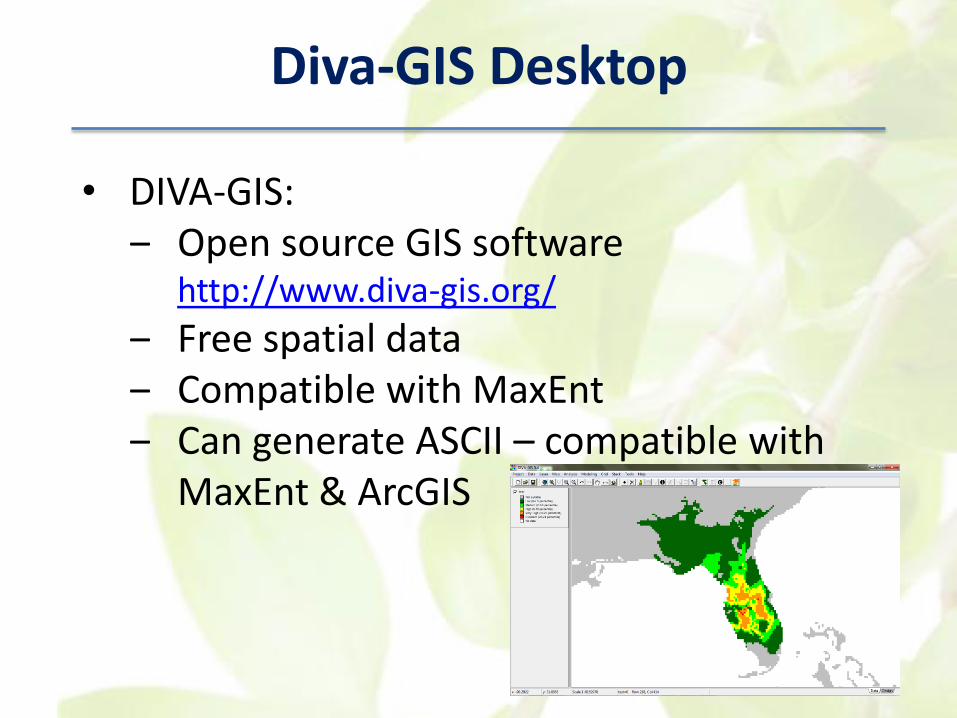
• DIVA-GIS: ‒ Open source GIS software
http://www.diva-gis.org/
‒ Free spatial data‒ Compatible with MaxEnt ‒ Can generate ASCII – compatible with
MaxEnt & ArcGIS
• Steps:– Import to grids
– Make & edit .clm files
– Prediction & projection datasets
– Make bioclimatic variables
Predicted Distribution of TSA
Medal et al. , EDIS, UF
• BIOCLIM model vs. Bioclimatic variable
• BIOCLIM model: an envelope style modeling method - models species space in the environmental hyper volume
• Biolimatic variables:
– Generated from monthly min. and max. temp. & preci
– Biologically more meaningful
– Represents annual trends
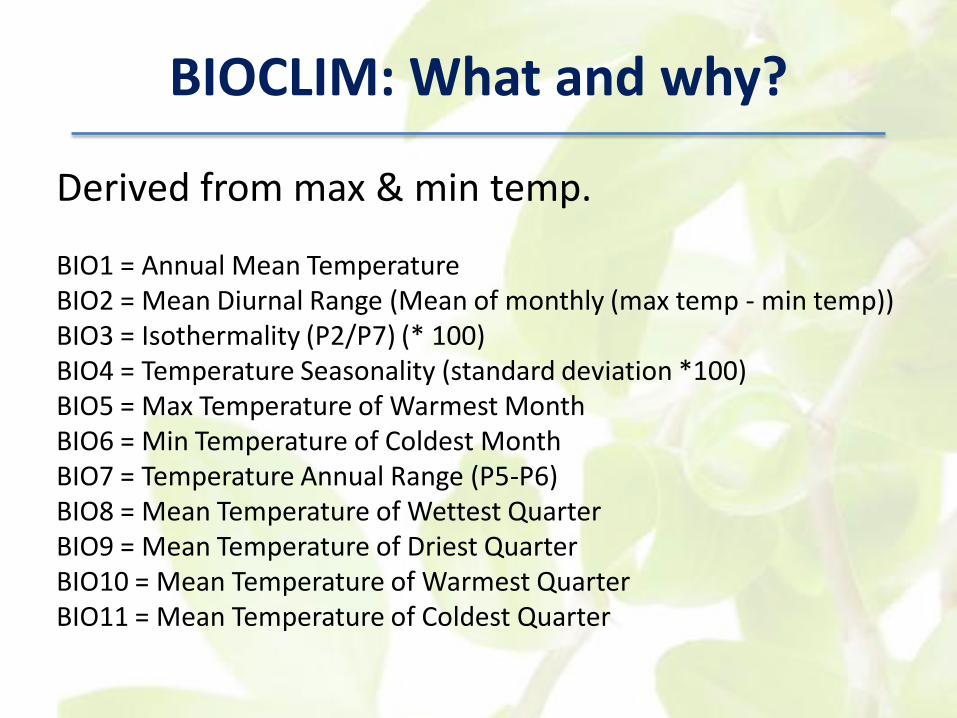
BIOCLIM: What and why?
0
10
20
30
40
Jan Feb Mar Apr May Jun Jul Aug Sep Oct Nov Dec
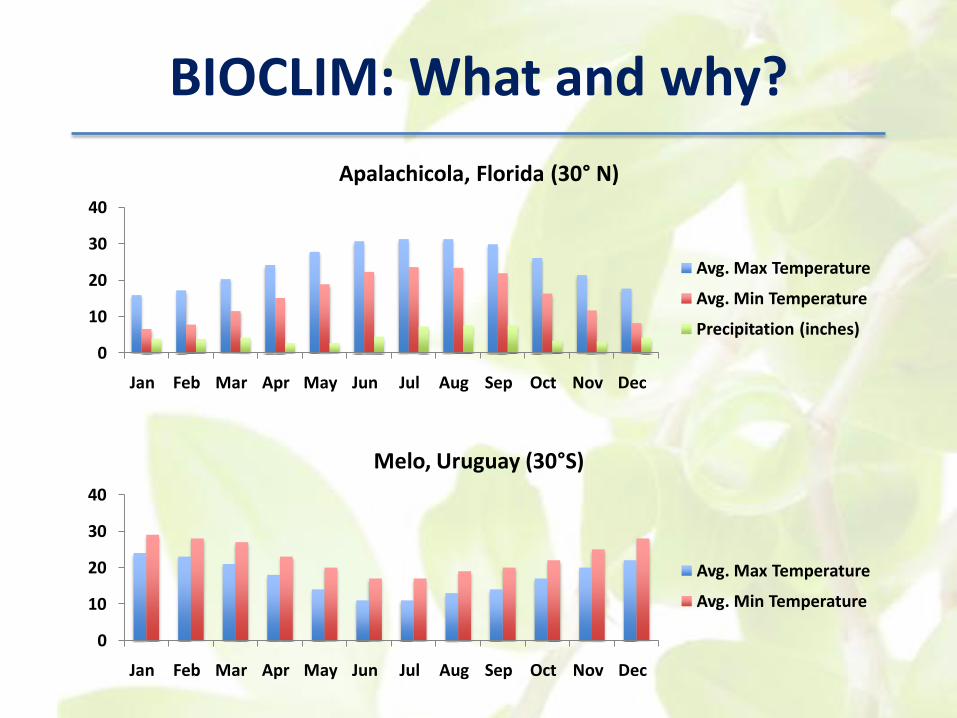
Apalachicola, Florida (30° N)
Avg. Max Temperature
Avg. Min Temperature
Precipitation (inches)
0
10
20
30
40
Jan Feb Mar Apr May Jun Jul Aug Sep Oct Nov Dec
Melo, Uruguay (30°S)
Avg. Max Temperature
Avg. Min Temperature
BIOCLIM: What and why?
BIOCLIM: What and why?
Derived from max & min temp.
BIO1 = Annual Mean TemperatureBIO2 = Mean Diurnal Range (Mean of monthly (max temp - min temp))BIO3 = Isothermality (P2/P7) (* 100)BIO4 = Temperature Seasonality (standard deviation *100)BIO5 = Max Temperature of Warmest MonthBIO6 = Min Temperature of Coldest MonthBIO7 = Temperature Annual Range (P5-P6)BIO8 = Mean Temperature of Wettest QuarterBIO9 = Mean Temperature of Driest QuarterBIO10 = Mean Temperature of Warmest QuarterBIO11 = Mean Temperature of Coldest Quarter
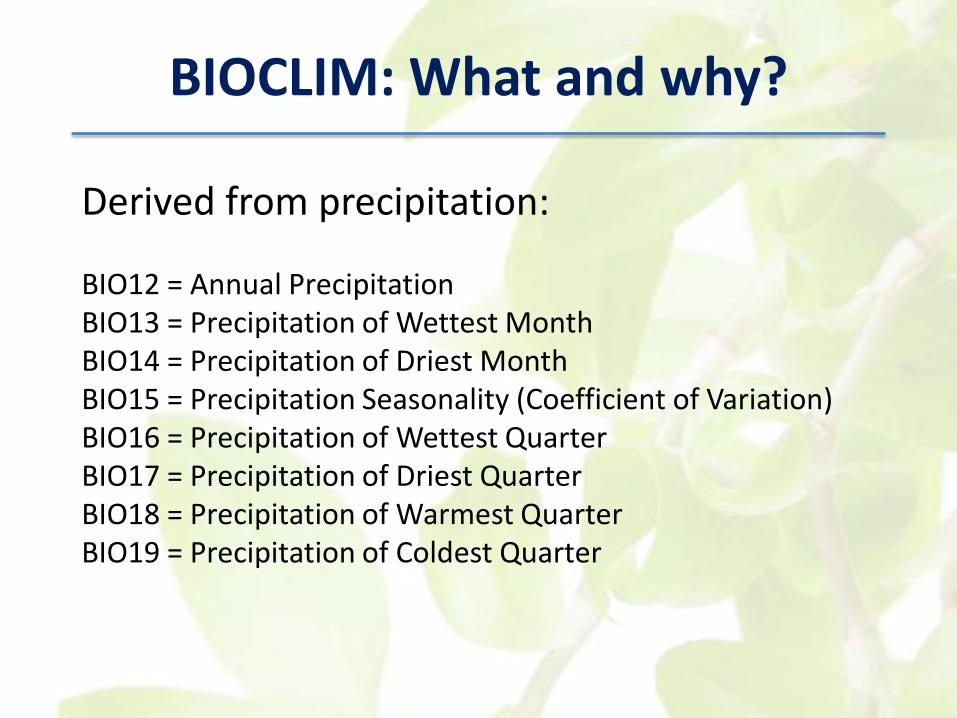
BIOCLIM: What and why?
Derived from precipitation:
BIO12 = Annual PrecipitationBIO13 = Precipitation of Wettest MonthBIO14 = Precipitation of Driest MonthBIO15 = Precipitation Seasonality (Coefficient of Variation)BIO16 = Precipitation of Wettest QuarterBIO17 = Precipitation of Driest QuarterBIO18 = Precipitation of Warmest QuarterBIO19 = Precipitation of Coldest Quarter

BIOCLIM Background
• Assume that climate restricts species distributions
• Summaries number of climatic variables within known range, generating a ‘bioclimatic envelope’
• Correlative modeling tool that interpolates up to 35 climatic parameters‒ 19 Bioclimate variables (Bio1 – Bio19)‒ 7 Solar radiation indices (Bio20 – Bio27)‒ 8 Pan evaporation indices
Beaumont et al. 2005
BIOCLIM Advantages
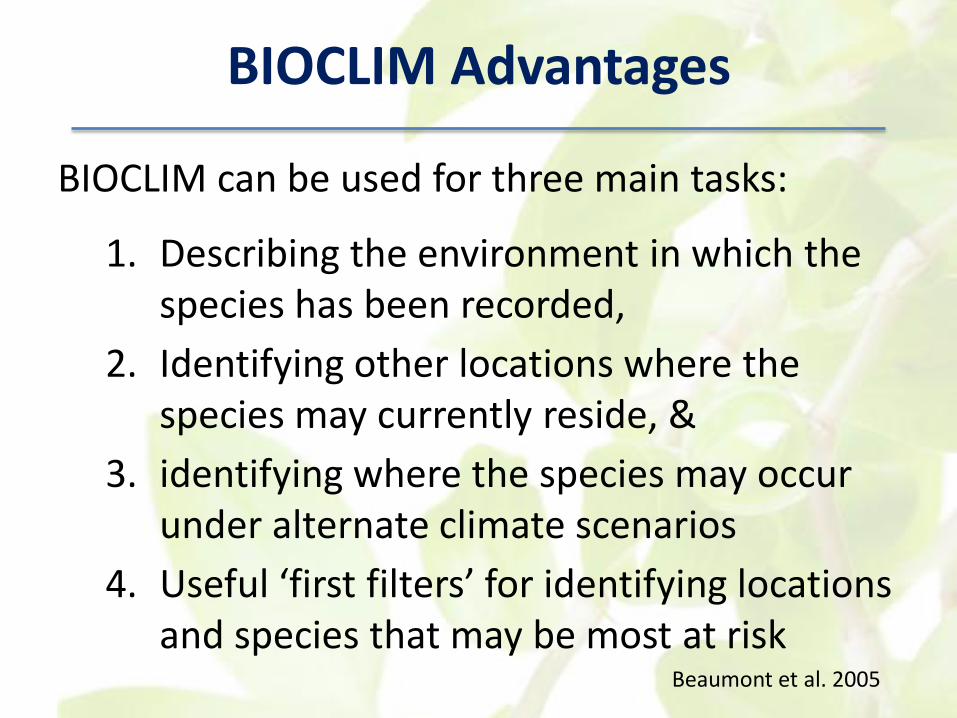
BIOCLIM can be used for three main tasks:
1. Describing the environment in which the species has been recorded,
2. Identifying other locations where the species may currently reside, &
3. identifying where the species may occur under alternate climate scenarios
4. Useful ‘first filters’ for identifying locations and species that may be most at risk
Beaumont et al. 2005
BIOCLIM Background
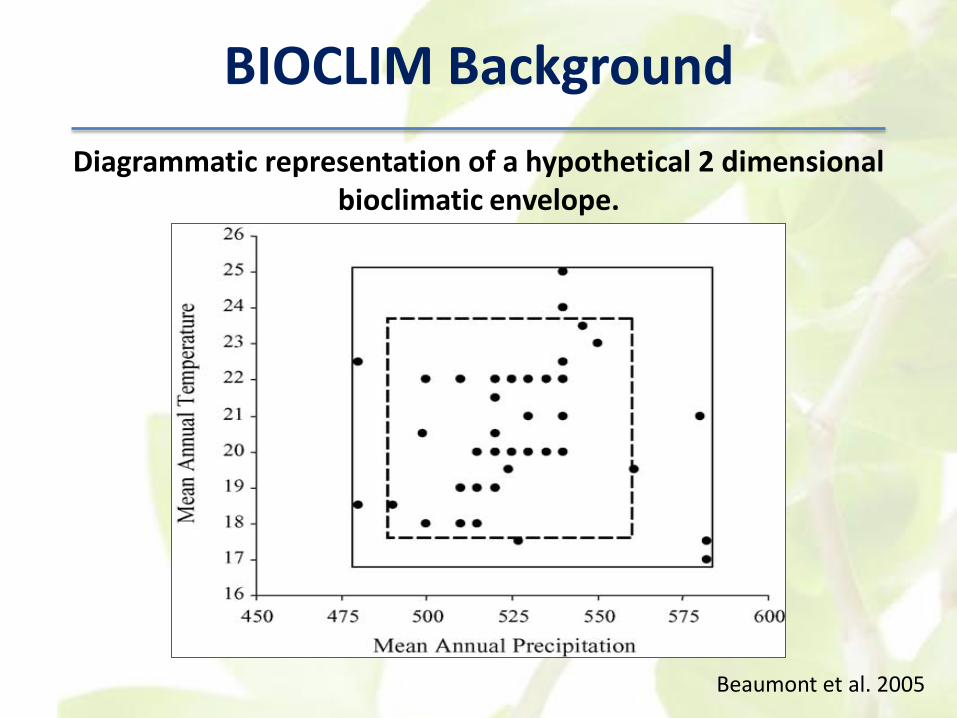
Beaumont et al. 2005
Diagrammatic representation of a hypothetical 2 dimensionalbioclimatic envelope.

BIOCLIM Background
800
900
1000
1100
1200
1300
1400
1500
1600
15 17 19 21 23 25 27
An
nu
al P
reci
pit
atio
n (
mm
)
Anneal Mean Temp (0C)
Current
2050
Factors Affecting Model Output
Related to Bioclim data:
1. Error associated with estimation of primary climatic attributes at a point
2. Relevance of derived bioclimatic indices.
3. Derivation of the bioclimatic envelope.
4. Accuracy and level of resolution of the grid used for predicting potential distribution
Nix 1986; http://fennerschool.anu.edu.au/publications

Factors Affecting Model Output
Related to Occurrence localities:
1. Taxonomic uncertainty
2. Accuracy of identification and labeling
3. Accuracy of geocoding
4. Adequacy of point sampling within total distribution
5. Checking of anomalous data points
Nix 1986; http://fennerschool.anu.edu.au/publications

BIOCLIM Criticisms
• Elith et al. 2006: Worst performing model
Elith et al. 2006