division of services for people with disabilities - utah
TRANSCRIPT

Division of Services for People with Disabilities
Annual Report
Fiscal Year 2010
State of Utah Department of Human Services

Table of Contents
3 Director’s Message 4 Executive Summary 5 Mission, Values and Vision 6 Historical Highlights 10 Disability Types 11 Agency Overview 12 Demographics 13 Waiting List 14 Measuring Performance 15 Budget Overview 16 Long Term Care Costs in Utah 17 Budget Cuts 18 Privatizing Support Coordination 19 Division Reorganization 20 Service Groupings

3
Like all state agencies, our Division experienced extremely difficult cuts in the past two years. Imple-menting the second year’s cuts added stress to an already challenged system. To implement these cuts, we took a highly-principled, business-like ap-proach. First, we continued to dramatically re-engineer our Division, looking for further efficien-cies. Just a few highlights: (1) when I became Di-rector, in 2008, we had 140 people in 25 state offices who performed case management services; now we have 15 to 18 who handle transition cases and per-form objective needs assessments; we have reduced our offices from 25 to 9, eliminated over half of our fleet usage, minimized computer and phone costs, lights, office supplies, etc.; (2) five years ago, we had 7 people in upper management: a Division Di-rector, two Assistant Directors, and 4 Region Direc-tors; now we will have 3: one Division Director, one Assistant Director over administration and one As-sistant Director over programs; (3) we were able to greatly reduce the number of administrative and case management support professionals from 25 FTE to 14 FTE; and (4) we reduced the number of Area Program Managers (employees who once supervised support coordinators and now monitor private sup-port coordinator contracts as well as grant final ap-proval to people’s budgets) from 25 employees to 20. In total, we went from 274 state and regional employees to 128. Needless to say, this has been a tremendous effort and we will continue to look for internal efficiencies.
While re-engineering was incredibly difficult and disruptive, the good news is that it worked. We es-tablished objective quality metrics and very care-fully observed the changes to ensure quality did not suffer. Every objective quality metric has improved without exception. This has required tremendous management focus and employees who have stepped up in incredible ways. I am really proud of our em-ployees, and you should know Utah’s taxpayers are getting more than their money’s worth from DSPD employees.
But re-engineering was not enough to meet the deep cuts of the past two years. After internal efficien-cies, there are really only 3 things we can change to deal with budget reductions: (1) we can reduce rates;
Director’s Message The Challenges of Implementing a Second Year of Cuts
(2) we can reduce staffing ratios; and (3) we can eliminate whole classes of service. After exten-sive public listening sessions involving hundreds of people in Salt Lake, Vernal, Price, St. George and Logan, we established a plan. We met with many legislators, the Legislative Fiscal Analyst’s office, and the Governor’s Office of Planning and Budget. We made the proposed plan avail-able on-line requesting feedback and input. We also pulled together a stakeholder group to thor-oughly analyze the options.
Regarding rates, the plan implemented a 15% reduction in the rate paid to support coordinators, reduced their direct service requirement by 16.67% and increased their caseload maximum by 15%. The other rate that was eliminated was the intensive residential rate. Regarding staffing ratios, we will be undertaking a gradual process to serve most people with 1:3 staffing (one staff person to three people served) for a majority of their day, with exceptions allowed for 1:2 and 1:1 staffing as necessary. We think this is advanta-geous for a number of reasons, including reduc-ing learned helplessness, creating a less restric-tive environment, and encouraging a system less reliant on high staffing ratios at a time when find-ing qualified staff will become difficult as the economy improves and baby boomers start de-manding services. Finally, after hearing from all of the families, providers, legislators and other stake holders, we made the decision to not elimi-nate any classes of service.
The Division recognizes the changes in service described above are difficult and have caused concern and fear. But we remain steadfastly committed and are confident that people served still have their needs met. We are hopeful there will not be deeper cuts in the future.
Alan K. Ormsby, J.D.

4
• Met the basic health, safety and service needs for 4,910 Utahns with severe disabilities through three Medicaid
Waiver programs, one Non-Medicaid program and through the State Developmental Center.
○ 4,387 in the Medicaid Waiver for Utahns with Intellectual Disabilities or Related Conditions ○ 113 in the Medicaid Waiver for Utahns with Physical Disabilities ○ 100 in the Medicaid Waiver for Utahns with Brain Injury ○ 94 in the Non-Medicaid program for Utahns with Disabilities (Including: 62 Utahns with Intellectual Dis-
abilities or related conditions, 25 Utahns with Physical Disabilities and 7 Utahns with Brain Injury not eligible for Medicaid)
○ 216 Utahns received 24 hour support at the Utah State Developmental Center • Provided 2,796 Utahns with supervision and training during the day or on the job, 1,714 with around the clock
supervision and training in group home, supervised apartment or home-like settings, 2,842 with intermittent family support or supported living and 138 with a personal assistant.
• Brought 42 people into services through emergency/crisis intervention. • Managed waiting list records for 1,953 Utahns with critical need for services. • Contracted with over 150 private providers who employed approximately 10,000 Utahns. • Invested state general fund in programs that received a return of four dollars for every dollar in state general
funds. This benefited the provider workforce by maximizing the state general funds. • Demographics
○ 79 percent of those receiving services have intellectual disabilities ○ Provided services to Utahns of all ages, average age 32 ○ 81 percent adults, 19 percent children ○ 41 percent women, 59 percent men
Executive Summary

5
Our mission is to promote opportunities and provide supports for persons with disabilities to lead self-determined lives.
Values • We value the preservation of family and other natural supports • We believe in stewardship and wise use of public resources • We value coordination and cooperation • We respect and support personal choice and personal responsibility • We respect personal and cultural diversity • We believe people deserve high quality supports and services • We believe funding should be needs based and should follow the person We Will… • Promote and recognize excellence • Continue a person-centered philosophy • Promote public awareness of disability issues • Work collaboratively to dissolve barriers to quality service • Support a full spectrum of service options • Support self-determination by assisting persons to exercise and develop their ability to make choices
and experience a) freedom to make informed choices from among available options of services and supports, b) authority to control a defined amount of dollars to purchase only what is needed and valued, c) support to nurture informal relationships that might augment, if not replace, some pur-chased services, and d) responsibility to give back to the community
Vision The Division is working toward a system that: • Serves Utahns with severe intellectual and physical disabilities and acquired brain injuries who are
carefully assessed and determined eligible • Is fully person-centered, recognizing and building upon a person's strengths • Values, enhances, reinforces and strengthens a person's natural supports whenever possible • Establishes services and budgets with an objective, strengths-based assessment tool applied uni-
formly across the state • Continually assesses utilization of services to ensure that needs and services match up at every given
point in time • Strives to maximize resources and attempts to eliminate the waiting list • Creates high quality standards and is diligent in consistently enforcing those standards • Uses objective data to drive decision making • Acknowledges and preserves the strengths of our provider network but is constantly pushing for
higher quality • Is responsive to the concerns of parents, advocates and other stakeholders
Mission, Values and Vision
6
1929 The Utah State Developmental Center is established by the Utah State Legislature.1
• Originally named the Utah State Training School. • Received its current name in 1991.2 • Today it is a state operated Intermediate Care Facility for People with Mental Retarda-
tion (ICF/MR) that serves 216 people with complex disabilities.3 1948 MRAU is founded. The volunteers at MRAU are focused on increasing choice through educa-
tion, support and advocacy on behalf of people with intellectual and developmental disabilities throughout Utah.4
1963 Mental Retardation Facilities and Community Mental Health Centers Construction Act is signed
into law. This legislation funds construction of facilities, research centers, councils and pro-grams for people with developmental disabilities.5
1965 Medicaid is created with the passage of Title XIX of the Social Security Act.6 1967 The Department of Human Services is organized.
• Originally named the Department of Health and Welfare. • Renamed the Department of Social Services in 1971.2 • Received its current name in 1990.7
1970 The Developmental Disabilities Services and Construction Act is signed into law.8 This act re-
quires that each state have a planning and advisory council which creates and implements the state’s plan for addressing the needs of people with developmental disabilities.
1971 The Utah Developmental Disabilities Council is created as a result of the Developmental Dis-
abilities Services and Construction Act.9 This council is tasked with advising the governor and legislature on issues affecting Utahns with disabilities.
• Originally named the Utah Advisory Council for Handicapped and Developmentally Disabled Children.
• Renamed the Utah Council for Handicapped and Developmentally Disabled Persons in 1976.10
• Renamed the Utah Governor's Council for People with Disabilities in 1994.11 • Received its current name in 2006.12
1971 Utah Association of Community Services (UACS) is founded. UACS member businesses con-
tract with the state to provide community-based supports to people with disabilities.13 1975 The Education for All Handicapped Children Act (EHA) is signed into law.14 Schools are no
longer allowed to turn away students with disabilities. Instead, they are to design a customized education plan which provides a “free appropriate public education” for each individual student to be provided in the “least restrictive environment” appropriate.
1978 The Utah Disability Law Center is founded. They focus on advocating for the rights of people
with disabilities throughout Utah.15 1979 The Division of Services for People with Disabilities is created.
• Initially begins as the Office of Handicapped Services at the Division of Health. • In 1981, the Department of Social Services creates the Division of Developmental Dis-
abilities and Mental Retardation. • These two agencies are merged in 1983 to form the Division of Handicapped Services at
the Department of Social Services.7 • Received its current name in 1991.3
Historical Highlights
7
1981 Section 1915 (c) "Waiver Authority" is added to the Social Security Act. It allows long-term
care to be provided in community-based programs rather than institutions. This is known as "waiver authority” because it enables states to have certain federal statutory requirements waived.16
1984 The Brain Injury Association of Utah is founded. They focus on building awareness about brain
injury prevention and recovery. Their network includes hospitals, government agencies and re-habilitation centers throughout Utah.17
1984 The Utah Parent Center is founded. They focus on peer support, information, training and advo-
cacy for families of people with a disability.18 1986 The Community Supports Waiver is established. This waiver allows the Division to provide
home and community-based services to individuals with disabilities in their own home who would otherwise require placement in an ICF/MR.
• Originally named the Developmental Disabilities/Mental Retardation Waiver. • Renamed the Mental Retardation/Related Conditions Waiver in 2005. • Received its current name in 2007. • Currently 4,387 Utahns receive services through this waiver.
1989 The Lisa P. v. Angus class action lawsuit is filed. It seeks community placement for residents of
the Utah State Developmental Center.19 1990 The Individuals with Disabilities Education Act (IDEA) is signed into law. This legislation
amends the Education for All Handicapped Children Act of 1975 (EHA).14 IDEA expands on the definition of “least restrictive environment” to require that students with disabilities be edu-cated with students without disabilities whenever possible.20
1990 The Americans with Disabilities Act is signed into law. This landmark federal legislation pro-
hibits discrimination on the basis of disability. Businesses, governments and non-profits alike begin design changes to buildings, roads, sidewalks, vehicles, services and programs of many kinds to make them accessible to people with disabilities. In addition, employers are now re-quired to provide "reasonable accommodation" for employees with disabilities.21
1990 The Access Utah Network is founded. They focus on helping people with disabilities and their
caregivers find sources for the supports that they need.22 1993 A settlement agreement is reached in the Lisa P. v. Angus class action lawsuit which requires
that residents at the Developmental Center be evaluated to determine the "least restrictive and most enabling environment" for each.19
1995 The Acquired Brain Injury Waiver is established. This waiver allows the Division to provide
home and community-based services to individuals with brain injuries who would otherwise re-quire placement in a nursing facility.
• Originally named the Traumatic Brain Injury Waiver. • Expanded in 2004 to serve people with acquired brain injuries and is renamed the Ac-
quired Brain Injury Waiver. • Currently 100 Utahns receive services through this waiver.23
1996 The Robert Wood Johnson Foundation Self-Determination Grant is awarded in July. It enables
the Division to restructure the provision of supports to allow for a self-directed approach.
Historical Highlights

8
1997 Budget Balancing Act is signed into law. Although primarily concerned with the federal budget,
this act also includes language which eliminates the restriction that only people who had been previously institutionalized could receive Medicaid-funded supported employment services.24
1998 The Physical Disability Waiver is established. It allows the Division to provide home and com-
munity-based services to individuals who would otherwise require placement in a nursing facil-ity.
• Currently 113 Utahns receive services through the Physical Disability Waiver. 1998 Portability of Funding for Health and Human Services is signed into law. This legislation en-
ables the Division to work with the Division of Health Care Financing to transfer funding as needed to enable people with disabilities to move out of institutions and into the community.25
1998 The Self-Administered Services Program is piloted. This program gives people with a disability
and their families the ability to self-administer services. This program shifts the selection and management of staff from contracted providers to the family and enables much greater flexibility for families while reducing costs for the Division.
• Originally named Self-Directed Services Program. • Renamed Self-Administered Model in 2000 and began using fiscal agents to manage
payroll functions. • Renamed Self-Administered Services in 2005. • Currently 1,510 Utahns receive services through this program.
1999 The court case Olmstead v. L.C. is decided by the Supreme Court. The Court rules that services
to people with disabilities must be provided "in the most integrated setting appropriate to their needs."26 This ruling leads to the removal of many people from institutional settings to smaller-sized community-based programs across the nation.18
2001 The Lisa P. v. Angus class action lawsuit is dismissed after the Division fulfills the terms of the
settlement agreement.19 This agreement enables over 100 people to move into the community from the Utah State Developmental Center.
2002 The Real Choice Systems Change Grant is awarded. This grant enables the state to make sys-
tematic improvements to serve people with disabilities at a higher level of quality and efficiency. 2003 The Utah Registry of Autism and Developmental Disabilities (URADD) is founded. Primarily
concerned with gathering data regarding autism-spectrum disorders, URADD is part of a net-work established by the Centers for Disease Control and Prevention (CDC).27
2006 A Supported Employment Pilot Program is initiated by the Utah State Legislature in July to offer
employment supports for people on the waiting list.28 • The Supported Employment pilot program changes to an on-going program in fiscal
year 2008.29 • The program’s budget is cut in fiscal year 2010, then restored in fiscal year 2011.
2007 The Traumatic Brain Injury Partnership Grant is awarded. This grant enables the Division to
build partnerships between state agencies serving individuals with traumatic brain injuries. The Division develops training modules to serve as best practice material and help eliminate unneces-sary interventions for individuals with a traumatic brain injury.
2007 The Family Preservation Pilot Program is established in July. This pilot program is designed to
provide caregivers the skills to reduce stress and build their circle of support. This program is dissolved after the fiscal year 2009 Special Session cuts.
Historical Highlights

9
Historical Highlights
Footnotes: 1. S.B. 51, An Act to Provide for the Establishment, Building and Equipping of the Utah State Training School from the 1929 General Session of the Utah State Legislature. 2. H.B. 313, Omnibus Disability Service Act from the 1991 General Session of the Utah State Legislature. 3. Department of Human Services. (2006). Utah State Developmental Center. Retrieved September 27, 2010 from http://usdc.utah.gov/ 4. MRAU. (n.d.). About MRAU. Retrieved September 27, 2010 from http://www.mrau.org/about_mrau.htm 5. Mental Retardation Facilities and Community Mental Health Centers Construction Act, 20 U.S.C.A. 611, 612, 613, 617, 618, 676 and 42 U.S.C.A. 291(k), 295-295(e), 2661-2665, 2671-2677, 2681-2687, 2691-2696. 6. Social Security Act, Title XIX, 42 U.S.C.A. § 1396 et. seq. 7. Division of Archives and Records Services. (2003). Dept. of Human Services Agency History #1116. Retrieved September 27, 2010 from http://archives.utah.gov/research/agencyhistories/1116.html 8. Developmental Disabilities Services and Construction Act, 42 U.S.C.A. 2661-2666. 9. Executive Order. Governor Calvin Rampton (February 2, 1971). 10. Executive Order. Governor Calvin Rampton (July 1, 1976). 11. Executive Order. Governor Michael O. Leavitt (February 4, 1994). 12. Executive Order. Governor Jon M. Huntsman, Jr. (April 5, 2006). 13. Utah Association of Community Services. (2008). Celebrating Our 35 Year History. Retrieved September 27, 2010 from http://www.uacs.org/about.php 14. Education for All Handicapped Children Act of 1975, 20 U.S.C.A. § 1401 et seq. 15. Disability Law Center. (2010). A Brief History of the Disability Rights Movement. Retrieved September 27, 2010 from http://www.disabilitylawcenter.org/about/a_brief_history_of_dr_movement.html 16. U.S. Department of Health and Human Services. (2000). Understanding Medicaid Home and Community Services: A Primer. Retrieved September 27, 2010 from http://aspe.hhs.gov/daltcp/reports/primer.htm 17. Brain Injury Association of Utah. (n.d.) Who is BIAU? Retrieved September 27, 2010 from http://www.biau.org/who/who.html 18. Utah Parent Center. (2010). About The Utah Parent Center. Retrieved September 27, 2010 from http://www.utahparentcenter.org/ about_us.htm 19. Utah State Legislature. (2001). Lisa P Settlement Agreement Costs. Retrieved September 27, 2010 from http://www.le.state.ut.us/ audit/01_05ilr.pdf 20. Individuals with Disabilities Education Act of 1990, 20 U.S.C.A. § 1401 et seq. 21. Americans with Disabilities Act of 1990, 42 U.S.C.A. § 12101 et seq. 22. Access Utah Network. (2010). Retrieved September 27, 2010 from http://www.accessut.state.ut.us/ 23. Division of Services to People with Disabilities. (2009). Application for a §1915 (c) HCBS Waiver. Retrieved September 27, 2010 from http://dspd.utah.gov/docs/ABI%20l6.18.09.pdf 24. Budget Balancing Act of 1997. (1997). 105th Congress Public Law 33. Retrieved September 28, 2010 from http://www.gpo.gov/fdsys/pkg/ PLAW-105publ33/html/PLAW-105publ33.htm 25. H. B. 372, Portability of Funding for Health and Human Services from the 1998 General Session of the Utah State Legislature. 26. State of Utah. (2002). Comprehensive Plan For Public Services in the Most Appropriate Integrated Setting. Retrieved September 27, 2010 from http://www.dhs.utah.gov/pdf/TheOlmstead-Plan.pdf 27. Utah Department of Health. (2007). Utah Registry of Autism and Developmental Disabilities. Retrieved September 27, 2010 from http://www.health.utah.gov/autism/ 28. H.B. 31, Pilot Program for the Provision of Services for People with Disabilities from the 2006 General Session of the Utah State Legislature. 29. H.B. 45, Supported Employment Services to a Person with a Disability from the 2008 General Session of the Utah State Legislature.
2008 The Medicaid Infrastructure Grant is awarded. This grant enables the Division to add a staff
member dedicated to evaluations and recommendations for customized employment options. 2008 The Respite Pilot Program is established in July. This pilot program is funded by the legislature
with one-time funding to provide respite services to 250 families. Entry is frozen after the fiscal year 2009 Special Session cuts.
2010 Two years of budget cuts result in service rate cuts, personnel cuts, privatization of case manage-
ment functions, and internal reorganization. (See pages 18-20.)

10
Qualifying Diagnoses of Consumers in Services
Disability Types
Physical Disabilities (n = 138)
Fracture of Vertebral Column with Spinal Cord Injury, 2%
Intracranial Injury of Other and Unspecified Nature, 2%
Other, 16%
Anterior Horn Cell Disease, 2%
Paraplegia, 3%
Quadriplegia, Unspecified, 7%
Muscular Dystrophies and Other Myopathies, 7%
Multiple Sclerosis, 7%
Quadriplegia, C1-C4, 9%
Infantile Cerebral Palsy, 9%
Quadriplegia, C5-C7, 23%
Quadriplegia and Quadriparesis, 12%
Community Supports (n = 4,449)
Moderate Mental Retardation, 19%
Severe Mental Retardation, 12%
Other, 2%
Spina Bifida, <1%
Other and Unspecified Congenital Anomalies, 1%
Epilepsy, 1%
Profound Mental Retardation, 12%
Intracranial Injury of Other and Unspecified Nature, <1% Related Conditions,
18%
Mild Mental Retardation, 37%
Pervasive Developmental Disorders (Autism), 8%
Infantile Cerebral Palsy,
4% Chromosomal Anomalies, 2% Unspecified
Mental Retardation, 2%
Acquired Brain Injury (n = 107)
Postconcussion Syndrome, 15%
Personality Change Due to Conditions Classified Elsewhere, 8%
Other and Unqualified Skull Fractures, 6%
Late Effects of Cerebrovascular Disease, 5%
Unspecified Nonpsychotic Mental Disorder Following Organic B, 5%
Cerebral Laceration and Contusion, 4%
Fracture of Vault of Skull, 3%
Intracerebral Hemorrhage, 3%
Other, 18%
Intracranial Injury of Other and Unspecified Nature, 16%
Other Conditions of Brain, 17%

11
Agency Overview
Fiscal Year 2010 Headcount In Services Home and Community Based Services (HCBS) Medicaid Funded Acquired Brain Injury 100 Community Supports 4,387 Physical Disabilities 113 Total Medicaid Funded 4,600 Non-Medicaid Funded Acquired Brain Injury 7 Community Supports 62 Physical Disabilities 25 Total Non-Medicaid Funded 94 All HCBS Acquired Brain Injury 107 Community Supports 4,449 Physical Disabilities 138 Total HCBS 4,694 Utah State Developmental Center 216 Total In Services 4,910 Waiting List Acquired Brain Injury 68 Community Supports 1,821 Physical Disabilities 64 Total Waiting List 1,953
Services for People with Disabilities: Number of People Served and WaitingFY 1990 to FY 2010
0
1,000
2,000
3,000
4,000
5,000
6,000
1990
1991
1992
1993
1994
1995
1996
1997
1998
1999
2000
2001
2002
2003
2004
2005
2006
2007
2008
2009
2010
S e rvedWaiting fo r Se rvices

12
42%
58%
Physical Disabilities Waiver
36%
64%
41%
59%
Acquired Brain Injury Waiver Community Supports Waiver
32%
68%
State-Funded Services
0%
5%
10%
15%
20%
25%
30%
35%
0-9 10-19 20-29 30-39 40-49 50-59 60-69 70-79 80-89 90-99
In Services Waiting Lis t
Demographics Utahns Receiving Services
Race/Ethnicity
Count Percent White 3,991 85% Latino/Hispanic 460 10% American Indian 71 2% Asian/Pacific Islander 60 1% African American 59 1% Other/Unknown 53 1%
Gender
Male Female
Functional Limitations Twenty-seven individuals were under age seven, considered too young to have functional limitations determined. To be eligible for DSPD services, individuals aged seven years and over must have at least three documented functional limitations in seven designated areas as shown below:
Community Supports
Functional Limitation People Capacity for independent living 4,322 Self-direction 4,145 Learning 4,066 Economic self-sufficiency 3,334 Self-care 3,028 Receptive and expressive language 2,325 Mobility 1,064
People receiving services due to intellectual dis-abilities most commonly have four functional limi-tations. (n = 4,422)
Physical Disabilities
Functional Limitation People Self-care 138 Mobility 138 Capacity for independent living 134 Economic self-sufficiency 18 Receptive and expressive language 10 Self-direction 3 Learning 0
People receiving services due to a physical disabil-ity most commonly have three functional limita-tions. (n = 138)
Acquired Brain Injury
Functional Limitation People Employment 103 Memory or cognition 102 Judgment and self protection 99 Activities of daily life 89 Control of emotion 66 Physical health 53 Communication 46
People with acquired brain injury most commonly have five functional limitations. (n = 107)
Relationship to DSPD by Age Bracket
In Services Waiting List
Age
13
Waiting List
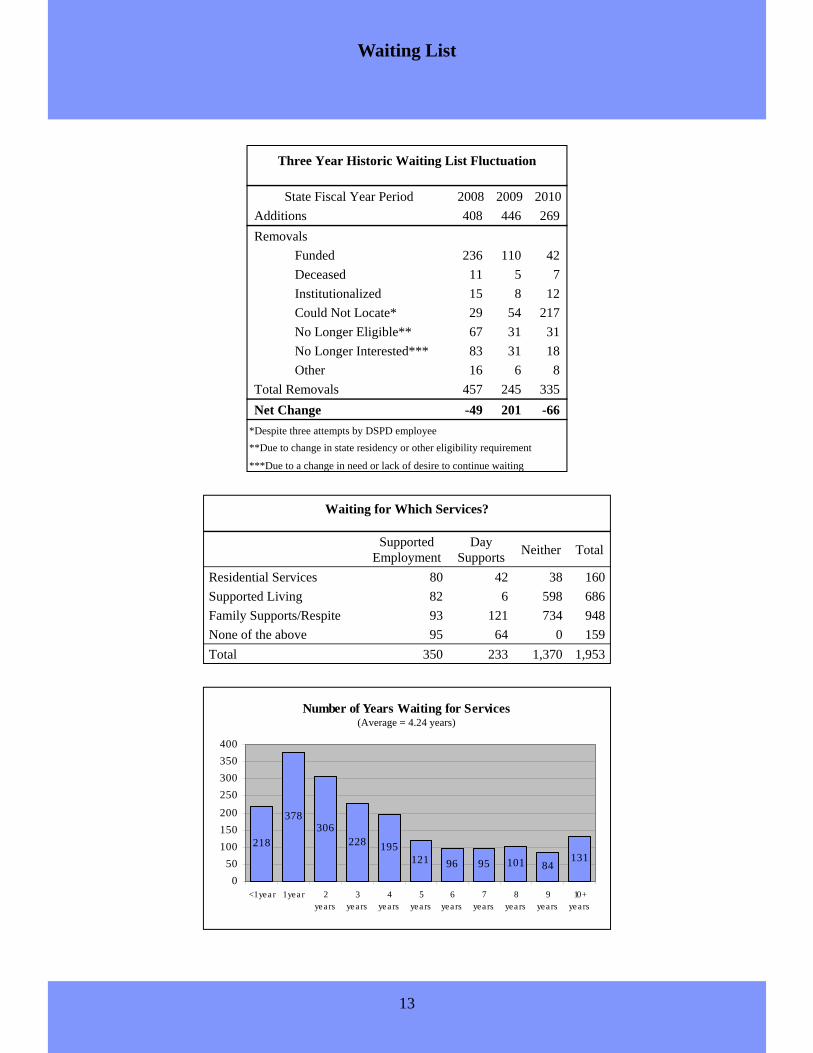
Waiting for Which Services?
Supported Employment
Day Supports Neither Total
Residential Services 80 42 38 160 Supported Living 82 6 598 686 Family Supports/Respite 93 121 734 948 None of the above 95 64 0 159 Total 350 233 1,370 1,953
Three Year Historic Waiting List Fluctuation
State Fiscal Year Period 2008 2009 2010 Additions 408 446 269 Removals Funded 236 110 42
Deceased 11 5 7 Institutionalized 15 8 12 Could Not Locate* 29 54 217 No Longer Eligible** 67 31 31 No Longer Interested*** 83 31 18 Other 16 6 8
Total Removals 457 245 335 Net Change -49 201 -66
*Despite three attempts by DSPD employee **Due to change in state residency or other eligibility requirement
***Due to a change in need or lack of desire to continue waiting
Number of Years Waiting for Services
218
378306
228 195121 96 95 101 84
131
050
100150200250300350400
<1 year 1 year 2years
3years
4years
5years
6years
7years
8years
9years
10+years
(Average = 4.24 years)

14
Measuring Performance
152
Contract Compliance
Number of contract reviews completed this year
98% Providers who met fiscal compliance
97% Providers who met contract compliance (non-fiscal)
97%
Face-to-face Visits
Proportion of face-to-face visits with clients completed by Support Coordinators as required
114.9
Financial Performance
Total General Fund dollars saved by using Medicaid funds
18.6 Total General Fund dollars saved as compared to ICF/MR
1.85% Total funding used for State Office administration
93.7%
Quality
Satisfaction with Support Coordinator
86.5% Satisfaction with Staff
92.7%
Consumer Satisfaction (Self-Administered Services Model)
Satisfaction with Support Coordinator
95.2% Satisfaction with Staff
85.1% Satisfaction with Fiscal Agent
Consumer Satisfaction (Provider-Based Model)
2.17 Number of incidents per 100 clients (average monthly)
8.33
Number of Quality Reviews con-ducted annually per quality team FTE
28.4%
Family Preservation
Proportion of consumers with supported employment as their day support.
63.5%
Proportion of consumers receiving in-home rather than out of home support
15
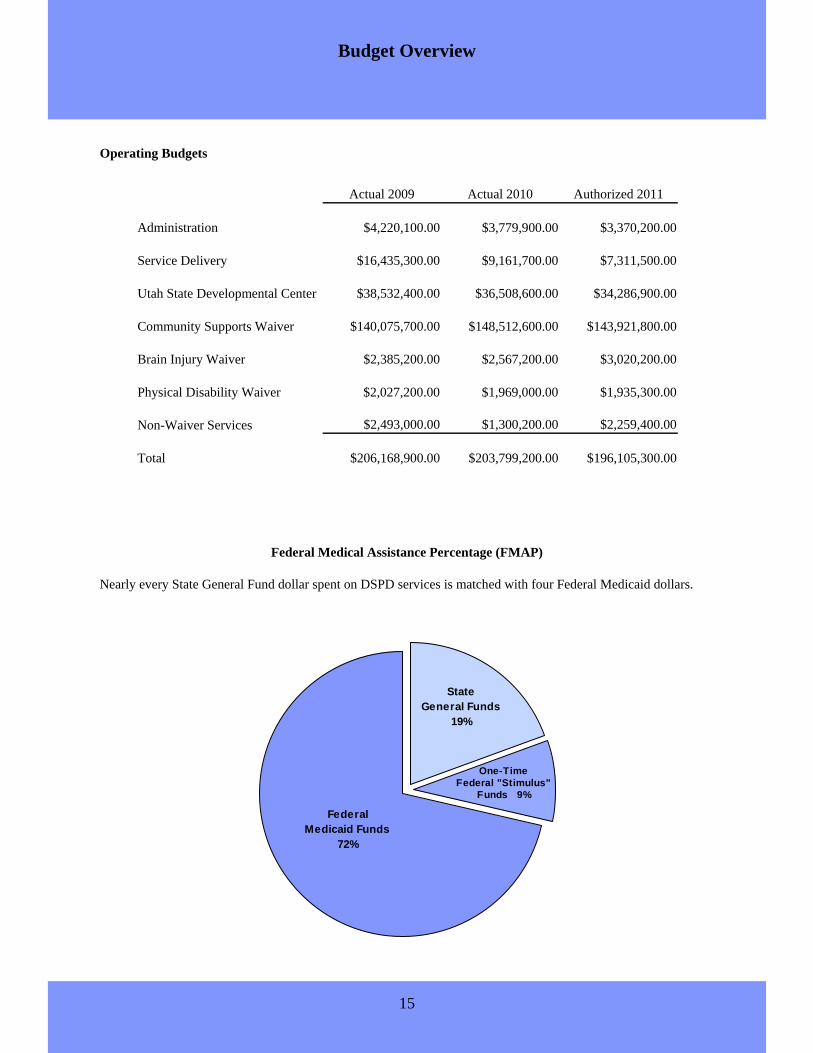
Budget Overview
Federal Medical Assistance Percentage (FMAP)
Operating Budgets
Actual 2009 Actual 2010 Authorized 2011
Administration $4,220,100.00 $3,779,900.00 $3,370,200.00
Service Delivery $16,435,300.00 $9,161,700.00 $7,311,500.00
Utah State Developmental Center $38,532,400.00 $36,508,600.00 $34,286,900.00
Community Supports Waiver $140,075,700.00 $148,512,600.00 $143,921,800.00
Brain Injury Waiver $2,385,200.00 $2,567,200.00 $3,020,200.00
Physical Disability Waiver $2,027,200.00 $1,969,000.00 $1,935,300.00
Non-Waiver Services $2,493,000.00 $1,300,200.00 $2,259,400.00
Total $206,168,900.00 $203,799,200.00 $196,105,300.00
Federal Medicaid Funds
72%
One-Time Federal "Stimulus"
Funds 9%
State General Funds
19%
Nearly every State General Fund dollar spent on DSPD services is matched with four Federal Medicaid dollars.

16
Long Term Care Costs in Utah
Average State General Fund Cost per Person
Institutions
Home & Community Based³
Family Preservation³
In-Home Self-Administered
In-Home Provider Based
Supported Living
Host Home/ Professional Parent
Residential
Nursing Home²
Intermediate Care Facility¹
Utah State Developmental
Center
Dollar amounts in State General Fund (26.2725% of total cost). ¹Costs do not include $4,853 for enhanced behavior intervention add-on if utilized nor do they include other compensation to providers in the form of incentives/grants. ²Costs do not include medical and behavioral add-ons, nor do they include other compensation to providers in the form of incentives/grants. ³Costs include neither day programs ($2,564) nor supported employment ($1,679). References: http://www.health.utah.gov/medicaid/stplan/NursingHomes/Rates/ICFMR/IcfMrRateCalFY10.pdf (Accessed: 8/26/2010)

17
Privatized (2010): 76
Eliminated (2010): 5
Eliminated (2009): 20
Privatized (2009): 51
Vacant: 12Active: 128
Personnel Cuts Announced by the End of Fiscal Year 2010 (2009-2010)
In fiscal year 2010, DSPD took a $2,703,400 General Fund budget cut. This was in addition to a $1,071,000 Gen-eral Fund cut following Fiscal Year 2009 Special Session in autumn of 2008. Fiscal Year 2010 cuts to Administra-tion and Service Delivery ($907,000) represent a 17.4% cut to the budget for those categories. Fiscal Year 2010 cuts were implemented through multiple strategies including the following: Cuts to Administration and Service Delivery ($907,000) • Privatizing support coordination • Office closures • Reductions in force • Retirement incentives • Hiring freeze/attrition • Eliminating overtime and comp time Cuts to Services ($1,796,400) • 3.5% across-the-board cut to all provider
rates • Elimination of some non-Medicaid
services and contracts Personnel Cuts Over 50% of positions have been externalized or eliminated. Cuts in areas other than Support Coordination were achieved through a combination of retirement incentives, attrition and reduction-in-force. In addition, several em-ployees are temporarily handling additional job functions associated with 12 positions impacted by a hiring freeze.
Budget Cuts
Back-filled with one-time money.
His t o ric P ro v id e r R a t e A d jus t me nts
+1.6 % +0.8 %+2.0 %
+4 .8%+3 .0%
-4 .8 %-3 .5%
-6 .0%
-4 .0%
-2 .0%
0 .0%
2 .0%
4 .0%
6 .0%
2 005 20 06 2 00 7 20 08 2 00 9 2 010 2 011
S t at e F is c a l Y e a r
Rat
e A
djus
tmen
t
Historic Provider Rate Adjustments*
State Fiscal Year
Except in 2009 (when providers received 100% of their increase), disabilities providers received a “cost of living” increase based on personnel costs which the legislature set at 80% of their total costs.
*
+1 . 6%
18
0%
20%
40%
60%
80%
100%
Jul-0
8
Aug-
08Se
p-08
Oct
-08
Nov
-08
Dec
-08
Jan-
09
Feb-
09M
ar-0
9
Apr
-09
May
-09
Jun-
09
Jul-0
9A
ug-0
9Se
p-09
Oct
-09
Nov
-09
Dec
-09
Jan-
10Fe
b-10
Mar
-10
Apr
-10
May
-10
Jun-
10
External Internal
94%
85%
89%
96%
88%
76%
78%
90%
0% 10% 20% 30% 40% 50% 60% 70% 80% 90% 100%
Overall satisfaction
Face to face visits
Responsiveness andfollow-up
Wants to retain
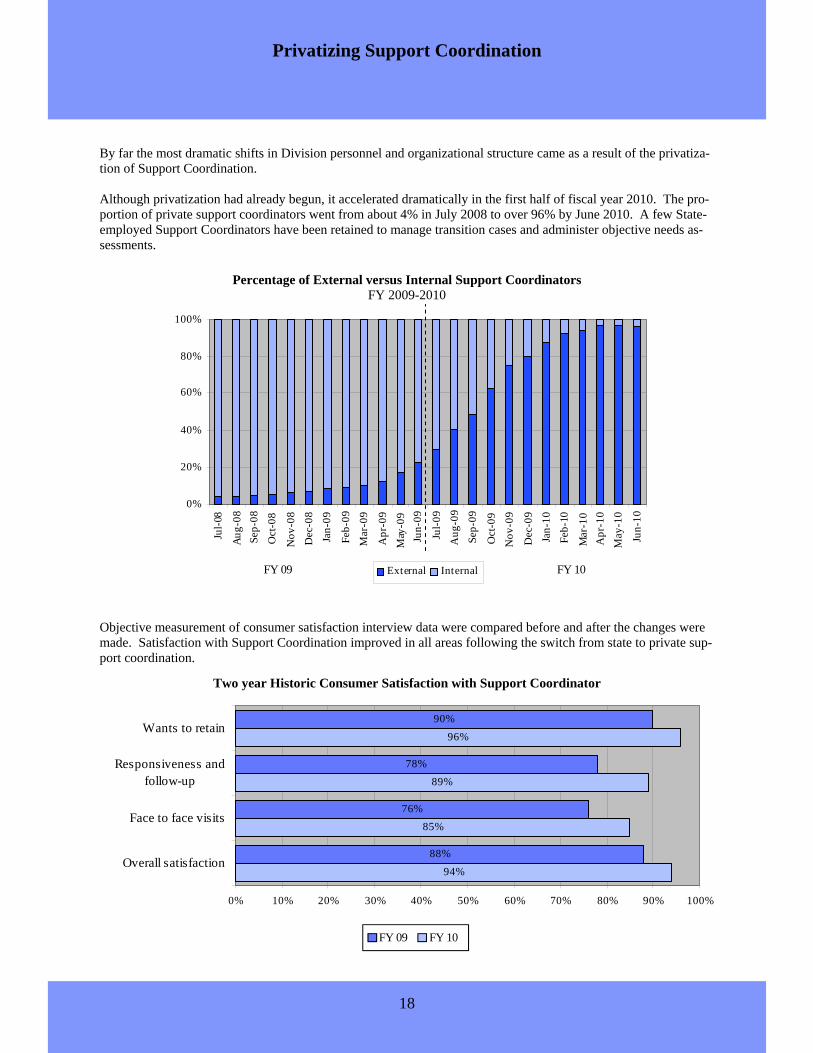
By far the most dramatic shifts in Division personnel and organizational structure came as a result of the privatiza-tion of Support Coordination. Although privatization had already begun, it accelerated dramatically in the first half of fiscal year 2010. The pro-portion of private support coordinators went from about 4% in July 2008 to over 96% by June 2010. A few State-employed Support Coordinators have been retained to manage transition cases and administer objective needs as-sessments.
Objective measurement of consumer satisfaction interview data were compared before and after the changes were made. Satisfaction with Support Coordination improved in all areas following the switch from state to private sup-port coordination.
Privatizing Support Coordination
Percentage of External versus Internal Support Coordinators FY 2009-2010
FY 09 FY 10
Two year Historic Consumer Satisfaction with Support Coordinator
FY 09 FY 10

19
Administration Since the end of fiscal year 2005, the Division has gone from seven to three full-time upper-management staff. At the end of fiscal year 2010, the Central Region Director and an Assistant Director announced their retirements. The Division then reorganized under one Assistant Director over programming and one Assistant Director over administration. This resulted in a reduction to the Division’s upper management staff of over 50%.
Regional Office Closures
When legislative budget cuts led to voluntary exter-nalization of support coordinators, DSPD was able to realize some cost savings in office closures. The map shows all DSPD regional offices at the beginning of fiscal year 2009 and which offices have been vacated to date.
Offices Vacated 2009 (8)
Offices Vacated 2010 (7)
Offices Remaining (8)
Division Reorganization
Brigham City Bountiful Holladay Park City
American Fork Spanish Fork Richfield Cedar City
Ogden Tooele Heber Nephi
Delta Moab Blanding
Logan Clearfield Salt Lake Vernal
Provo Price Manti St. George
Logan
Brigham City
Ogden Clearfield
Bountiful Salt Lake
Vernal Park City Holladay
Tooele
Provo American Fork
Spanish Fork
Heber
Nephi Price
Delta Manti
Richfield
Cedar City
St. George
Moab
Blanding
2005 2006 through 2009
Assistant Director Assistant Director Division Director
Northern Director
Assistant Director Assistant Director Division Director
Northern Director
Eastern Director Southern Director Western Director
Central Director Central Director
2010 2011
Assistant Director Assistant Director Division Director
North/South Director Douglas Maughan Assistant Director
Scott Kline Assistant Director
Alan Ormsby, J.D. Division Director
Central Director
7 6 5 3 Positions:

20
1,39 9 1,426 1,445
0
20 0
40 0
60 0
80 0
10 00
12 00
14 00
FY08 FY09 FY10
The Utilization Review Committee was formed in mid FY 2009 to review service utilization beginning with the highest cost residential consumers. Since its inception, the committee has reduced budgets totaling $61,800 in on-going general funds.
Residential Services (Daily 24-hour services in supervised apartments and group homes)
Residential services are to assist a person to gain and/or maintain independent living skills in a community setting. Provider staff supervise, train and assist them with ac-tivities of daily living, such as eating, bathing, and dressing. These residential services offer habilitation, supervision and assistance as an alternative to placement in an insti-tutional setting. Other supports often offered with residential services include behavior consultation, prescription monitoring, extended living supports and day supports.
Host Home, Professional Parent, and Adult Foster Care Services (Daily 24-hour services)
The Host Home, Professional Parent and Adult Foster Care Supports are similar to residential services in terms of the support provided. The difference is that their homes are family homes where the person lives with a non-related family. Host and Professional Parent homes provide a setting in a private home that offers support, su-pervision, training and assistance in a certified residential setting or other certified private home. These services include daily supports to maintain individual health and safety, and assistance with activities as well as behavior consultation and prescription monitoring services, if needed. The service gives those with exceptional care needs an alternative to institutional settings in order to enhance their ability to live as independently as possible and fully participate in a community setting of their choosing, and to avoid isolation in their homes and communities. Adult Foster Care also provides the opportunity to reside in a small residential setting/atmosphere where a person can develop independent living skills.
Supported Living Services (Hourly and Intermittent)
Supported Living Services provide supervision, training and assistance for people to live as independently as possible. This service is available to those who live alone in their own homes, with roommates, or a spouse or for adults who live with their par-ents or other related caregivers. Providers of supported living services maintain the person's health and safety, and provide transportation, personal care, homemaker, chore, attendant care, observation of all ad-ministration of all medication, advocacy, assistance with communication and activities of daily living.
Service Groupings
Number of people 269 Average Age 26 years old Average Annual Cost $40,400 ($9,500 General Funds) Number of Providers 24
Number of people 501 Average Age 42 years old Average Annual Cost $12,300 ($3,000 General Funds) Number of Providers 47
2 56 2 62 2 69
0
50
100
150
2 00
250
3 00
FY08 FY09 FY10
Con
sum
ers
516 53 2 50 1
0
10 0
20 0
30 0
40 0
50 0
60 0
FY08 FY09 FY10
Con
sum
ers
Number of people 1,445 Average Age 40 years Average Annual Cost $53,000 ($12,500 General Funds) Number of Providers 38
Con
sum
ers

21
Self-Administered Services Model (using a payroll agent)
The Self-Administered Services Model provides respite, day supports, sup-ported employment, transportation, training and other assistance for families to enable them to maintain their family structure while caring for a family member with a disability. A payroll agent, called a Fiscal Management Agent in this program, is tasked with providing financial information and services to help the family administer their own services, including hiring their own staff and managing the budget allocated to fund their supports. The service's activities include maintenance of the person's health and safety, respite, supported living, companion services, personal care services, homemaker, chore attendant care, advocacy, communication, assistance with ac-tivities of daily living and instrumental activities of daily living, transportation to access community activities and shopping and other services.
In-Home Provider-Based Model (for a person living in their family’s home)
The In-Home Provider-Based Model provides respite, chore and homemaker services, companion services, personal assistance, day supports, supported employment, transportation, training and other assistance for families to en-able them to maintain the family structure while caring for a family member with disabilities. Families participating in the Provider-Based Model select from a list of contracted providers to meet their service needs. The service's activities include maintenance of the person's health and safety, personal care, homemaker, chore, attendant care, advocacy, communication, assistance with activities of daily living and instrumental activities of daily living, transportation to access community activities and shopping and other ser-vices.
Service Groupings
Number of people 969 Average Age 33 years old Average Annual Cost $5,700 ($1,400 General Funds) Number of Providers 54
Number of people 1,510 Average Age 24 years old Average Annual Cost $7,600 ($1,900 General Funds) Number of Agents 3 1,482 1,552 1,510
0
200
400
600
8001000
1200
1400
1600
1800
FY08 FY09 FY10
Con
sum
ers
1,18 1 1,0 53 9 69
0
20 0
40 0
60 0
80 0
100 0
120 0
140 0
FY08 FY09 FY10
Con
sum
ers

22
Day Supports
Day Supports provide daily and hourly support, supervision and training for individuals and groups of adults and the elderly. The service provides a safe, non-residential, community habilitation program in a structured program set-ting, other naturally occurring environment or community setting where peo-ple can gather in groups during the day to avoid becoming isolated and participate in and contribute to their com-munity. This service maintains or improves a person's job-readiness skills, work abilities, dexterity, stamina, mem-ory, personal safety, interpersonal relations, self-help, communication, mobility and other functional abilities and life skills. For children Day Supports are provided during breaks from school, including summer breaks, holidays and vacations and in after school programs.
Supported Employment
Supported Employment helps an adult obtain, maintain, and advance in com-petitive employment in integrated work settings. These services are provided individually or in groups, with a job coach and/or co-worker supports and are designed to be flexible to accommo-date both the needs of the employer as well as the needs of the person. Supported Employment can be arranged on a full or part time basis, during traditional or non-traditional workdays, or work hours in settings where the person is afforded the opportunity to work with co-workers who do not have intellectual disabilities.
Number of people 793 Average Age 40 years old Average Annual Cost $6,700 ($1,700 General Funds) Number of Providers 47 Average Wage $5.91 Average Hours per week 15.4
Number of people 2,120 Average Age 38 years old Average Annual Cost $10,800 ($2,600 General Funds) Number of Providers 51
Service Groupings
9 80 96 1793
0
2 00
4 00
6 00
8 00
10 00
12 00
FY0 8 FY09 FY10
Con
sum
ers
*104 were not able to be categorized due to missing or incomplete data.
Job Categories (n = 689*)
Shoe Shine, <1%
Animal Care, 1%
Theater, 1% Delivery/Courier, 1% Clerical, 1%
Car Wash, 1%
Child Care/School Help, 1%
Factory/Assembly Line, 14%
Janitorial, 25%
Food Service, 29%
Grocery/Retail, 9% Laundry, 4% Training, 3%
General Labor or Work Crew, 2% Job Seeking, 2%
Advertising/Sign Waving, 2% Customer Service, 2% Grounds Keeping, 2%
Personal Aide, 1%
Warehouse, <1%
Mechanical/Maintenance, <1% Construction, <1%
1,944 2,008 2,120
0
500
1000
1500
2000
2500
FY08 FY09 FY10
Con
sum
ers

23
UTA Bus Passes and Transportation Services
Transportation services are provided to help the person gain access to day programs, supported employment and other community services, activities and resources.
Other Services The Division provides additional supports based on a person’s assessed need, including: • Behavior Supports
…provides services to people with behavior problems which may vary from those that interfere with learning or social relationships up to those behaviors which may be dangerous or even life-threatening. These individu-ally designed, one-on-one interventions are based upon the principles of applied behavior analysis and focus on positive behavior supports that increase the person's ability to be integrated into the community.
• Environmental Adaptations (modifications made to a person’s home or vehicle)
...allows for making physical adaptations to the home and/or vehicle that are needed to ensure the health and welfare of the individual, or enable the individual to function with greater independence.
• Housing Assistance Program (temporary assistance paying rent)
...assists individuals participating in Division residential programs to meet the housing costs attributable to the acquisition, retention, use, and occupancy of a personal home or community residential living in the commu-nity.
• Personal Emergency Response System (Electronic monitoring device instead of on site staff)
...24-hour access to emergency personnel and companionship accessed by pushing a button in the home. • Specialized Medical Needs
...supplies and assistive devices including transportation devices, mobility devices, communication devices, bathing and bathroom devices, and eating devices.
Service Groupings
Number of people 2,371 Average Age 38 years old Average Annual Cost $1,400 ($320 General Funds) Number of Providers 51
2 ,34 8 2 ,3 89 2 ,371
0
50 0
100 0
150 0
2 00 0
250 0
3 00 0
FY08 FY09 FY10
Con
sum
ers