dmec neurons firing
DESCRIPTION
dMEC Neurons firing. Black trace is the rat’s trajectory. Red dots are spikes recorded from one neuron. Eventually a hexagonal activity pattern emerges. Different Phases and Spacings. Different spacings. Same length scale, different phases. Additional Properties. - PowerPoint PPT PresentationTRANSCRIPT
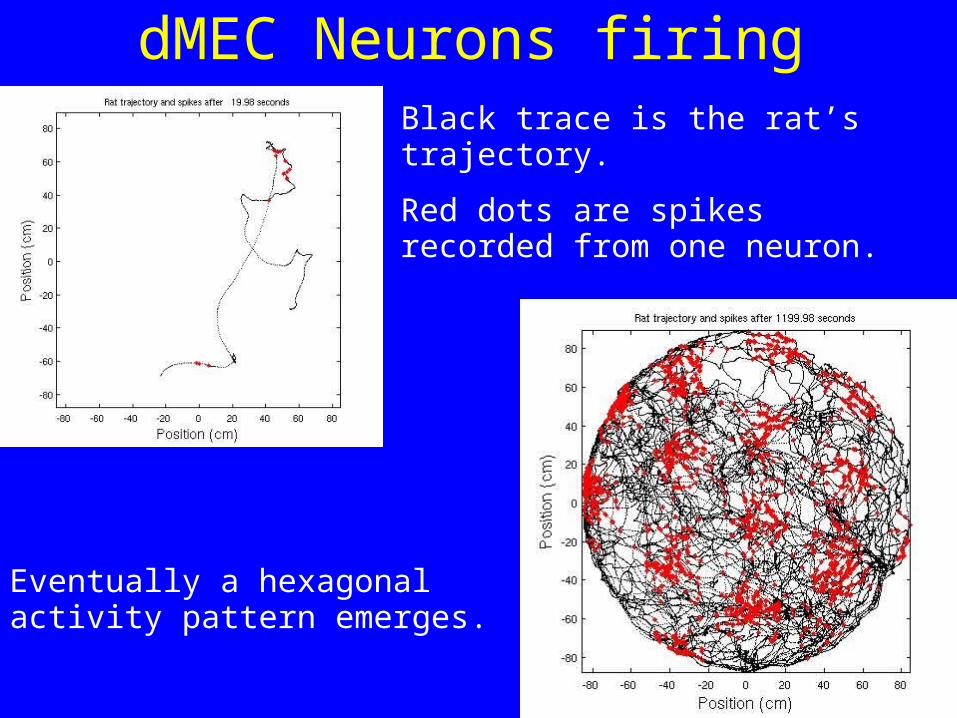
dMEC Neurons firingBlack trace is the rat’s trajectory.
Red dots are spikes recorded from one neuron.
Eventually a hexagonal activity pattern emerges.
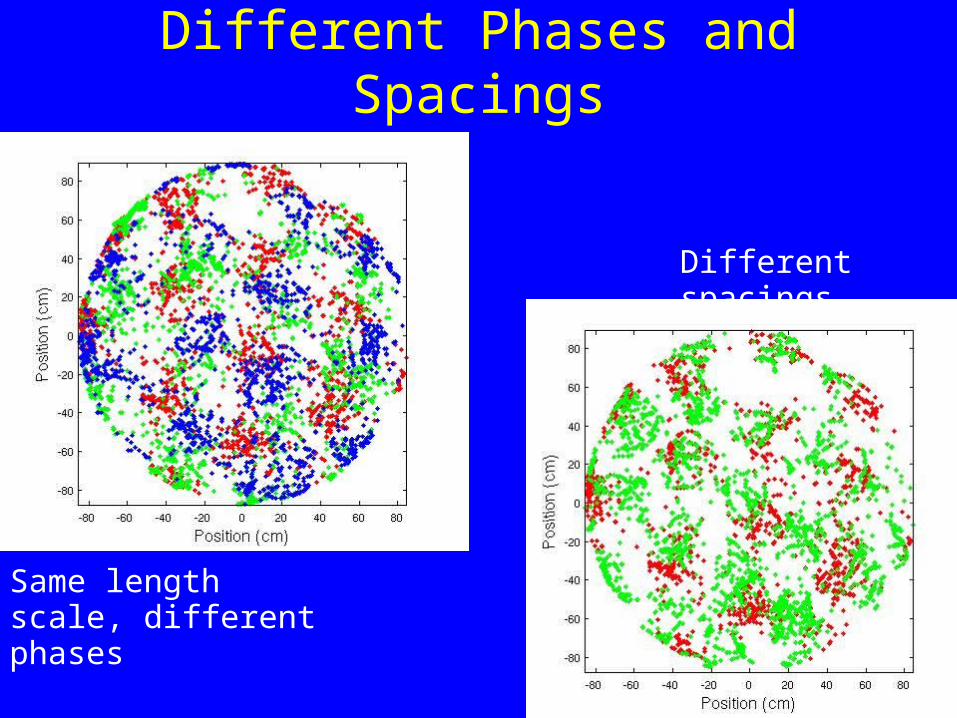
Different Phases and Spacings
Different spacings
Same length scale, different phases
Additional Properties
• Reorient when a cue-card is rotated• Maintain coherence (for a time) in the dark• Retain spacing independent of enclosure size

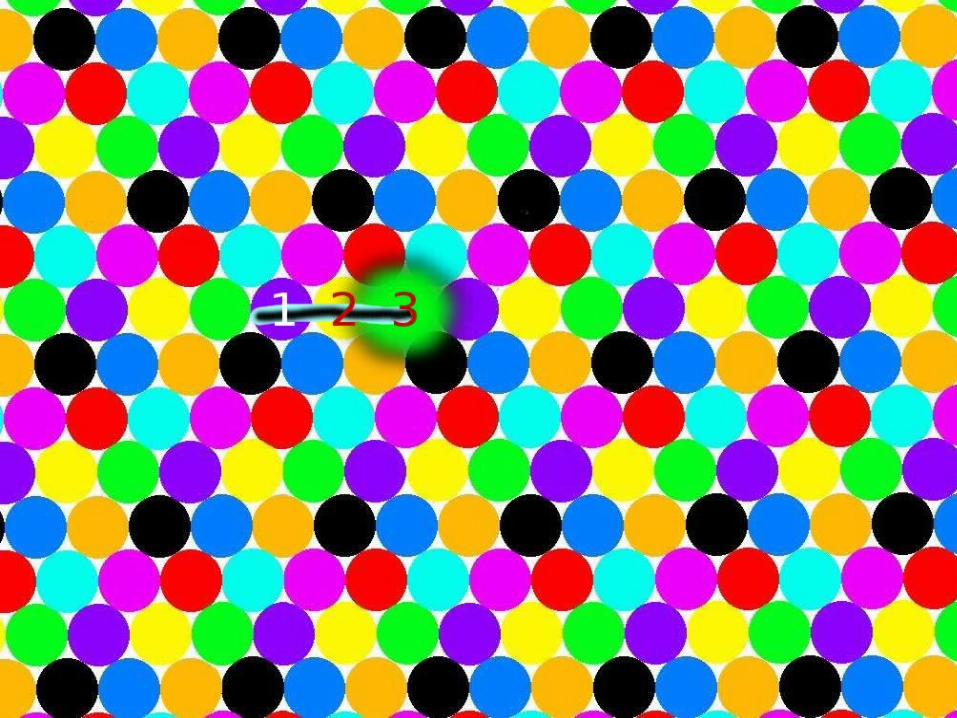
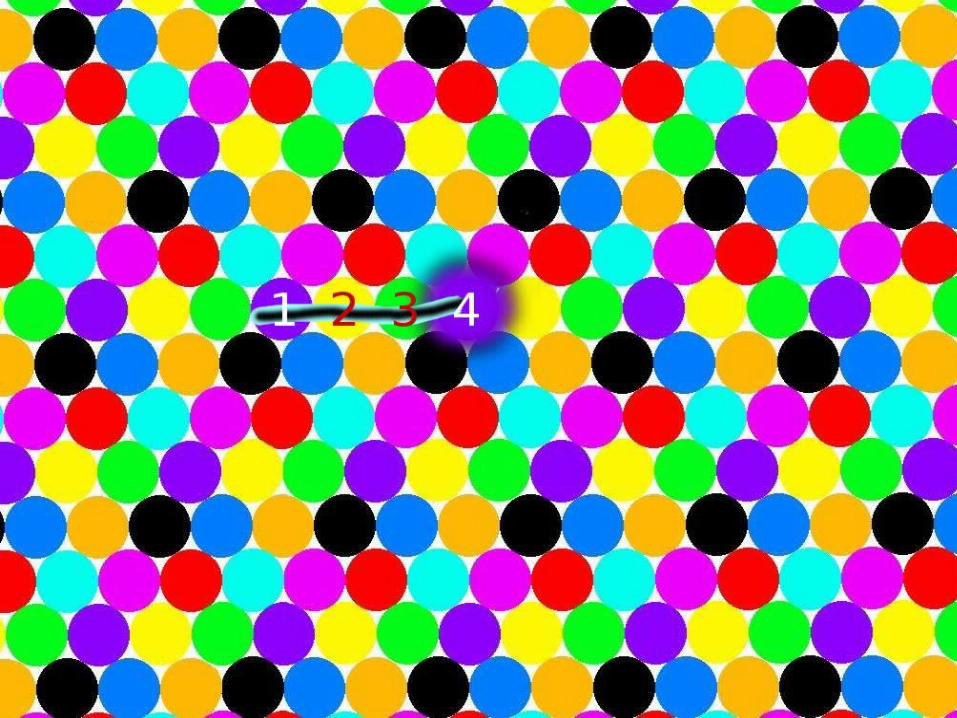

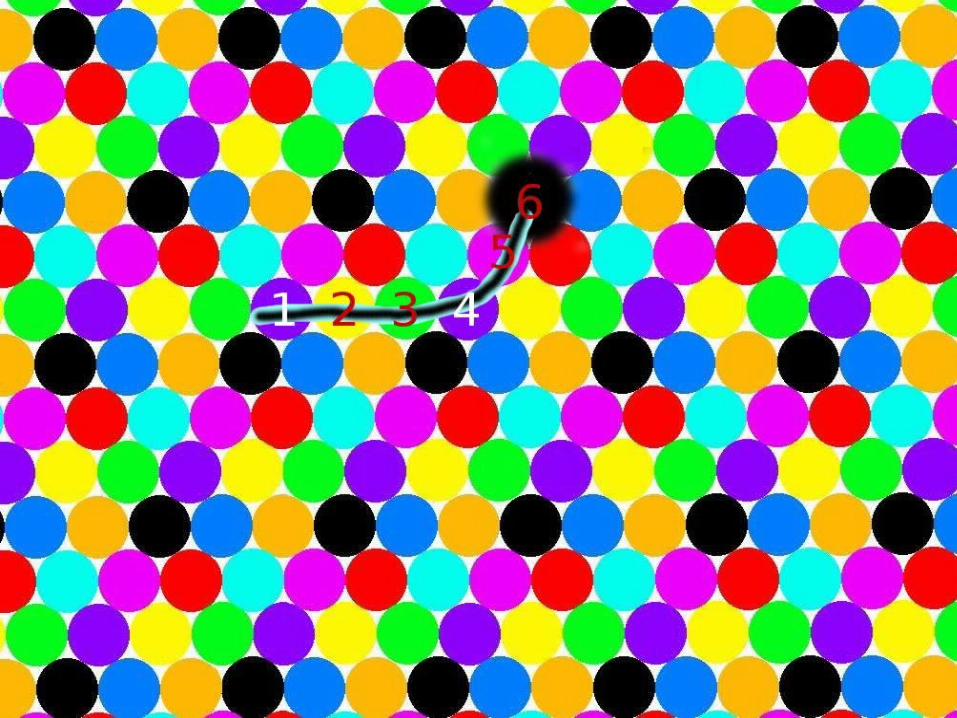

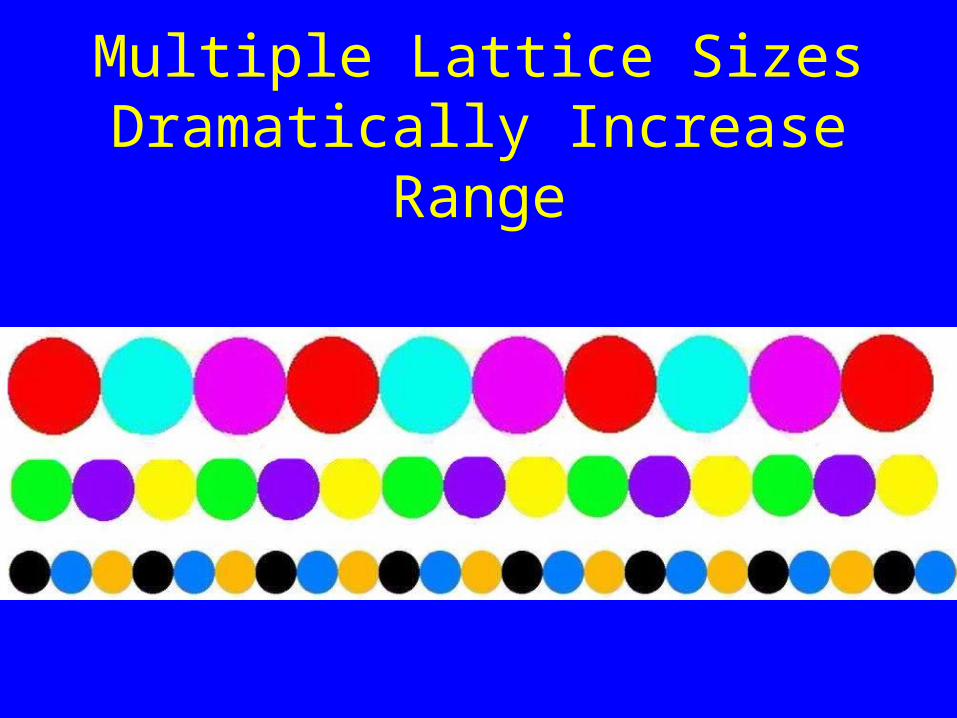
Multiple Lattice Sizes Dramatically Increase Range
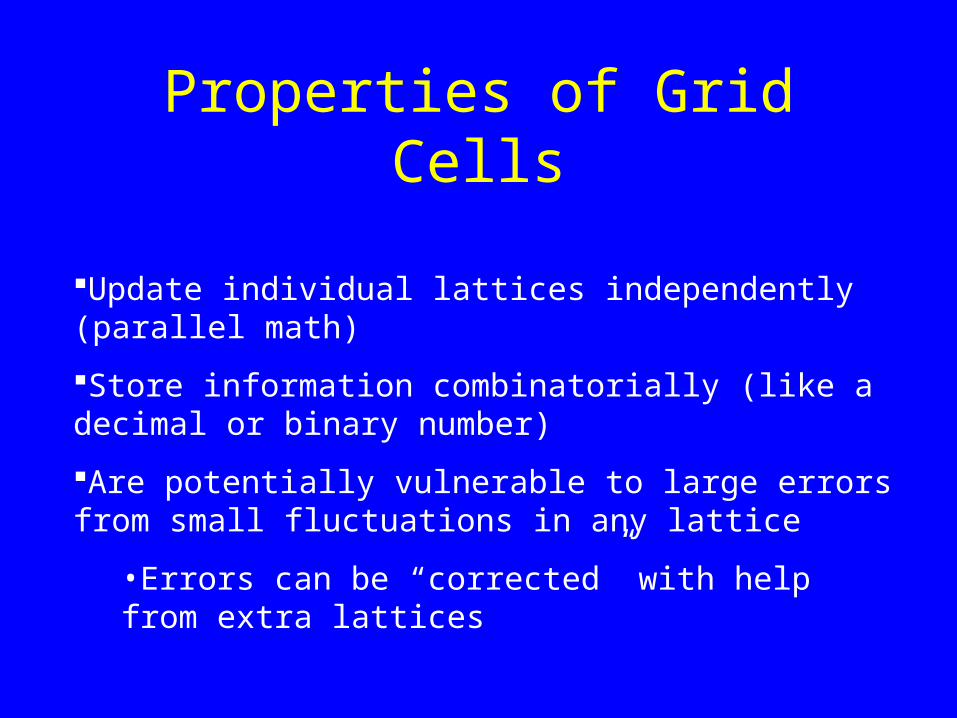
Properties of Grid Cells
Update individual lattices independently (parallel math)
Store information combinatorially (like a decimal or binary number)
Are potentially vulnerable to large errors from small fluctuations in any lattice
•Errors can be “corrected” with help from extra lattices
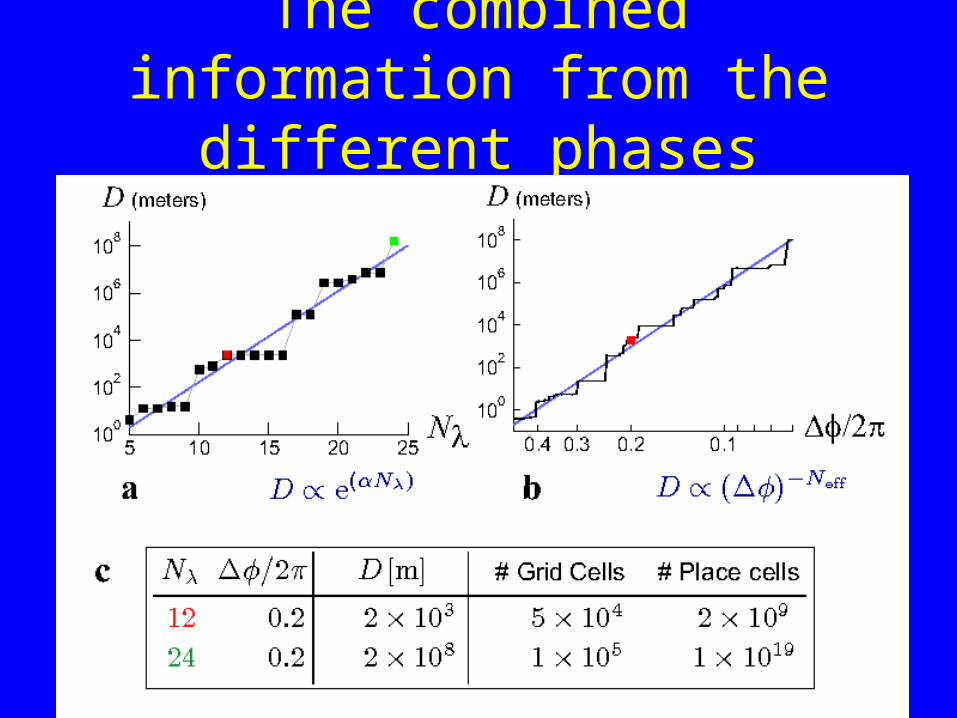
The combined information from the different phases
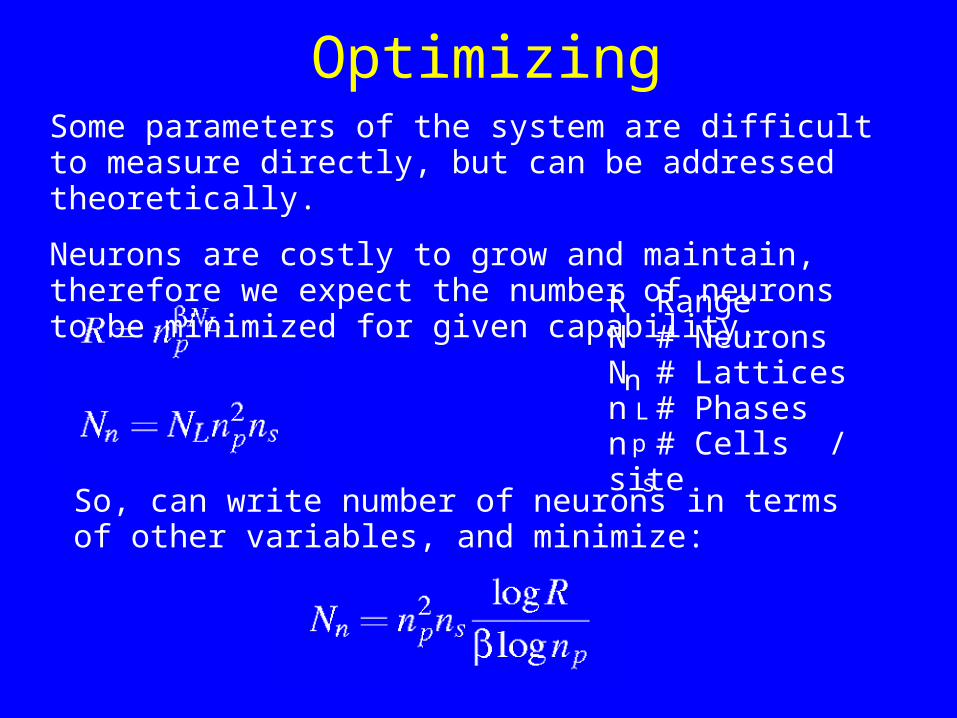
Optimizing
R RangeN # NeuronsN # Latticesn # Phasesn # Cells / site
n L
p
s
So, can write number of neurons in terms of other variables, and minimize:
Some parameters of the system are difficult to measure directly, but can be addressed theoretically.
Neurons are costly to grow and maintain, therefore we expect the number of neurons to be minimized for given capability.

Optimizing cont...
The number of cells per site is set by the need to have a statistically significant difference in the number of counts when comparing
-A rat running over an activity blob-A rat running a past a blob (at the resolution limit)
We model the firing rate as constant background plus gaussian blobs:
After fitting these constants, we can obtain expressions for the optimal number of cells per site.
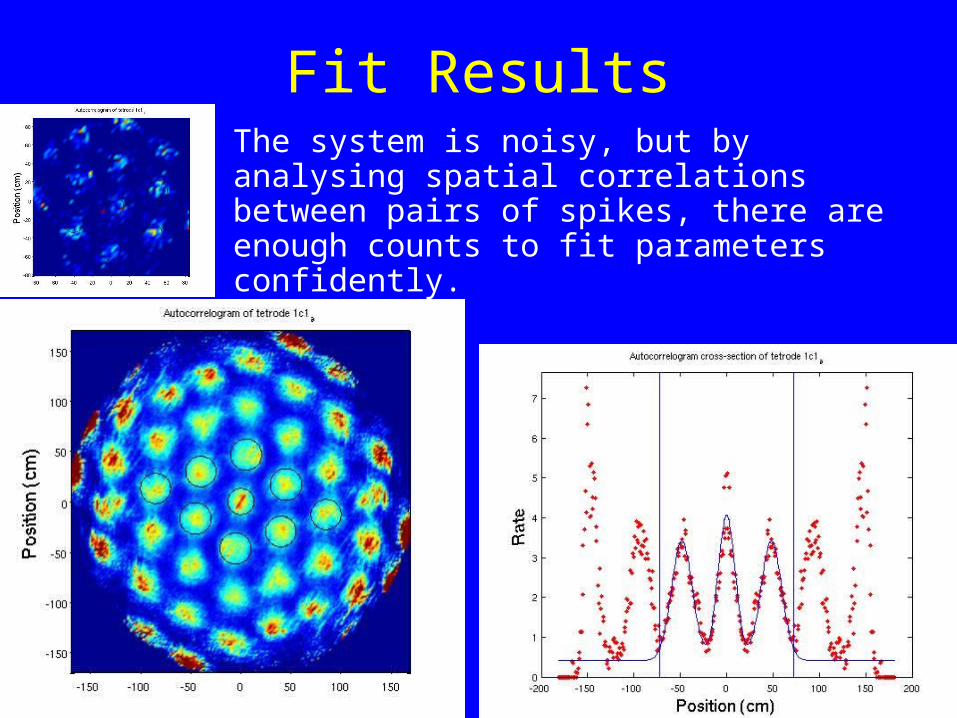
Fit ResultsThe system is noisy, but by analysing spatial correlations between pairs of spikes, there are enough counts to fit parameters confidently.
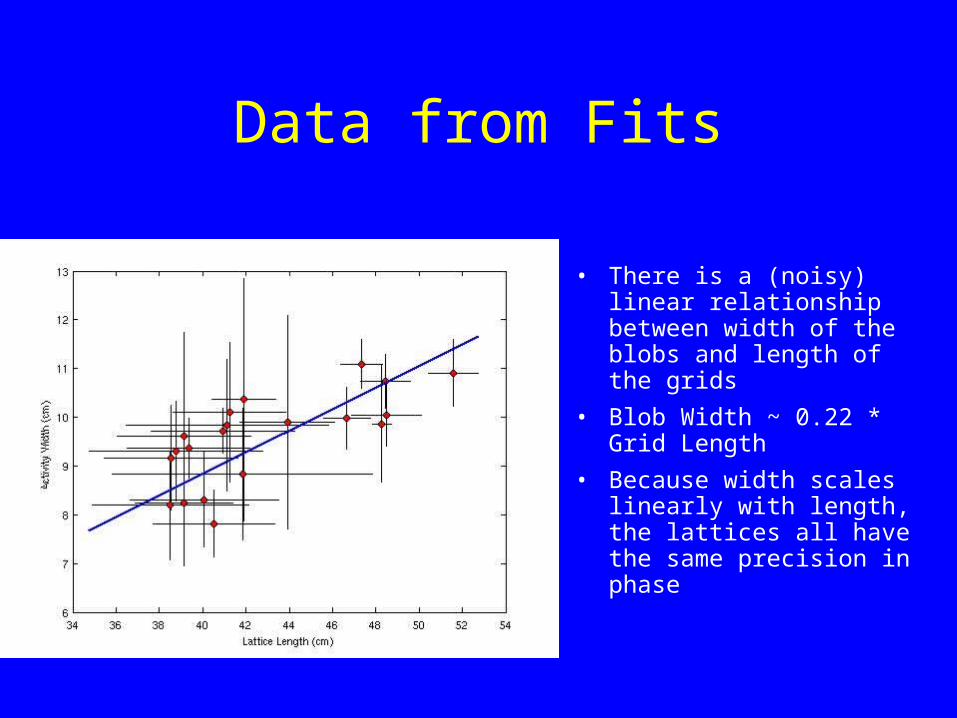
Data from Fits
• There is a (noisy) linear relationship between width of the blobs and length of the grids
• Blob Width ~ 0.22 * Grid Length
• Because width scales linearly with length, the lattices all have the same precision in phase
Conclusions from optimization
• The optimal lattices are very imprecise– Each has O(10) grid cells– Each has roughly 4 distinct phases in 2D
• By pooling this imprecise information, the potential range is huge. Ten lattices can cover 1 square km of range, with an accuracy of ~20 cm while running.
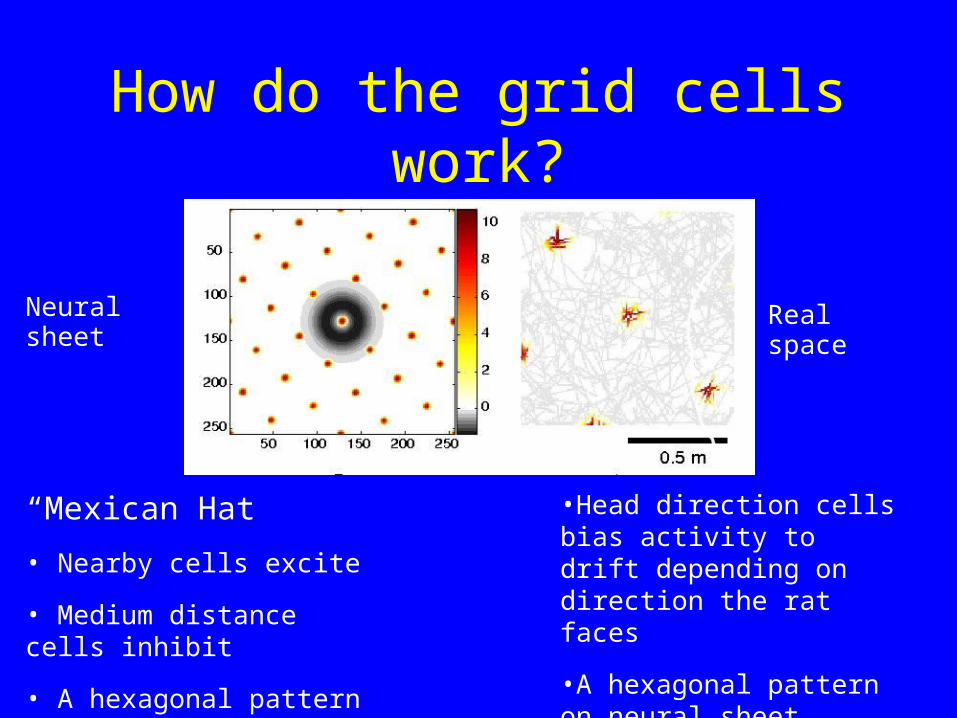
How do the grid cells work?
“Mexican Hat”
• Nearby cells excite
• Medium distance cells inhibit
• A hexagonal pattern spontaneously emerges
•Head direction cells bias activity to drift depending on direction the rat faces
•A hexagonal pattern on neural sheet results in hexagonal pattern in real space
Neural sheet Real space
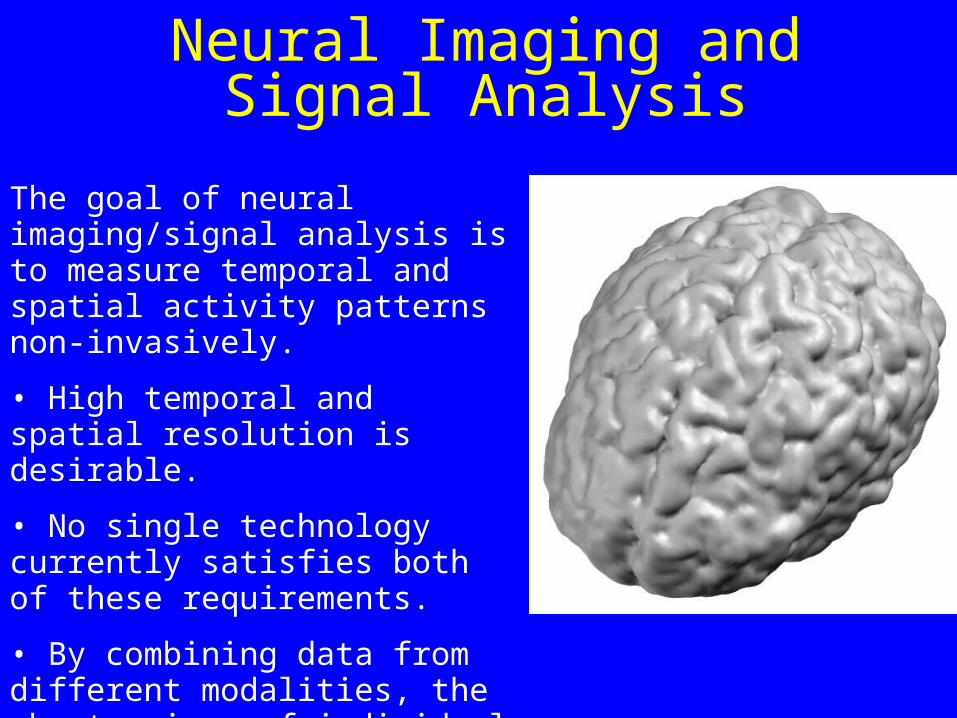
Neural Imaging and Signal Analysis
The goal of neural imaging/signal analysis is to measure temporal and spatial activity patterns non-invasively.
• High temporal and spatial resolution is desirable.
• No single technology currently satisfies both of these requirements.
• By combining data from different modalities, the shortcomings of individual techniques can be overcome.
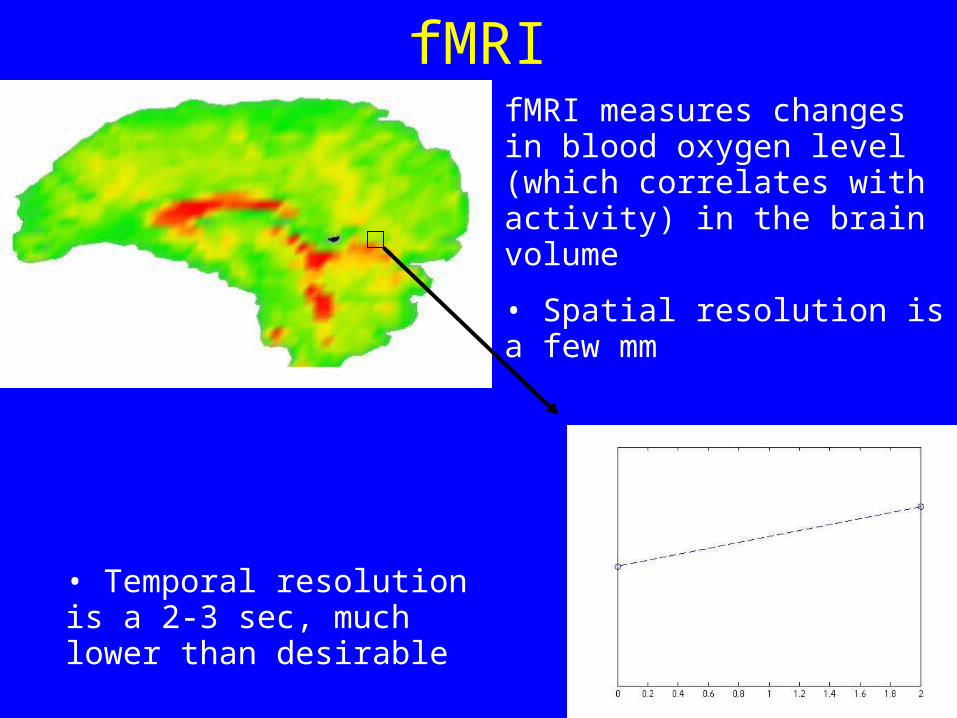
fMRIfMRI measures changes in blood oxygen level (which correlates with activity) in the brain volume
• Spatial resolution is a few mm
• Temporal resolution is a 2-3 sec, much lower than desirable
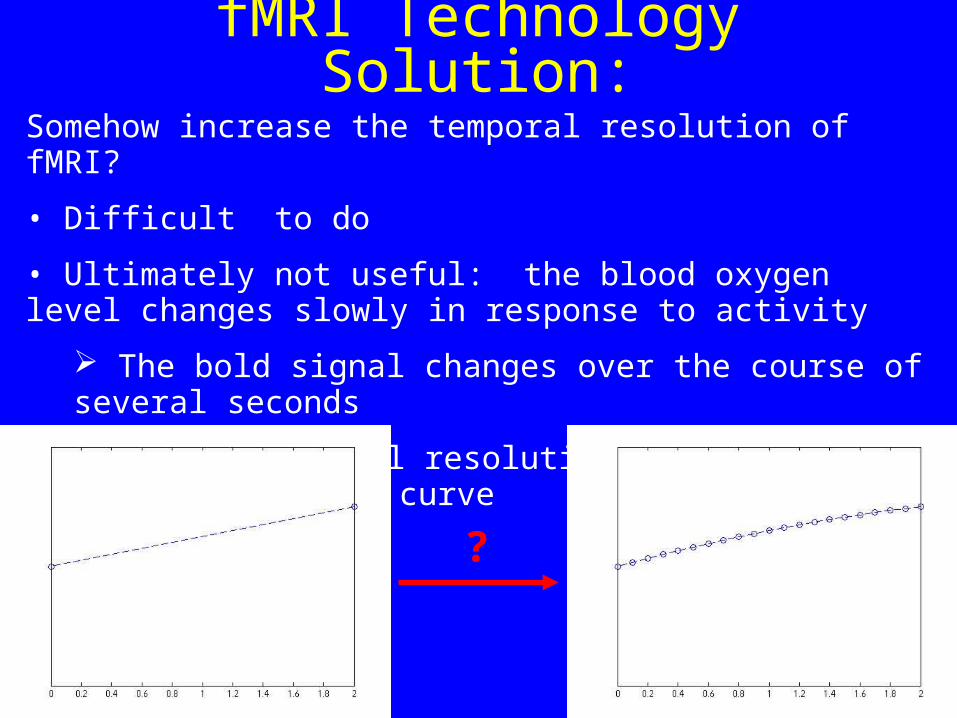
fMRI Technology Solution:Somehow increase the temporal resolution of fMRI?
• Difficult to do
• Ultimately not useful: the blood oxygen level changes slowly in response to activity
The bold signal changes over the course of several seconds
A high temporal resolution fMRI over-samples a smooth curve
?
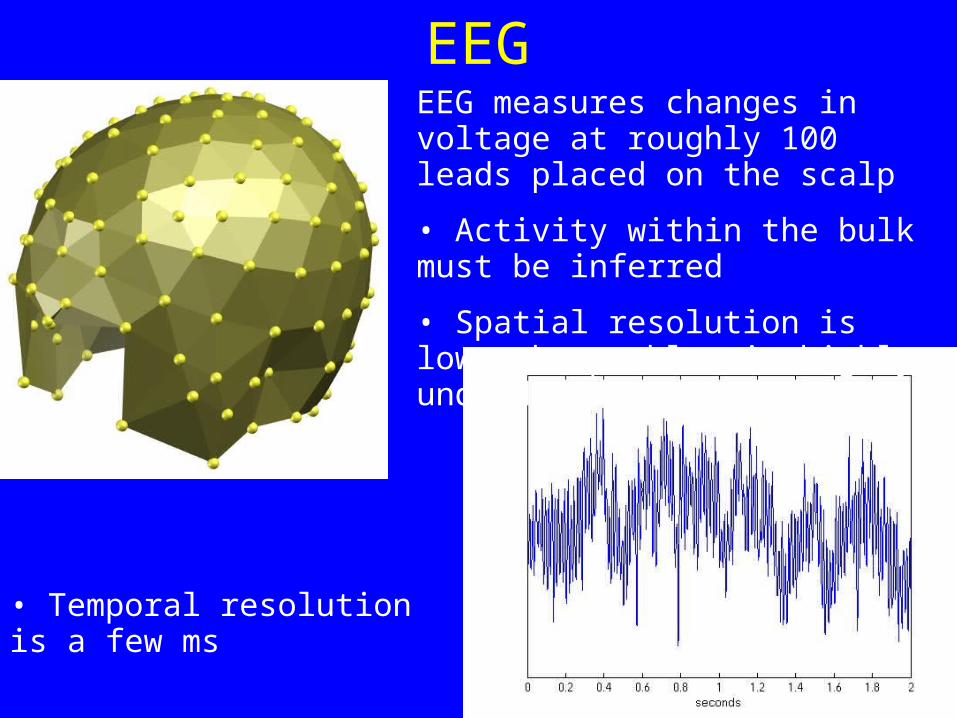
EEGEEG measures changes in voltage at roughly 100 leads placed on the scalp
• Activity within the bulk must be inferred
• Spatial resolution is low, the problem is highly underdetermined
• Temporal resolution is a few ms
EEG Constraints
To obtain a unique solution, EEG solutions are “regularized”, that is an additional constraint is added. Typical constraints are:
• Maximal smoothness
• Minimum norm
However these constraints are not well-motivated, and may actually exclude valid solutions.
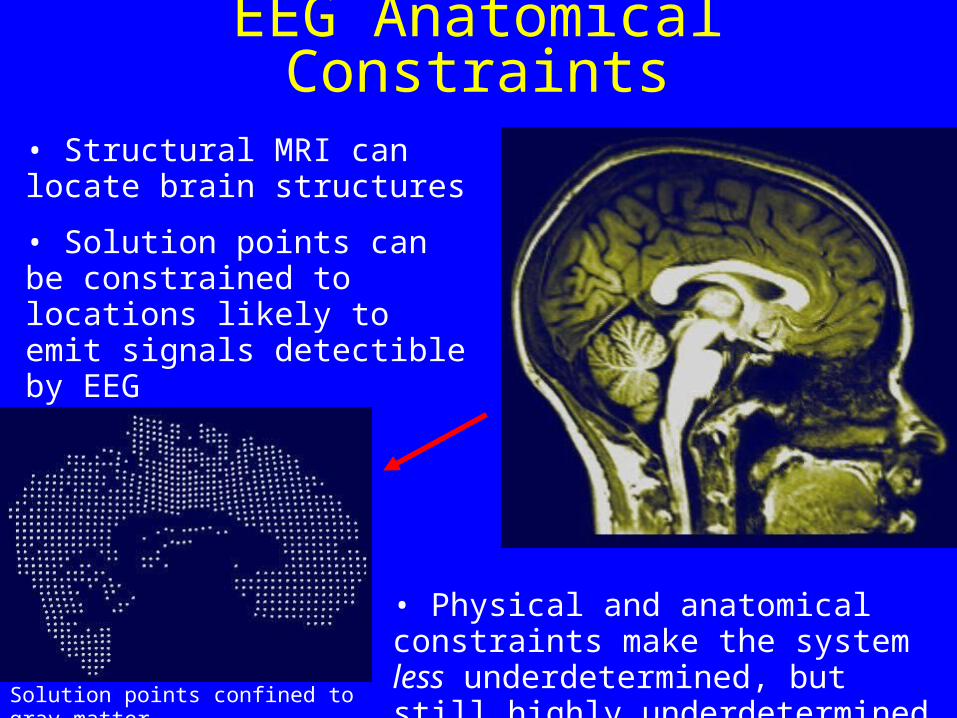
EEG Anatomical Constraints
• Structural MRI can locate brain structures
• Solution points can be constrained to locations likely to emit signals detectible by EEG
• Physical and anatomical constraints make the system less underdetermined, but still highly underdetermined.
Solution points confined to gray matter
EEG Technology Solution:
Add more leads?
• Impractical: we’d want ~10K leads.
• Still miss signals: EEG measures a superposition of fields from irrotational sources. Some signals are always undetectable.
• Not useful: simulations indicate that adding more than ~100 leads doesn’t significantly improve spatial resolution of inferred sources.

Statistical Solution:When performing EEG source localization, use fMRI as a source of priors.
• Confine EEG localization to be in active regions from fMRI
• fMRI signal changes slowly, so it can be interpolated
Solution will have:
• Spatial resolution of fMRI
• Temporal resolution of EEG