dmtm 2015 - 09 density based clustering
TRANSCRIPT

Prof. Pier Luca Lanzi
Density Based Clustering���Data Mining and Text Mining (UIC 583 @ Politecnico di Milano)

Prof. Pier Luca Lanzi

Prof. Pier Luca Lanzi

Prof. Pier Luca Lanzi
What is density-based clustering?
• Clustering based on density (local cluster criterion), ���such as density-connected points• Major features:§ Discover clusters of arbitrary shape§ Handle noise§ One scan§ Need density parameters as termination condition
• Several interesting studies:§ DBSCAN: Ester, et al. (KDD’96)§ OPTICS: Ankerst, et al (SIGMOD’99).§ DENCLUE: Hinneburg & D. Keim (KDD’98)§ CLIQUE: Agrawal, et al. (SIGMOD’98) (more grid-based)
4

Prof. Pier Luca Lanzi
DBSCAN: Basic Concepts
• The neighborhood within a radius ε of a given object is called the ε-neighborhood of the object• If the ε-neighborhood of an object contains at least MinPts
objects, then the object is a core object • An object p is directly density-reachable from object q if p is
within the ε-neighborhood of q and q is a core object• An object p is density-reachable from object q if there is a chain
of object p1, …, pn where p_1=p and p_n=q such that pi+1 is directly density reachable from pi• An object p is density-connected to q with respect to ε and
MinPts if there is an object o such that both p and q are density reachable from o
5

Prof. Pier Luca Lanzi
DBSCAN: Basic Concepts
• Density = number of points within a specified radius (Eps)
• A border point has fewer than MinPts within Eps, ���but is in the neighborhood of a core point
• A noise point is any point that is not a core point ���or a border point
• A density-based cluster is a set of density-connected objects that is maximal with respect to density-reachability
6

Prof. Pier Luca Lanzi
Density-Reachable & Density-Connected
• Directly density-reachable • Density-reachable
• Density-connected
p
q p1
p q
o
p q
MinPts = 5
Eps = 1 cm
7

Prof. Pier Luca Lanzi
DBSCAN: Core, Border, and Noise Points 8

Prof. Pier Luca Lanzi
DBSCAN ���Density Based Spatial Clustering
• Relies on a density-based notion of cluster: A cluster is defined as a maximal set of density-connected points• Discovers clusters of arbitrary shape in spatial databases with
noise• The Algorithm§ Arbitrary select a point p§ Retrieve all points density-reachable ���
from p given Eps and MinPts.§ If p is a core point, a cluster is formed.§ If p is a border point, no points are density-reachable from p
and DBSCAN visits the next point of the database§ Continue the process until all of the points have been
processed
9
Prof. Pier Luca Lanzi
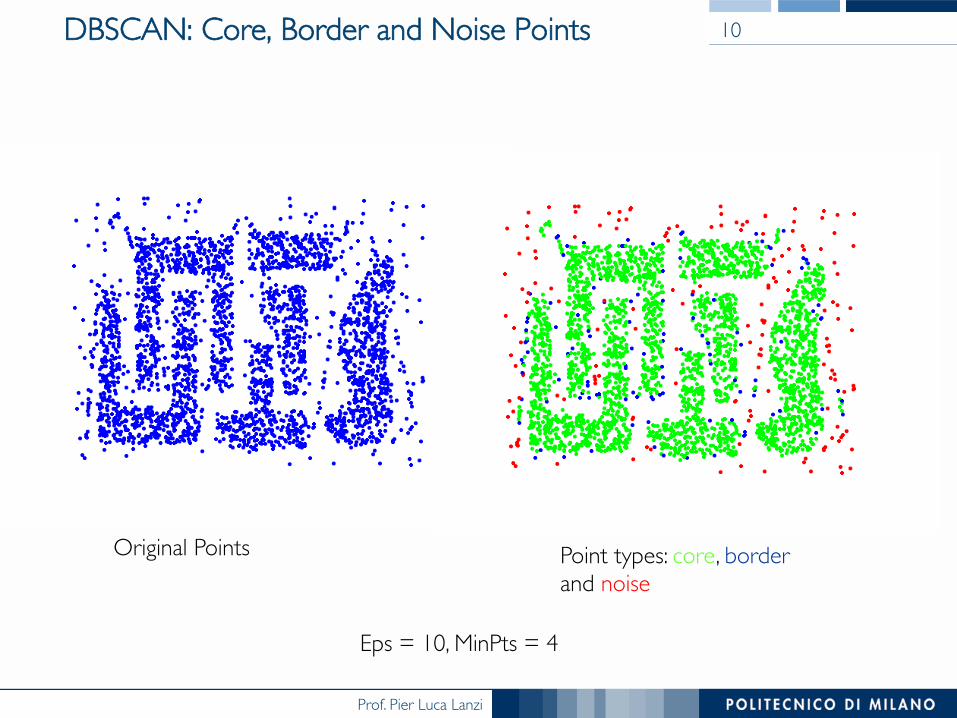
DBSCAN: Core, Border and Noise Points
Original Points Point types: core, border and noise
Eps = 10, MinPts = 4
10

Prof. Pier Luca Lanzi
When DBSCAN Works Well
• Resistant to Noise• Can handle clusters of different shapes and sizes
Original Points Clusters
11

Prof. Pier Luca Lanzi
When DBSCAN May Fail?
• Varying densities• High-dimensional data
Original Points
(MinPts=4, Eps=9.75).
(MinPts=4, Eps=9.92)
12

Prof. Pier Luca Lanzi
Clusters found in Random Data
0 0.2 0.4 0.6 0.8 10
0.1
0.2
0.3
0.4
0.5
0.6
0.7
0.8
0.9
1
x
y
Random Points
0 0.2 0.4 0.6 0.8 10
0.1
0.2
0.3
0.4
0.5
0.6
0.7
0.8
0.9
1
x
y
K-means
0 0.2 0.4 0.6 0.8 10
0.1
0.2
0.3
0.4
0.5
0.6
0.7
0.8
0.9
1
x
y
DBSCAN
0 0.2 0.4 0.6 0.8 10
0.1
0.2
0.3
0.4
0.5
0.6
0.7
0.8
0.9
1
x
y
Complete Link
13

Prof. Pier Luca Lanzi
Density-Based Clustering in R
library(fpc)
set.seed(665544)
n <- 600
x <- cbind(runif(10, 0, 10)+rnorm(n, sd=0.2), runif(10, 0, 10)+rnorm(n,sd=0.2))
par(bg="grey40")
ds <- dbscan(x, 0.2, showplot=1)
14

Prof. Pier Luca Lanzi
Density-Based Clustering in R
library(fpc)
set.seed(665544)
x <- seq(0,6.28,0.1)
y <- sin(x)
xd <- x+rnorm(630,sd=0.2)
yd <- y+rnorm(630,sd=0.2)
plot(xd,yd)
par(bg="grey40")
d <- cbind(xd,yd)
# this works nicely since the epsilon is
# the same size of the standard deviation (0.2)
# used to generate the data
ds <- dbscan(d, 0.2, showplot=1)
# this does not work so nicely
ds <- dbscan(d, 0.1, showplot=1)
15

Prof. Pier Luca Lanzi
Clustering Comparisons on Sin Data 16
hierarchical clustering kmeans clustering

Prof. Pier Luca Lanzi
Clustering Comparisons on Sin Data���(k-means with 10 clusters)
17

Prof. Pier Luca Lanzi
http://en.wikibooks.org/wiki/Data_Mining_Algorithms_In_R/Clustering/Density-Based_Clustering
Software Packages