dna damage and the activation of the p53 pathway mediate
TRANSCRIPT
Bastien Vergoni,1,2 Pierre-Jean Cornejo,1,2 Jérôme Gilleron,1,2 Mansour Djedaini,1,2
Franck Ceppo,1,2 Arnaud Jacquel,2,3 Gwennaelle Bouget,1,2 Clémence Ginet,1,2
Teresa Gonzalez,1,2,4 Julie Maillet,5,6,7 Véronique Dhennin,5,6,7 Marie Verbanck,5,6,7
Patrick Auberger,2,3 Philippe Froguel,5,6,7,8 Jean-François Tanti,1,2 andMireille Cormont1,2
DNA Damage and the Activation of thep53 Pathway Mediate Alterations inMetabolic and Secretory Functions ofAdipocytesDiabetes 2016;65:3062–3074 | DOI: 10.2337/db16-0014
Activation of the p53 pathway in adipose tissue contributesto insulin resistance associated with obesity. However, themechanisms of p53 activation and the effect on adipocytefunctions are still elusive. Here we found a higher level ofDNA oxidation and a reduction in telomere length in adiposetissue of mice fed a high-fat diet and an increase in DNAdamage and activation of the p53 pathway in adipocytes.Interestingly, hallmarks of chronic DNA damage are visibleat the onset of obesity. Furthermore, injection of lean micewith doxorubicin, a DNA damage-inducing drug, increasedthe expression of chemokines in adipose tissue and pro-moted its infiltration by proinflammatory macrophagesand neutrophils together with adipocyte insulin resistance.In vitro, DNA damage in adipocytes increased the expres-sion of chemokines and triggered the production of che-motactic factors for macrophages and neutrophils. Insulinsignaling and effect on glucose uptake and Glut4 translo-cation were decreased, and lipolysis was increased. Theseevents were prevented by p53 inhibition, whereas its acti-vation by nutlin-3 reproduced the DNA damage-inducedadverse effects. This study reveals that DNA damage inobese adipocytes could trigger p53-dependent signals in-volved in alteration of adipocyte metabolism and secretoryfunction leading to adipose tissue inflammation, adipocytedysfunction, and insulin resistance.
Insulin resistance is associated with obesity and is a majorrisk factor for type 2 diabetes. Adipose tissue (AT) playsan important role in glucose and lipid homeostasis (1,2),and AT dysfunction associated with obesity has emergedas a critical event for the development of insulin resis-tance. Low-grade inflammation and oxidative and hypoxicstresses both develop in obese AT and are involved in thealteration of adipocyte functions (3–6). Therefore, activa-tion of stress-signaling pathways in adipocytes is criticallyinvolved in AT dysfunction and insulin resistance (7–10).
The tumor suppressor p53 has recently emerged as anovel regulator of metabolic homeostasis and adaptation tonutritional changes in different organs, including AT (11–13).A role for the alterations of p53 activation has thus beenproposed in metabolic diseases such as diabetes and obesity.Indeed, activation of p53 was reported in AT of geneticallyand high-fat/high-sugar obese mice (14,15), and invalidationof p53 in adipocytes was shown to protect obese mice frominsulin resistance and reduce AT inflammation (15). Con-versely, p53 overexpression in adipocytes triggers insulin re-sistance and the expression of proinflammatory cytokines inAT (15). Despite the significance of p53 activation in obeseAT, its role in the alterations of adipocyte functions and thecauses of its activation in obese AT are poorly understood.
1INSERM, UMR 1065, C3M, Team 7 Molecular and Cellular Physiopathology ofObesity and Diabetes, Nice, France2Université Côte d’Azur, C3M, Nice, France3INSERM, UMR 1065, C3M, Team 2 Cell Death, Differentiation and Cancer, Nice,France4INSERM, UMR 1062, Nutrition, Obesity and Risk of Thrombosis, Marseille,France5CNRS, UMR 8199, Lille Pasteur Institute, Lille, France6Lille University, Lille, France7European Genomic Institute for Diabetes, Lille, France8Department of Genomics of Common Disease, School of Public Health, ImperialCollege London, Hammersmith Hospital, London, U.K.
Corresponding author: Mireille Cormont, [email protected].
Received 4 January 2016 and accepted 1 July 2016.
This article contains Supplementary Data online at http://diabetes.diabetesjournals.org/lookup/suppl/doi:10.2337/db16-0014/-/DC1.
B.V. and P.-J.C. contributed equally to this study.
J.-F.T. and M.C. are co–senior authors.
© 2016 by the American Diabetes Association. Readers may use this article aslong as the work is properly cited, the use is educational and not for profit, and thework is not altered. More information is available at http://www.diabetesjournals.org/content/license.
3062 Diabetes Volume 65, October 2016
PATHOPHYSIO
LOGY
The p53 pathway is a key effector of the DNA damageresponse (DDR) and is activated by several stressors thatinduce DNA lesions, the most deleterious one being DNAdouble-strand breaks (DSBs) (16). The oxidative stress oc-curring in AT of obese subjects is among the several possiblestressors (4,15). We thus hypothesized that nuclear DNAdamage in adipocytes triggers the activation of the p53 path-way leading to metabolic and endocrine dysfunctions in ad-ipocytes and to systemic propagation of deleterious signalsfor insulin sensitivity.
RESEARCH DESIGN AND METHODS
Cell CultureHuman visceral preadipocytes from lean subjects withoutdiabetes (Biopredic, Rennes, France) and 3T3-L1 cells were dif-ferentiated into adipocytes as previously described (17,18).Small interfering (si)RNA (Dharmacon) transfection was per-formed with INTERFERin (Ozyme, St Quentin-en-Yvelines,France) as previously described (19). RAW 264.7 and RAW-Blue (InvivoGen) macrophages were maintained in DMEM–5% heat-inactivated FCS. RAW-Blue expressed secretedembryonic alkaline phosphatase under the control of nu-clear factor-kB (NF-kB) and activator protein-1. Humanmononucleated cells were isolated from blood using FicollHypaque, and monocytes were enriched and differenti-ated into M0 macrophages, as previously described (20).Volunteers signed an informed consent according to theDeclaration of Helsinki and recommendations of an in-dependent scientific review board.
Animal StudiesMale mice were purchased from Charles Rivers Laboratory(St-Aubin-lès-Elbeuf, France). Mice (ob/ob and ob/+) were usedat 14 weeks of age. C57BL6/J mice were used for high-fatdiets (HFD) experiments (45 or 60 kcal% fat; ssniff Spezial-diäten GmbH, Soest, Germany) started at 7 weeks of age andcontinued for 2, 4, or 18 weeks (Supplementary Table 1). Atage 15 weeks, C57BL/6J mice were injected for 42 h withdoxorubicin (2 mg/kg; Sigma-Aldrich) or 0.9% NaCl for epi-didymal (epi)AT analysis. An intraperitoneal glucose tolerancetest (IPGTT) was performed after starvation for 6 h, as pre-viously described (21). The Nice/Sophia-Antipolis UniversityAnimal Care Committee approved all studies.
Measurement of Insulin Signaling and Metabolism inAdipocytesInsulin signaling, 2-[3H]deoxyglucose uptake, Glut4 trans-location, and lipogenesis on isolated adipocytes were deter-mined as previously described (22). Glycerol content in themedium was determined as a readout of adipocyte lipolysisusing the GPO-Trinder colorimetric assay (Sigma-Aldrich).
Flow Cytometry Analysis of AT Immune CellsThe stromal vascular fraction (SVF) cells obtained after epiATtreatment with collagenase (21) were incubated 15 min withFc block, resuspended in dedicated buffer, and stained for30 min at 4°C with fluorochrome-conjugated specific anti-bodies or control isotypes to quantify macrophages (F4/80and CD11c), neutrophils (Lys6G and CD11b), and T (CD3) or
B (B220) lymphocytes. The labeling was analyzed by flowcytometry using a MACSQuant cytometer (Miltenyi) andFlowJo software (TreeStar).
Immune Cells Chemotaxis and Activation AssaysChemotaxis of RAW 264.7 and human M0 macrophagesinduced by adipocyte-conditioned media (AdCM) wasassessed by Boyden chambers assay (8-mm pores, BD Bio-science). Cells that were migrated at the filter’s lower facewere labeled with crystal violet and counted in five ran-domly selected areas. For macrophage activation, secretedembryonic alkaline phosphatase activity was quantified inthe media of RAW-Blue cells. RNAs were prepared for theanalysis of polarization marker expression. Human M0polarization was determined by the quantification of thesurface expression of M0, M1, and M2 markers, as pre-viously described (20).
To quantify neutrophil migration against AdCM, 23 105
white blood cells were plated in the upper chamber ofBoyden chambers (3-mm pores). Cells in the lower cham-ber were labeled 2 h later with fluorescein isothiocyanate(FITC)–coupled Lys6G and phycoerythrin-coupled CD11bantibodies before flow cytometry analysis.
Immunofluorescence StudiesSnap-frozen epiAT was embedded in optimal cuttingtemperature medium, and 15-mm sections were fixed in4% paraformaldehyde, incubated in 10 mmol/L glycine,washed, and incubated in PBS, 2% BSA, and 0.1% Tween-20. Adipocytes from epiAT were isolated by collagenasedigestion, as previously described (21), and were fixed asabove. The AT sections or isolated adipocytes were thenincubated with the indicated antibodies and DAPI, washed,and mounted. Images were quantified using motion-trackingsoftware (23).
The three-dimensional imaging of solvent-cleared organs(3DISCO) tissue-clearing method (24) was adapted to AT.EpiAT was fixed in 3% paraformaldehyde and successivelywashed in PBS containing 0.2% Triton X-100, or 0.2% Tri-ton X-100 and 20% DMSO, or 0.1% Tween-20, 0.1% TritonX-100, 0.1% deoxycholate, 0.1% NP40, and 20% DMSOfor 24 h each. EpiAT was then incubated overnight in PBS,0.2% Triton X-100, 10% DMSO, and 0.3 mol/L glycine andblocked by adding 6% BSA for 2 days. After two washes inPTwH (PBS, 0.2% Tween-20, and 0.001% heparin), sampleswere incubated 2 days with FITC-labeled anti–g-H2AXantibody, Alexa Fluor 647 phalloidin, and DAPI in PTwH,5% DMSO, and 3% BSA, and washed in PTwH for 2 extradays. The clearing was performed by successively using 50%,75%, and 100% tetrahydrofuran, 3 h each time, and finally,with dibenzyl ether for 2 h before confocal acquisition andimage analysis with Fiji software.
Microarray AnalysisRNA was isolated from 3T3-L1 adipocytes using RNeasy LipidTissue Kit (Qiagen), quantified by a NanoDrop ND-1000, andthe quality verified with an Agilent 2100. ComplementaryRNA was prepared using TargetAmp Nano-g Biotin-aRNA
diabetes.diabetesjournals.org Vergoni and Associates 3063

labeling for the Illumina System (Epicentre) and hybridizedto Illumina Mouse WG-6 v2.0 BeadArrays. Microarray datawere normalized and analyzed using the R software limmapackage (25). We performed a background correction usingnegative controls on the raw data, applied a quantile nor-malization using positive controls, followed by a log2 trans-formation, and applied a 1% threshold on the detectionP values, which led us to consider 13,314 genes as expressed.We performed ANOVA using the limma “eBayes” proce-dure. P values were corrected for multiple testing usingthe Benjamini-Hochberg method to control the false dis-covery rate with a 5% threshold.
Reactive Oxygen Species, DNA Oxidation, andTelomere Length DeterminationReactive oxygen species (ROS) was quantified in 30-mmepiAT sections using dihydroethidium, as previously described(15), or in isolated adipocytes using the ROS probe 29,79-dichlorodihydrofluorescein diacetate (H2DCFDA; 10mmol/L).Adipocytes were recovered by centrifugation on dinonylphthalate and resuspended in H2O2 before fluorescencemeasurement. DNA was prepared from snap-frozen epiAT(DNeasy Blood & Tissue Kit; Qiagen). Amounts of 8-hydroxy-2-deoxyguanosine (8-OHdG) were determined using an EIA kit(StressMarq Biosciences Inc.) following the manufacturer’s rec-ommendations. Real-time quantitative PCR (qPCR) was usedthat compares the telomere repeat sequence copy numberto a single copy albumin gene.
Western Blotting and Real-Time qPCRCells were lysed, and immunoblotting was performed, aspreviously described (26), using indicated antibodies. RNApreparation and real-time qPCR were performed as pre-viously described (26). Primers were from SABiosciences(Qiagen). The PCR data were analyzed with the compara-tive cycle threshold (DDCt) quantitation method.
Statistical AnalysisData are expressed as the mean6 SEM. Differences amonggroups were compared using ANOVA with post hoc analy-sis for multiple comparisons and the Mann-Whitney test orStudent t test when only two groups were compared. Cor-relation analysis was done by the Spearman test. Statisticalanalyses were performed using GraphPad Prism 5 software.Differences were considered significant at P , 0.05.
RESULTS
The p53 Pathway Is Activated in Adipocytes FromObese MiceThe p21 mRNA level, a p53-target gene, was higher inepiAT and in the adipocyte fraction of the obese ob/obmiceand mice fed the HFD compared with their lean counter-parts (Fig. 1A and B). The p21 mRNA level in the adipocytefraction from ob/ob and HFD-fed mice was positively cor-related to whole-body and fat pad weights and fastingglycemia (Supplementary Table 2). Expression of p53 andp21 proteins was higher in adipocytes from HFD-fed micecompared with their counterparts fed the normal chow diet(NCD) (Fig. 1C). Moreover, the number of adipocytes with a
p21+ nucleus was higher in HFD-fed mice than in NCD-fed mice (61.7% 6 5.50% vs. 19.9% 6 4.04%, respec-tively; P , 0.01) (Fig. 1D). This supports an activationof the p53 pathway in mature obese adipocytes.
An HFD Causes DNA Damage in Adipocytes ThatOccurs Early Upon Obesity OnsetA main cause for p53 activation is DNA damage, such astelomere shortening and/or DNA DSBs themselves, causedby ROS-induced DNA oxidation. We found a 1.5-foldincrease in 8-OHdG, a marker of oxidative DNA damage(27), in the epiAT from mice fed the HFD for 18 weeks(Fig. 1E), which positively correlated with p21 expression(Fig. 1F), suggesting a link between DNA oxidation and p53activation. We quantified the number of adipocytes withnuclear foci containing phosphorylated histone H2AX(g-H2AX), which positively correlates with DNA damage.The proportion of adipocytes with no g-H2AX foci, mean-ing without DNA damage, was lower in HFD-fed than inNCD-fed mice (6% vs. 12%, respectively) (Fig. 1I, point 0).Furthermore, the proportion of adipocytes with high num-bers of g-H2AX foci per nucleus was increased in adipo-cytes from HFD-fed mice (representative image in Fig. 1Hand quantification of 80–120 adipocytes per group in Fig.1I). Moreover, we found shortened telomeres in epiATfrom HFD-fed mice (Fig. 1G), and telomere length was in-versely correlated with p21 expression, whole-body and fatpad weights, and fasting glycemia (Supplementary Table 2).
We next asked whether adipocyte DNA damage was anearly event upon the onset of obesity by studying miceafter 2 and 4 weeks of HFD feeding, which increased bodyweight gain, epiAT weight, and adipocyte size (Supple-mentary Fig. 1F–H). Using the 3DISCO method, we im-aged the whole epiAT and characterized cell types withDNA damage using g-H2AX labeling. The HFD for 2 or4 weeks increased by two- to threefold, respectively, thenumber of adipocytes with g-H2AX+ nuclei (cyan color inFig. 2A and B). ROS amounts were concomitantly in-creased in epiAT and in adipocytes (Fig. 2C). DNA damagewas also detected in nonadipocyte cells (white color in Fig.2A). The expression of p53 protein and of p21 mRNA wasincreased, together with the expression of p16INK4A andp19ARF mRNA encoded by the CDKN2A locus, which arehallmarks of chronic DNA damage (Fig. 2D) (28). Impor-tantly, after 2 weeks of the HFD, we did not observefeatures of insulin resistance of adipocytes because insulin-induced lipogenesis in isolated adipocytes (Fig. 2E) andepiAT expression of insulin receptor substrate 1 (IRS1)and adiponectin mRNA was not different comparedwith NCD-fed mice, whereas the Glut4 mRNA level wasincreased (Fig. 2F). The leptin mRNA level was increasedin agreement with the increase in epiAT weight and adi-pocyte diameter (Fig. 2F and Supplementary Fig. 1A andB). Glucose homeostasis was not markedly altered after2 weeks of the HFD because the IPGTT indicated similarglucose tolerance (Fig. 2G), with no difference in insulinsecretion during the IPGTT in HFD-fed mice compared
3064 DNA Damage and p53 in Obese Adipocytes Diabetes Volume 65, October 2016

with NCD-fed mice (0.89 6 0.13 ng/mL vs. 0.84 6 0.15ng/mL, respectively). Moreover, 2 weeks of the HFD didnot modify the HOMA of insulin resistance index (Fig. 2H)or fasting and fed glycemia or insulinemia (SupplementaryFig. 1C and D). By contrast, mice developed glucose intol-erance after 4 weeks of HFD feeding, with a further in-crease in whole-body and epiAT weights and adipocyte sizeas well as a trend toward a decrease in IRS1 mRNA (Sup-plementary Fig. 1A, B, and E–I).
After 2 weeks of the HFD, we found in epiAT a lowerinducible nitric oxide synthase–to–arginase ratio and anupregulation of the M2 marker CD206 mRNA and thechemokine (C-C motif) ligand 2 (CCL2), but we did not
detect any significant differences in the number of F4/80+CD11c2 macrophages or proinflammatory F4/802CD11c+
or F4/80+CD11c+ cells (Fig. 2I), neutrophils, or T and Blymphocytes (Supplementary Fig. 1K and L). Furthermore,inflammatory gene expression in epiAT and circulating lev-els of interleukin 6 (IL-6) and tumor necrosis factor-a(TNF-a) in HFD-fed mice did not significantly differ com-pared with NCD-fed mice (Fig. 2I). By contrast, infiltrationof neutrophils in epiAT was observed after 4 weeks of theHFD and was detectable until 18 weeks (SupplementaryFig. 1K and L), with a further increase in CCL2 and IL-6mRNA and a trend toward an increase in CD11c mRNA(Supplementary Fig. 1J).
Figure 1—Adipocytes of obese mice exhibit activation of the p53 pathway with an increase in DNA damage and a reduction in telomerelength. Level of p21 mRNA in epiAT (AT) and isolated adipocytes (Ad) of ob/ob (A) and HFD-fed mice (18 weeks of 60% kcal from fat) andtheir lean control littermates (NCD-fed) (n = 8 per group) (B). p21 mRNA expression was normalized using mouse Rplp0 mRNA level andexpressed in arbitrary units with the control value (ob/+ or NCD-fed mice) taken as 1. C: Western blot analysis of the expression of p53 (anti-p53 #2524, Cell Signaling) and p21 (anti-p21, clone CP74, P1484, Sigma-Aldrich) in isolated adipocytes from HFD- and NCD-fed mice withtubulin (anti-tubulin T6199, Sigma-Aldrich) as the loading control. Each lane corresponds to independent preparations of adipocytes. D:Immunofluorescence analysis of p21 in the nuclei of isolated adipocytes from HFD- and NCD-fed mice. DAPI was used to visualize thenuclei. Representative images and quantification of nuclei with detectable p21 labeling in 15–20 cells per adipocyte preparation (n = 8) areshown. E: Amounts of 8-OHdG quantified in total DNA from AT of mice fed the NCD or an HFD (45% or 60% of kcal from fat; n = 8 pergroup). Results are expressed in picograms of oxidized 8-OHdG per microgram of AT DNA. F: Correlation between amounts of AT oxidizedDNA and AT p21 mRNA expression (red dots, NCD-fed mice; blue dots, 45% HFD-fed mice; black dots, 60% HFD-fed mice). G: Relativetelomere length was estimated from total DNA prepared from AT of NCD- and HFD-fed mice (n = 8 per group). Results are expressed inarbitrary units with the NCD-fed mice taken as 1. H and I: Isolated adipocytes from NCD- and HFD-fed mice (60% kcal from fat) weretreated for immunofluorescence as in D. Immunodetection was performed with anti–g-H2AX (Ser139) antibodies (Millipore 05-636), fol-lowed by anti-mouse antibodies coupled to Alexa Fluor 488. Nuclei were labeled by DAPI. The quantifications of the foci number wereperformed on 10–15 cells per preparation of adipocytes (n = 8 per group), and the graph represents the number of cells as a function of thefoci number. Data are means 6 SEM. *P < 0.05; **P < 0.01; and ***P < 0.001.
diabetes.diabetesjournals.org Vergoni and Associates 3065

Figure 2—DNA damage in the adipocyte is an early event during obesity development. A: Representative images of cleared AT frommice fed the NCD or HFD for 2 or 4 weeks labeled with g-H2AX antibodies (green), DAPI (blue), and phalloidin (red), together with enlargedviews of the delineated regions. Images were acquired with a NikonA1 confocal microscope with a 320 long-working-distance objective,allowing for acquisitions up to 3 mm into the tissue. A mosaic of nine images over 1 mm was randomly acquired and blindly quantified.Z-projections along the z-axis were generated, and the DAPI (blue) and phalloidin (red) images were merged to discriminate nuclei fromsmall cells that were entirely surrounded by F-actin (purple nuclei) from nuclei of mature adipocytes (Ad) that were not surrounded byF-actin (blue nuclei). Adipocyte nuclei without DNA damage are blue (only DAPI labeling, arrows). They are cyan when DNA damage waspresent (merge of DAPI [blue] and g-H2AX [green], arrowheads). Nuclei from other smaller cells without DNA damage are purple (merge ofDAPI [blue] and phalloidin [red]) and are white with DNA damage (merge of DAPI [blue], g-H2AX antibodies [green], and phalloidin [red]). B:Quantification of the number of adipocytes presenting DNA damage in their nucleus using the colocalization plug-in of Fiji. Data areexpressed as the percentage of cells with DNA damage and are means 6 SEM. **P < 0.01 and ***P < 0.001 HFD vs. NCD-fed mice;###P < 0.001 HFD 4 weeks vs. HFD 2 weeks. C: Quantification of ROS using dihydroethidium (DHE) labeling on AT sections from mice fedthe NCD or HFD for 2 weeks and 4 weeks (left panel), and quantification of ROS production by isolated adipocytes from mice fed the NCDor HFD for 2 weeks using the ROS probe H2DCFDA (right panel). Data are means 6 SEM. *P < 0.05, **P < 0.01, and ***P < 0.001 vs.NCD-fed mice. D:Western blot analysis of the expression of p53 (n = 3 representative mice per group) (left panel), quantification of p53 proteinexpression in AT after NCD or HFD feeding for 2 weeks (n = 13 per group) or 4 weeks (n = 5 for NCD and n = 6 for HFD) (middle panel), andquantification of the indicated mRNA in AT after NCD or HFD feeding for 2 weeks (n = 7 mice per group) (right panel). Results are expressedrelative to the NCD-fed mice. Data are means 6 SEM. *P < 0.05 and **P < 0.01. E: Insulin effect on lipogenesis in isolated adipocytes frommice fed the NCD or HFD for 2 weeks (n = 6 adipocyte preparations from 6 different mice in each of the groups). Data are expressed as the foldincrease over unstimulated cells. F: Quantification of the mRNA levels of the indicated genes in AT from mice fed the NCD or HFD for 2 weeks(n = 7 mice per group). Data are means 6 SEM. **P < 0.01. AdipoQ, adiponectin. G: IPGTT in mice fed the NCD or HFD for 2 weeks. Areaunder the curve (AUC) was calculated from 0 to 120 min. H: HOMA of insulin resistance (IR) index (fasting glucose mmol/L 3 fastinginsulin [mU/mL]/22.5) of the same mice as in G. I: Left panel, quantification by flow cytometry analysis of the numbers of F4/80+ (CD11c+ or
3066 DNA Damage and p53 in Obese Adipocytes Diabetes Volume 65, October 2016

These observations support that DNA damage and p53activation occur very early during obesity developmentconcomitantly to an increase in adipocyte ROS but beforethe insulin resistance of adipocytes, the inflammation ofAT, and the glucose intolerance.
DNA Damage Causes AT Inflammation and AdipocyteInsulin Resistance In VivoWe next assessed the effect of DNA damage on AT in-flammation and adipocyte function by short-term ad-ministration of the DNA-damaging drug doxorubicin inlean mice. The weight of epiAT did not differ betweencontrol and doxorubicin-administered mice (377.0 6 31.2mg vs. 348.3 6 19.6 mg, respectively), but doxorubicin in-creased the amount of F4/80+CD11c2 and F4/80+CD11c+
macrophages as well as F4/802CD11c+ dendritic-like cellsin the epiAT (Fig. 3A). Histological examination revealed aninfiltration of polynuclear cells in epiAT of doxorubicin-administered mice consisting of 50% of Lys6G+ neutrophilswithout a difference in adipocyte size (Fig. 3B). Thesechanges in immune cells were associated with an increasein inflammatory markers, such as p65–NF-kB phosphory-lation in the SVF (Fig. 3C), TNF-a, IL-1b, and IL-6 mRNAin epiAT, adipocytes, or SVF (Fig. 3D), and with a decreasein the anti-inflammatory marker CD206 mRNA with atrend toward a decrease of IL-10 mRNA (Fig. 3D). As ex-pected, p53 was activated in the epiAT and adipocytes ofmice administered doxorubicin, as indicated by the increasein p21 (Fig. 3E). Doxorubicin decreased Glut4 mRNA andprotein, IRS1 and adiponectin mRNA (Fig. 3E and F), andprotein kinase B (PKB)/Akt phosphorylation in adipocytesfeaturing insulin resistance of adipocytes (Fig. 3F). Accord-ingly, insulin-induced lipogenesis was decreased in isolatedadipocytes from the mice injected with doxorubicin andthe circulating nonesterified fatty acid level was increased(Fig. 3F and G). These changes in adipocyte functions andAT inflammation did not markedly affect whole-body glu-cose metabolism because the IPGGT and insulin secretionduring this test were unchanged (Fig. 3H and I).
Adipocyte-Mediated Macrophage Chemotaxis IsIncreased by Doxorubicin-Induced DNA Damage andp53 ActivationFrom the above findings, we hypothesized that DNA damageand activation of p53 in adipocytes promote the secretion ofchemotactic factors triggering infiltration of immune cellsin AT. We thus investigated in vitro the chemotaxis activityof AdCM from adipocytes exposed to doxorubicin to induceDNA damage or to nutlin-3 to activate the p53 pathway.Features of DNA damage, such as an increased numberof g-H2AX foci and of p21 expression, stabilization, and
phosphorylation of p53, were observed in 3T3-L1 adipocytesexposed to doxorubicin (Supplementary Fig. 2A–C). Nutlin-3,an inhibitor of the ubiquitin-ligase mdm2 involved in p53degradation (29), also induced the stabilization and phospho-rylation of p53 and the induction of p21 without inducingDNA damage (Supplementary Fig. 2A–C). AdCM from 3T3-L1adipocytes exposed to doxorubicin or nutlin-3 did not in-crease the proinflammatory polarization of mouse RAW mac-rophages or human monocyte-derived macrophages (Fig. 4Aand Supplementary Fig. 3A and B). Importantly, AdCM fromadipocytes exposed to doxorubicin or nutlin-3 exhibited ahigher chemotactic activity toward mouse macrophages orhuman monocyte-derived macrophages compared withAdCM from control adipocytes (Fig. 4B and C). Comparedwith control medium or AdCM from control adipocytes,AdCM from adipocytes exposed to doxorubicin or nutlin-3also exhibited a higher chemotactic activity toward neutro-phils, an effect that is similar or even greater (for doxoru-bicin exposure) than the neutrophil chemotactic factorN-formylmethionyl-leucyl-phenylalanine (Fig. 4D).
Microarray analysis of 3T3-L1 adipocytes exposed todoxorubicin or nutlin-3 revealed that among the expressedchemokines, 11 were deregulated in one or both experimentalconditions (Fig. 5A). Analysis by qRT-PCR confirmed thatdoxorubicin and nutlin-3 increased the mRNA expression ofCCL9 (a fibroblast and dendritic cells chemotactic protein),chemokine (C-X-C motif) ligand (CXCL) 1 (a neutrophil che-motactic protein), and CCL2, whereas the expression of CCL7mRNA, another monocytic chemotactic protein, was increasedby nutlin-3 only (Fig. 5B and C). Doxorubicin and nutlin-3also induced the expression of IL-6. The silencing of p53blocked the induction by nutlin-3 of all of these mRNAs(Fig. 5B) and partly prevented their upregulation in response todoxorubicin, except for CXCL1 (Fig. 5C). Because p53 silencingonly partially reduced p53 expression and activation by doxo-rubicin (Supplementary Fig. 2C), we treated cells with both p53siRNA and pifithrin-a, an inhibitor of p53 transcriptional ac-tivity. In this condition, CCL2/9, CXCL1, and IL-6 mRNA in-duction was prevented (Fig. 5C). Importantly, we found thatthe expression of mRNAs coding for CCL2/7/9 and CXCL1 wasincreased in epiAT from mice exposed to doxorubicin, both inthe adipocyte and SVF fractions for CCL2/7 and only in theadipocyte fraction for CCL9 and CXCL1 (Fig. 5D). We alsoexamined the expression of these chemokines at the onsetof obesity when DNA damage was observed in adipocytes.The CCL2 mRNA level was increased after 2 weeks of HFDfeeding (Fig. 2I), and a trend toward an increase for CCL9mRNA was observed (Fig. 5E). The mRNA levels of all of thesechemokines were significantly increased after 4 weeks of HFDfeeding (Fig. 5F and Supplementary Fig. 1J).
CD11c2) and F4/802CD11c+ cells in the SVF frommice fed the NCD or HFD for 2 weeks (n = 6 mice per group). Values represent the number6SEM of each of the cell subtypes per gram of epididymal fat tissues. Fluorescent-coupled anti-F4/80 and CD11c were from eBioscience. Middlepanel, quantification of the mRNA expression of markers of inflammation in AT of the samemice. Right panel, concentration of IL-6 and TNF-a insera of mice fed the NCD or HFD for 2 or 18 weeks (as a positive control). iNOS, inducible nitric oxide synthase. Data are means 6 SEM. *P <0.05, **P < 0.01, and ***P < 0.01 HFD vs. NCD 2 weeks, and #P < 0.05 and ##P < 0.01 HFD 18 weeks vs. NCD 18 weeks.
diabetes.diabetesjournals.org Vergoni and Associates 3067
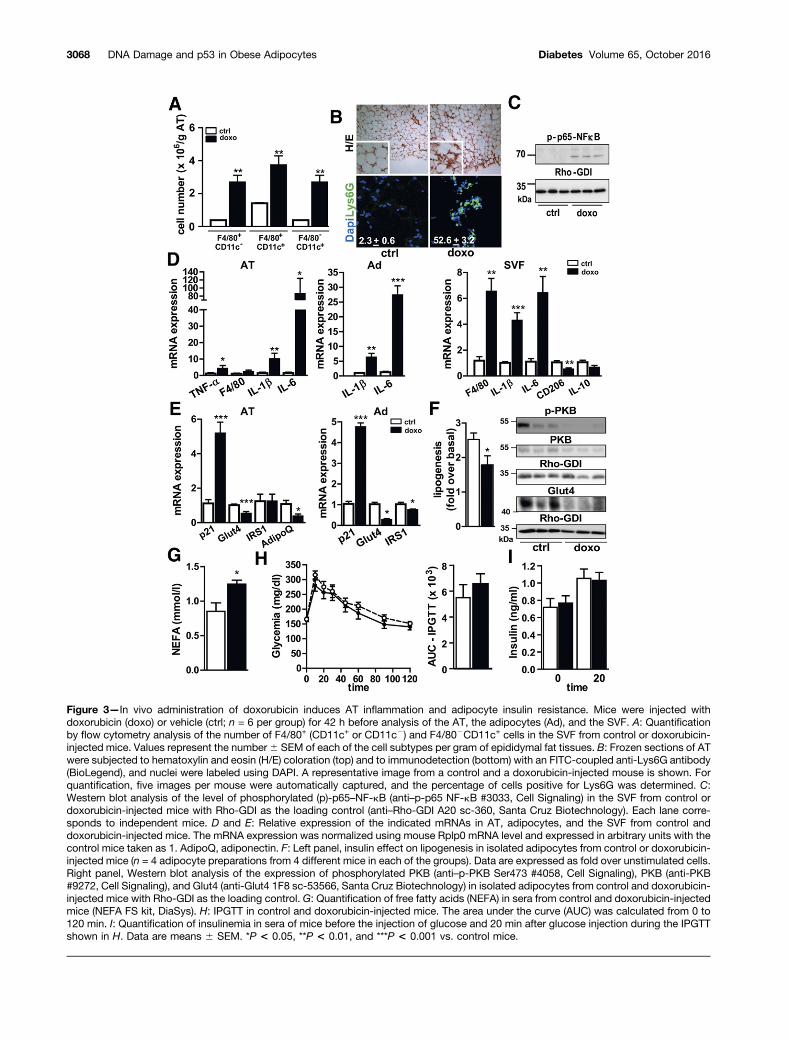
Figure 3—In vivo administration of doxorubicin induces AT inflammation and adipocyte insulin resistance. Mice were injected withdoxorubicin (doxo) or vehicle (ctrl; n = 6 per group) for 42 h before analysis of the AT, the adipocytes (Ad), and the SVF. A: Quantificationby flow cytometry analysis of the number of F4/80+ (CD11c+ or CD11c2) and F4/802CD11c+ cells in the SVF from control or doxorubicin-injected mice. Values represent the number6 SEM of each of the cell subtypes per gram of epididymal fat tissues. B: Frozen sections of ATwere subjected to hematoxylin and eosin (H/E) coloration (top) and to immunodetection (bottom) with an FITC-coupled anti-Lys6G antibody(BioLegend), and nuclei were labeled using DAPI. A representative image from a control and a doxorubicin-injected mouse is shown. Forquantification, five images per mouse were automatically captured, and the percentage of cells positive for Lys6G was determined. C:Western blot analysis of the level of phosphorylated (p)-p65–NF-kB (anti–p-p65 NF-kB #3033, Cell Signaling) in the SVF from control ordoxorubicin-injected mice with Rho-GDI as the loading control (anti–Rho-GDI A20 sc-360, Santa Cruz Biotechnology). Each lane corre-sponds to independent mice. D and E: Relative expression of the indicated mRNAs in AT, adipocytes, and the SVF from control anddoxorubicin-injected mice. The mRNA expression was normalized using mouse Rplp0 mRNA level and expressed in arbitrary units with thecontrol mice taken as 1. AdipoQ, adiponectin. F: Left panel, insulin effect on lipogenesis in isolated adipocytes from control or doxorubicin-injected mice (n = 4 adipocyte preparations from 4 different mice in each of the groups). Data are expressed as fold over unstimulated cells.Right panel, Western blot analysis of the expression of phosphorylated PKB (anti–p-PKB Ser473 #4058, Cell Signaling), PKB (anti-PKB#9272, Cell Signaling), and Glut4 (anti-Glut4 1F8 sc-53566, Santa Cruz Biotechnology) in isolated adipocytes from control and doxorubicin-injected mice with Rho-GDI as the loading control. G: Quantification of free fatty acids (NEFA) in sera from control and doxorubicin-injectedmice (NEFA FS kit, DiaSys). H: IPGTT in control and doxorubicin-injected mice. The area under the curve (AUC) was calculated from 0 to120 min. I: Quantification of insulinemia in sera of mice before the injection of glucose and 20 min after glucose injection during the IPGTTshown in H. Data are means 6 SEM. *P < 0.05, **P < 0.01, and ***P < 0.001 vs. control mice.
3068 DNA Damage and p53 in Obese Adipocytes Diabetes Volume 65, October 2016

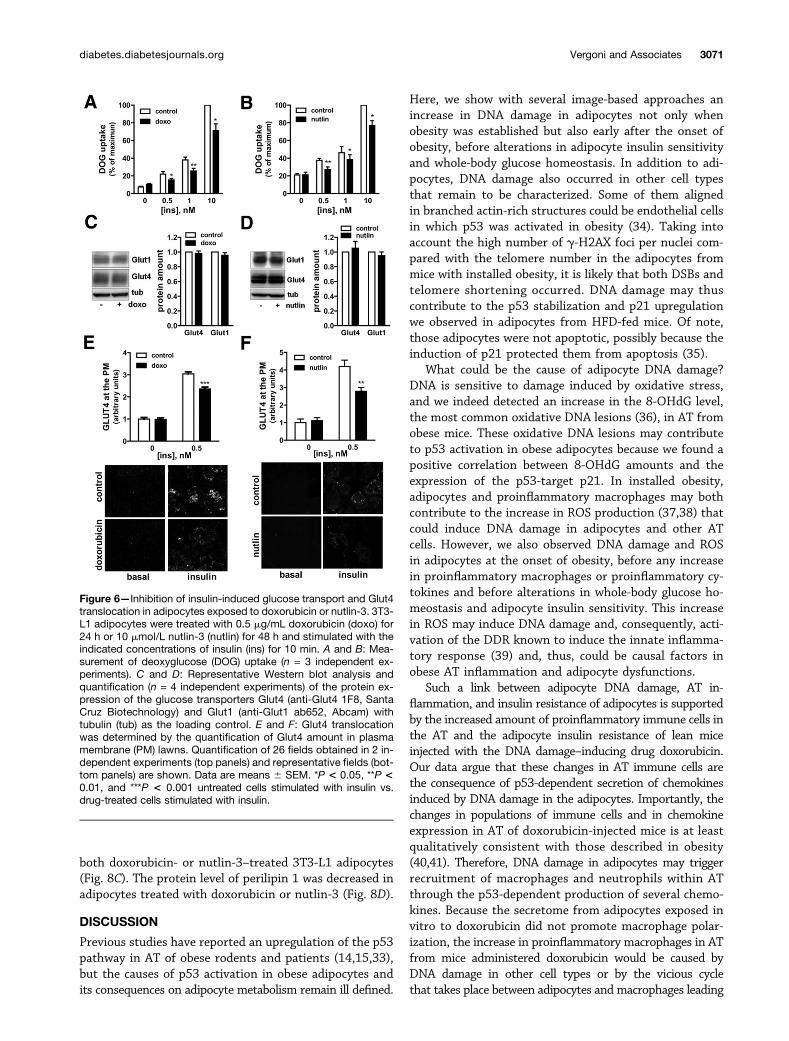
DNA Damage and p53 Activation Inhibit InsulinSignaling and Insulin-Induced Glucose Transport andIncrease Lipolysis in AdipocytesWe next assessed whether the insulin resistance of adipo-cytes from mice injected with doxorubicin (Fig. 3) wasonly the consequence of AT inflammation or might alsobe caused by an adipocyte cell–autonomous effect of DNAdamage and p53 activation. Treatment of 3T3-L1 adipo-cytes with doxorubicin or nutlin-3 reduced insulin-inducedglucose uptake (Fig. 6A and B) and Glut4 translocation (Fig.
6E and F) without changing Glut1 and Glut4 expression(Fig. 6C and D). Similar results were obtained in humanadipocytes (Supplementary Fig. 4A and B). This effect wasassociated with a decrease in insulin signaling in 3T3-L1and human adipocytes (Fig. 7A and B and SupplementaryFig. 4C and D). The insulin-induced PKB/Akt phosphoryla-tion in 3T3-L1 adipocytes treated with doxorubicin ornutlin-3 was improved by p53 silencing, which partially re-duced p53 expression (Supplementary Fig. 5A), or by treat-ment with pifithrin-a (not shown) and was fully restored
Figure 4—Effect of adipocytes p53 activation on macrophage activation and macrophage and neutrophil migration. A, B, and D: 3T3-L1adipocytes were exposed for 48 h to 10 mmol/L nutlin-3 (nutlin) (Enzo Life Sciences) or for 24 h with 0.5 mg/mL doxorubicin (doxo). Thencells were thoroughly rinsed, fresh medium was added, and the AdCM were collected for the following 24 h. A: RAW-Blue macrophageswere incubated with AdCM or control culture medium (M) for 24 h, and the activity of the alkaline phosphatase released in the media wasquantified as the readout of RAW-Blue activation. Lipopolysaccharide (LPS) (0.5 ng/mL) was added in control medium or AdCM as apositive control for macrophage activation. Quantification of three independent experiments normalized to cells treated with controlmedium is shown and expressed as means 6 SEM. B: Chemotaxis assay was performed with RAW 264.7 macrophages using theindicated AdCM or control M. The number of macrophages stained by crystal violet having performed chemotaxis was counted byanalyzing 10 fields for each experimental condition. A typical field corresponding to each of the experimental condition is shown. Resultswere normalized relative to the number of macrophages attracted by the control M. Data are means 6 SEM of three independentexperiments. **P < 0.01 control M vs. control AdCM (AdCM from untreated adipocytes). #P < 0.05 and ###P < 0.001 AdCM fromadipocytes exposed to drugs vs. control AdCM. C: Human cultured adipocytes were exposed for 48 h to 10 mmol/L nutlin-3 or for 24 hto 0.75 mg/mL doxorubicin. AdCM were collected as described above. Chemotaxis assay was performed with blood monocyte-derivedmacrophages using the indicated AdCM. Results were normalized relative to the number of macrophages attracted by control AdCM. Dataare means 6 SEM of three experiments with three AdCM collected from three independent cultures of human adipocytes with the samehuman monocyte-derived macrophage preparation. *P < 0.05 vs. control AdCM. D: The number of neutrophils having performed chemo-taxis toward media using N-formylmethionyl-leucyl-phenylalanine (fMLP; 0.2 mmol/L), a chemotactic factor for neutrophils. AdCM ofcontrol, nutlin-3–treated, or doxorubicin-treated adipocytes was determined by quantifying the number of CD11b+Lys6G+ cells in the lowerBoyden chamber by flow cytometry analysis. Top, representative flow cytometry plots for CD11b+Lys6G+ cells that migrated toward AdCMfrom control, nutlin-3–treated, or doxorubicin-treated cells. Bottom, quantification of the number of migrating neutrophils in chemotaxisassays performed with four independent AdCM and one white blood cell preparation. The experiment was reproduced twice. *P < 0.05,**P < 0.01, and ***P < 0.001 vs. control AdCM.
diabetes.diabetesjournals.org Vergoni and Associates 3069

when p53 expression and activity was reduced by usingboth p53 siRNA and pifithrin-a (Fig. 7D and E and Supple-mentary Fig. 5B). That the deleterious effects of doxorubicinand nutlin-3 involved secretory factors was unlikely becausetreatment of adipocytes with AdCM from 3T3-L1 adipo-cytes treated with doxorubicin or nutlin-3 did not alterinsulin-induced PKB/Akt phosphorylation (Fig. 7C).
An increase in lipolysis contributes to AT inflammationand to the alteration in insulin sensitivity (30). We foundthat doxorubicin or nutlin-3 increased lipolysis in 3T3-L1and human adipocytes, as evidenced by an increase in glyc-erol release (Fig. 8A and B and Supplementary Fig. 4E andF). The p53 silencing in 3T3-L1 adipocytes decreased by
50% the lipolysis induced by nutlin-3 (Fig. 8A). The lipo-lytic effect of doxorubicin was modestly but significantlyreduced by p53 silencing and markedly inhibited by usingboth p53 siRNA and pifithrin-a (Fig. 8B). Pifithrin-a aloneinhibits by 63.7%6 6.8% and 34.8%6 3.3% nutlin-3– anddoxorubicin-induced lipolysis, respectively.
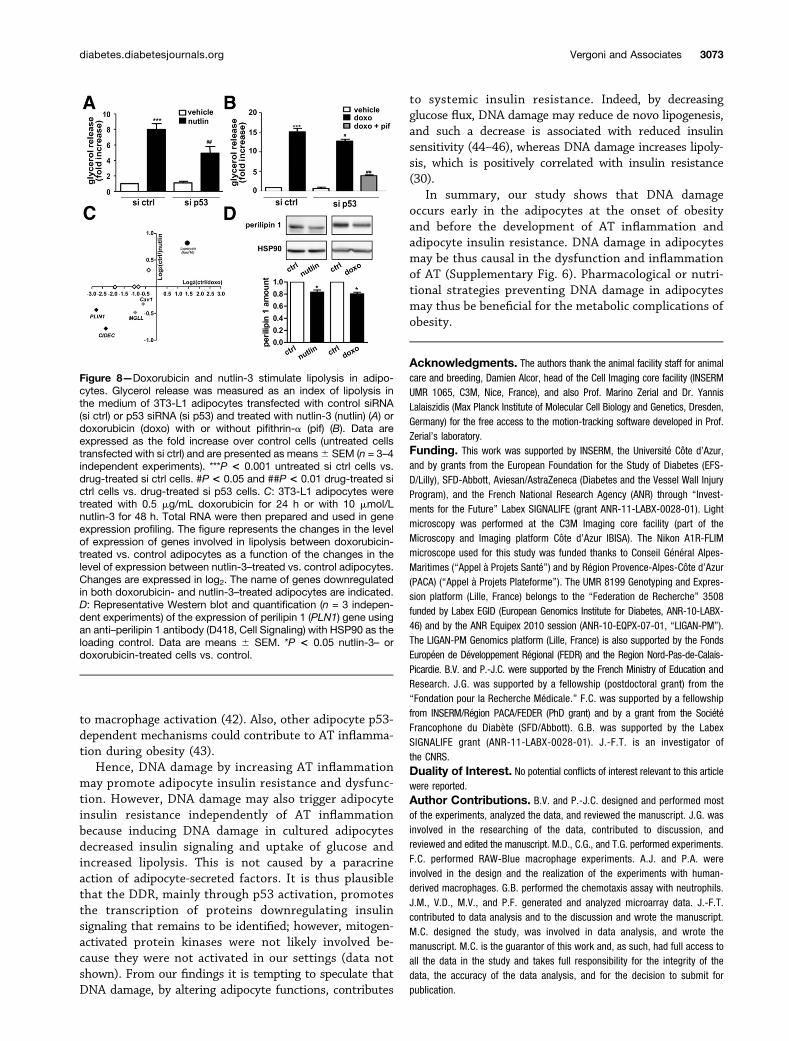
To further explore the mechanisms of the lipolytic effectof DNA damage and p53 activation, we examined the ex-pression of lipolytic enzymes and/or of lipid droplet compo-nents. Microarray analysis revealed that the genes involvedin the maintenance of lipid droplet integrity and re-pression of basal lipolysis, such as PLIN1 (coding forperilipin 1) and CIDEC (31,32), were downregulated in
Figure 5—Effect of DNA damage and p53 activation on mRNA expression of cytokines/chemokines and the implication of p53. A: 3T3-L1adipocytes were treated with 0.5 mg/mL doxorubicin (doxo) for 24 h or 10 mmol/L nutlin-3 (nutl) for 48 h. Total RNAs were then prepared andused in gene expression profiling by microarray. The figure represents the changes in the level of expression of cytokines and chemokinesbetween doxorubicin-treated vs. control (ctrl) adipocytes as a function of the changes in the level of expression between nutlin-treated vs.control adipocytes. Changes are expressed in log2. Only the cytokines/chemokines with an expression that changed in one or in the twoexperimental conditions are shown. Relative mRNA amount of the indicated chemokines/cytokines in 3T3-L1 adipocytes transfected withcontrol siRNA (si ctrl) or p53 siRNA (si p53) and incubated without (ctrl) or with nutlin-3 (B) or doxorubicin (C). When indicated, adipocytestransfected with p53 siRNA were also treated with pifithrin-a (pif). Data (n = 3–4 independent experiments) were normalized using mouseRplp0 mRNA level and are expressed as arbitrary units with the value of si ctrl untreated cells taken as 1 (dashed line in C). D: RelativemRNA expression of the indicated chemokines in AT, adipocyte (Ad), and SVF of control mice or doxorubicin-injected mice. The mea-surements were performed with the same mRNA samples as those used in Fig. 3D and E. Relative mRNA expression of the indicatedchemokines in AT of mice fed the NCD or HFD for 2 weeks (E) or 4 weeks (F ). The measurements were performed with the same mRNAsamples as in Fig. 2F–I and Supplementary Fig. 1I–J. Data are means6 SEM. *P< 0.05, **P< 0.01, and ***P< 0.001 vs. effect in untreatedsi ctrl cells or in mice injected with vehicle or in NCD-fed mice. #P < 0.05 and ##P < 0.01 for drug-treated si ctrl cells vs. drug-treated sip53 cells.
3070 DNA Damage and p53 in Obese Adipocytes Diabetes Volume 65, October 2016
both doxorubicin- or nutlin-3–treated 3T3-L1 adipocytes(Fig. 8C). The protein level of perilipin 1 was decreased inadipocytes treated with doxorubicin or nutlin-3 (Fig. 8D).
DISCUSSION
Previous studies have reported an upregulation of the p53pathway in AT of obese rodents and patients (14,15,33),but the causes of p53 activation in obese adipocytes andits consequences on adipocyte metabolism remain ill defined.
Here, we show with several image-based approaches anincrease in DNA damage in adipocytes not only whenobesity was established but also early after the onset ofobesity, before alterations in adipocyte insulin sensitivityand whole-body glucose homeostasis. In addition to adi-pocytes, DNA damage also occurred in other cell typesthat remain to be characterized. Some of them alignedin branched actin-rich structures could be endothelial cellsin which p53 was activated in obesity (34). Taking intoaccount the high number of g-H2AX foci per nuclei com-pared with the telomere number in the adipocytes frommice with installed obesity, it is likely that both DSBs andtelomere shortening occurred. DNA damage may thuscontribute to the p53 stabilization and p21 upregulationwe observed in adipocytes from HFD-fed mice. Of note,those adipocytes were not apoptotic, possibly because theinduction of p21 protected them from apoptosis (35).
What could be the cause of adipocyte DNA damage?DNA is sensitive to damage induced by oxidative stress,and we indeed detected an increase in the 8-OHdG level,the most common oxidative DNA lesions (36), in AT fromobese mice. These oxidative DNA lesions may contributeto p53 activation in obese adipocytes because we found apositive correlation between 8-OHdG amounts and theexpression of the p53-target p21. In installed obesity,adipocytes and proinflammatory macrophages may bothcontribute to the increase in ROS production (37,38) thatcould induce DNA damage in adipocytes and other ATcells. However, we also observed DNA damage and ROSin adipocytes at the onset of obesity, before any increasein proinflammatory macrophages or proinflammatory cy-tokines and before alterations in whole-body glucose ho-meostasis and adipocyte insulin sensitivity. This increasein ROS may induce DNA damage and, consequently, acti-vation of the DDR known to induce the innate inflamma-tory response (39) and, thus, could be causal factors inobese AT inflammation and adipocyte dysfunctions.
Such a link between adipocyte DNA damage, AT in-flammation, and insulin resistance of adipocytes is supportedby the increased amount of proinflammatory immune cells inthe AT and the adipocyte insulin resistance of lean miceinjected with the DNA damage–inducing drug doxorubicin.Our data argue that these changes in AT immune cells arethe consequence of p53-dependent secretion of chemokinesinduced by DNA damage in the adipocytes. Importantly, thechanges in populations of immune cells and in chemokineexpression in AT of doxorubicin-injected mice is at leastqualitatively consistent with those described in obesity(40,41). Therefore, DNA damage in adipocytes may triggerrecruitment of macrophages and neutrophils within ATthrough the p53-dependent production of several chemo-kines. Because the secretome from adipocytes exposed invitro to doxorubicin did not promote macrophage polar-ization, the increase in proinflammatory macrophages in ATfrom mice administered doxorubicin would be caused byDNA damage in other cell types or by the vicious cyclethat takes place between adipocytes and macrophages leading
Figure 6—Inhibition of insulin-induced glucose transport and Glut4translocation in adipocytes exposed to doxorubicin or nutlin-3. 3T3-L1 adipocytes were treated with 0.5 mg/mL doxorubicin (doxo) for24 h or 10 mmol/L nutlin-3 (nutlin) for 48 h and stimulated with theindicated concentrations of insulin (ins) for 10 min. A and B: Mea-surement of deoxyglucose (DOG) uptake (n = 3 independent ex-periments). C and D: Representative Western blot analysis andquantification (n = 4 independent experiments) of the protein ex-pression of the glucose transporters Glut4 (anti-Glut4 1F8, SantaCruz Biotechnology) and Glut1 (anti-Glut1 ab652, Abcam) withtubulin (tub) as the loading control. E and F: Glut4 translocationwas determined by the quantification of Glut4 amount in plasmamembrane (PM) lawns. Quantification of 26 fields obtained in 2 in-dependent experiments (top panels) and representative fields (bot-tom panels) are shown. Data are means 6 SEM. *P < 0.05, **P <0.01, and ***P < 0.001 untreated cells stimulated with insulin vs.drug-treated cells stimulated with insulin.
diabetes.diabetesjournals.org Vergoni and Associates 3071
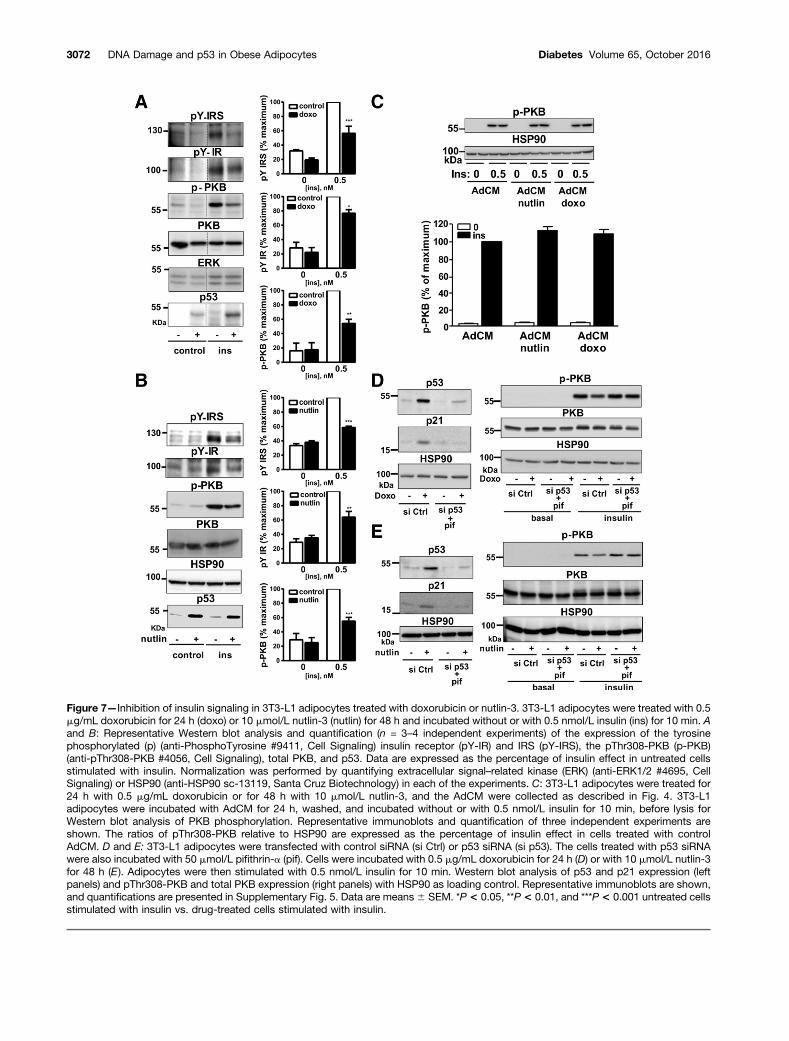
Figure 7—Inhibition of insulin signaling in 3T3-L1 adipocytes treated with doxorubicin or nutlin-3. 3T3-L1 adipocytes were treated with 0.5mg/mL doxorubicin for 24 h (doxo) or 10 mmol/L nutlin-3 (nutlin) for 48 h and incubated without or with 0.5 nmol/L insulin (ins) for 10 min. Aand B: Representative Western blot analysis and quantification (n = 3–4 independent experiments) of the expression of the tyrosinephosphorylated (p) (anti-PhosphoTyrosine #9411, Cell Signaling) insulin receptor (pY-IR) and IRS (pY-IRS), the pThr308-PKB (p-PKB)(anti-pThr308-PKB #4056, Cell Signaling), total PKB, and p53. Data are expressed as the percentage of insulin effect in untreated cellsstimulated with insulin. Normalization was performed by quantifying extracellular signal–related kinase (ERK) (anti-ERK1/2 #4695, CellSignaling) or HSP90 (anti-HSP90 sc-13119, Santa Cruz Biotechnology) in each of the experiments. C: 3T3-L1 adipocytes were treated for24 h with 0.5 mg/mL doxorubicin or for 48 h with 10 mmol/L nutlin-3, and the AdCM were collected as described in Fig. 4. 3T3-L1adipocytes were incubated with AdCM for 24 h, washed, and incubated without or with 0.5 nmol/L insulin for 10 min, before lysis forWestern blot analysis of PKB phosphorylation. Representative immunoblots and quantification of three independent experiments areshown. The ratios of pThr308-PKB relative to HSP90 are expressed as the percentage of insulin effect in cells treated with controlAdCM. D and E: 3T3-L1 adipocytes were transfected with control siRNA (si Ctrl) or p53 siRNA (si p53). The cells treated with p53 siRNAwere also incubated with 50 mmol/L pifithrin-a (pif). Cells were incubated with 0.5 mg/mL doxorubicin for 24 h (D) or with 10 mmol/L nutlin-3for 48 h (E ). Adipocytes were then stimulated with 0.5 nmol/L insulin for 10 min. Western blot analysis of p53 and p21 expression (leftpanels) and pThr308-PKB and total PKB expression (right panels) with HSP90 as loading control. Representative immunoblots are shown,and quantifications are presented in Supplementary Fig. 5. Data are means6 SEM. *P < 0.05, **P < 0.01, and ***P < 0.001 untreated cellsstimulated with insulin vs. drug-treated cells stimulated with insulin.
3072 DNA Damage and p53 in Obese Adipocytes Diabetes Volume 65, October 2016
to macrophage activation (42). Also, other adipocyte p53-dependent mechanisms could contribute to AT inflamma-tion during obesity (43).
Hence, DNA damage by increasing AT inflammationmay promote adipocyte insulin resistance and dysfunc-tion. However, DNA damage may also trigger adipocyteinsulin resistance independently of AT inflammationbecause inducing DNA damage in cultured adipocytesdecreased insulin signaling and uptake of glucose andincreased lipolysis. This is not caused by a paracrineaction of adipocyte-secreted factors. It is thus plausiblethat the DDR, mainly through p53 activation, promotesthe transcription of proteins downregulating insulinsignaling that remains to be identified; however, mitogen-activated protein kinases were not likely involved be-cause they were not activated in our settings (data notshown). From our findings it is tempting to speculate thatDNA damage, by altering adipocyte functions, contributes
to systemic insulin resistance. Indeed, by decreasingglucose flux, DNA damage may reduce de novo lipogenesis,and such a decrease is associated with reduced insulinsensitivity (44–46), whereas DNA damage increases lipoly-sis, which is positively correlated with insulin resistance(30).
In summary, our study shows that DNA damageoccurs early in the adipocytes at the onset of obesityand before the development of AT inflammation andadipocyte insulin resistance. DNA damage in adipocytesmay be thus causal in the dysfunction and inflammationof AT (Supplementary Fig. 6). Pharmacological or nutri-tional strategies preventing DNA damage in adipocytesmay thus be beneficial for the metabolic complications ofobesity.
Acknowledgments. The authors thank the animal facility staff for animalcare and breeding, Damien Alcor, head of the Cell Imaging core facility (INSERMUMR 1065, C3M, Nice, France), and also Prof. Marino Zerial and Dr. YannisLalaiszidis (Max Planck Institute of Molecular Cell Biology and Genetics, Dresden,Germany) for the free access to the motion-tracking software developed in Prof.Zerial’s laboratory.Funding. This work was supported by INSERM, the Université Côte d’Azur,and by grants from the European Foundation for the Study of Diabetes (EFS-D/Lilly), SFD-Abbott, Aviesan/AstraZeneca (Diabetes and the Vessel Wall InjuryProgram), and the French National Research Agency (ANR) through “Invest-ments for the Future” Labex SIGNALIFE (grant ANR-11-LABX-0028-01). Lightmicroscopy was performed at the C3M Imaging core facility (part of theMicroscopy and Imaging platform Côte d’Azur IBISA). The Nikon A1R-FLIMmicroscope used for this study was funded thanks to Conseil Général Alpes-Maritimes (“Appel à Projets Santé”) and by Région Provence-Alpes-Côte d’Azur(PACA) (“Appel à Projets Plateforme”). The UMR 8199 Genotyping and Expres-sion platform (Lille, France) belongs to the “Federation de Recherche” 3508funded by Labex EGID (European Genomics Institute for Diabetes, ANR-10-LABX-46) and by the ANR Equipex 2010 session (ANR-10-EQPX-07-01, “LIGAN-PM”).The LIGAN-PM Genomics platform (Lille, France) is also supported by the FondsEuropéen de Développement Régional (FEDR) and the Region Nord-Pas-de-Calais-Picardie. B.V. and P.-J.C. were supported by the French Ministry of Education andResearch. J.G. was supported by a fellowship (postdoctoral grant) from the“Fondation pour la Recherche Médicale.” F.C. was supported by a fellowshipfrom INSERM/Région PACA/FEDER (PhD grant) and by a grant from the SociétéFrancophone du Diabète (SFD/Abbott). G.B. was supported by the LabexSIGNALIFE grant (ANR-11-LABX-0028-01). J.-F.T. is an investigator ofthe CNRS.Duality of Interest. No potential conflicts of interest relevant to this articlewere reported.Author Contributions. B.V. and P.-J.C. designed and performed mostof the experiments, analyzed the data, and reviewed the manuscript. J.G. wasinvolved in the researching of the data, contributed to discussion, andreviewed and edited the manuscript. M.D., C.G., and T.G. performed experiments.F.C. performed RAW-Blue macrophage experiments. A.J. and P.A. wereinvolved in the design and the realization of the experiments with human-derived macrophages. G.B. performed the chemotaxis assay with neutrophils.J.M., V.D., M.V., and P.F. generated and analyzed microarray data. J.-F.T.contributed to data analysis and to the discussion and wrote the manuscript.M.C. designed the study, was involved in data analysis, and wrote themanuscript. M.C. is the guarantor of this work and, as such, had full access toall the data in the study and takes full responsibility for the integrity of thedata, the accuracy of the data analysis, and for the decision to submit forpublication.
Figure 8—Doxorubicin and nutlin-3 stimulate lipolysis in adipo-cytes. Glycerol release was measured as an index of lipolysis inthe medium of 3T3-L1 adipocytes transfected with control siRNA(si ctrl) or p53 siRNA (si p53) and treated with nutlin-3 (nutlin) (A) ordoxorubicin (doxo) with or without pifithrin-a (pif) (B). Data areexpressed as the fold increase over control cells (untreated cellstransfected with si ctrl) and are presented as means6 SEM (n = 3–4independent experiments). ***P < 0.001 untreated si ctrl cells vs.drug-treated si ctrl cells. #P < 0.05 and ##P < 0.01 drug-treated sictrl cells vs. drug-treated si p53 cells. C: 3T3-L1 adipocytes weretreated with 0.5 mg/mL doxorubicin for 24 h or with 10 mmol/Lnutlin-3 for 48 h. Total RNA were then prepared and used in geneexpression profiling. The figure represents the changes in the levelof expression of genes involved in lipolysis between doxorubicin-treated vs. control adipocytes as a function of the changes in thelevel of expression between nutlin-3–treated vs. control adipocytes.Changes are expressed in log2. The name of genes downregulatedin both doxorubicin- and nutlin-3–treated adipocytes are indicated.D: Representative Western blot and quantification (n = 3 indepen-dent experiments) of the expression of perilipin 1 (PLN1) gene usingan anti–perilipin 1 antibody (D418, Cell Signaling) with HSP90 as theloading control. Data are means 6 SEM. *P < 0.05 nutlin-3– ordoxorubicin-treated cells vs. control.
diabetes.diabetesjournals.org Vergoni and Associates 3073
References1. Kahn BB, Flier JS. Obesity and insulin resistance. J Clin Invest 2000;106:473–4812. Herman MA, Kahn BB. Glucose transport and sensing in the maintenanceof glucose homeostasis and metabolic harmony. J Clin Invest 2006;116:1767–17753. Hotamisligil GS. Inflammation and metabolic disorders. Nature 2006;444:860–8674. Furukawa S, Fujita T, Shimabukuro M, et al. Increased oxidative stress inobesity and its impact on metabolic syndrome. J Clin Invest 2004;114:1752–17615. Houstis N, Rosen ED, Lander ES. Reactive oxygen species have a causalrole in multiple forms of insulin resistance. Nature 2006;440:944–9486. Trayhurn P. Hypoxia and adipocyte physiology: implications for adiposetissue dysfunction in obesity. Annu Rev Nutr 2014;34:207–2367. Gregor MF, Hotamisligil GS. Inflammatory mechanisms in obesity. Annu RevImmunol 2011;29:415–4458. Bashan N, Kovsan J, Kachko I, Ovadia H, Rudich A. Positive and negativeregulation of insulin signaling by reactive oxygen and nitrogen species. PhysiolRev 2009;89:27–719. Tanti JF, Jager J. Cellular mechanisms of insulin resistance: role of stress-regulated serine kinases and insulin receptor substrates (IRS) serine phosphor-ylation. Curr Opin Pharmacol 2009;9:753–76210. Regazzetti C, Peraldi P, Grémeaux T, et al. Hypoxia decreases insulin sig-naling pathways in adipocytes. Diabetes 2009;58:95–10311. Hafsi H, Hainaut P. Redox control and interplay between p53 isoforms: rolesin the regulation of basal p53 levels, cell fate, and senescence. Antioxid RedoxSignal 2011;15:1655–166712. Hallenborg P, Feddersen S, Madsen L, Kristiansen K. The tumor suppres-sors pRB and p53 as regulators of adipocyte differentiation and function. ExpertOpin Ther Targets 2009;13:235–24613. Schupp M, Chen F, Briggs ER, et al. Metabolite and transcriptome analysisduring fasting suggest a role for the p53-Ddit4 axis in major metabolic tissues.BMC Genomics 2013;14:75814. Yahagi N, Shimano H, Matsuzaka T, et al. p53 Activation in adipocytes ofobese mice. J Biol Chem 2003;278:25395–2540015. Minamino T, Orimo M, Shimizu I, et al. A crucial role for adipose tissue p53in the regulation of insulin resistance. Nat Med 2009;15:1082–108716. Phillips ER, McKinnon PJ. DNA double-strand break repair and develop-ment. Oncogene 2007;26:7799–780817. Kaddai V, Jager J, Gonzalez T, et al. Involvement of TNF-alpha in abnormaladipocyte and muscle sortilin expression in obese mice and humans. Dia-betologia 2009;52:932–94018. Jager J, Grémeaux T, Gonzalez T, et al. Tpl2 kinase is upregulated inadipose tissue in obesity and may mediate interleukin-1beta and tumor necrosisfactor-alpha effects on extracellular signal-regulated kinase activation and lipolysis.Diabetes 2010;59:61–7019. Kaddai V, Gonzalez T, Keslair F, et al. Rab4b is a small GTPase involved inthe control of the glucose transporter GLUT4 localization in adipocyte. PLoS One2009;4:e525720. Obba S, Hizir Z, Boyer L, et al. The PRKAA1/AMPKa1 pathway triggersautophagy during CSF1-induced human monocyte differentiation and is a po-tential target in CMML. Autophagy 2015;11:1114–112921. Jager J, Corcelle V, Grémeaux T, et al. Deficiency in the extracellular signal-regulated kinase 1 (ERK1) protects leptin-deficient mice from insulin resistancewithout affecting obesity. Diabetologia 2011;54:180–18922. Mari M, Monzo P, Kaddai V, et al. The Rab4 effector Rabip4 plays a role inthe endocytotic trafficking of Glut 4 in 3T3-L1 adipocytes. J Cell Sci 2006;119:1297–130623. Gilleron J, Querbes W, Zeigerer A, et al. Image-based analysis of lipidnanoparticle-mediated siRNA delivery, intracellular trafficking and endosomalescape. Nat Biotechnol 2013;31:638–646
24. Renier N, Wu Z, Simon DJ, Yang J, Ariel P, Tessier-Lavigne M. iDISCO: asimple, rapid method to immunolabel large tissue samples for volume imaging.Cell 2014;159:896–91025. Ritchie ME, Phipson B, Wu D, et al. limma powers differential expressionanalyses for RNA-sequencing and microarray studies. Nucleic Acids Res 2015;43:e4726. Kaddai V, Gonzalez T, Bolla M, Le Marchand-Brustel Y, Cormont M. Thenitric oxide-donating derivative of acetylsalicylic acid, NCX 4016, stimulatesglucose transport and glucose transporters translocation in 3T3-L1 adipocytes.Am J Physiol Endocrinol Metab 2008;295:E162–E16927. Dizdaroglu M, Jaruga P. Mechanisms of free radical-induced damage toDNA. Free Radic Res 2012;46:382–41928. Muñoz-Espín D, Serrano M. Cellular senescence: from physiology topathology. Nat Rev Mol Cell Biol 2014;15:482–49629. Hock AK, Vousden KH. The role of ubiquitin modification in the regulation ofp53. Biochem Biophys Acta 2014;1843:137–14930. Arner P, Langin D. Lipolysis in lipid turnover, cancer cachexia, and obesity-induced insulin resistance. Trends Endocrinol Metab 2014;25:255–26231. Brasaemle DL. Thematic review series: adipocyte biology. The perilipinfamily of structural lipid droplet proteins: stabilization of lipid droplets and controlof lipolysis. J Lipid Res 2007;48:2547–255932. Tanaka N, Takahashi S, Matsubara T, et al. Adipocyte-specific disruption offat-specific protein 27 causes hepatosteatosis and insulin resistance in high-fatdiet-fed mice. J Biol Chem 2015;290:3092–310533. Ortega FJ, Moreno-Navarrete JM, Mayas D, et al. Inflammation and insulinresistance exert dual effects on adipose tissue tumor protein 53 expression. Int JObes 2014;38:737–74534. Yokoyama M, Okada S, Nakagomi A, et al. Inhibition of endothelial p53improves metabolic abnormalities related to dietary obesity. Cell Rep 2014;7:1691–170335. Inoue N, Yahagi N, Yamamoto T, et al. Cyclin-dependent kinase in-hibitor, p21WAF1/CIP1, is involved in adipocyte differentiation and hyper-trophy, linking to obesity, and insulin resistance. J Biol Chem 2008;283:21220–2122936. Cooke MS, Evans MD, Dizdaroglu M, Lunec J. Oxidative DNA damage:mechanisms, mutation, and disease. FASEB J 2003;17:1195–121437. Eriksson JW. Metabolic stress in insulin’s target cells leads to ROS accu-mulation - a hypothetical common pathway causing insulin resistance. FEBS Lett2007;581:3734–374238. Vieira-Potter VJ. Inflammation and macrophage modulation in adipose tis-sues. Cell Microbiol 2014;16:1484–149239. Chatzinikolaou G, Karakasilioti I, Garinis GA. DNA damage and innateimmunity: links and trade-offs. Trends Immunol 2014;35:429–43540. Surmi BK, Hasty AH. The role of chemokines in recruitment of immune cellsto the artery wall and adipose tissue. Vascul Pharmacol 2010;52:27–3641. Huh JY, Park YJ, Ham M, Kim JB. Crosstalk between adipocytes and im-mune cells in adipose tissue inflammation and metabolic dysregulation in obe-sity. Mol Cells 2014;37:365–37142. Ceppo F, Berthou F, Jager J, Dumas K, Cormont M, Tanti J-F. Implication ofthe Tpl2 kinase in inflammatory changes and insulin resistance induced by theinteraction between adipocytes and macrophages. Endocrinology 2014;155:951–96443. Shimizu I, Yoshida Y, Moriya J, et al. Semaphorin3E-induced inflammationcontributes to insulin resistance in dietary obesity. Cell Metab 2013;18:491–50444. Girousse A, Tavernier G, Valle C, et al. Partial inhibition of adipose tissuelipolysis improves glucose metabolism and insulin sensitivity without alteration offat mass. PLoS Biol 2013;11:e100148545. Herman MA, Peroni OD, Villoria J, et al. A novel ChREBP isoform in adiposetissue regulates systemic glucose metabolism. Nature 2012;484:333–33846. Roberts R, Hodson L, Dennis AL, et al. Markers of de novo lipogenesisin adipose tissue: associations with small adipocytes and insulin sensitivity inhumans. Diabetologia 2009;52:882–890
3074 DNA Damage and p53 in Obese Adipocytes Diabetes Volume 65, October 2016