dnb bank dnb boligkreditt · july 2017 dnb bank dnb boligkreditt . 2 content ... 2006 2008 2010...
TRANSCRIPT
July 2017
DNB Bank
DNB Boligkreditt
2
Content
• DNB – A Brief Overview
• The Norwegian Economy
• Financial Targets, Performance and Capital
• Loan Book and Asset quality
• Funding
• Appendix: • Cover Pool Portfolio Information and LCR eligibility • Digitalization • The Norwegian Mortgage Market • Capital and Tier 1 • Additional slides – Financial Performance and Other information
3
DNB – A Brief Overview

4
DNB - Norway’s Leading Financial Services Group
• Approximately 30 % market share in Norway
• 34 % owned by the Norwegian Government
• Credit Ratings: • Moody's: Aa2* (negative)
• S&P: A+ (stable)
• DBRS: AA (low) (stable)
* Upgraded to Aa2 with negative outlook 16 March 2016
5
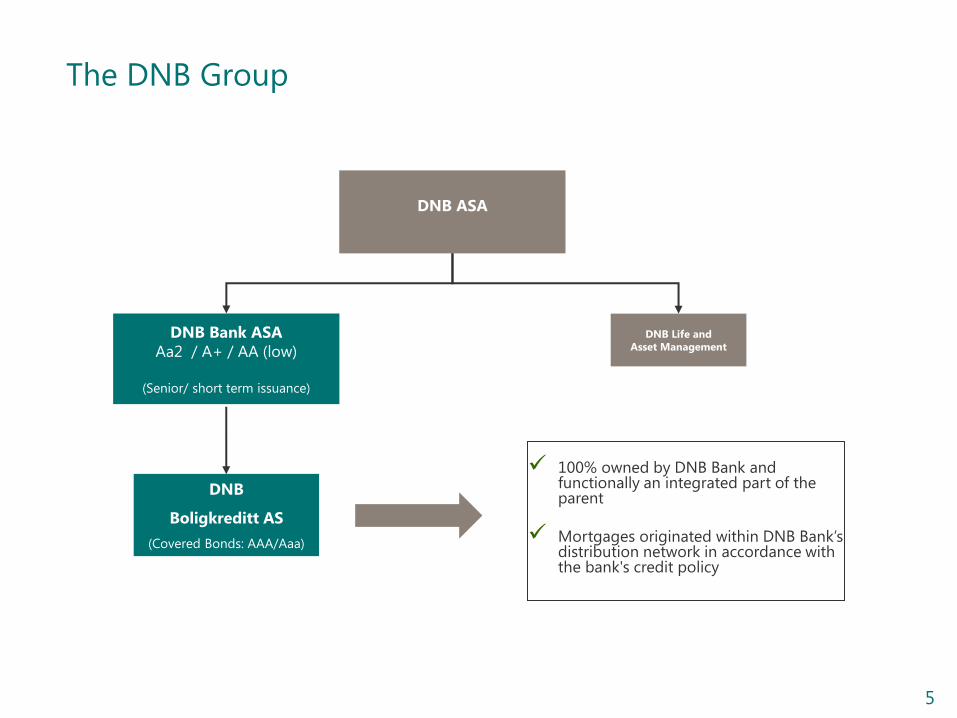
The DNB Group
100% owned by DNB Bank and functionally an integrated part of the parent
Mortgages originated within DNB Bank’s distribution network in accordance with the bank's credit policy
DNB Bank ASA
Aa2 / A+ / AA (low)
(Senior/ short term issuance)
DNB Life and
Asset Management
DNB ASA
DNB
Boligkreditt AS
(Covered Bonds: AAA/Aaa)
6
The Norwegian Economy

7
Still a Solid Norwegian Economy
Source: 1) OECD Economic Outlook No. 101, June 2017
2) Ministry of Finance (National Budget 2017)
3) DNB Markets Economic Outlook April 2017
2016 2017
Budget surplus 1) 3.1 % 4.1 %
Oil fund 2) ~ EUR 826 bn ~ EUR 845 bn
Unemployment 3) 4.7 % 4.4 %
GDP growth 3) + 0.9 % + 1.6 %
Central Bank Rate 3) 0.5 % 0.5 %

8
Government Finances are Still Rock-Solid
Annual budget deficit/surplus forecast for 20171) General government net financial liabilities1)
As per cent of nominal GDP 2017
1) Source: OECD Economic Outlook No. 101, June 2017
-300
-250
-200
-150
-100
-50
0
50
100
150
200
Iceland0.9
Norway+4.1
Sweden+0.9
Finland-1.7
Poland-2.9Germany
0.7
Denmark-0.8
Ireland-0.5
Slovakia-1.2Austria
-1.0
Netherlands1.1
Belgium-1.9
United Kingdom-3.0
Luxembourg+0.7
France-3.0
Spain-3.1Portugal
-1.5
Italy-2.1
Greece-0.2
Slovenia-1.0
Hungary-2.6
Estonia-0.4
Czech R.
0.4
9
0
100
200
300
400
500
600
2006 2008 2010 2012 2014 2016
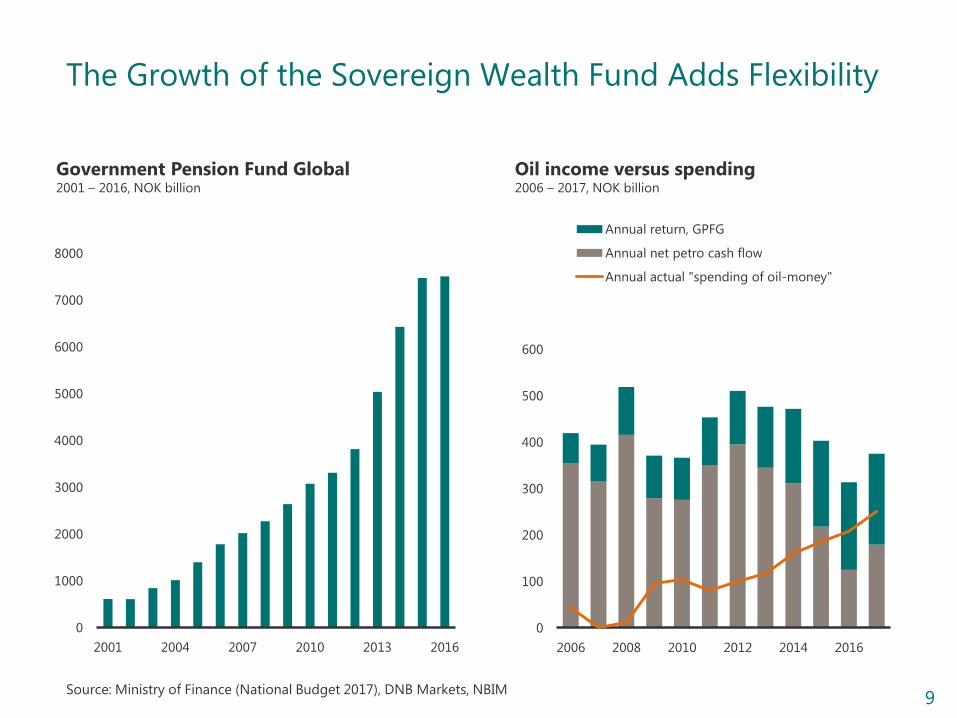
Annual return, GPFG
Annual net petro cash flow
Annual actual "spending of oil-money"
Government Pension Fund Global 2001 – 2016, NOK billion
Oil income versus spending 2006 – 2017, NOK billion
0
1000
2000
3000
4000
5000
6000
7000
8000
2001 2004 2007 2010 2013 2016
Source: Ministry of Finance (National Budget 2017), DNB Markets, NBIM
The Growth of the Sovereign Wealth Fund Adds Flexibility
10
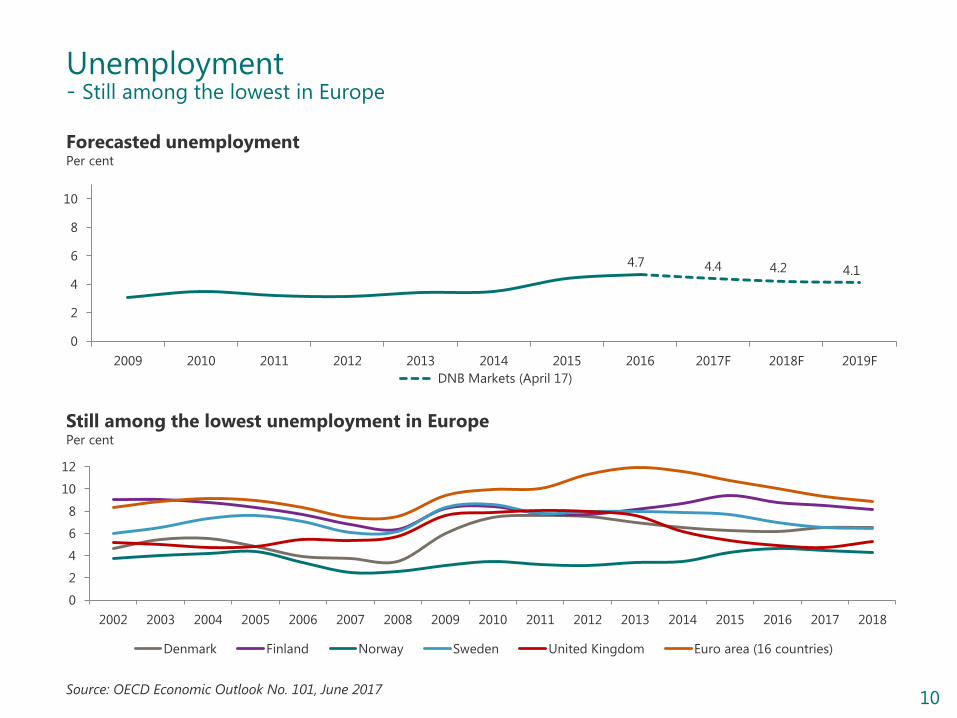
Forecasted unemployment Per cent
4.7 4.4 4.2 4.1
0
2
4
6
8
10
2009 2010 2011 2012 2013 2014 2015 2016 2017F 2018F 2019F
DNB Markets (April 17)
Still among the lowest unemployment in Europe Per cent
Source: OECD Economic Outlook No. 101, June 2017
Unemployment - Still among the lowest in Europe
0
2
4
6
8
10
12
2002 2003 2004 2005 2006 2007 2008 2009 2010 2011 2012 2013 2014 2015 2016 2017 2018
Denmark Finland Norway Sweden United Kingdom Euro area (16 countries)
11
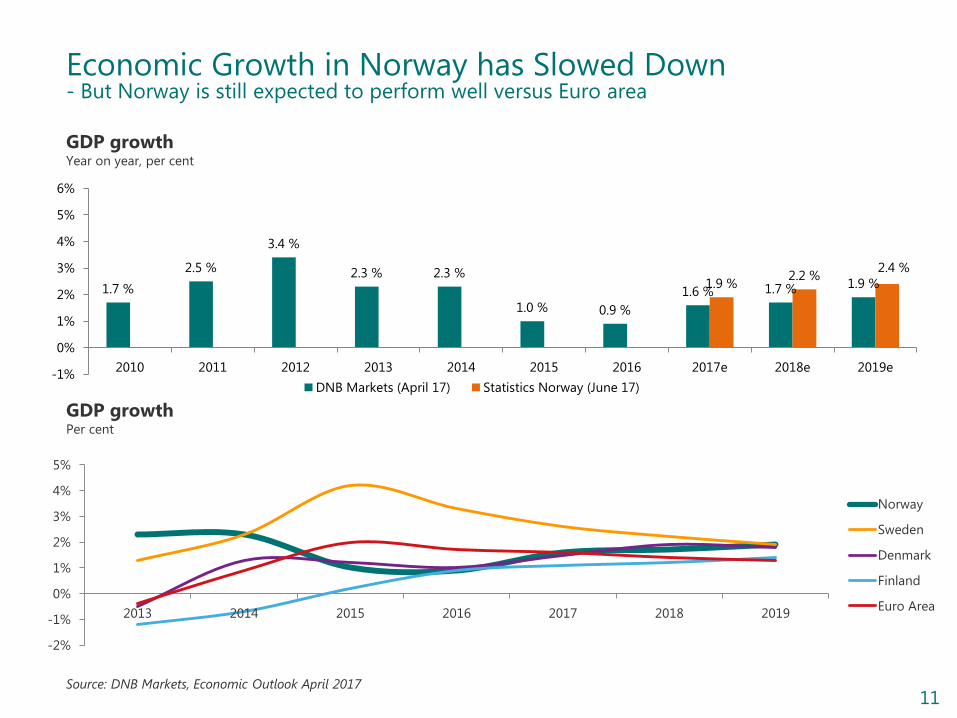
Economic Growth in Norway has Slowed Down - But Norway is still expected to perform well versus Euro area
1.7 %
2.5 %
3.4 %
2.3 % 2.3 %
1.0 % 0.9 %
1.6 % 1.7 % 1.9 % 1.9 % 2.2 %
2.4 %
-1%
0%
1%
2%
3%
4%
5%
6%
2010 2011 2012 2013 2014 2015 2016 2017e 2018e 2019e
DNB Markets (April 17) Statistics Norway (June 17)
GDP growth Year on year, per cent
-2%
-1%
0%
1%
2%
3%
4%
5%
2013 2014 2015 2016 2017 2018 2019
Norway
Sweden
Denmark
Finland
Euro Area
GDP growth Per cent
Source: DNB Markets, Economic Outlook April 2017
12
0
1
2
3
4
5
6
7
8
9
10
0
50
100
150
200
250
1990
1992
1994
1996
1998
2000
2002
2004
2006
2008
2010
2012
2014
2016
2018
2020
Constant 2014 prices (lha) Share of GDP (rha)
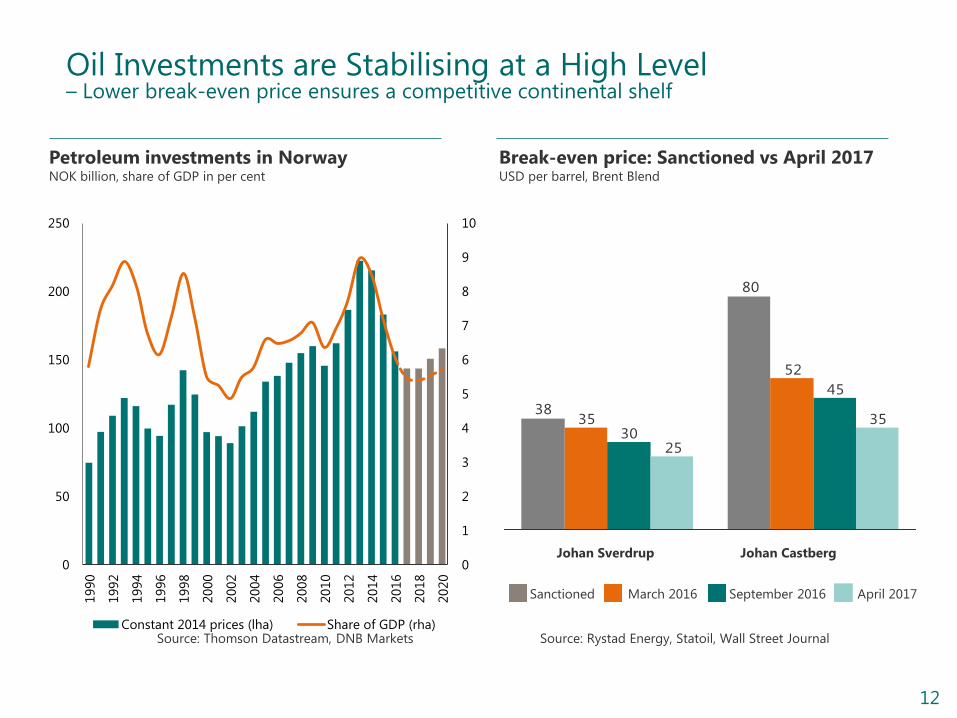
Oil Investments are Stabilising at a High Level – Lower break-even price ensures a competitive continental shelf
Source: Thomson Datastream, DNB Markets Source: Rystad Energy, Statoil, Wall Street Journal
Break-even price: Sanctioned vs April 2017 USD per barrel, Brent Blend
Petroleum investments in Norway NOK billion, share of GDP in per cent
March 2016 September 2016 Sanctioned
Johan Sverdrup Johan Castberg
80
38
52
35
45
3035
25
April 2017
13
Financial Targets, Performance and Capital

14
Financial Ambitions for 2017 - 2019
CET1 ratio ~ 16.0 per cent 1)
Requirement including
management buffer
Cash dividend combined
with share buy-back
programme
ROE > 12 per cent
Overriding target towards
2019
C/I ratio < 40 per cent
Key performance indicator
Payout ratio > 50 per cent
1) Based on transitional rules including increased counter-cyclical buffer requirements in Singapore, Sweden and Norway.
15
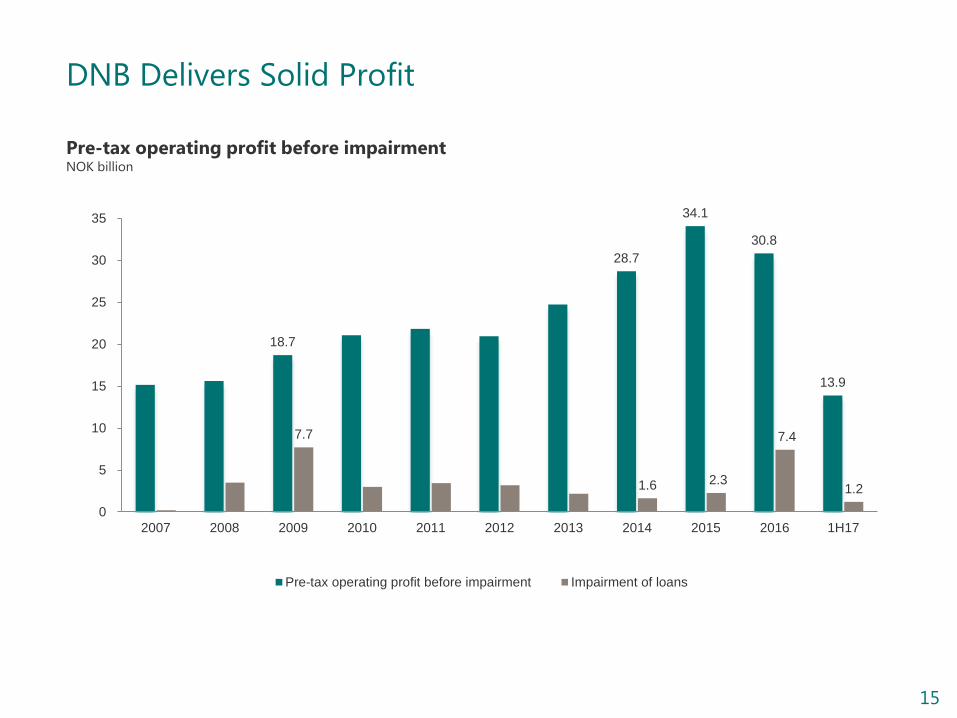
DNB Delivers Solid Profit
18.7
28.7
34.1
30.8
13.9
7.7
1.6 2.3
7.4
1.2
0
5
10
15
20
25
30
35
2007 2008 2009 2010 2011 2012 2013 2014 2015 2016 1H17
Pre-tax operating profit before impairment Impairment of loans
Pre-tax operating profit before impairment NOK billion
16
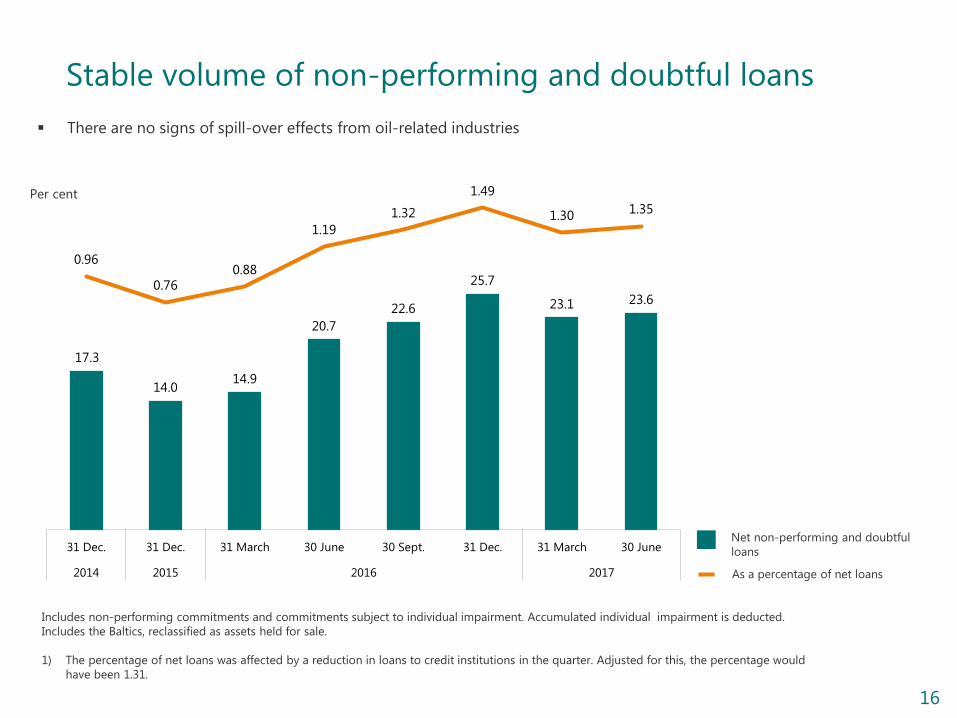
Stable volume of non-performing and doubtful loans
17.3
14.0 14.9
20.7
22.6
25.7
23.1 23.6
0.96
0.76 0.88
1.19
1.32
1.49
1.30 1.35
31 Dec. 31 Dec. 31 March 30 June 30 Sept. 31 Dec. 31 March 30 June
2014 2015 2016 2017
Includes non-performing commitments and commitments subject to individual impairment. Accumulated individual impairment is deducted.
Includes the Baltics, reclassified as assets held for sale.
1) The percentage of net loans was affected by a reduction in loans to credit institutions in the quarter. Adjusted for this, the percentage would
have been 1.31.
Per cent
Net non-performing and doubtful
loans
As a percentage of net loans
There are no signs of spill-over effects from oil-related industries
17
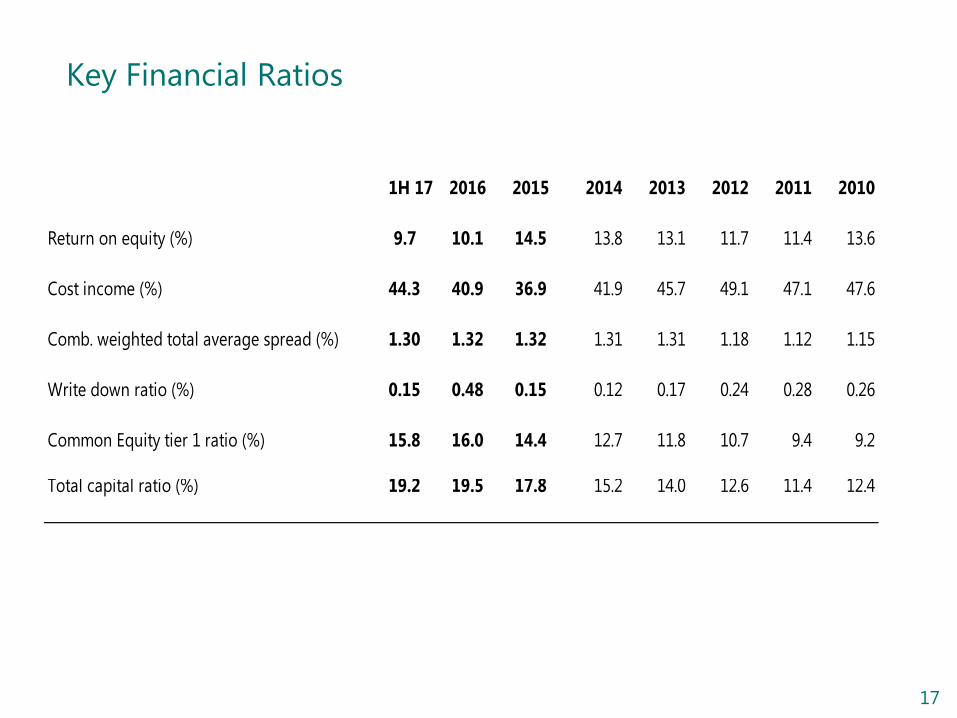
Key Financial Ratios
1H 17 2016 2015 2014 2013 2012 2011 2010
Return on equity (%) 9.7 10.1 14.5 13.8 13.1 11.7 11.4 13.6
Cost income (%) 44.3 40.9 36.9 41.9 45.7 49.1 47.1 47.6
Comb. weighted total average spread (%) 1.30 1.32 1.32 1.31 1.31 1.18 1.12 1.15
Write down ratio (%) 0.15 0.48 0.15 0.12 0.17 0.24 0.28 0.26
Common Equity tier 1 ratio (%) 15.8 16.0 14.4 12.7 11.8 10.7 9.4 9.2
Total capital ratio (%) 19.2 19.5 17.8 15.2 14.0 12.6 11.4 12.4

18
DNB CET1 Capital Generation
CET1 build up and dividend Basis points (bps) – transitional rules
138
101 92
175
160 32
40 55
65 89
2012 2013 2014 2015 2016
CET1 build up Dividends
CET1 capital ratio – transitional rules Per cent
8.5 9.2 9.4
10.7
11.8
12.7
14.4
16.0 15.8
2009 10 11 12 13 14 15 16 1H17
Equity development NOK bn
118 127
142
159
190
206 207
2011 2012 2013 2014 2015 2016 1H17
19
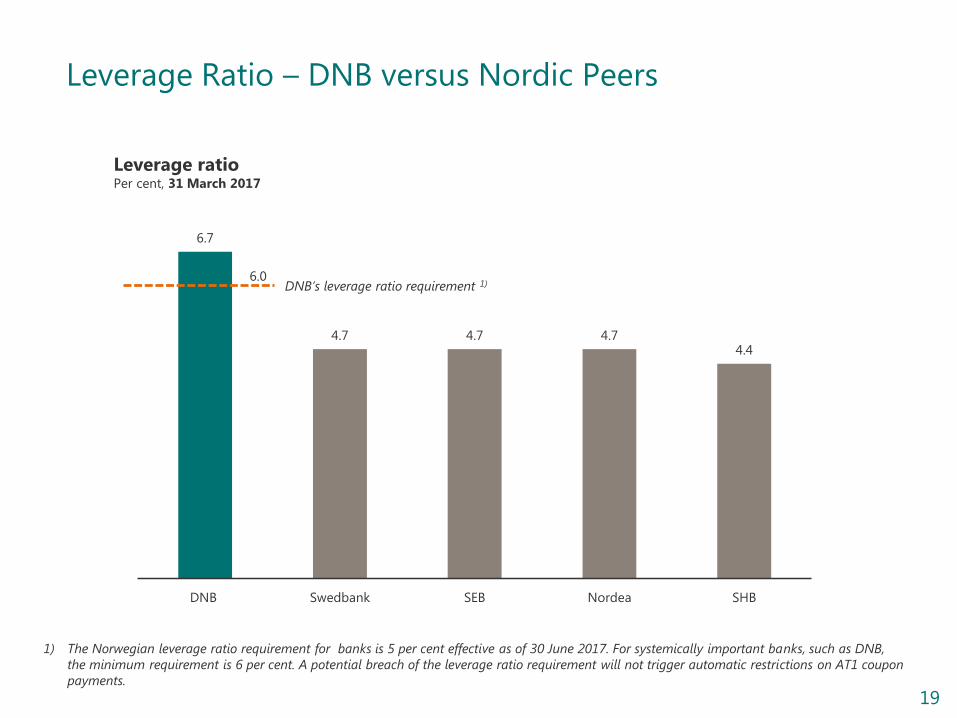
6.7
4.7 4.7 4.7 4.4
DNB Swedbank SEB Nordea SHB
Leverage Ratio – DNB versus Nordic Peers
Leverage ratio Per cent, 31 March 2017
DNB’s leverage ratio requirement 1)
1) The Norwegian leverage ratio requirement for banks is 5 per cent effective as of 30 June 2017. For systemically important banks, such as DNB,
the minimum requirement is 6 per cent. A potential breach of the leverage ratio requirement will not trigger automatic restrictions on AT1 coupon
payments.
6.0
20
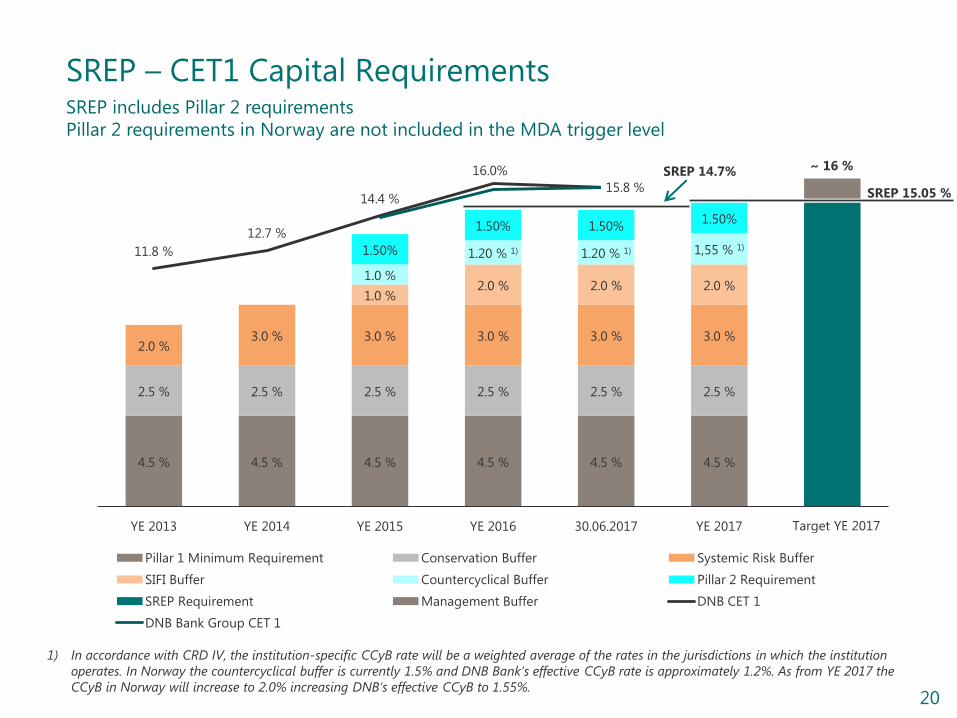
4.5 % 4.5 % 4.5 % 4.5 % 4.5 % 4.5 %
2.5 % 2.5 % 2.5 % 2.5 % 2.5 % 2.5 %
2.0 % 3.0 % 3.0 % 3.0 % 3.0 % 3.0 %
1.0 % 2.0 % 2.0 % 2.0 %
1.0 %
1.20 % 1) 1.20 % 1) 1,55 % 1) 1.50%
1.50% 1.50% 1.50%
11.8 %
12.7 %
14.4 %
16.0%
YE 2013 YE 2014 YE 2015 YE 2016 30.06.2017 YE 2017
Pillar 1 Minimum Requirement Conservation Buffer Systemic Risk Buffer
SIFI Buffer Countercyclical Buffer Pillar 2 Requirement
SREP Requirement Management Buffer DNB CET 1
DNB Bank Group CET 1
15.8 %
Target YE 2017
SREP – CET1 Capital Requirements
1) In accordance with CRD IV, the institution-specific CCyB rate will be a weighted average of the rates in the jurisdictions in which the institution
operates. In Norway the countercyclical buffer is currently 1.5% and DNB Bank’s effective CCyB rate is approximately 1.2%. As from YE 2017 the
CCyB in Norway will increase to 2.0% increasing DNB’s effective CCyB to 1.55%.
SREP 15.05 %
~ 16 %
SREP includes Pillar 2 requirements
Pillar 2 requirements in Norway are not included in the MDA trigger level
SREP 14.7%
21
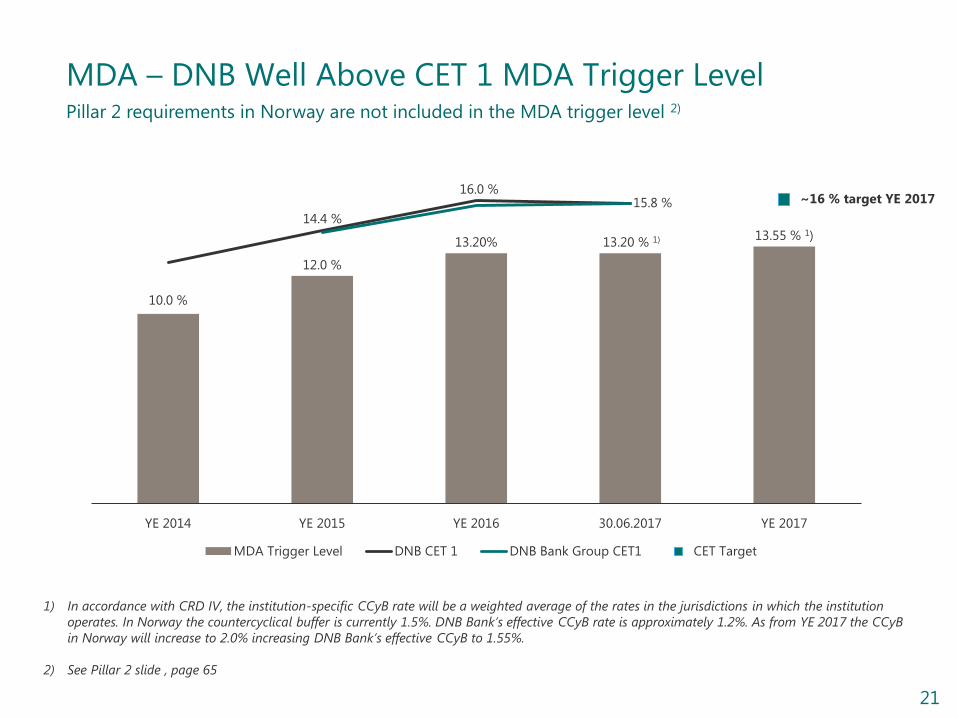
MDA – DNB Well Above CET 1 MDA Trigger Level Pillar 2 requirements in Norway are not included in the MDA trigger level 2)
1) In accordance with CRD IV, the institution-specific CCyB rate will be a weighted average of the rates in the jurisdictions in which the institution
operates. In Norway the countercyclical buffer is currently 1.5%. DNB Bank’s effective CCyB rate is approximately 1.2%. As from YE 2017 the CCyB
in Norway will increase to 2.0% increasing DNB Bank’s effective CCyB to 1.55%.
2) See Pillar 2 slide , page 65
~16 % target YE 2017
10.0 %
12.0 %
13.20% 13.20 % 1) 13.55 % 1)
16.0 % 15.8 %
14.4 %
YE 2014 YE 2015 YE 2016 30.06.2017 YE 2017
MDA Trigger Level DNB CET 1 DNB Bank Group CET1 CET Target
22
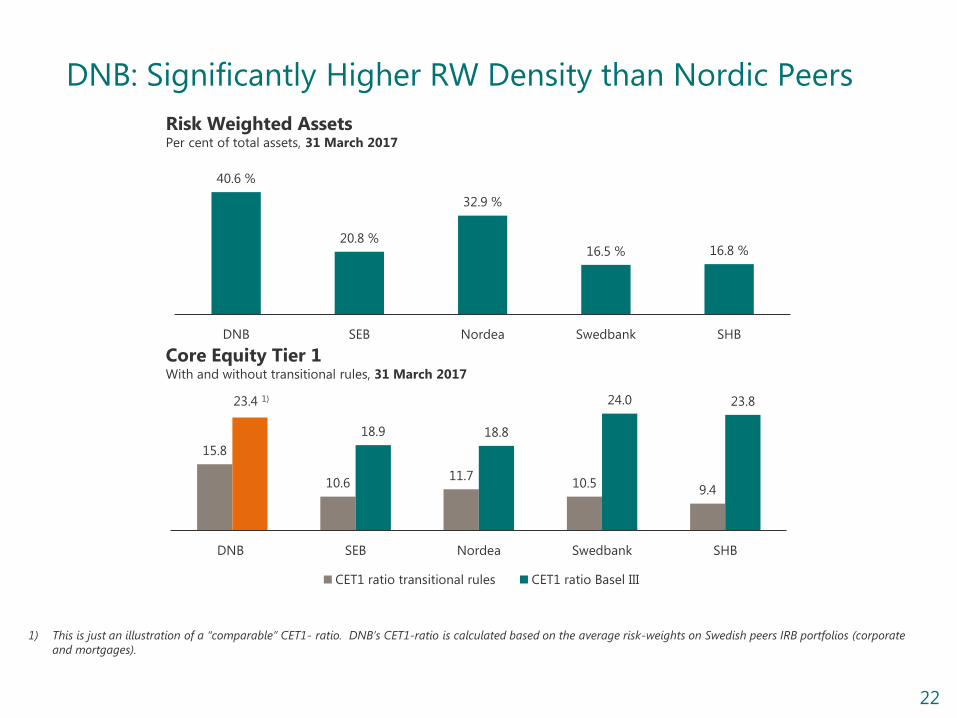
DNB: Significantly Higher RW Density than Nordic Peers
Risk Weighted Assets Per cent of total assets, 31 March 2017
Core Equity Tier 1 With and without transitional rules, 31 March 2017
15.8
10.6 11.7
10.5 9.4
23.4 1)
18.9 18.8
24.0 23.8
DNB SEB Nordea Swedbank SHB
CET1 ratio transitional rules CET1 ratio Basel III
1) This is just an illustration of a “comparable” CET1- ratio. DNB’s CET1-ratio is calculated based on the average risk-weights on Swedish peers IRB portfolios (corporate
and mortgages).
40.6 %
20.8 %
32.9 %
16.5 % 16.8 %
DNB SEB Nordea Swedbank SHB
23
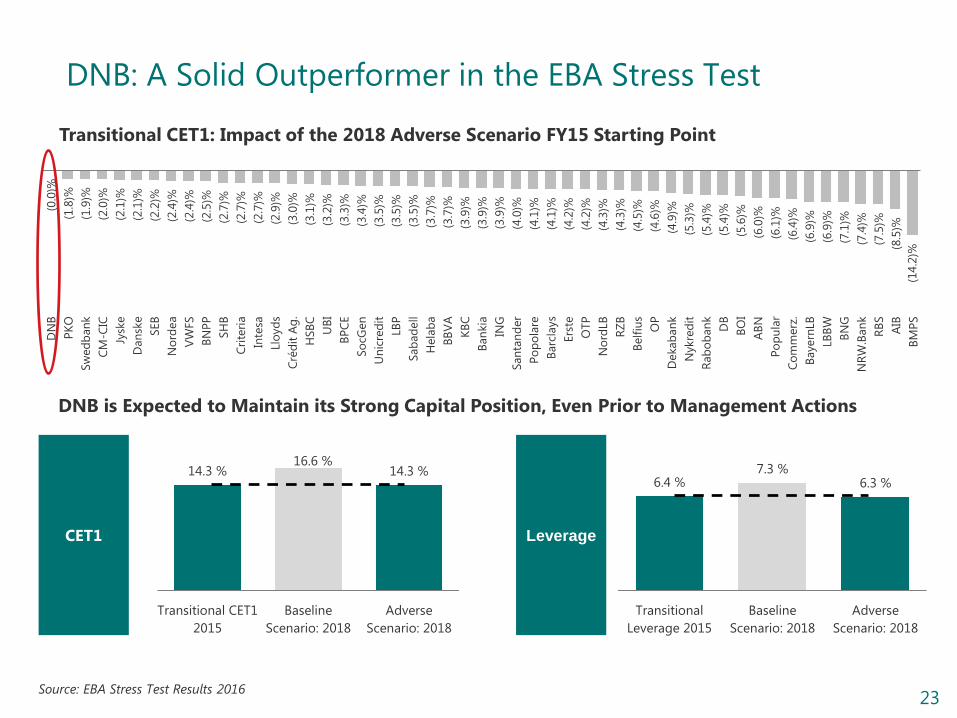
DNB: A Solid Outperformer in the EBA Stress Test (0
.0)%
(1.8
)%
(1.9
)%
(2.0
)%
(2.1
)%
(2.1
)%
(2.2
)%
(2.4
)%
(2.4
)%
(2.5
)%
(2.7
)%
(2.7
)%
(2.7
)%
(2.9
)%
(3.0
)%
(3.1
)%
(3.2
)%
(3.3
)%
(3.4
)%
(3.5
)%
(3.5
)%
(3.5
)%
(3.7
)%
(3.7
)%
(3.9
)%
(3.9
)%
(3.9
)%
(4.0
)%
(4.1
)%
(4.1
)%
(4.2
)%
(4.2
)%
(4.3
)%
(4.3
)%
(4.5
)%
(4.6
)%
(4.9
)%
(5.3
)%
(5.4
)%
(5.4
)%
(5.6
)%
(6.0
)%
(6.1
)%
(6.4
)%
(6.9
)%
(6.9
)%
(7.1
)%
(7.4
)%
(7.5
)%
(8.5
)%
(14.2
)%
DN
B
PK
O
Sw
ed
ban
k
CM
-CIC
Jysk
e
Dan
ske
SEB
No
rdea
VW
FS
BN
PP
SH
B
Cri
teri
a
Inte
sa
Llo
yd
s
Cré
dit
Ag
.
HSB
C
UB
I
BP
CE
So
cGen
Un
icre
dit
LBP
Sab
ad
ell
Hela
ba
BB
VA
KB
C
Ban
kia
ING
San
tan
der
Po
po
lare
Barc
lays
Ers
te
OTP
No
rdLB
RZ
B
Belf
ius
OP
Dekab
an
k
Nykre
dit
Rab
ob
an
k
DB
BO
I
AB
N
Po
pu
lar
Co
mm
erz
.
Bayern
LB
LBB
W
BN
G
NR
W.B
an
k
RB
S
AIB
BM
PS
Transitional CET1: Impact of the 2018 Adverse Scenario FY15 Starting Point
14.3 % 16.6 %
14.3 %
Transitional CET1
2015
Baseline
Scenario: 2018
Adverse
Scenario: 2018
CET1 Leverage
6.4 % 7.3 %
6.3 %
Transitional
Leverage 2015
Baseline
Scenario: 2018
Adverse
Scenario: 2018
DNB is Expected to Maintain its Strong Capital Position, Even Prior to Management Actions
Source: EBA Stress Test Results 2016
24
Loan Book and Asset Quality

25
Commercial real estate 10%
Shipping 5%
Oil, gas and offshore 6%
Power and renewables 2%
Healthcare 2%
Other corporate customers 4%
Public sector 2%
Fishing and fish farming 2%
Trade 3%
Manufacturing 5%
Technology, media and telecom
2%
Services 2%
Residential property 4%
Mortgages and other exposures, personal
customers *) 50%
Loan Book EAD by Segments as of 30 June 2017
Including net non-performing and net doubtful loans and guarantees. Includes portfolio in the Baltics.
Exposures at default are based on full implementation of IRB. The portfolio banks and financial institutions is still subject to final IRB approval from the Norwegian
FSA (Finanstilsynet).
*) Of which mortgages 43 per cent.
26
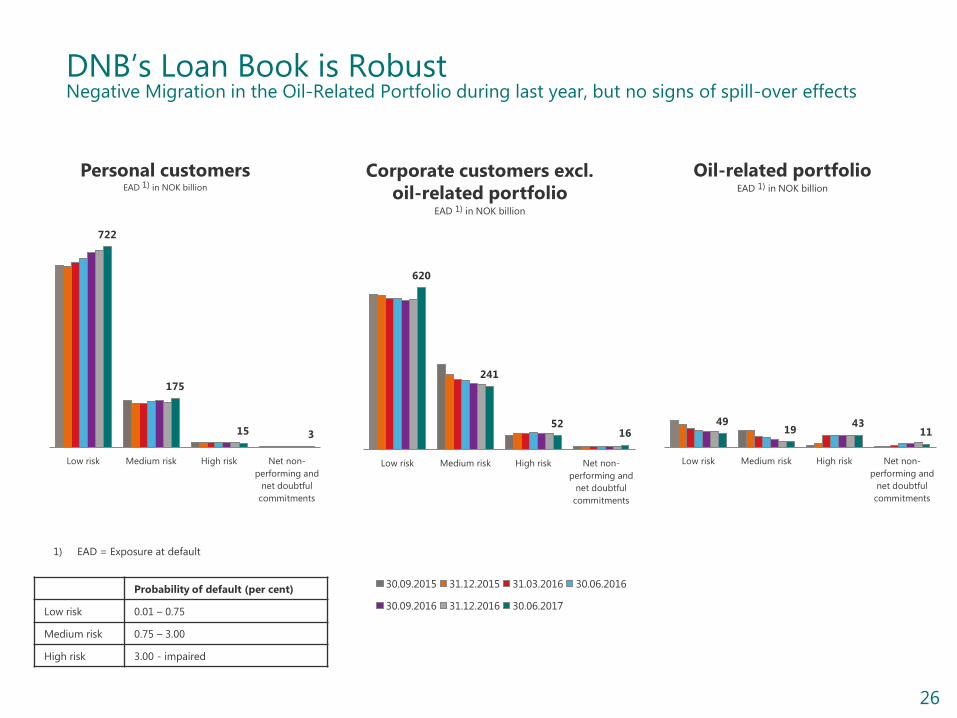
DNB’s Loan Book is Robust Negative Migration in the Oil-Related Portfolio during last year, but no signs of spill-over effects
Personal customers EAD 1) in NOK billion
Corporate customers excl.
oil-related portfolio EAD 1) in NOK billion
Oil-related portfolio
EAD 1) in NOK billion
1) EAD = Exposure at default
722
175
15 3
Low risk Medium risk High risk Net non-
performing and
net doubtful
commitments
620
241
52 16
Low risk Medium risk High risk Net non-
performing and
net doubtful
commitments
30.09.2015 31.12.2015 31.03.2016 30.06.2016
30.09.2016 31.12.2016 30.06.2017
49 19
43 11
Low risk Medium risk High risk Net non-
performing and
net doubtful
commitments
Probability of default (per cent)
Low risk 0.01 – 0.75
Medium risk 0.75 – 3.00
High risk 3.00 - impaired
27
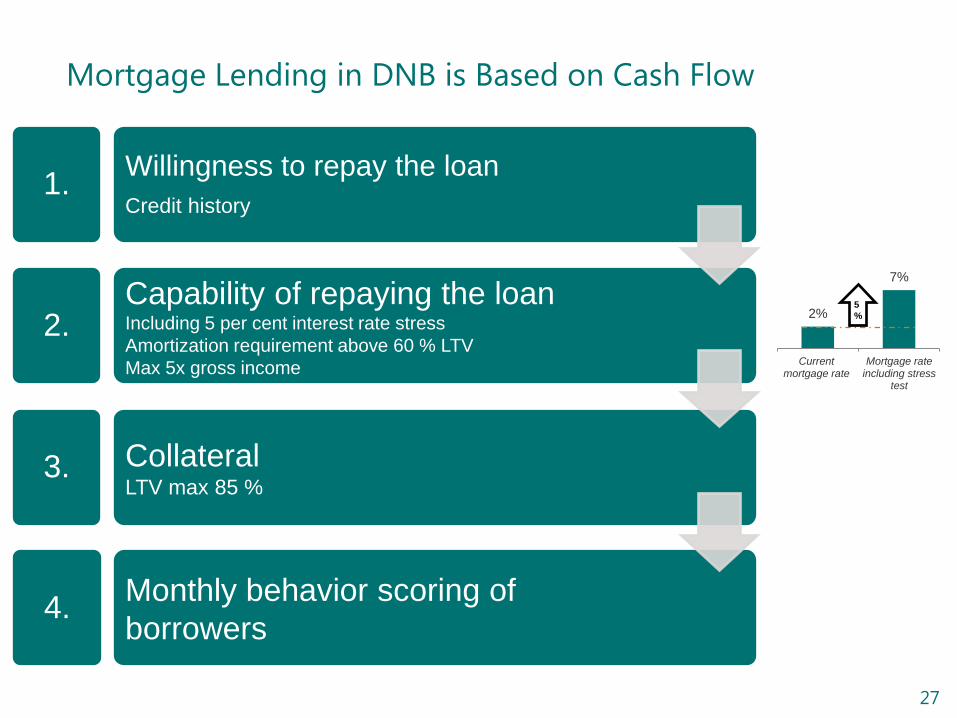
2%
7%
Currentmortgage rate
Mortgage rateincluding stress
test
Mortgage Lending in DNB is Based on Cash Flow
5
%
Willingness to repay the loan
Credit history
Capability of repaying the loan Including 5 per cent interest rate stress
Amortization requirement above 60 % LTV
Max 5x gross income
Collateral LTV max 85 %
Monthly behavior scoring of
borrowers
1.
2.
3.
4.
28
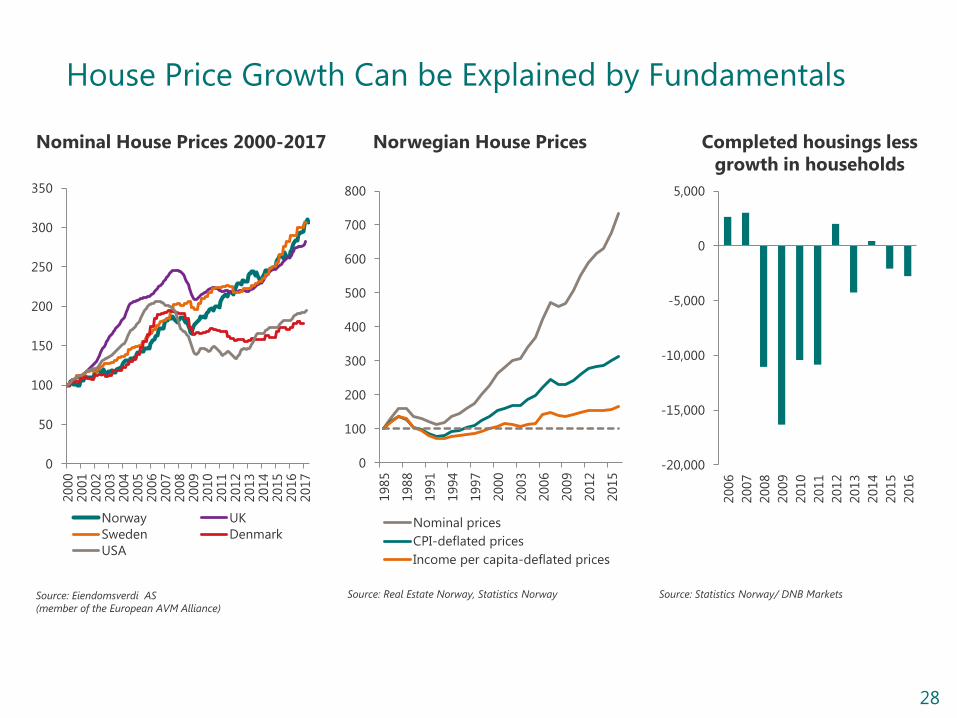
House Price Growth Can be Explained by Fundamentals
Norwegian House Prices
Source: Real Estate Norway, Statistics Norway
Completed housings less
growth in households
Source: Statistics Norway/ DNB Markets
Nominal House Prices 2000-2017
Source: Eiendomsverdi AS
(member of the European AVM Alliance)
0
100
200
300
400
500
600
700
800
1985
1988
1991
1994
1997
2000
2003
2006
2009
2012
2015
Nominal prices
CPI-deflated prices
Income per capita-deflated prices
0
50
100
150
200
250
300
350
2000
2001
2002
2003
2004
2005
2006
2007
2008
2009
2010
2011
2012
2013
2014
2015
2016
2017
Norway UK
Sweden Denmark
USA
-20,000
-15,000
-10,000
-5,000
0
5,000
2006
2007
2008
2009
2010
2011
2012
2013
2014
2015
2016
29
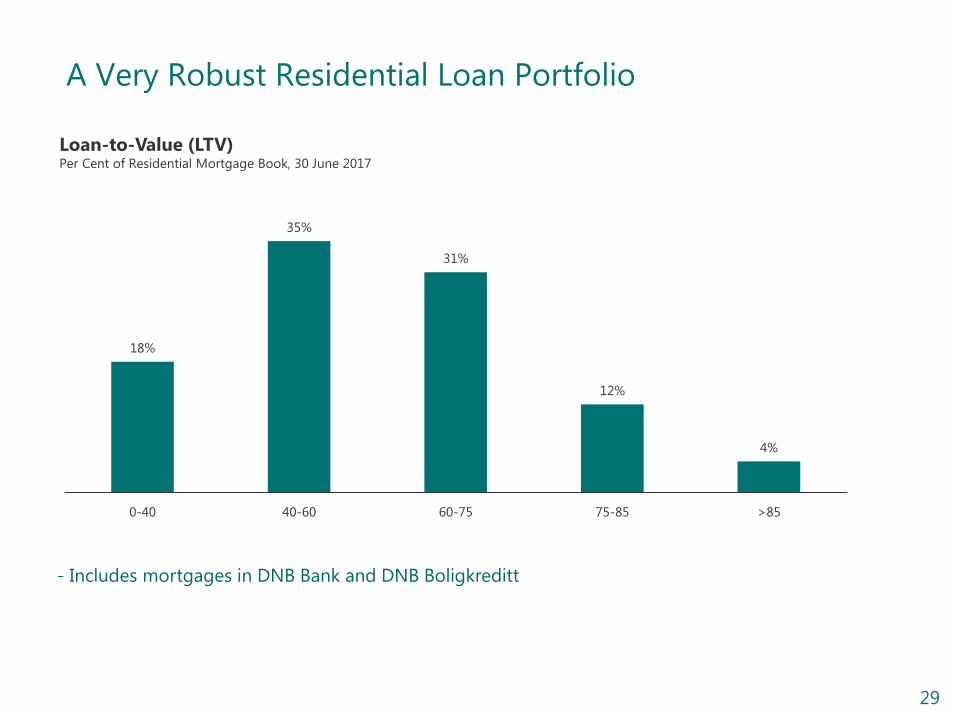
A Very Robust Residential Loan Portfolio
18%
35%
31%
12%
4%
0-40 40-60 60-75 75-85 >85
Loan-to-Value (LTV) Per Cent of Residential Mortgage Book, 30 June 2017
- Includes mortgages in DNB Bank and DNB Boligkreditt
30
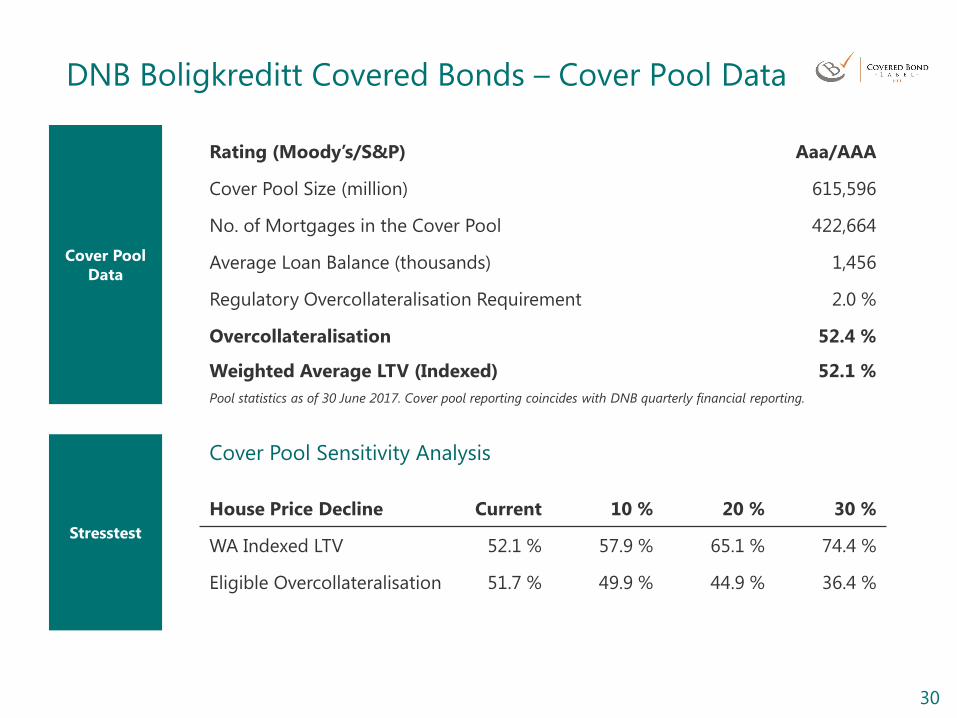
Cover Pool
Data
DNB Boligkreditt Covered Bonds – Cover Pool Data
Rating (Moody’s/S&P) Aaa/AAA
Cover Pool Size (million) 615,596
No. of Mortgages in the Cover Pool 422,664
Average Loan Balance (thousands) 1,456
Regulatory Overcollateralisation Requirement 2.0 %
Overcollateralisation 52.4 %
Weighted Average LTV (Indexed) 52.1 %
Pool statistics as of 30 June 2017. Cover pool reporting coincides with DNB quarterly financial reporting.
Stresstest
House Price Decline Current 10 % 20 % 30 %
WA Indexed LTV 52.1 % 57.9 % 65.1 % 74.4 %
Eligible Overcollateralisation 51.7 % 49.9 % 44.9 % 36.4 %
Cover Pool Sensitivity Analysis
31
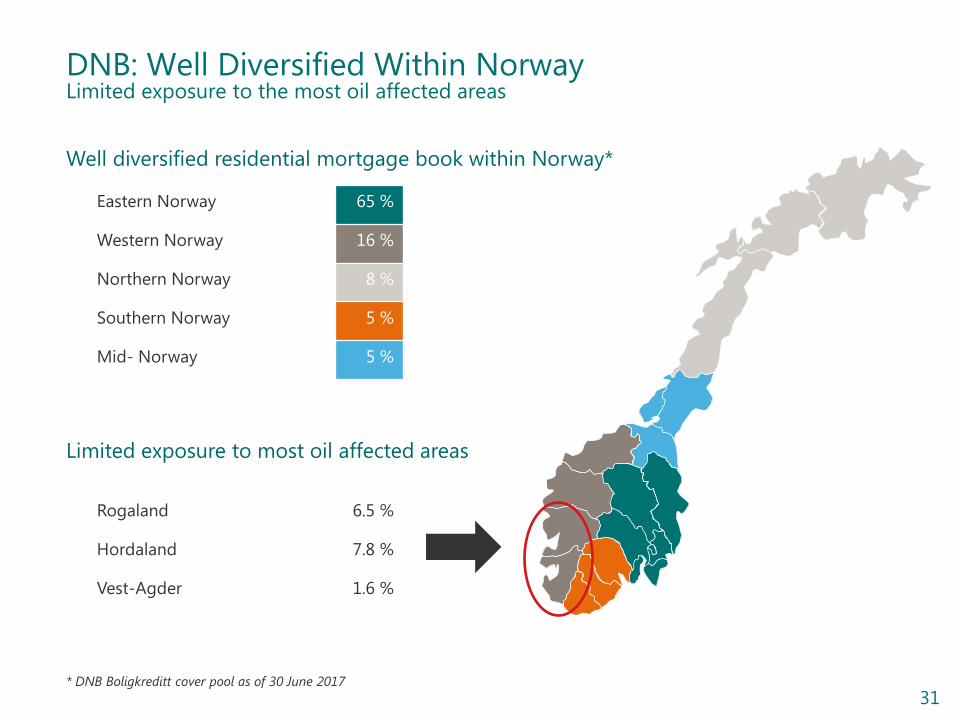
DNB: Well Diversified Within Norway Limited exposure to the most oil affected areas
Well diversified residential mortgage book within Norway*
* DNB Boligkreditt cover pool as of 30 June 2017
Eastern Norway 65 %
Western Norway 16 %
Northern Norway 8 %
Southern Norway 5 %
Mid- Norway 5 %
Limited exposure to most oil affected areas
Rogaland 6.5 %
Hordaland 7.8 %
Vest-Agder 1.6 %
32
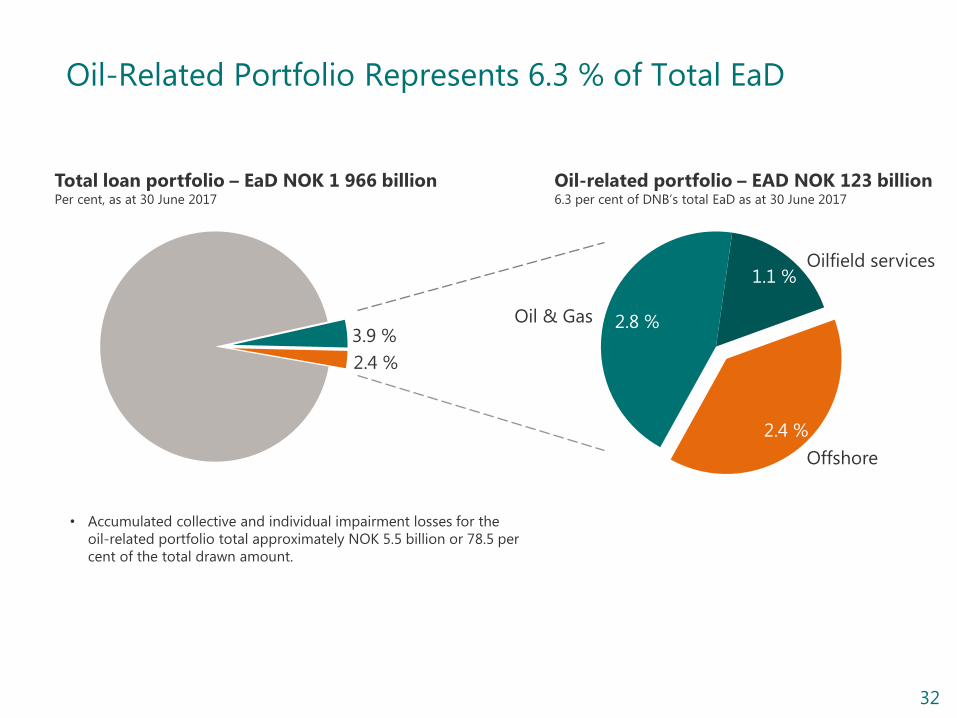
Oil-Related Portfolio Represents 6.3 % of Total EaD
6 %
8 %
7 %
11 %
Total loan portfolio – EaD NOK 1 966 billion Per cent, as at 30 June 2017
Oil-related portfolio – EAD NOK 123 billion 6.3 per cent of DNB’s total EaD as at 30 June 2017
3.9 %
2.4 %
2.8 %
1.1 %
2.4 %
• Accumulated collective and individual impairment losses for the
oil-related portfolio total approximately NOK 5.5 billion or 78.5 per
cent of the total drawn amount.
Oil & Gas
Oilfield services
Offshore

33
49
19
43
11
Low risk Medium risk High risk Net non-performingand net doubtful
commitments
2 5
32
9
Low risk Medium risk High risk Net non-performingand net doubtful
commitments
Oil-Related Portfolio Major Challenges Within the Offshore Portfolio
DNB’s oil-related portfolio split by sub-segment in terms of exposure (EaD) and by risk grade
EaD: Exposure at Default, PD: Probability of default. Figures from Fact book as at 31 March 2017.
Based on DNB's risk classification system, where 1 represents the lowest risk and 10 the highest risk.
Total Oil related segments EaD in NOK billion
Offshore EaD in NOK billion
Oil and Gas EaD in NOK billion
Oilfield Service EaD in NOK billion
37
9 7 1
Low risk Medium risk High risk Net non-performingand net doubtful
commitments
10 5 4
1
Low risk Medium risk High risk Net non-performingand net doubtful
commitments
30.09.2015 31.12.2015 31.03.2016 30.06.2016
30.09.2016 31.12.2016 31.03.2017 30.06.2017

34
Offshore Exposure is 2.4 % of DNB’s Total Loan Portfolio
Total loan portfolio – EaD NOK 1 966 billion Per cent, as at 30 June 2017
2.4 %
1.1 %
0.7 % 0.6 %
Offshore exposure – EaD NOK 48 billion Per cent of DNB’s portfolio, as at 30 June 2017
Offshore Supply Vessels (OSV)
Other offshore
Rig
35
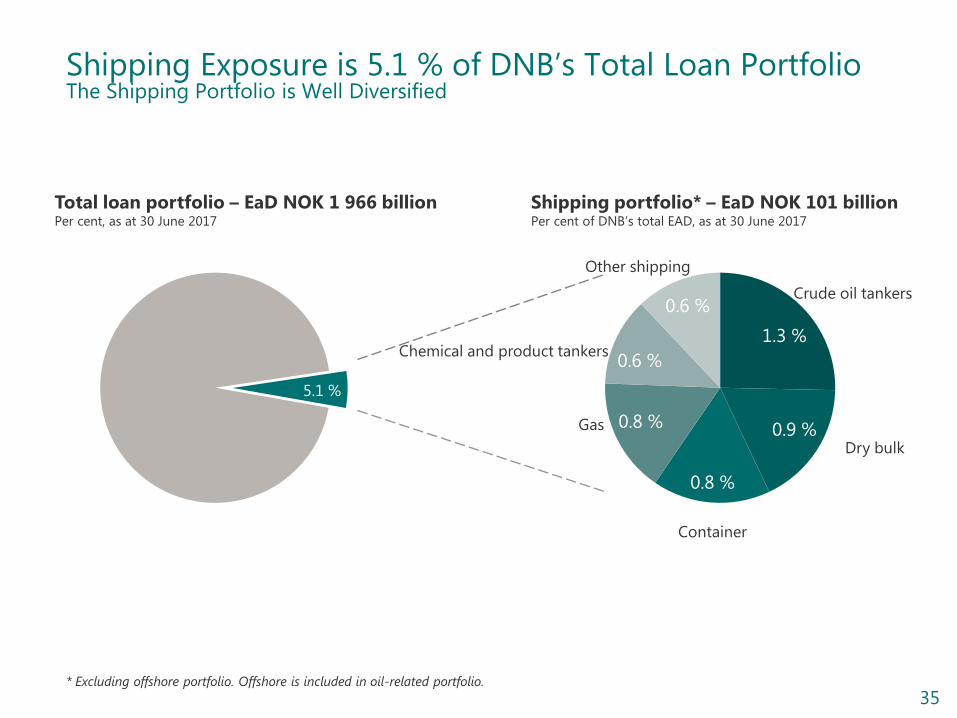
Shipping Exposure is 5.1 % of DNB’s Total Loan Portfolio The Shipping Portfolio is Well Diversified
6 %
8 %
7 %
11 %
Total loan portfolio – EaD NOK 1 966 billion Per cent, as at 30 June 2017
Shipping portfolio* – EaD NOK 101 billion Per cent of DNB’s total EAD, as at 30 June 2017
5.1 %
1.3 %
0.9 %
0.8 %
0.8 %
0.6 %
0.6 % Crude oil tankers
Dry bulk
Gas
Container
Other shipping
Chemical and product tankers
* Excluding offshore portfolio. Offshore is included in oil-related portfolio.

36
Risk Classification and Migration DNB’s Shipping Book - Excluding Offshore
Shipping* – EaD distribution by PD bracket NOK billion
29
67
16
5
Low risk Medium risk High risk Net non-performing and net doubtful
commitments
30.09.2015 31.12.2015 31.03.2016 30.06.2016 30.09.2016 31.12.2016 31.03.2017 30.06.2017
* Numbers for the Shipping Offshore and Logistics Division excluding offshore
portfolio. Offshore is included in oil-related portfolio.
37
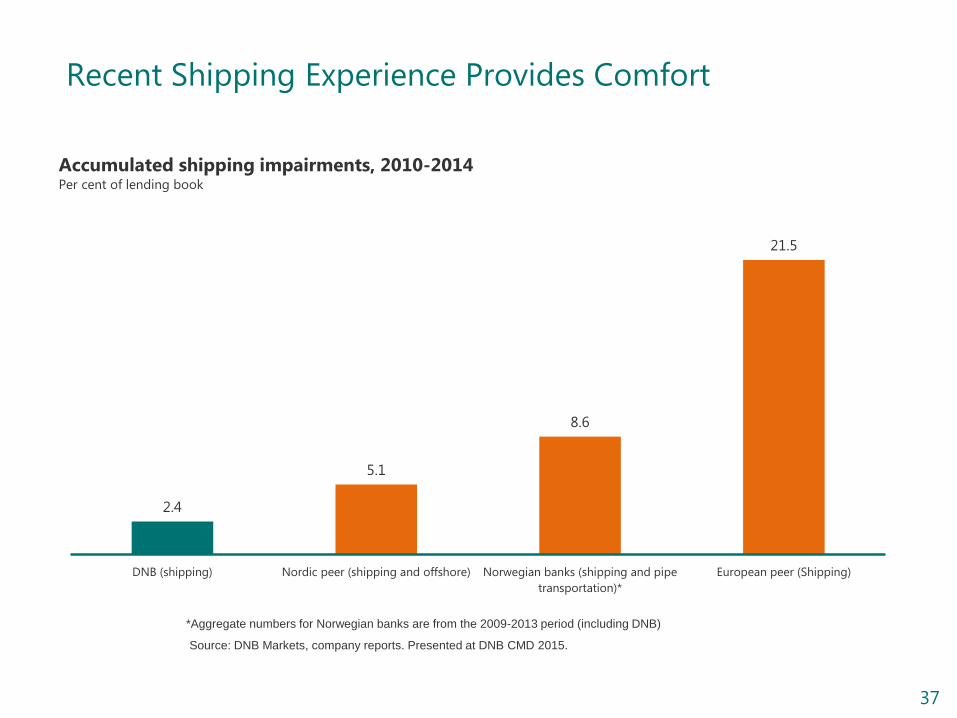
Recent Shipping Experience Provides Comfort
Accumulated shipping impairments, 2010-2014 Per cent of lending book
2.4
5.1
8.6
21.5
DNB (shipping) Nordic peer (shipping and offshore) Norwegian banks (shipping and pipe
transportation)*
European peer (Shipping)
*Aggregate numbers for Norwegian banks are from the 2009-2013 period (including DNB)
Source: DNB Markets, company reports. Presented at DNB CMD 2015.

38
Funding
39
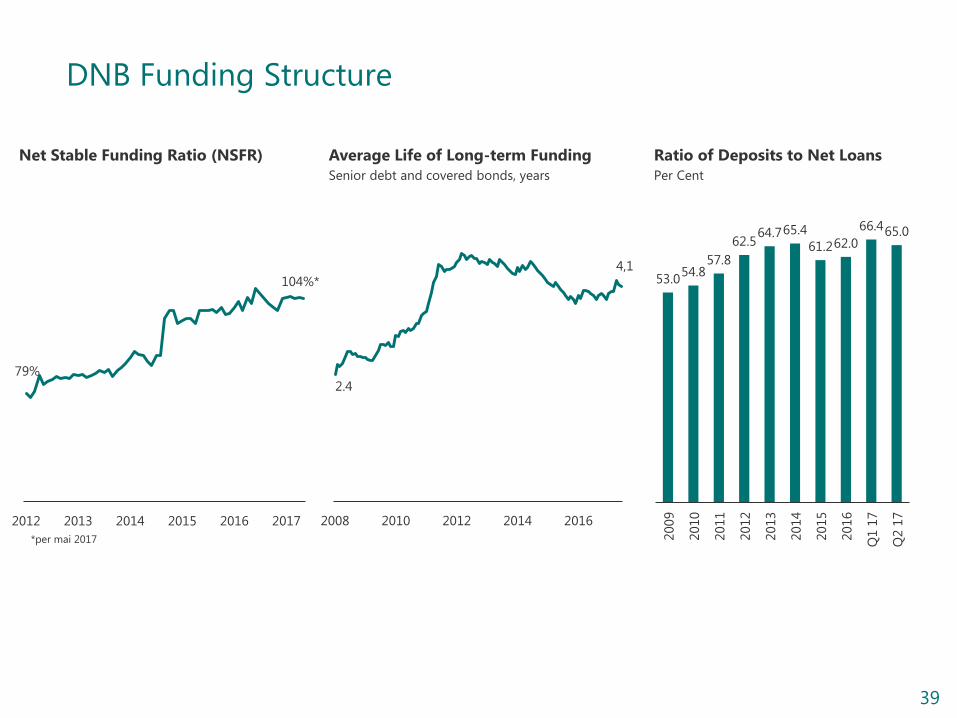
DNB Funding Structure
79%
104%*
2012 2013 2014 2015 2016 2017
Net Stable Funding Ratio (NSFR)
2.4
4,1
2008 2010 2012 2014 2016
Average Life of Long-term Funding
Senior debt and covered bonds, years
Ratio of Deposits to Net Loans
Per Cent
53.0 54.8
57.8
62.5 64.7 65.4
61.2 62.0
66.4 65.0
2009
2010
2011
2012
2013
2014
2015
2016
Q1 1
7
Q2 1
7
*per mai 2017
40
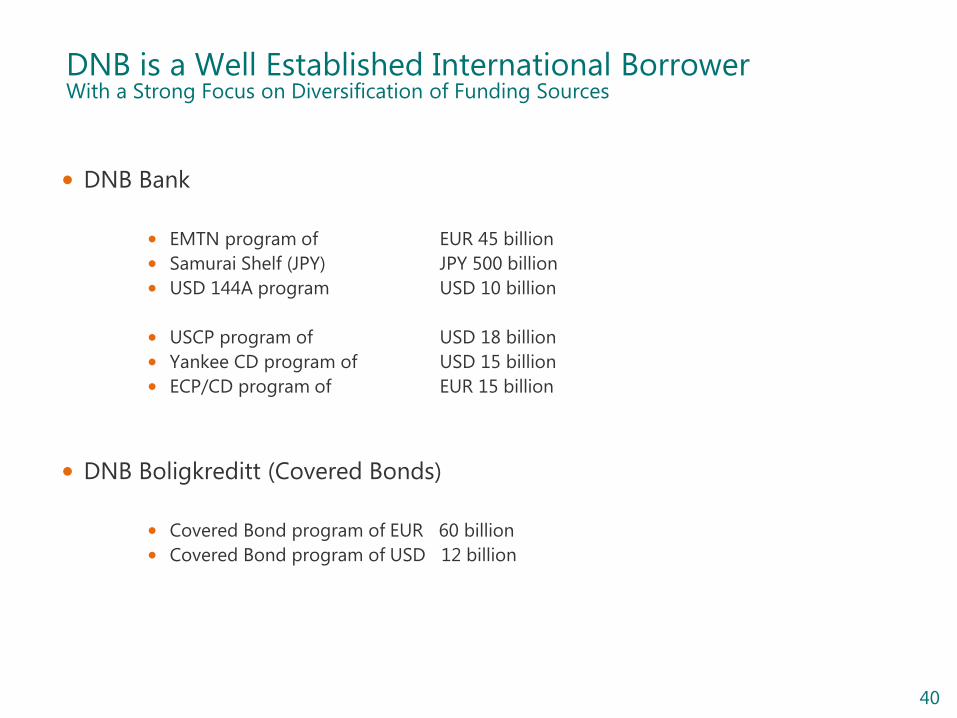
DNB is a Well Established International Borrower With a Strong Focus on Diversification of Funding Sources
• DNB Bank
• EMTN program of EUR 45 billion
• Samurai Shelf (JPY) JPY 500 billion
• USD 144A program USD 10 billion
• USCP program of USD 18 billion
• Yankee CD program of USD 15 billion
• ECP/CD program of EUR 15 billion
• DNB Boligkreditt (Covered Bonds)
• Covered Bond program of EUR 60 billion
• Covered Bond program of USD 12 billion
41
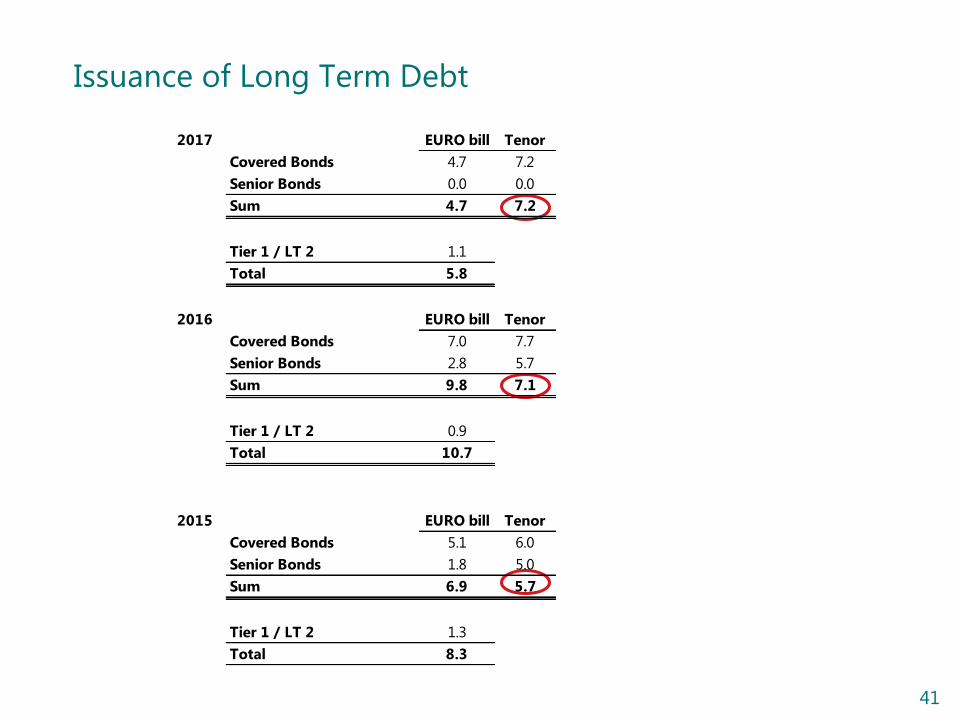
Issuance of Long Term Debt
2017 EURO bill Tenor
Covered Bonds 4.7 7.2
Senior Bonds 0.0 0.0
Sum 4.7 7.2
Tier 1 / LT 2 1.1
Total 5.8
2016 EURO bill Tenor
Covered Bonds 7.0 7.7
Senior Bonds 2.8 5.7
Sum 9.8 7.1
Tier 1 / LT 2 0.9
Total 10.7
2015 EURO bill Tenor
Covered Bonds 5.1 6.0
Senior Bonds 1.8 5.0
Sum 6.9 5.7
Tier 1 / LT 2 1.3
Total 8.3

42
A Well Established International Covered Bond Issuer
Volume
Tenor
Maturity
EUR 1,500 mn 7 years 2017 – Aug
EUR 1,500 mn 5 years 2018 – Jan
EUR 1,500 mn 5 years 2018 – Nov
EUR 1,500 mn 7 years 2019 – Jun
EUR 1,250 mn 5 years 2019 – Oct
EUR 1,250 mn 5 years 2020 – Oct
EUR 1,500 mn 5 years 2021 – Jan
EUR 1,500 mn 10 years 2021 – Jun
EUR 2,000 mn 5 years 2022 – Jan
EUR 2,000 mn 10 years 2022 – Mar
EUR 1,000 mn 10 years 2022 – Nov
EUR 1,500 mn 7 years 2023 – Apr
EUR 1,500 mn 10 years 2026 – Sep
EUR 1,000 mn (FRN) 5 years 2019 – Jan
EUR 1,000 mn (FRN) 7 years 2021 – Nov
USD 2,000 mn 5 years 2018 - Mar
USD 1,250 mn 5 years 2020 - May
USD 1,500 mn 5 years 2022 - Mar
GBP 500 mn (FRN) 5 years 2020 - Feb
43
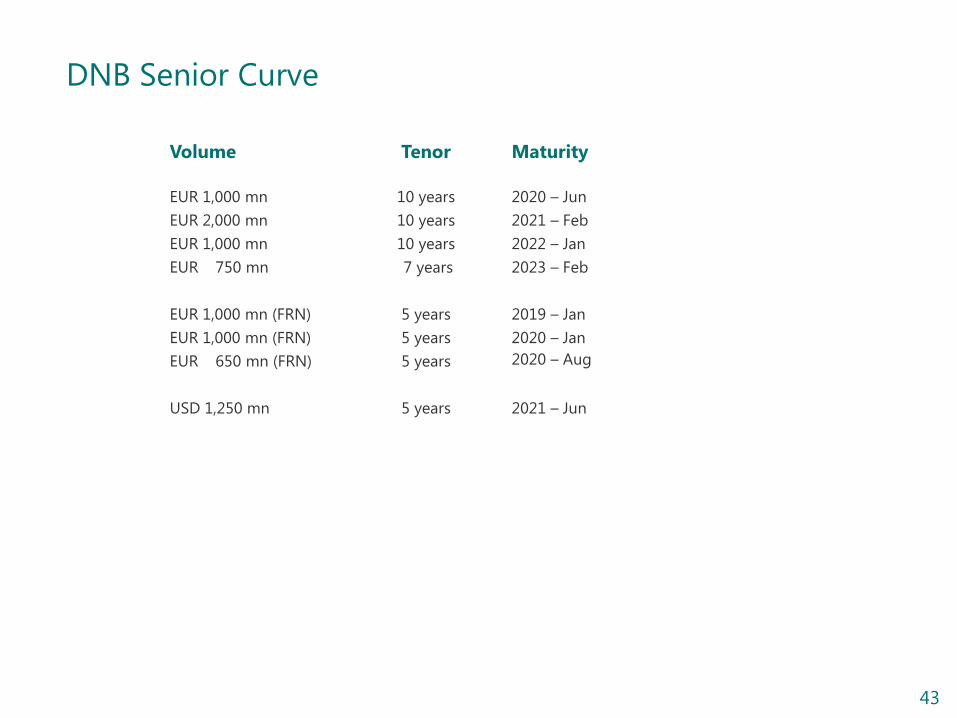
DNB Senior Curve
Volume
Tenor
Maturity
EUR 1,000 mn 10 years 2020 – Jun
EUR 2,000 mn 10 years 2021 – Feb
EUR 1,000 mn 10 years 2022 – Jan
EUR 750 mn 7 years 2023 – Feb
EUR 1,000 mn (FRN) 5 years 2019 – Jan
EUR 1,000 mn (FRN) 5 years 2020 – Jan
EUR 650 mn (FRN) 5 years 2020 – Aug
USD 1,250 mn 5 years 2021 – Jun
44
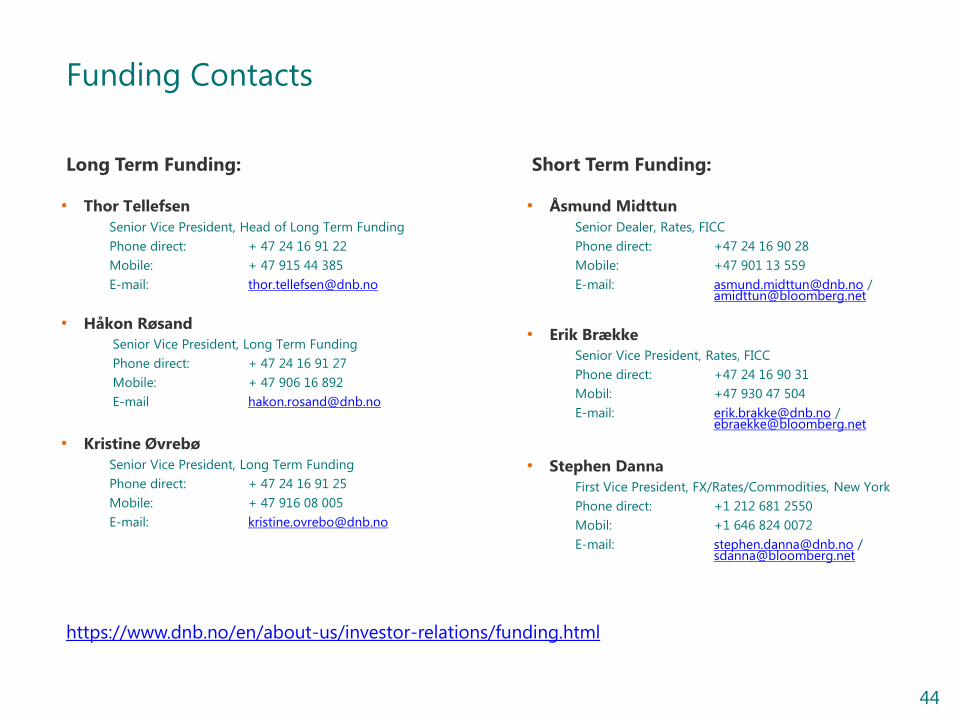
Funding Contacts
Long Term Funding: Short Term Funding:
• Thor Tellefsen
Senior Vice President, Head of Long Term Funding
Phone direct: + 47 24 16 91 22
Mobile: + 47 915 44 385
E-mail: [email protected]
• Håkon Røsand
Senior Vice President, Long Term Funding
Phone direct: + 47 24 16 91 27
Mobile: + 47 906 16 892
E-mail [email protected]
• Kristine Øvrebø
Senior Vice President, Long Term Funding
Phone direct: + 47 24 16 91 25
Mobile: + 47 916 08 005
E-mail: [email protected]
• Åsmund Midttun
Senior Dealer, Rates, FICC
Phone direct: +47 24 16 90 28
Mobile: +47 901 13 559
E-mail: [email protected] / [email protected]
• Erik Brække
Senior Vice President, Rates, FICC
Phone direct: +47 24 16 90 31
Mobil: +47 930 47 504
E-mail: [email protected] / [email protected]
• Stephen Danna
First Vice President, FX/Rates/Commodities, New York
Phone direct: +1 212 681 2550
Mobil: +1 646 824 0072
E-mail: [email protected] / [email protected]
https://www.dnb.no/en/about-us/investor-relations/funding.html

45
Appendix
Appendix A:
Cover Pool Portfolio Information and LCR
Eligibility
46
Future Updates On Cover Pool Developments
DNB has implemented the common Harmonised Transparency Template of
the European Covered Bond Council which is available on the DNB website.
Information about the cover pool of DNB Boligkreditt may be accessed via
DNB Boligkreditt’s web page:
https://www.dnb.no/en/about-us/investor-relations/funding.html
Contacts DNB Boligkreditt AS:
- Per Sagbakken, CEO: [email protected] +47 906 61 159
Portfolio information is updated when DNB quarterly results are released
47
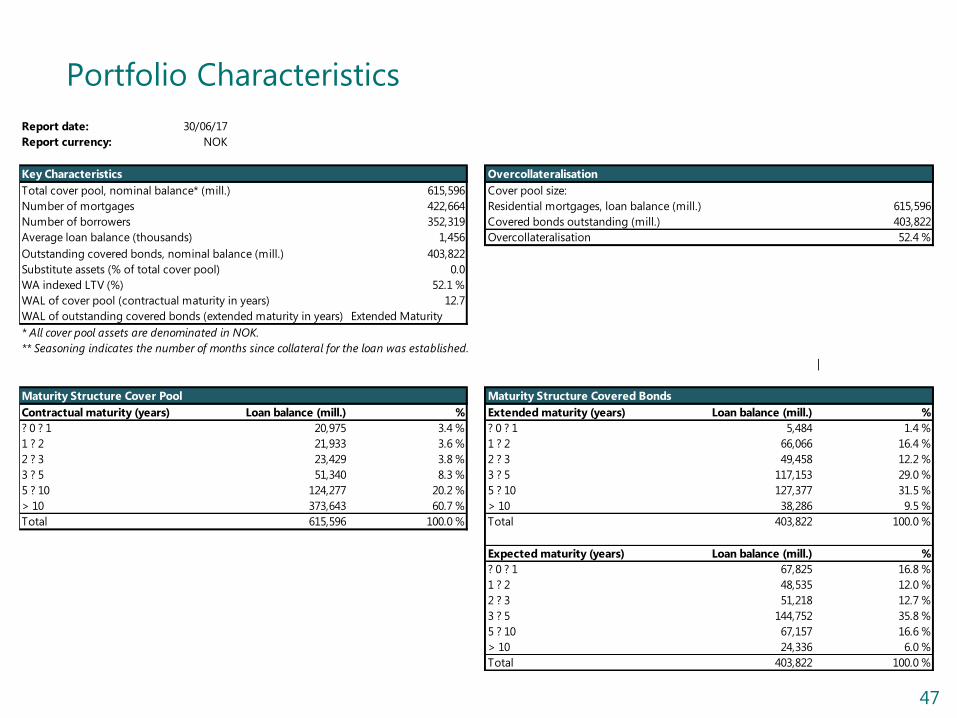
Portfolio Characteristics
Report date: 30/06/17
Report currency: NOK
Key Characteristics Overcollateralisation
Total cover pool, nominal balance* (mill.) 615,596 Cover pool size:
Number of mortgages 422,664 Residential mortgages, loan balance (mill.) 615,596
Number of borrowers 352,319 Covered bonds outstanding (mill.) 403,822
Average loan balance (thousands) 1,456 Overcollateralisation 52.4 %
Outstanding covered bonds, nominal balance (mill.) 403,822
Substitute assets (% of total cover pool) 0.0
WA indexed LTV (%) 52.1 %
WAL of cover pool (contractual maturity in years) 12.7
WAL of outstanding covered bonds (extended maturity in years) Extended Maturity
* All cover pool assets are denominated in NOK.
** Seasoning indicates the number of months since collateral for the loan was established.
|
Maturity Structure Cover Pool Maturity Structure Covered Bonds
Contractual maturity (years) Loan balance (mill.) % Extended maturity (years) Loan balance (mill.) %
? 0 ? 1 20,975 3.4 % ? 0 ? 1 5,484 1.4 %
1 ? 2 21,933 3.6 % 1 ? 2 66,066 16.4 %
2 ? 3 23,429 3.8 % 2 ? 3 49,458 12.2 %
3 ? 5 51,340 8.3 % 3 ? 5 117,153 29.0 %
5 ? 10 124,277 20.2 % 5 ? 10 127,377 31.5 %
> 10 373,643 60.7 % > 10 38,286 9.5 %
Total 615,596 100.0 % Total 403,822 100.0 %
Expected maturity (years) Loan balance (mill.) %
? 0 ? 1 67,825 16.8 %
1 ? 2 48,535 12.0 %
2 ? 3 51,218 12.7 %
3 ? 5 144,752 35.8 %
5 ? 10 67,157 16.6 %
> 10 24,336 6.0 %
Total 403,822 100.0 %

48
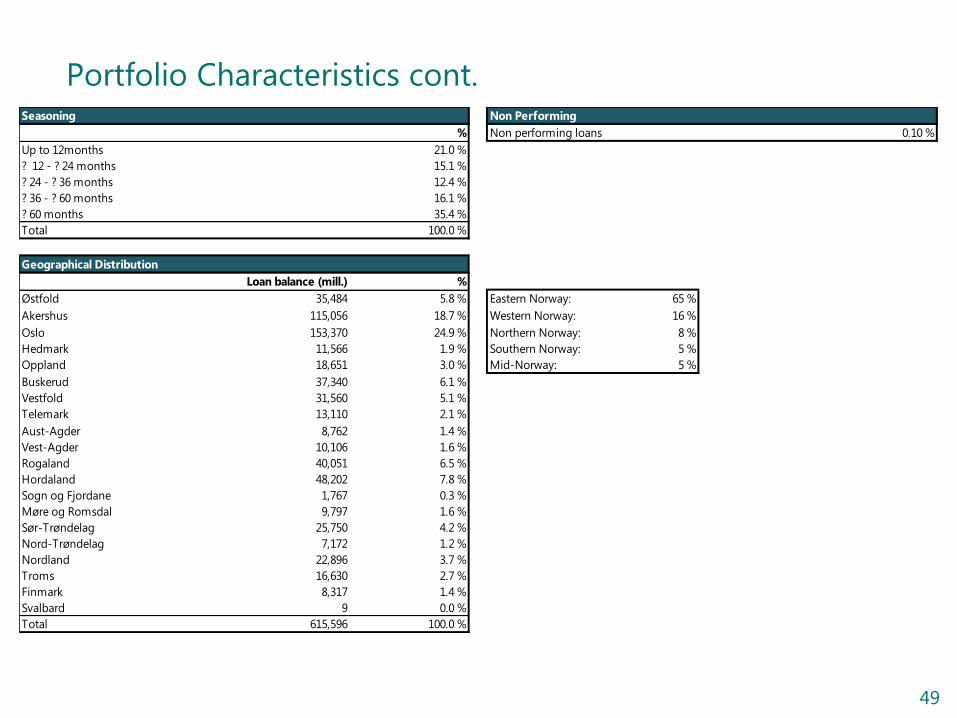
Portfolio Characteristics cont.
Loan Size Concentration Risk
Private individuals Loan balance (mill.) Number of loans %
? 1,000,000 81,234 187,772 10 largest exposures 0.2 %
> 1,000,000 ? 2,000,000 190,152 128,378 10 largest exposures excl. housing cooperatives 0.1 %
> 2,000,000 ? 3,000,000 154,235 63,297
> 3,000,000 ? 4,000,000 82,739 24,074 Property Types
> 4,000,000 ? 5,000,000 41,094 9,245 Loan balance (mill.) %
> 5,000,000 47,924 7,298 Residential 615,596 100.0 %
Total 597,377 420,064 Commercial 0 0.0 %
Other 0 0.0 %
Housing Cooperatives Loan balance (mill.) Number of loans Total 615,596 100.0 %
? 5,000,000 2,954 1,673
> 5,000,000 ? 10,000,000 3,076 428 o/w Housing Cooperatives / Multi-family assets 18,219 3.0 %
> 10,000,000 ? 20,000,000 4,393 310 o/w Forest & Agriculture 0 0.0 %
> 20,000,000 ? 50,000,000 4,943 155
> 50,000,000 ? 100,000,000 1,956 28 Occupancy Type
> 100,000,000 897 6 %
Total 18,219 2,600 Owner occupied 87.5%
Second homes / Holiday houses 0.4%
LTV buckets Buy to let / Non owner occupied houses 0.1%
Indexed LTV Loan balance (mill.) % Other 12.0%
? 0 ? 40 142,141 23.1 % Total 100.0%
40 ? 50 100,223 16.3 %
50 ? 60 143,644 23.3 % Repayment Type
60 ? 70 150,190 24.4 % %
70 ? 80 70,050 11.4 % Amortization 72.6 %
80 ? 90 6,051 1.0 % Interest only* 27.4 %
90 ? 100 1,806 0.3 % Total 100.0 %
>100 1,493 0.2 % *No principal payments for a limited period of time.
Total 615,596 100.0 %
49
Portfolio Characteristics cont. Seasoning Non Performing
% Non performing loans 0.10 %
Up to 12months 21.0 %
? 12 - ? 24 months 15.1 %
? 24 - ? 36 months 12.4 %
? 36 - ? 60 months 16.1 %
? 60 months 35.4 %
Total 100.0 %
Geographical Distribution
Loan balance (mill.) %
Østfold 35,484 5.8 % Eastern Norway: 65 %
Akershus 115,056 18.7 % Western Norway: 16 %
Oslo 153,370 24.9 % Northern Norway: 8 %
Hedmark 11,566 1.9 % Southern Norway: 5 %
Oppland 18,651 3.0 % Mid-Norway: 5 %
Buskerud 37,340 6.1 %
Vestfold 31,560 5.1 %
Telemark 13,110 2.1 %
Aust-Agder 8,762 1.4 %
Vest-Agder 10,106 1.6 %
Rogaland 40,051 6.5 %
Hordaland 48,202 7.8 %
Sogn og Fjordane 1,767 0.3 %
Møre og Romsdal 9,797 1.6 %
Sør-Trøndelag 25,750 4.2 %
Nord-Trøndelag 7,172 1.2 %
Nordland 22,896 3.7 %
Troms 16,630 2.7 %
Finmark 8,317 1.4 %
Svalbard 9 0.0 %
Total 615,596 100.0 %
50
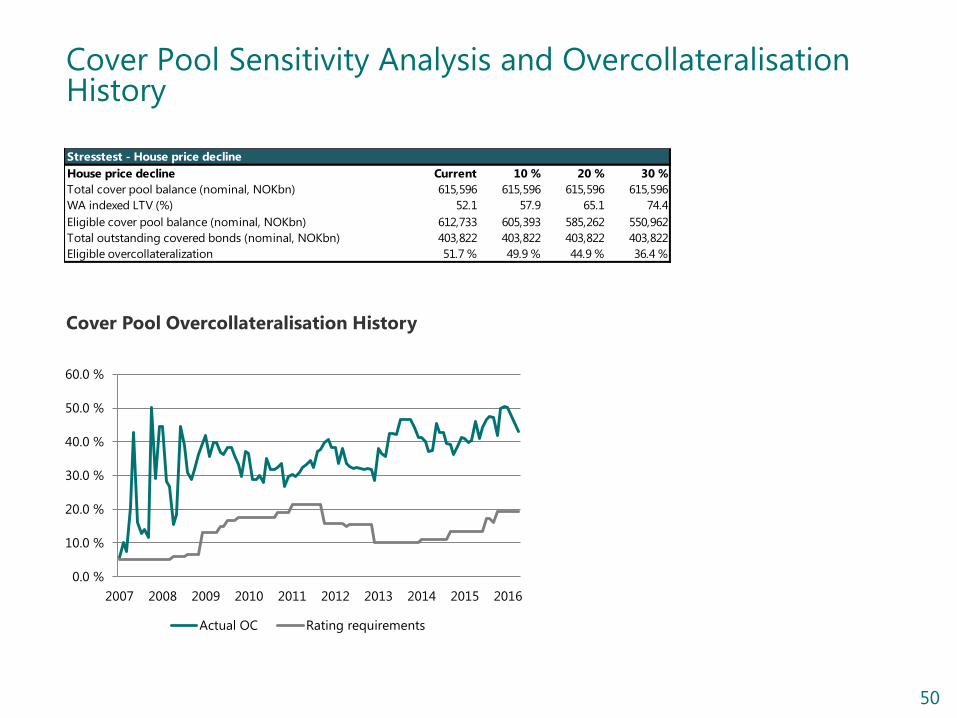
Cover Pool Sensitivity Analysis and Overcollateralisation History
Cover Pool Overcollateralisation History
0.0 %
10.0 %
20.0 %
30.0 %
40.0 %
50.0 %
60.0 %
2007 2008 2009 2010 2011 2012 2013 2014 2015 2016
Actual OC Rating requirements
Stresstest - House price decline
House price decline Current 10 % 20 % 30 %
Total cover pool balance (nominal, NOKbn) 615,596 615,596 615,596 615,596
WA indexed LTV (%) 52.1 57.9 65.1 74.4
Eligible cover pool balance (nominal, NOKbn) 612,733 605,393 585,262 550,962
Total outstanding covered bonds (nominal, NOKbn) 403,822 403,822 403,822 403,822
Eligible overcollateralization 51.7 % 49.9 % 44.9 % 36.4 %
51
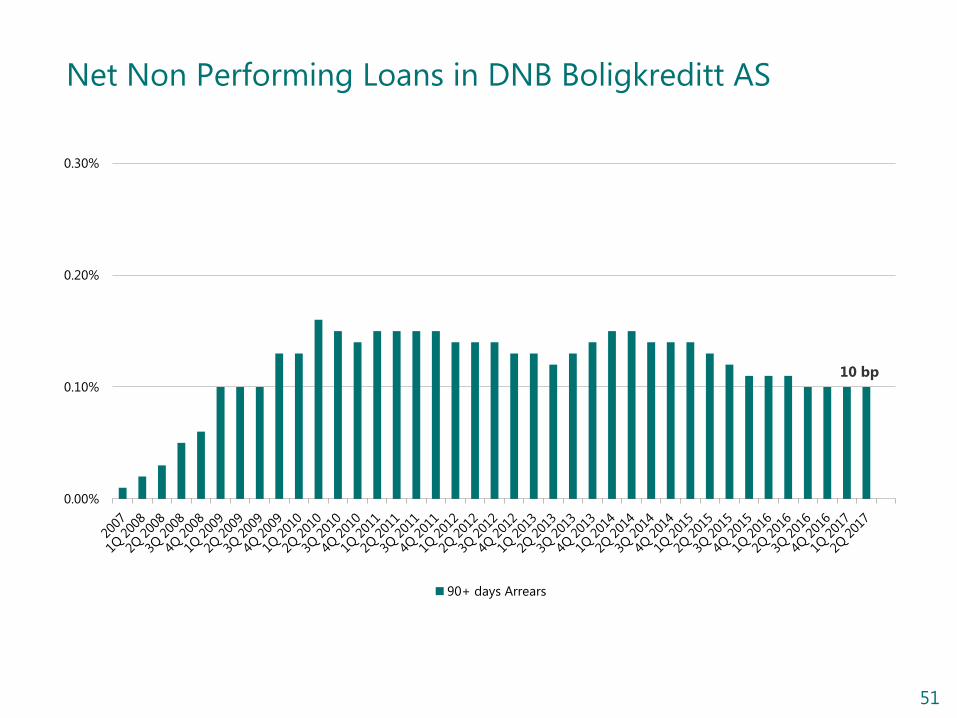
Net Non Performing Loans in DNB Boligkreditt AS
0.00%
0.10%
0.20%
0.30%
90+ days Arrears
10 bp
52
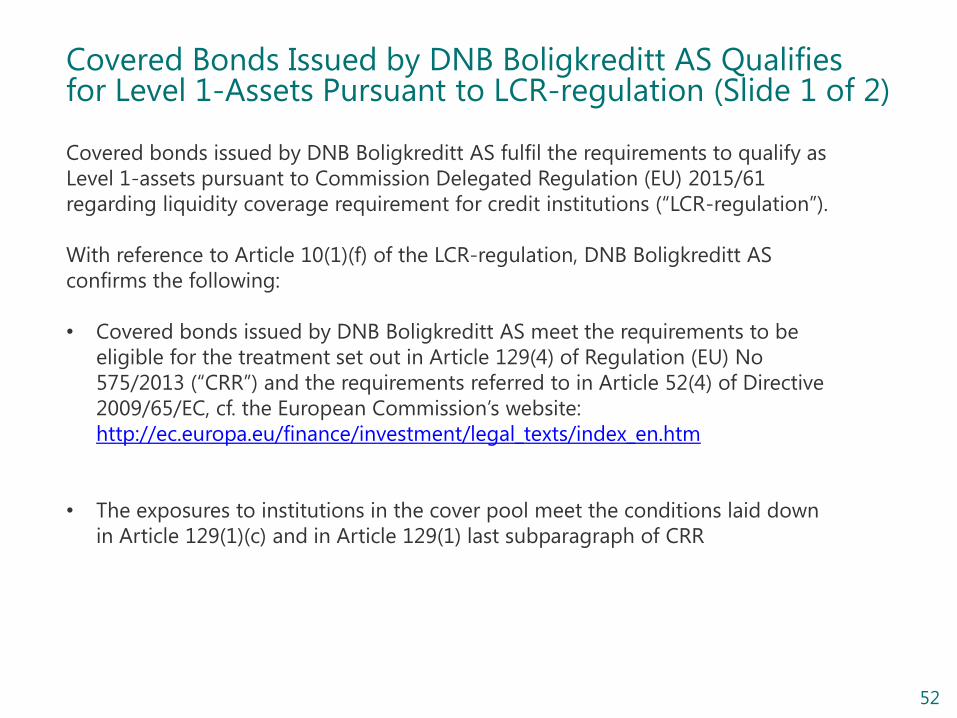
Covered Bonds Issued by DNB Boligkreditt AS Qualifies for Level 1-Assets Pursuant to LCR-regulation (Slide 1 of 2)
Covered bonds issued by DNB Boligkreditt AS fulfil the requirements to qualify as
Level 1-assets pursuant to Commission Delegated Regulation (EU) 2015/61
regarding liquidity coverage requirement for credit institutions (“LCR-regulation”).
With reference to Article 10(1)(f) of the LCR-regulation, DNB Boligkreditt AS
confirms the following:
• Covered bonds issued by DNB Boligkreditt AS meet the requirements to be
eligible for the treatment set out in Article 129(4) of Regulation (EU) No
575/2013 (“CRR”) and the requirements referred to in Article 52(4) of Directive
2009/65/EC, cf. the European Commission’s website:
http://ec.europa.eu/finance/investment/legal_texts/index_en.htm
• The exposures to institutions in the cover pool meet the conditions laid down
in Article 129(1)(c) and in Article 129(1) last subparagraph of CRR
53
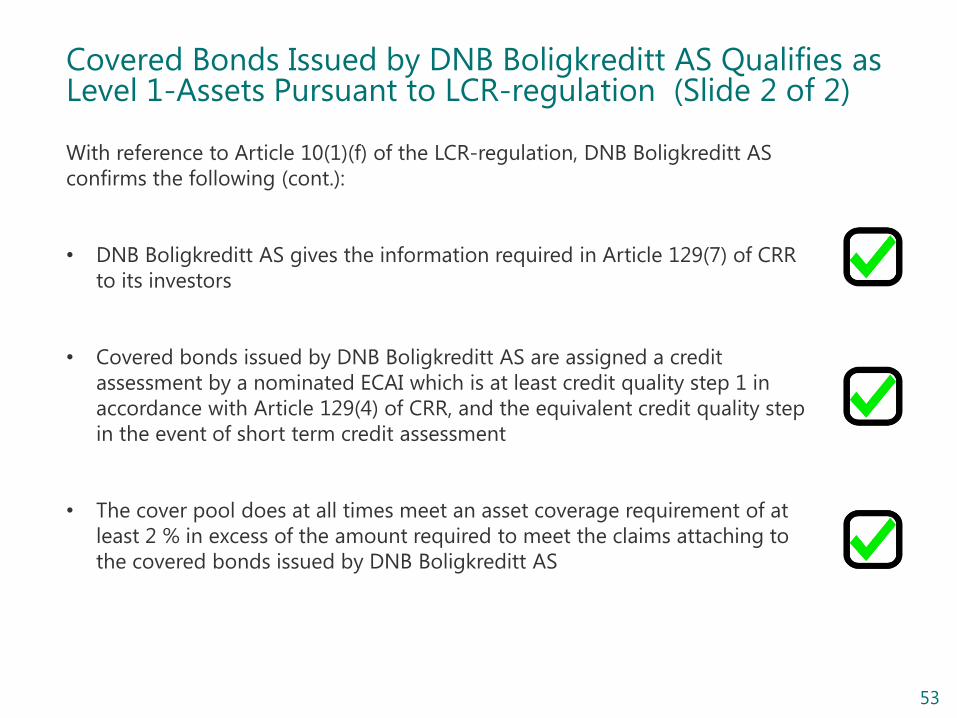
Covered Bonds Issued by DNB Boligkreditt AS Qualifies as Level 1-Assets Pursuant to LCR-regulation (Slide 2 of 2)
With reference to Article 10(1)(f) of the LCR-regulation, DNB Boligkreditt AS
confirms the following (cont.):
• DNB Boligkreditt AS gives the information required in Article 129(7) of CRR
to its investors
• Covered bonds issued by DNB Boligkreditt AS are assigned a credit
assessment by a nominated ECAI which is at least credit quality step 1 in
accordance with Article 129(4) of CRR, and the equivalent credit quality step
in the event of short term credit assessment
• The cover pool does at all times meet an asset coverage requirement of at
least 2 % in excess of the amount required to meet the claims attaching to
the covered bonds issued by DNB Boligkreditt AS
54
ECB Eligibility and CRD-Compliance of Covered Bonds Issued by DNB Boligkreditt AS
• All covered bonds issued by DNB Boligkreditt AS fulfil the eligibility criteria for
marketable assets set by the Eurosystem and are thus eligible for Eurosystem monetary
policy operations.
• The Eurosystem set additional criteria for own use of eligible instruments in the
Eurosystem monetary policy operations. In the case of covered bonds, the instruments
must be issued in accordance with the criteria set out in Part 1, points 68 to 70 of Annex
VI to Directive 2006/48/EC. The covered bonds issued by DNB Boligkreditt AS fulfil these
criteria, but the Eurosystem has not checked the fulfilment of these conditions for
Norway, since Norway is not part of the EU. Therefore, covered bonds issued by DNB
Boligkreditt AS are marked with a "N/A" what regards ‘own-use covered bonds’ in ECB's
eligible asset database.
• DNB Boligkreditt AS confirms that the covered bonds it issues are compliant with
the CRD-requirement set forth in the Eurosystem guidelines. In addition, DNB
Boligkreditt AS confirms that it gives the information required in Regulation (EU) No
575/2013 ("CRR") article 129 (7) to its investors, so that the covered bonds issued by DNB
Boligkreditt AS are eligible for the preferential treatment set out in CRR article 129 (4).

55
Appendix
Appendix B:
Digitalization
56
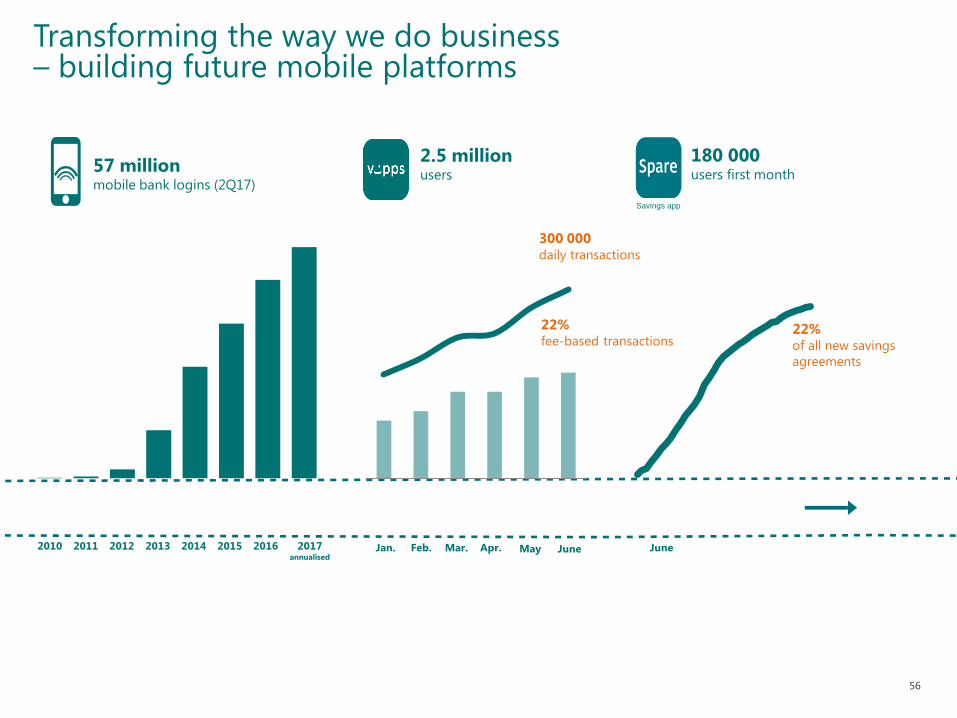
22% of all new savings
agreements
300 000 daily transactions
2.5 million users
June May June Jan. Feb. Mar. Apr.
22% fee-based transactions
180 000 users first month
Savings app
57 million mobile bank logins (2Q17)
2010 2015 2016 2017 annualised
2011 2012 2013
Transforming the way we do business – building future mobile platforms
2014

57
Transforming the way we do business – smarter use of capital
Investment in capital-light products Defined contribution: #1 market position
Capital reallocation Loans reduced by NOK 9.5 billion in
cyclical industries in 2Q17
IBD Ranked #1 among debt capital markets, investment
grade and high-yield issuers in Norway 1)
Ranked #2 in Nordic countries research 2)
1) Source: Prospera customer satisfaction survey 2017
2) Source: Extel 2017 research
58
Appendix
Appendix C:
The Norwegian Mortgage Market
59
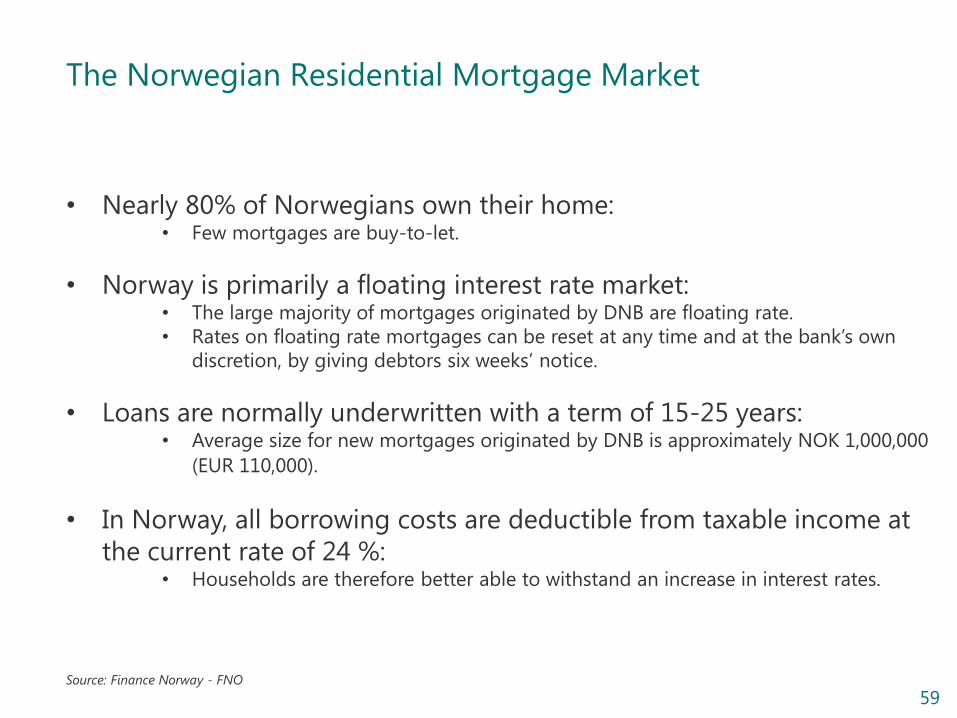
The Norwegian Residential Mortgage Market
• Nearly 80% of Norwegians own their home: • Few mortgages are buy-to-let.
• Norway is primarily a floating interest rate market: • The large majority of mortgages originated by DNB are floating rate.
• Rates on floating rate mortgages can be reset at any time and at the bank’s own
discretion, by giving debtors six weeks’ notice.
• Loans are normally underwritten with a term of 15-25 years: • Average size for new mortgages originated by DNB is approximately NOK 1,000,000
(EUR 110,000).
• In Norway, all borrowing costs are deductible from taxable income at
the current rate of 24 %: • Households are therefore better able to withstand an increase in interest rates.
Source: Finance Norway - FNO
60
Appendix
Appendix D:
Capital and Tier 1
61
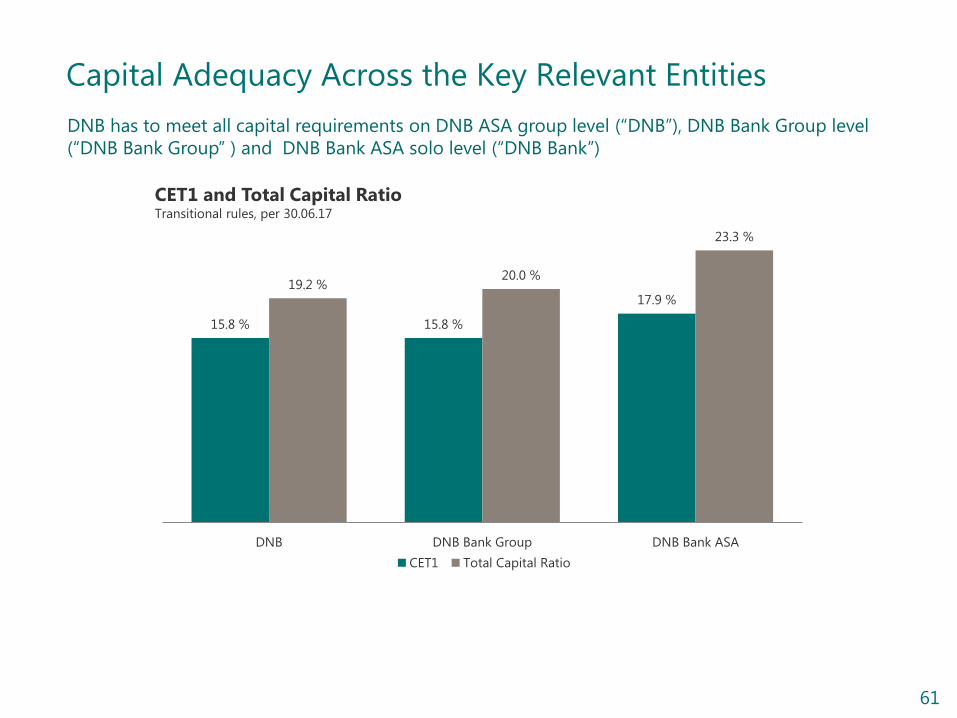
Capital Adequacy Across the Key Relevant Entities
DNB has to meet all capital requirements on DNB ASA group level (“DNB”), DNB Bank Group level
(“DNB Bank Group” ) and DNB Bank ASA solo level (“DNB Bank”)
15.8 % 15.8 %
17.9 % 19.2 %
20.0 %
23.3 %
DNB DNB Bank Group DNB Bank ASA
CET1 Total Capital Ratio
CET1 and Total Capital Ratio Transitional rules, per 30.06.17
62
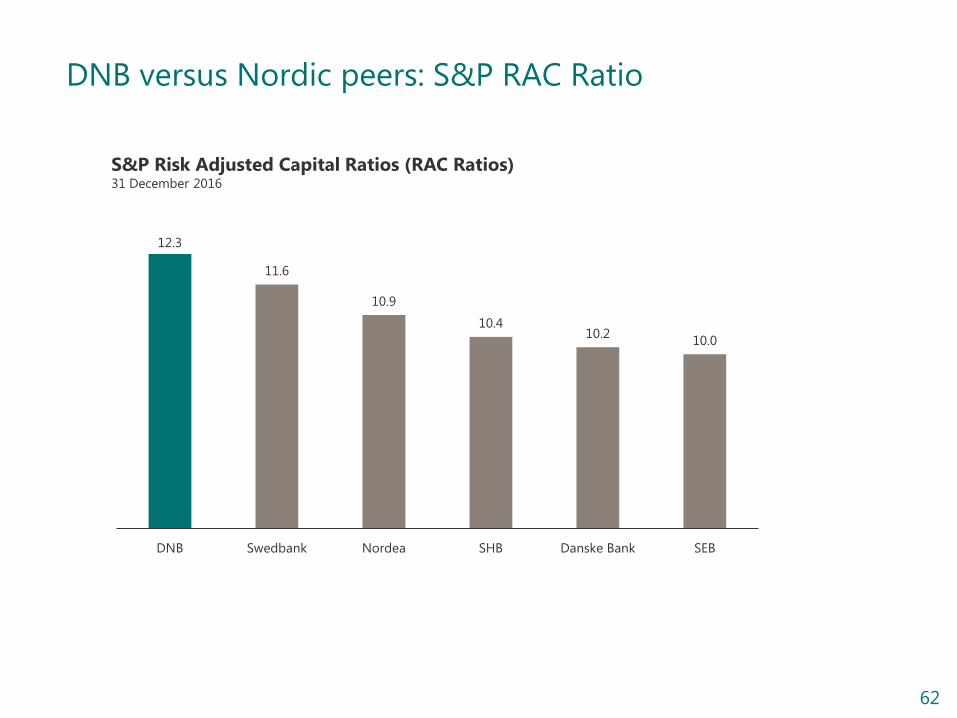
DNB versus Nordic peers: S&P RAC Ratio
12.3
11.6
10.9
10.4 10.2
10.0
DNB Swedbank Nordea SHB Danske Bank SEB
S&P Risk Adjusted Capital Ratios (RAC Ratios) 31 December 2016
63
Overall Capital Requirements under SREP
• Pillar 1 capital requirements in Norway consist of minimum requirements and
combined buffer requirements
• As a result of the SREP, the supervisors may decide on additional capital add-on (pillar
2), which together with the pillar 1 requirements form the Overall capital
requirement
• If there is a breach of the combined buffer requirements under Pillar 1, there will be
automatic restrictions on dividends etc. (ref. CRD IV article 141)
• However a breach of the Overall capital requirement under SREP will not cause
automatic restrictions:
• The Bank will have to present a plan to the NFSA how to restore the capital ratios
• If the plan is not sufficient, the NFSA will consider other measures.
• The measures will depend on the reasons behind the breach
64
Pillar 2 not Included in the MDA Trigger Level in Norway
MDA restrictions will only apply if there is a breach of the
Pillar 1 requirements
(Minimum capital requirements + Combined buffer requirements)
Pillar 2 requirements in Norway do not influence the MDA
trigger level
• Stated in a letter from the Ministry of Finance dated 15 January 2016
• Confirmed by the NFSA in a response letter dated 15 February 2016, and stated in a
circular from the NFSA dated 27 June 2016
65
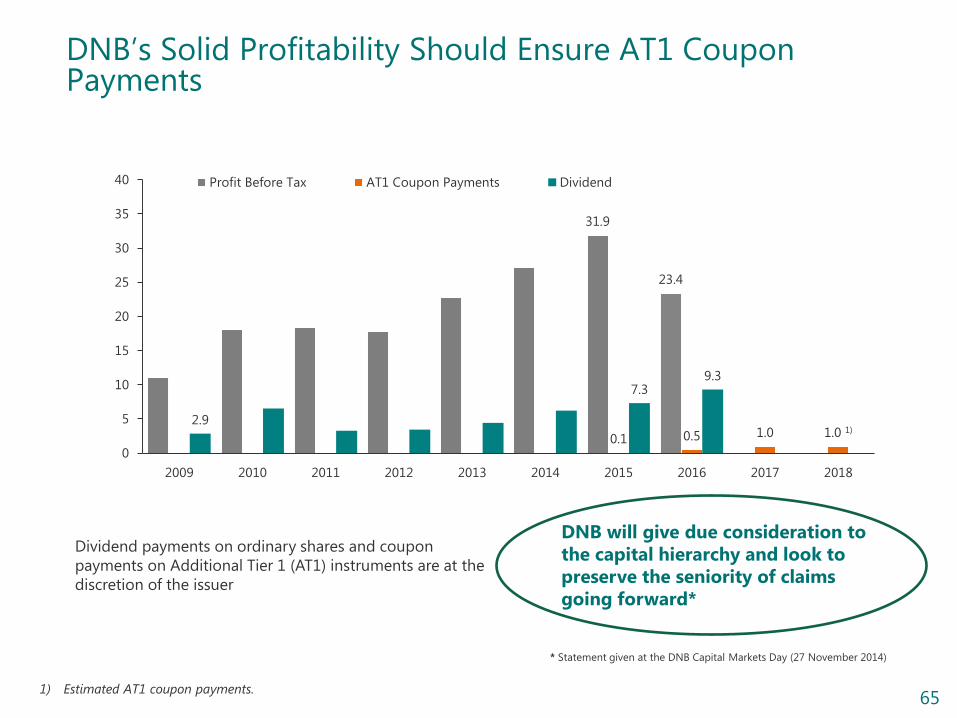
DNB’s Solid Profitability Should Ensure AT1 Coupon Payments
Dividend payments on ordinary shares and coupon
payments on Additional Tier 1 (AT1) instruments are at the
discretion of the issuer
* Statement given at the DNB Capital Markets Day (27 November 2014)
31.9
23.4
0.1 0.5 1.0 1.0 1) 2.9
7.3 9.3
0
5
10
15
20
25
30
35
40
2009 2010 2011 2012 2013 2014 2015 2016 2017 2018
Profit Before Tax AT1 Coupon Payments Dividend
DNB will give due consideration to
the capital hierarchy and look to
preserve the seniority of claims
going forward*
1) Estimated AT1 coupon payments.
66
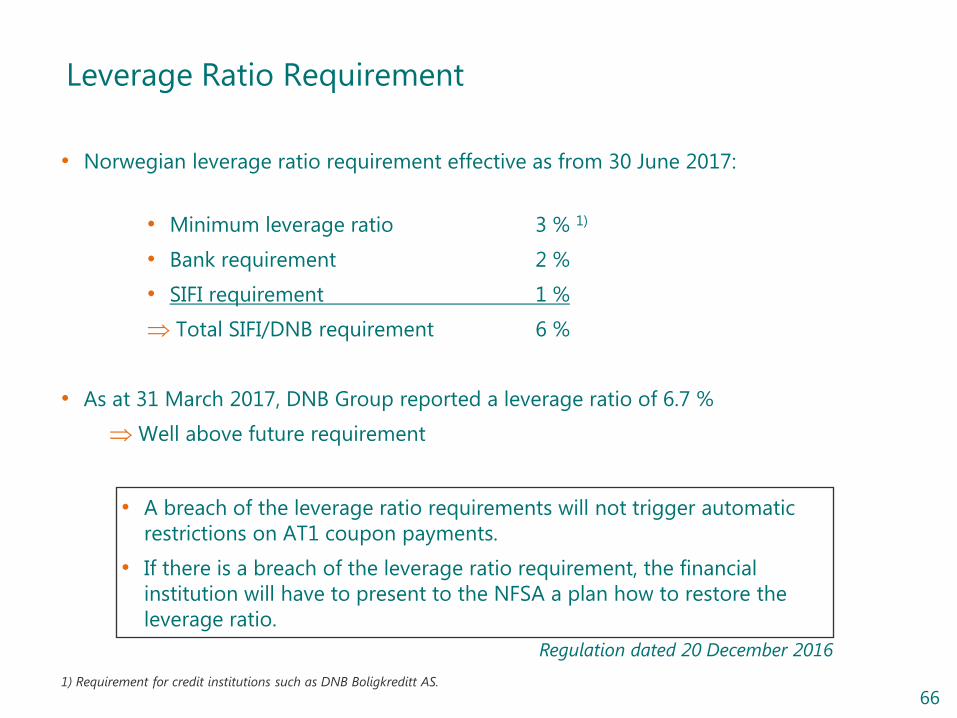
Leverage Ratio Requirement
• Norwegian leverage ratio requirement effective as from 30 June 2017:
• Minimum leverage ratio 3 % 1)
• Bank requirement 2 %
• SIFI requirement 1 %
Total SIFI/DNB requirement 6 %
• As at 31 March 2017, DNB Group reported a leverage ratio of 6.7 %
Well above future requirement
• A breach of the leverage ratio requirements will not trigger automatic
restrictions on AT1 coupon payments.
• If there is a breach of the leverage ratio requirement, the financial
institution will have to present to the NFSA a plan how to restore the
leverage ratio.
Regulation dated 20 December 2016
1) Requirement for credit institutions such as DNB Boligkreditt AS.
67
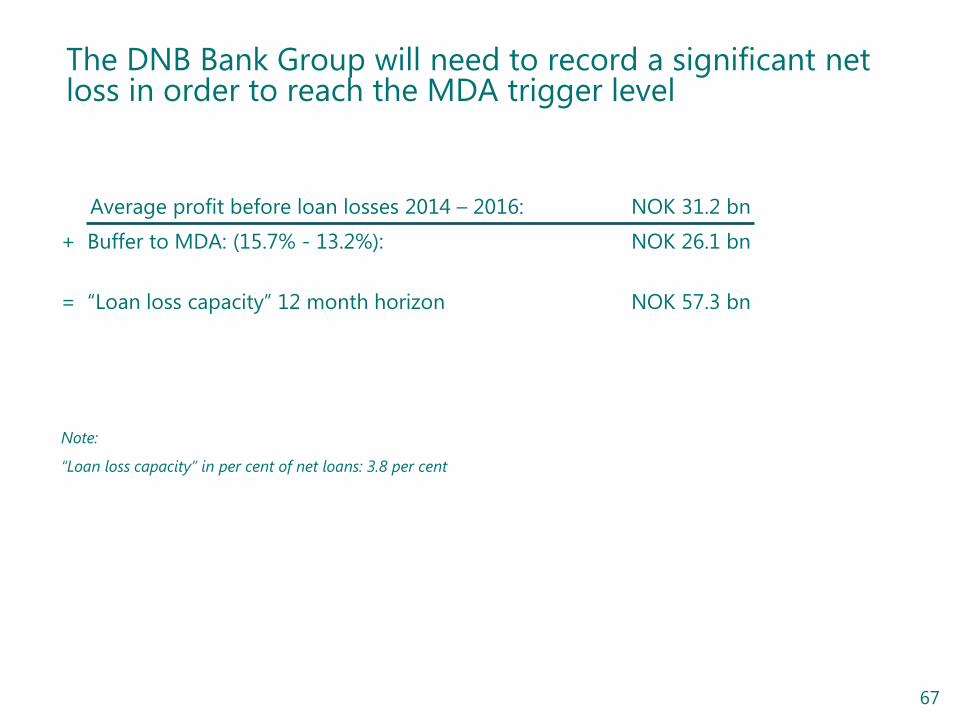
The DNB Bank Group will need to record a significant net loss in order to reach the MDA trigger level
Average profit before loan losses 2014 – 2016: NOK 31.2 bn
+ Buffer to MDA: (15.7% - 13.2%): NOK 26.1 bn
= “Loan loss capacity” 12 month horizon NOK 57.3 bn
Note:
“Loan loss capacity” in per cent of net loans: 3.8 per cent
68
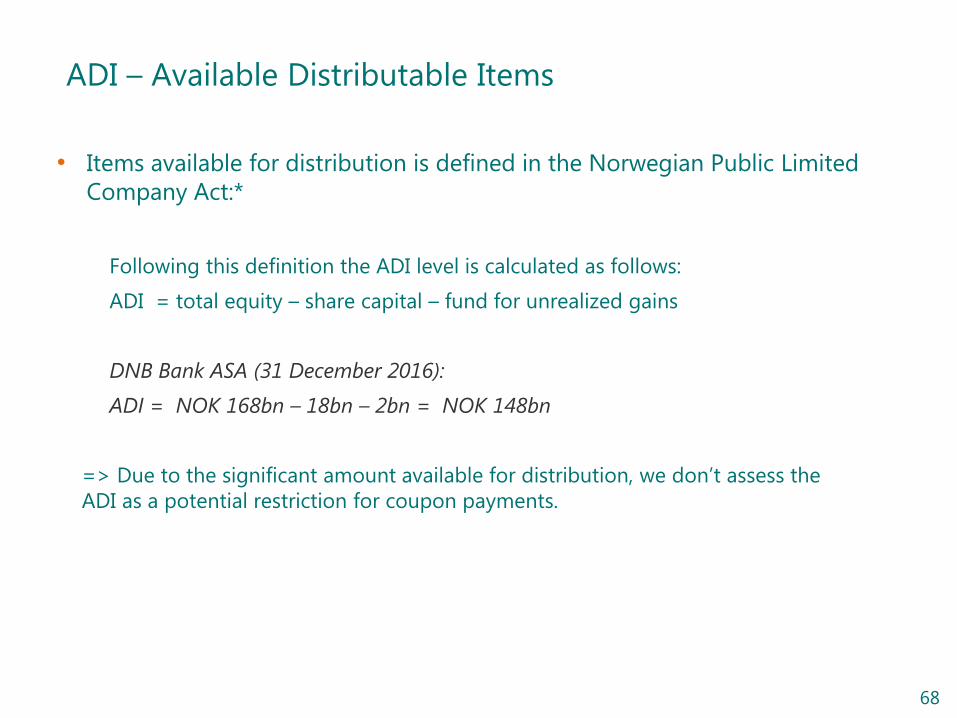
ADI – Available Distributable Items
• Items available for distribution is defined in the Norwegian Public Limited
Company Act:*
Following this definition the ADI level is calculated as follows:
ADI = total equity – share capital – fund for unrealized gains
DNB Bank ASA (31 December 2016):
ADI = NOK 168bn – 18bn – 2bn = NOK 148bn
=> Due to the significant amount available for distribution, we don’t assess the
ADI as a potential restriction for coupon payments.
69
Appendix
Appendix E:
Additional Slides
- Financial performance and Other information
70
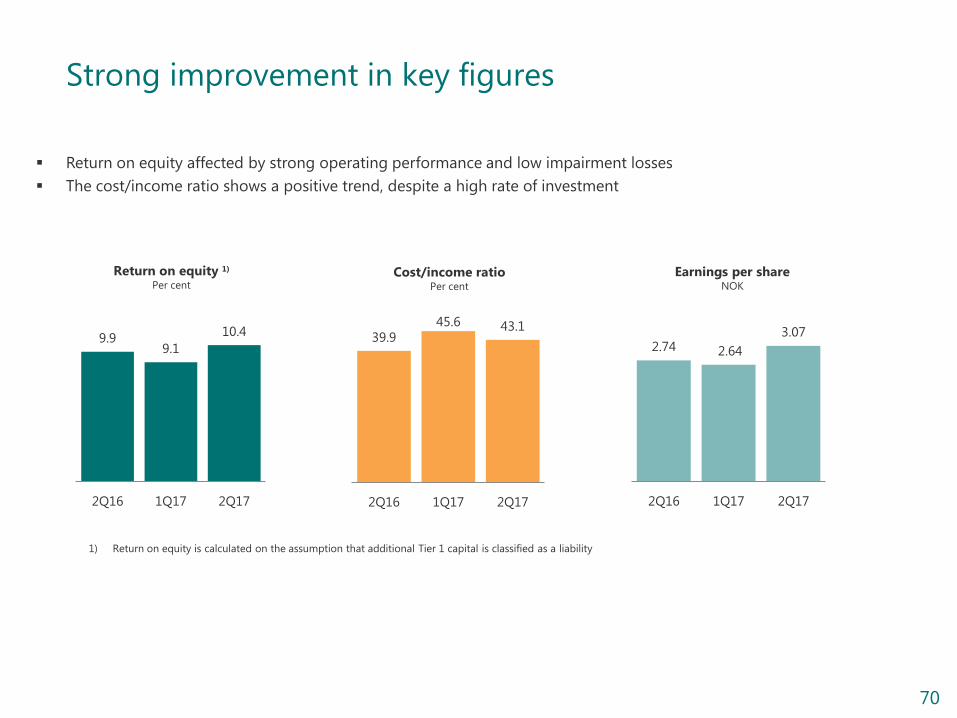
Strong improvement in key figures
39.9
45.6 43.1
2Q16 1Q17 2Q17
Cost/income ratio Per cent
Return on equity 1)
Per cent
9.9 9.1
10.4
2Q16 1Q17 2Q17
1) Return on equity is calculated on the assumption that additional Tier 1 capital is classified as a liability
2.74 2.64
3.07
2Q16 1Q17 2Q17
Earnings per share NOK
Return on equity affected by strong operating performance and low impairment losses
The cost/income ratio shows a positive trend, despite a high rate of investment
71
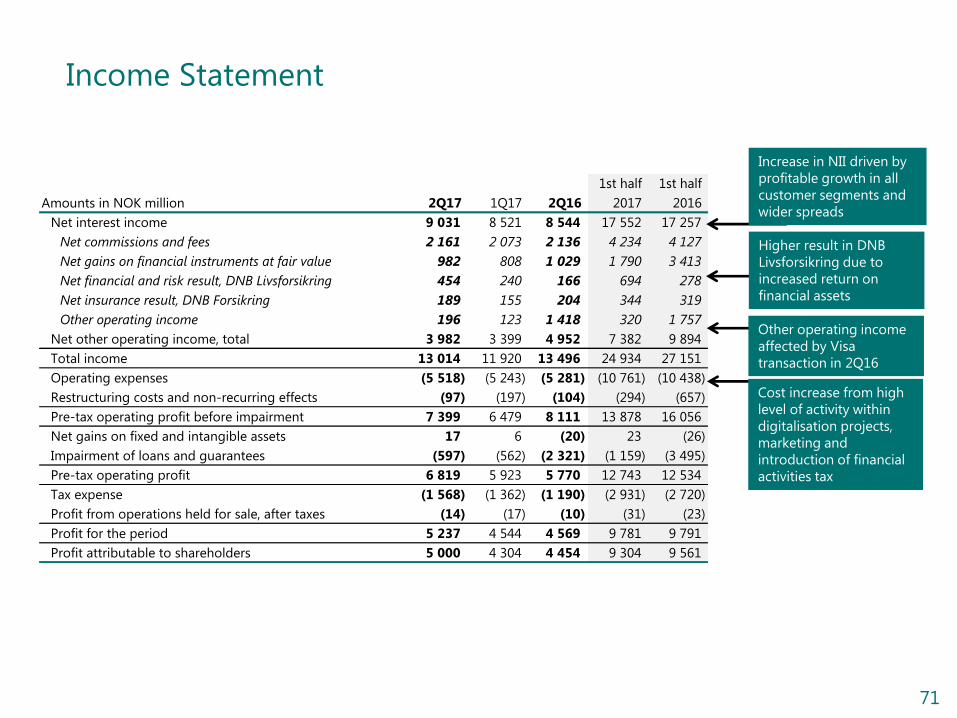
Income Statement
1st half 1st half
Amounts in NOK million 2Q17 1Q17 2Q16 2017 2016
Net interest income 9 031 8 521 8 544 17 552 17 257
Net commissions and fees 2 161 2 073 2 136 4 234 4 127
Net gains on financial instruments at fair value 982 808 1 029 1 790 3 413
Net financial and risk result, DNB Livsforsikring 454 240 166 694 278
Net insurance result, DNB Forsikring 189 155 204 344 319
Other operating income 196 123 1 418 320 1 757
Net other operating income, total 3 982 3 399 4 952 7 382 9 894
Total income 13 014 11 920 13 496 24 934 27 151
Operating expenses (5 518) (5 243) (5 281) (10 761) (10 438)
Restructuring costs and non-recurring effects (97) (197) (104) (294) (657)
Pre-tax operating profit before impairment 7 399 6 479 8 111 13 878 16 056
Net gains on fixed and intangible assets 17 6 (20) 23 (26)
Impairment of loans and guarantees (597) (562) (2 321) (1 159) (3 495)
Pre-tax operating profit 6 819 5 923 5 770 12 743 12 534
Tax expense (1 568) (1 362) (1 190) (2 931) (2 720)
Profit from operations held for sale, after taxes (14) (17) (10) (31) (23)
Profit for the period 5 237 4 544 4 569 9 781 9 791
Profit attributable to shareholders 5 000 4 304 4 454 9 304 9 561
Increase in NII driven by
profitable growth in all
customer segments and
wider spreads
Cost increase from high
level of activity within
digitalisation projects,
marketing and
introduction of financial
activities tax
Other operating income
affected by Visa
transaction in 2Q16
Higher result in DNB
Livsforsikring due to
increased return on
financial assets
72
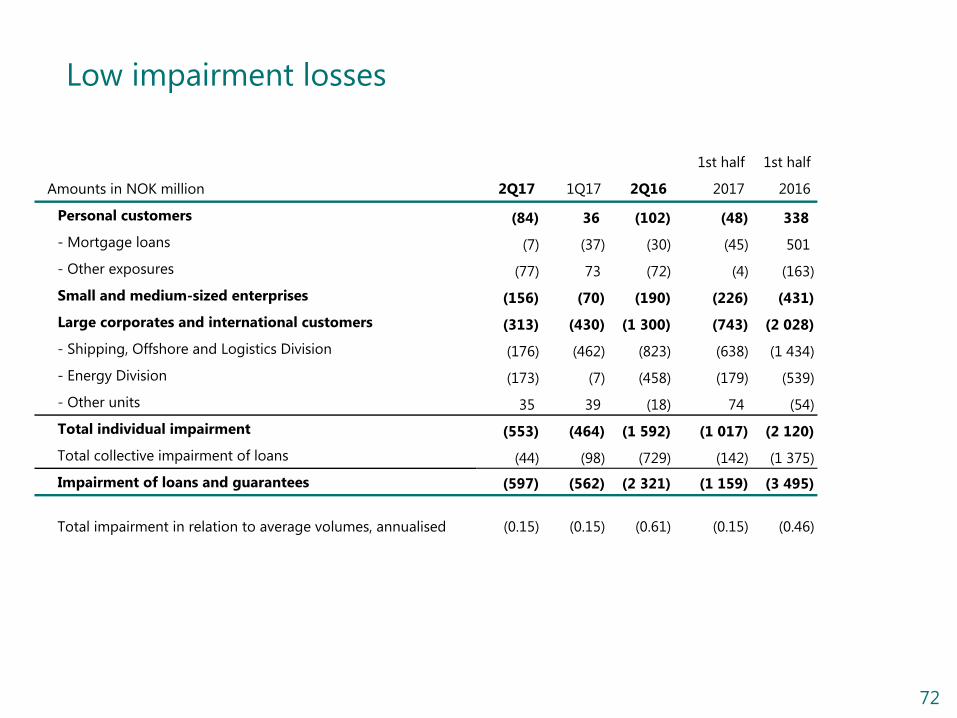
Low impairment losses
1st half 1st half
Amounts in NOK million 2Q17 1Q17 2Q16 2017 2016
Personal customers (84) 36 (102) (48) 338
- Mortgage loans (7) (37) (30) (45) 501
- Other exposures (77) 73 (72) (4) (163)
Small and medium-sized enterprises (156) (70) (190) (226) (431)
Large corporates and international customers (313) (430) (1 300) (743) (2 028)
- Shipping, Offshore and Logistics Division (176) (462) (823) (638) (1 434)
- Energy Division (173) (7) (458) (179) (539)
- Other units 35 39 (18) 74 (54)
Total individual impairment (553) (464) (1 592) (1 017) (2 120)
Total collective impairment of loans (44) (98) (729) (142) (1 375)
Impairment of loans and guarantees (597) (562) (2 321) (1 159) (3 495)
Total impairment in relation to average volumes, annualised (0.15) (0.15) (0.61) (0.15) (0.46)
73
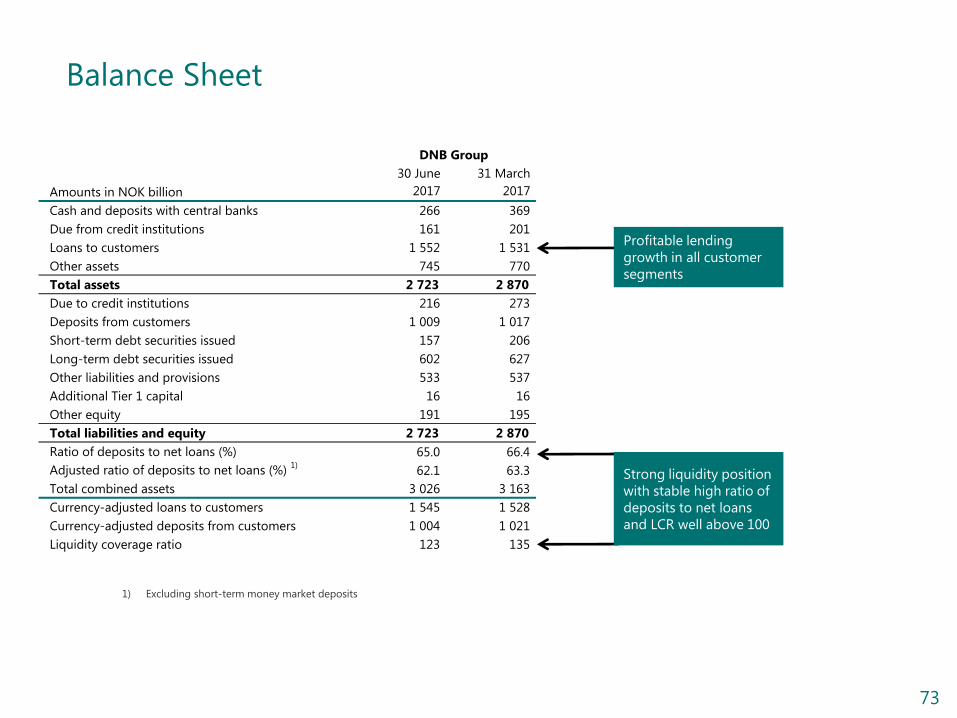
Balance Sheet
30 June 31 March
Amounts in NOK billion 2017 2017
Cash and deposits with central banks 266 369
Due from credit institutions 161 201
Loans to customers 1 552 1 531
Other assets 745 770
Total assets 2 723 2 870
Due to credit institutions 216 273
Deposits from customers 1 009 1 017
Short-term debt securities issued 157 206
Long-term debt securities issued 602 627
Other liabilities and provisions 533 537
Additional Tier 1 capital 16 16
Other equity 191 195
Total liabilities and equity 2 723 2 870
Ratio of deposits to net loans (%) 65.0 66.4
Adjusted ratio of deposits to net loans (%) 1)
62.1 63.3
Total combined assets 3 026 3 163
Currency-adjusted loans to customers 1 545 1 528
Currency-adjusted deposits from customers 1 004 1 021
Liquidity coverage ratio 123 135
DNB Group
1) Excluding short-term money market deposits
Profitable lending
growth in all customer
segments
Strong liquidity position
with stable high ratio of
deposits to net loans
and LCR well above 100

74
DNB is Gradually Reducing Exposure in Cyclical and Capital-intensive Industries
Shipping and oil-related exposure EaD in USD million
20
19
18
23
21
19 18
15
14
2011 2012 2013 2014 2015 30 September 2016
Oil related Shipping
• Shipping ~40% reduction, 2011 – 30 September 2016
• Oil-related ~14% reduction, 2014 – 30 September 2016
CMD Nov 2016
75
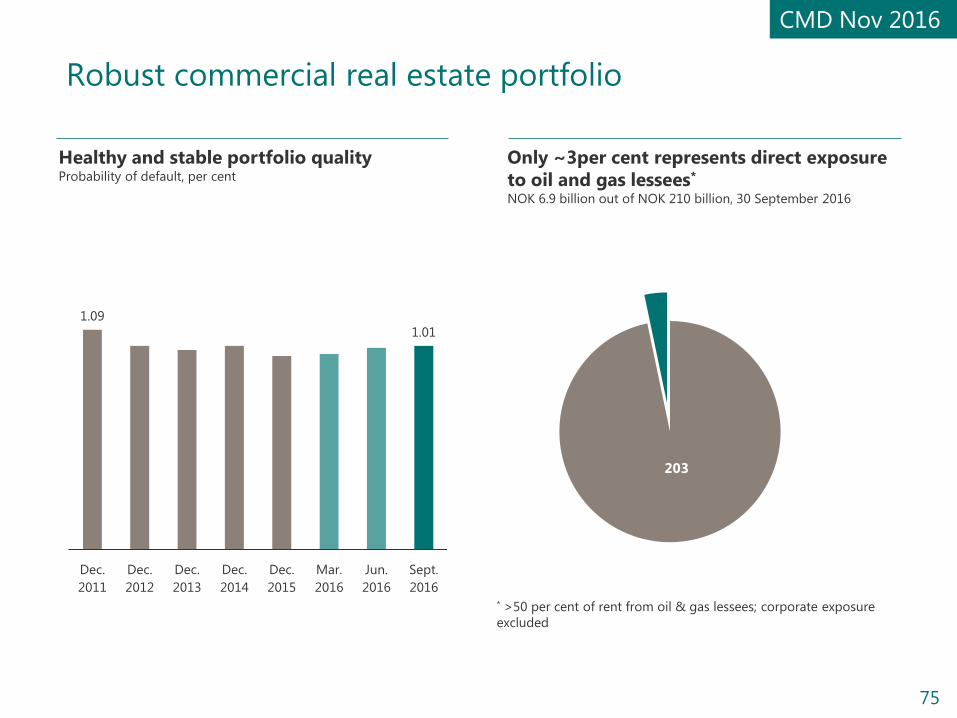
Robust commercial real estate portfolio
* >50 per cent of rent from oil & gas lessees; corporate exposure
excluded
Healthy and stable portfolio quality Probability of default, per cent
203
Only ~3per cent represents direct exposure
to oil and gas lessees*
NOK 6.9 billion out of NOK 210 billion, 30 September 2016
1.09
1.01
Dec.
2011
Dec.
2012
Dec.
2013
Dec.
2014
Dec.
2015
Mar.
2016
Jun.
2016
Sept.
2016
CMD Nov 2016
76
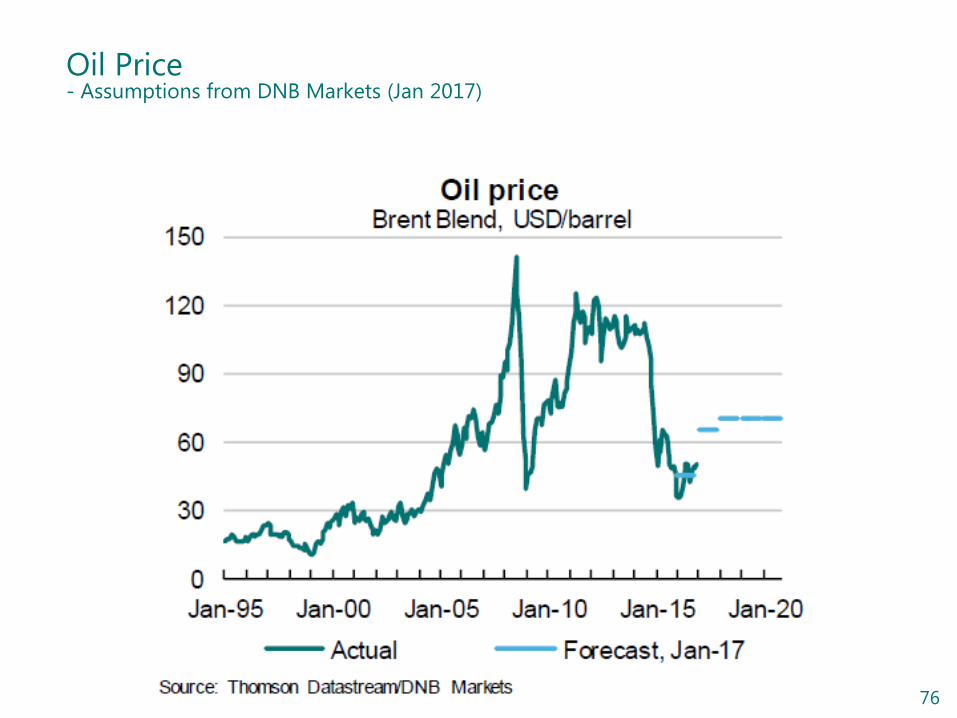
Oil Price - Assumptions from DNB Markets (Jan 2017)
77
Disclaimer
• This material has been prepared on the basis of the information provided by DNB Bank ASA (referred to as "DNB Bank") and public available sources. DNB ASA – the holding company of the DNB group is referred to as "DNB " in this presentation.
• This material is presented solely for information purposes and is not to be construed as a solicitation or an offer to buy or sell any securities or related financial instruments and should not be treated as giving investment advice. It has no regard to the specific investment objectives, financial situation or particular needs of any recipient. No representation or warranty, either express or implied, is provided in relation to the accuracy, completeness or reliability of the information contained herein. It should not be regarded by recipients as a substitute for the exercise of their own judgment. Any opinions expressed in this material are subject to change without notice and DNB Bank is not under any obligation to update or keep current the information contained herein. In addition, institutions mentioned in this material, their affiliates, agents, directors, partners and employees may make purchases and/or sales of the Notes as principal or agent or may act as market maker or provide investment banking or other services in respect of the Program or the Notes which may be issued from time to time thereunder. DNB, the Arranger and the Dealers and their respective affiliates, agents, directors, partners and employees accept no liability whatsoever for any loss or damage of any kind arising out of the use of all or any part of this material.
• The Notes are not to be offered or sold in any jurisdiction in circumstances in which the distribution of this document or the Notes would be prohibited in such jurisdiction. This document must not be acted on or relied on by persons who are not eligible to invest in the Notes. Any investment or investment activity to which this communication relates is available only to persons eligible to invest in the Notes and will be engaged in only with such persons.
• Furthermore, you should consult with your own legal, regulatory, tax, business, investment, financial and accounting advisers to the extent that you deem it necessary, and make your own investment, hedging and trading decisions (including decisions regarding the suitability of an investment in the Notes which may be offered from time to time) based upon your own judgment and advice from such advisers as you deem necessary and not upon any view expressed in this presentation.