dnb bank · pdf file · 2017-10-26balance sheet dnb bank asa ... dnb bank asa is a...
TRANSCRIPT

DNB BankA company in the DNB Group
THIRD QUARTER REPORT 2017 (Unaudited)

Financial highlights
Income statement DNB Bank Group 3rd quarter 3rd quarter January-September Full year Amounts in NOK million 2017 2016 2017 2016 2016 Net interest income 9 137 8 594 26 924 26 020 34 517
Net commissions and fees 1 503 1 364 4 511 4 114 5 634 Net gains on financial instruments at fair value 1 056 1 411 2 824 4 803 6 506 Other operating income 503 513 1 466 2 852 3 176
Net other operating income, total 3 062 3 288 8 801 11 769 15 316 Total income 12 199 11 882 35 725 37 788 49 833 Operating expenses (5 140) (4 846) (15 592) (14 869) (19 892) Restructuring costs and non-recurring effects (186) 1 (456) (640) (624) Pre-tax operating profit before impairment 6 873 7 038 19 677 22 279 29 317 Net gains on fixed and intangible assets 750 20 773 (6) (19) Impairment of loans and guarantees (867) (2 176) (2 026) (5 672) (7 424) Pre-tax operating profit 6 756 4 881 18 424 16 601 21 874 Tax expense (1 554) (1 074) (4 238) (3 652) (3 964) Profit from operations held for sale, after taxes 33 1 2 (22) 4 Profit for the period 5 235 3 808 14 189 12 926 17 914
Balance sheet 30 Sept. 31 Dec. 30 Sept. Amounts in NOK million 2017 2016 2016 Total assets 2 447 263 2 348 272 2 349 761 Loans to customers 1 524 855 1 492 268 1 479 529 Deposits from customers 1 019 896 945 694 929 756 Total equity 197 494 190 078 177 931 Average total assets 2 557 344 2 545 103 2 585 123
Key figures and alternative performance measures 3rd quarter 3rd quarter January-September Full year 2017 2016 2017 2016 2016 Return on equity, annualised (per cent) 1) 11.1 8.7 10.2 10.1 10.3 Combined weighted total average spread for lending and deposits (per cent) 1) 2) 1.31 1.30 1.30 1.33 1.32 Average spread for ordinary lending to customers (per cent) 1) 2) 2.09 2.03 2.06 2.06 2.04 Average spread for deposits to customers (per cent) 1) 2) 0.15 0.19 0.18 0.20 0.21 Cost/income ratio (per cent) 1) 43.7 40.8 44.9 41.0 41.2 Ratio of customer deposits to net loans to customers at end of period 1) 66.9 62.8 66.9 62.8 63.4 Net non-performing and net doubtful loans and guarantees, per cent of net loans 1) 1.11 1.32 1.11 1.32 1.50 Impairment relative to average net loans to customers, annualised (per cent) 1) (0.21) (0.56) (0.17) (0.50) (0.49) Individual impairment relative to average net loans to customers, annualised (per cent) 1) (0.23) (0.41) (0.17) (0.32) (0.35) Common equity Tier 1 capital ratio, transitional rules, at end of period (per cent) 3) 16.3 15.0 16.3 15.0 15.7 Tier 1 capital ratio, transitional rules, at end of period (per cent) 3) 17.8 16.1 17.8 16.1 17.4 Capital ratio, transitional rules, at end of period (per cent) 3) 20.6 18.6 20.6 18.6 20.0 Leverage ratio, Basel III (per cent) 6.9 6.6 6.9 6.6 7.1 Number of full-time positions at end of period 10 189 10 230 10 189 10 230 10 366
1) Defined as alternative performance measure (APM). APMs are described on page 44. 2) Includes assets and liabilities in the Baltics, reclassified as held for sale in August 2016. 3) Including 50 per cent of profit for the period, except for the full year figures.

Third quarter report 2017 Directors’ report ......................................................................................................................................... 2
Accounts Income statement DNB Bank ASA ...................................................................................................................... 8
Comprehensive income statement DNB Bank ASA ............................................................................................ 8
Balance sheet DNB Bank ASA ........................................................................................................................... 9
Income statement DNB Bank Group ................................................................................................................. 10
Comprehensive income statement DNB Bank Group ........................................................................................ 10
Balance sheet DNB Bank Group ....................................................................................................................... 11
Statement of changes in equity ........................................................................................................................ 12
Cash flow statement ......................................................................................................................................... 13 Note 1 Basis for preparation .................................................................................................................. 15
Note 2 Segments ................................................................................................................................... 16
Note 3 Capital adequacy ........................................................................................................................ 19
Note 4 Liquidity risk ............................................................................................................................... 22
Note 5 Net interest income ..................................................................................................................... 23
Note 6 Net commission and fee income ................................................................................................ 24
Note 7 Net gains on financial instruments at fair value ........................................................................... 25
Note 8 Operating expenses .................................................................................................................... 26
Note 9 Impairment of loans and guarantees ........................................................................................... 27
Note 10 Loans to customers ..................................................................................................................... 28
Note 11 Net impaired loans and guarantees for principal customer groups ............................................. 28
Note 12 Fair value of financial instruments at amortised cost .................................................................. 29
Note 13 Financial instruments at fair value .............................................................................................. 30
Note 14 Commercial paper and bonds, held to maturity .......................................................................... 34
Note 15 Assets and liabilities held for sale................................................................................................ 35
Note 16 Debt securities issued and subordinated loan capital ................................................................. 36
Note 17 Information on related parties ..................................................................................................... 38
Note 18 Off-balance sheet transactions .................................................................................................. 39
Additional information Profit and balance sheet trends ........................................................................................................................ 40
Alternative performance measures ................................................................................................................... 44
Information about the DNB Bank Group ........................................................................................................... 45
There has been no full or partial external audit of the quarterly directors’ report and accounts.
DNB BANK – THIRD QUARTER REPORT 2017 (UNAUDITED) / 1

Directors’ report Third quarter financial performance The DNB Bank Group 1) delivered solid results in the third quarter of 2017. Profits were NOK 5 235 million, an increase of NOK 1 427 million from the third quarter of 2016, driven by strong net interest income and lower impairment losses on loans and guarantees. The common equity Tier 1 capital ratio was 16.3 per cent at end-September 2017, up from 15.0 per cent a year earlier, and 15.8 at end-June 2017. The leverage ratio for the banking group was 6.9 per cent, up from 6.6 per cent a year earlier and down from 7.0 per cent at end-June 2017. Return on equity was 11.1 per cent, compared with 8.7 per cent in the year-earlier period and 10.1 per cent in the second quarter of 2017. Net interest income was up NOK 543 million from the third quarter of 2016, reflecting higher volumes, wider lending spreads and lower long-term funding costs. There was a rebalancing of the loan portfolio, with growth in volumes to personal customers and small and medium-sized enterprises, and lower volumes to large corporates and international customers. Net other operating income was NOK 3 062 million, down NOK 226 million from the third quarter of 2016. There was a positive contribution from higher commissions and fees. Operating expenses were up NOK 481 million compared with the third quarter of 2016, but down NOK 151 million compared with the second quarter of 2017. The increase was mainly due to the introduction of financial activities tax in 2017 and higher costs related to IT projects. Impairment losses on loans and guarantees totalled NOK 867 million for the quarter, down NOK 1 309 million from the corre-sponding quarter in 2016. There was a reduction in both individual impairment losses and collective impairment losses, reflecting more favourable economic conditions. Following the establishment of Vipps AS as a separate company, the banking group recorded a gain which gave a NOK 754 million rise in profits in the third quarter of 2017. Important events in the third quarter In the course of September, the Ministry of Finance gave Vipps a concession and permission to operate, and the demerger of Vipps from DNB was finalised. Following this transaction, DNB has an ownership interest in the new legal entity (Vipps AS) of close to 52 per cent. However, due to the terms and conditions in the share-holder agreement, Vipps has been defined as an associated company. As from end-September, Vipps AS has been consoli-dated in the financial accounts according to the equity method. On 25 August 2016, DNB and Nordea announced an agree-ment to combine their operations in Estonia, Latvia and Lithuania. The transaction was closed on 1 October 2017. DNB’s ownership interest in Luminor Group AB is approximately 44 per cent. During the autumn, DNB repeated last year's success and arranged the NXT Conference, a meeting place for investors and entrepreneurs. In the third quarter, eight regional conferences were held in addition to the main event in Oslo during Oslo Innovation Week. The conferences were attended by 435 start-up companies and 511 investors, and a total of 611 meetings between investors and entrepreneurs were registered. In addition, a digital arena was established, which will also be active between the events.
1) DNB Bank ASA is a subsidiary of DNB ASA and part of the DNB Group. The DNB Bank Group, hereinafter called "the banking group", comprises the bank and the bank's subsidiaries. Other companies owned by DNB ASA, including DNB Livsforsikring, DNB Forsikring and DNB Asset Management, are not part of the banking group. Operations in DNB ASA and the total DNB Group are not covered in this report but described in a separate report and presentation.
In September, DNB launched the product BSU Start, which gives customers the opportunity to start saving towards their child’s first home from the date of birth. The previous age limit was 18 years. The maximum savings amount was increased from NOK 300 000 to NOK 400 000. DNB also launched the chat service Boligbuddy for young people who are planning to buy a new home. The purpose is to provide good advice and answer questions in connection with such purchases. With effect from 1 July, DNB and the rest of the industry changed the marketing of credit cards and consumer loans. New rules from the authorities aim to protect consumers against irresponsible borrowing. On 1 September, the Ministry of Finance approved regulations on the Share Savings Account. The scheme implies that personal tax payers can establish a share savings account, invest in listed assets and not pay taxes on the gains until money is withdrawn from the account. During the third quarter, DNB’s reputation score in Norway was 66.9 points, compared with a higher level of 70.6 points in the second quarter of 2017. Financial performance in the first three quarters The banking group recorded profits of NOK 14 189 million in the first three quarters of 2017, up NOK 1 263 million from the corre-sponding period in 2016. Return on equity was 10.2 per cent, compared with 10.1 per cent in the year-earlier period. Net interest income increased by NOK 905 million from the previous year. Volumes were up, average lending spreads for the customer segments remained unchanged, and deposit spreads contracted by 0.02 percentage points compared with the previous year. There was an average increase in the healthy loan portfolio of 0.7 per cent parallel to a 4.1 per cent increase in average deposit volumes from the first three quarters of 2016. The increase in the loan portfolio reflected higher growth in the segments for personal customers and small and medium-sized enterprises, and lower volumes in the large corporates and international customers segment due to the rebalancing of the portfolio. Net other operating income decreased by NOK 2 968 million from the first three quarters of 2016. Commissions and fees were up NOK 397 million compared with the year-earlier period, mainly due to increased activity in DNB Markets. The exchange rate effects on additional Tier 1 capital and net gains on other financial instruments contributed negatively. In the second quarter of 2016, a gain of NOK 1 128 million was recorded in connection with the sale of holdings in Visa. Total operating expenses increased by NOK 539 million compared with the first three quarters of 2016. The increase was mainly due to the introduction of financial activities tax in 2017 and higher costs related to IT projects. Impairment losses on loans and guarantees totalled NOK 2 026 million in the first three quarters of 2017, down NOK 3 645 million from the corresponding period in 2016. There was a decrease in individual impairment losses of NOK 1 698 million, stemming primarily from the large corporate segment, due to a reduction in new impairment losses and an increase in reassessments. Parallel to this, there was a decrease in collective impairment losses of NOK 1 948 million, reflecting more stable economic conditions in oil-related industries.
2 / DNB BANK – THIRD QUARTER REPORT 2017 (UNAUDITED)

Third quarter income statement – main items Net interest income 3rd quarter 3rd quarter Amounts in NOK million 2017 Change 2016
Net interest income 9 137 543 8 594 Long-term funding costs 193 Other net interest income 187 Lending and deposit spreads, customer segments 107 Lending and deposit volumes, customer segments 103 Amortisation effects and fees 16 Exchange rate movements (63)
Net interest income increased by NOK 543 million from the third quarter of 2016. In the customer segments, higher volumes had a positive effect on net interest income in the third quarter of 2017. Average lending spreads widened by 0.06 percentage points, while deposit spreads contracted by 0.04 percentage points. Volume-weighted spreads for the customer segments widened by 0.01 percentage points compared with the same period in 2016, but contracted by 0.01 percentage points compared with the second quarter of 2017. There was an average increase of NOK 8.2 billion or 0.6 per cent in the healthy loan portfolio compared with the third quarter of 2016. During the same period, deposits were up NOK 30.6 billion or 3.2 per cent. Adjusted for exchange rate movements, loans increased by 1.3 per cent and deposits by 4.0 per cent. Net other operating income 3rd quarter 3rd quarter Amounts in NOK million 2017 Change 2016 Net other operating income 3 062 (226) 3 288 Basis swaps 390 Net commissions and fees 139 Other operating income (10) Exchange rate effects Additional Tier 1 capital (343) Net gains on other financial instruments (402)
Net other operating income declined by NOK 226 million or 6.9 per cent from the third quarter of 2016. There was a positive contribution from net commissions and fees, mainly due to higher activity within investment banking. Exchange rate effects on additional Tier 1 capital gave a negative contribution of NOK 343 million. Operating expenses 3rd quarter 3rd quarter Amounts in NOK million 2017 Change 2016
Operating expenses (5 325) (481) (4 844) Marketing etc. 10 Other costs (56) IT expenses (68) Provisions for financial activities tax (88) Salaries and other personnel exp. (excl. restructuring costs) (92) Restructuring costs 1) (33) Other non-recurring effects 1) (154)
1) Non-recurring effects. Operating expenses increased by NOK 481 million compared with the third quarter of 2016. Underlying operating expenses were NOK 294 million higher than in the year-earlier period. The increase stemmed mainly from the introduction of financial activities tax in 2017 and higher costs related to IT projects. The cost/income ratio was 43.7 per cent in the third quarter of 2017. Impairment of loans and guarantees Impairment losses on loans and guarantees totalled NOK 867 million in the third quarter.
Individual impairment losses were approximately 40 per cent lower than in the third quarter of 2016. The decrease was a result of successful restructuring of portfolios within shipping and oil and offshore-related segments. There were reversals on collective impairment losses, reflecting somewhat more favourable economic conditions in these industries. Net non-performing and doubtful loans and guarantees de-creased by NOK 3.4 billion from end-September 2016, totalling NOK 19.2 billion at end-September 2017. This represented 1.11 per cent of the loan portfolio, down from 1.32 per cent at end-September 2016. The reduction mainly stemmed from the oil and shipping-related portfolio. There are no signs of negative spill-over effects from the situation in the oil-related industries in the other credit portfolios. Taxes The banking group’s tax expense for the third quarter of 2017 is estimated at NOK 1 554 million, or 23.0 per cent of pre-tax operating profits. Financial performance, segments Financial governance in the banking group is adapted to the different customer segments. Reported figures reflect total sales of products and services to the relevant segments. Personal customers 3rd quarter Change Income statement in NOK million 2017 2016 NOK mill %
Net interest income 3 427 3 164 264 8.3 Net other operating income 1 014 963 50 5.2 Total income 4 441 4 127 314 7.6 Operating expenses (1 943) (1 823) (120) (6.6) Pre-tax operating profit before impairment 2 499 2 304 194 8.4 Impairment of loans and guarantees (80) (80) (0) (0.3) Pre-tax operating profit 2 419 2 225 194 8.7 Tax expense (605) (556) (49) (8.7) Profit for the period 1 814 1 669 145 8.7
Average balance sheet items in NOK billion Net loans to customers 730.9 694.7 36.2 5.2 Deposits from customers 406.8 407.9 (1.2) (0.3)
Key figures in per cent Lending spread 1) 1.86 1.71 Deposit spread 1) 0.17 0.34 Return on allocated capital 2) 19.7 18.0 Cost/income ratio 43.7 44.2 Ratio of deposits to loans 55.6 58.7
1) Calculated relative to the 3-month money market rate. See page 44 for additional information about alternative performance measures (APMs).
2) Calculated on the basis of allocated capital, corresponding to the external capital adequacy requirement which must be met by the DNB Group. See page 44 for additional information about alternative performance measures (APMs).
The increase in pre-tax operating profit from the third quarter of 2016 was mainly attributable to higher net interest income. There was a rise in average loans of 5.2 per cent from the third quarter of 2016. Deposit volumes remained stable, but adjusted for an internal transfer of deposits from associations and clubs to the small and medium-sized enterprises segment in December 2016, there was an increase of 1.7 per cent. Higher loan volumes contri-buted to a rise in net interest income compared with both the third quarter of 2016 and the second quarter of 2017. Volume-weighted spreads widened by 0.05 percentage points from the third quarter of 2016 and by 0.01 percentage points from the second quarter of 2017. DNB Meglerservice AS was transferred to the personal customer segment in the third quarter of 2017 and will be merged with DNB Eiendom. The transfer resulted in an increase in income
DNB BANK – THIRD QUARTER REPORT 2017 (UNAUDITED) / 3

and expenses of NOK 48 million and NOK 38 million, respectively, in the quarter. Regulations on interchange fees effective as of 1 September 2016 and rising costs related to SAS Eurobonus agreements had a negative impact on income from payment transfers. There was a seasonal decrease in income from the second quarter of 2017, mainly due to lower real estate broking activity. There was a rise in operating expenses. A reduction in ordinary salaries due to restructuring was offset by costs attributable to the financial activities tax. Close to 95 per cent of loans to personal customers represent well-secured home mortgages entailing low risk. Impairment losses on loans and guarantees remained at a stable low level in the third quarter of 2017. The market share of credit to households stood at 24.7 per cent at end-August 2017, while the market share of home mortgages was 27.9 per cent. The market share of total household savings was 31.0 per cent. DNB Eiendom had an average market share of 19.7 per cent in the third quarter of 2017. Customers’ use of digital services is still increasing, and DNB is continuing to automate and digitise its products and services. On 1 September 2017, a new product, Share Savings Account, for trading equities and mutual funds with deferred taxation of capital gains was launched in the internet bank and as new functionality in the ‘Spare’ app. So far almost 40 000 unique users have esta-blished Share Savings Accounts. The total market value of the securities in these accounts exceeds NOK 10 billion. DNB aspires to achieve continued profitable growth in the personal customer segment. Impairment losses on loans and guarantees are expected to remain stable at a low level. Small and medium-sized enterprises 3rd quarter Change Income statement in NOK million 2017 2016 NOK mill %
Net interest income 2 141 1 952 189 9.7 Net other operating income 358 341 17 5.0 Total income 2 499 2 292 206 9.0 Operating expenses (988) (939) (48) (5.2) Pre-tax operating profit before impairment 1 511 1 353 158 11.6 Net gains on fixed and intangible assets 1 (1) (100.0) Impairment of loans and guarantees (146) (339) 192 56.8 Profit from repossessed operations 30 (6) 36 633.0 Pre-tax operating profit 1 395 1 010 385 38.1 Tax expense (349) (252) (96) (38.1) Profit for the period 1 046 757 289 38.1
Average balance sheet items in NOK billion Net loans to customers 277.9 259.9 18.0 6.9 Deposits from customers 208.6 179.5 29.1 16.2
Key figures in per cent Lending spread 1) 2.59 2.65 Deposit spread 1) 0.30 0.38 Return on allocated capital 2) 16.5 11.5 Cost/income ratio 39.5 41.0 Ratio of deposits to loans 75.0 69.1
1) Calculated relative to the 3-month money market rate. See page 44 for additional information about alternative performance measures (APMs).
2) Calculated on the basis of allocated capital, corresponding to the external capital adequacy requirement which must be met by the DNB Group. See page 44 for additional information about alternative performance measures (APMs).
Higher total income combined with a reduction in impairment losses on loans and guarantees contributed to a solid increase in profit from the third quarter of 2016. There was a rise in average loans of 6.9 per cent from the third quarter of 2016, while average deposit volumes were up 16.2 per cent during the same period. The strong increase in customer deposits reflected deposits transferred from the personal customer segment in the fourth quarter of 2016. Adjusted for this transfer,
there was a 12.2 per cent increase in deposits from the third quarter of 2016. The significant rise in both loan and deposit volumes ensured a strong increase in net interest income compared with the third quarter of 2016. The rise in other operating income reflected particularly strong performance within payment transfers, while low market volatility and expectations of continued low interest rates gave a reduction in sales of currency and interest rate hedging products. The increase in operating expenses from the third quarter of 2016 was mainly due to a higher level of activity within IT deve-lopment. The financial activities tax introduced in 2017 also contributed to a higher cost base. On an annual basis, impairment losses on loans and guaran-tees represented 0.21 per cent of average loans in the third quarter of 2017, a reduction from 0.52 per cent in the year-earlier period. The quality of DNB’s portfolio of loans to small and medium-sized corporate customers remains stable. Developments are closely monitored, and preventive measures are continually considered and implemented to retain the strong portfolio quality. DNB expects lending growth to small and medium-sized corporate customers to be on a level with the expected domestic credit growth to this customer segment. Large corporates and international customers 3rd quarter Change Income statement in NOK million 2017 2016 NOK mill %
Net interest income 3 211 3 273 (62) (1.9) Net other operating income 1 293 1 444 (150) (10.4) Total income 4 504 4 716 (213) (4.5) Operating expenses (1 777) (1 664) (112) (6.8) Pre-tax operating profit before impairment 2 727 3 052 (325) (10.6) Net gains on fixed and intangible assets (3) 18 (22) (118.8) Impairment of loans and guarantees (642) (1 757) 1 115 63.5 Profit from repossessed operations (2) 4 (6) (138.7) Pre-tax operating profit 2 080 1 318 762 57.8 Tax expense (582) (356) (227) (63.7) Profit for the period 1 498 962 536 55.7
Average balance sheet items in NOK billion Net loans to customers 485.8 533.1 (47.2) (8.9) Deposits from customers 377.2 374.4 2.8 0.7
Key figures in per cent Lending spread 1) 2.15 2.15 Deposit spread 1) 0.03 (0.07) Return on allocated capital 2) 7.3 4.4 Cost/income ratio 39.4 35.3 Ratio of deposits to loans 77.6 70.2
1) Calculated relative to the 3-month money market rate. See page 44 for additional information about alternative performance measures (APMs).
2) Calculated on the basis of allocated capital, corresponding to the external capital adequacy requirement which must be met by the DNB Group. See page 44 for additional information about alternative performance measures (APMs).
Lower impairment losses on loans and guarantees were the main contributor to the increase in pre-tax operating profit compared with the third quarter of 2016. The reduction in impairment reflected both a slight increase in the oil price and continued restructuring of selected large exposures. Average loan volumes were down 8.9 per cent from the third quarter of 2016. The reduction in shipping and oil-related exposure continued in the third quarter. DNB aims to further rebalance the portfolio by reducing low-yielding exposures while expanding its business in profitable segments. Customer deposits were up 0.7 per cent from the third quarter of 2016. The effect of an increase in both deposit volumes and spreads was offset by lower loan volumes. Consequently, there was a small reduction in net interest income. There was a positive effect from interest payments on non-performing loans compared with the third quarter of 2016.
4 / DNB BANK – THIRD QUARTER REPORT 2017 (UNAUDITED)

Other operating income declined from the third quarter of 2016, mainly due to high gains from equity derivatives in 2016. Compared with the second quarter of 2017, the level of other operating income was stable. Income from investment banking products increased from the third quarter of 2016, but was negatively affected by seasonal variations compared with the second quarter of 2017. There was increasing activity towards the end of the quarter, especially in the debt capital markets and related to mergers and acquisitions. The increase in expenses from the third quarter of 2016 reflected higher expenses related to the work on compliance and anti-money laundering. In addition, several ongoing digitalisation initiatives gave an increase in costs in the quarter. The number of full-time positions was reduced by 134 from end-September 2016. The reductions took place in both Norwegian and international operations. Impairment losses on loans and guarantees were down from the third quarter of 2016. On an annual basis, net impairment represented 0.52 per cent of average loans, compared with 1.31 per cent in the year-earlier period. Individual impairment was reduced from 0.88 per cent in the third quarter of 2016, to 0.65 per cent. The reduction in impairment losses and guarantees reflects generally more stable economic conditions compared to 2016. Net non-performing and doubtful loans and guarantees amounted to NOK 13.9 billion at end-September 2017, down from NOK 16.9 billion a year earlier. Due to increasing capital requirements over the past few years, more efficient use of capital is necessary. This is achieved by reducing exposure to capital-intensive and cyclical industries to ensure a more balanced portfolio. Increased portfolio turnover, a reduction in final hold and more active use of capital markets are additional measures to generate higher non-lending income and reduce capital usage. Overall, this will contribute to raising the return on equity. Trading This segment comprises market making and other trading in foreign exchange, fixed-income, equity and commodity products, including the hedging of market risk inherent in customer transactions. Customer activities are supported by trading activities. 3rd quarter Change Income statement in NOK million 2017 2016 NOK mill %
Net interest income (20) 19 (39) (209.7) Net other operating income 712 1 134 (423) (37.3) Total income 691 1 153 (462) (40.0) Operating expenses (80) (127) 47 37.0 Pre-tax operating profit 611 1 025 (414) (40.4) Tax expense (141) (256) 116 45.2 Profit for the period 470 769 (299) (38.8)
Key figures in per cent Return on allocated capital 1) 30.5 42.7
1) Calculated on the basis of allocated capital, corresponding to the external capital adequacy requirement which must be met by the DNB Group. See page 44 for additional information about alternative performance measures (APMs).
There was a decline in both market volatility and activity levels compared with the third quarter of 2016. Total income declined from a high level in the year-earlier period, but was still at a satisfactory level, particularly within bonds and NOK rates. Funding, liquidity and balance sheet The short-term funding markets were sound in the third quarter of 2017. Due to low European interest rates, investors still showed limited interest, apart from in the United Kingdom, where there was an increasing level of activity as interest rates climbed upwards. In the US, expectations of a rate hike ensured continued strong interest in short maturities of less than one month and for floating
rate commercial paper in the six to twelve-month range. Maturities of more than four months on short-term funding are still priced somewhat higher than earlier. In light of its sound liquidity situation, the banking group is trying not to be price-leading. The banking group had ample access to short-term funding throughout the quarter. There was a sound increase in the level of activity in the long-term funding markets in the third quarter. There was brisk issue activity in the euro market, with several issues of both ordinary senior bonds, covered bonds and so-called non-preferred senior bonds, which are included in the banks’ minimum requirement for own funds and eligible liabilities, MREL. The European Central Bank, ECB, still dominated the covered bond market and has not yet announced a possible reduction in its ongoing targeted longer-term refinancing operations, TLTRO. The level of activity in the US dollar market was somewhat lower than in the third quarter of 2016, but significantly higher than in the second quarter of 2017. In addition, there were extensive issues of ordinary senior bonds in the market. Prices of all types of instruments, including subordi-nated loans, declined further in the third quarter. The value of long-term debt securities issued by the banking group was NOK 550 billion at end-September 2017 and NOK 599 billion a year earlier. The average remaining term to maturity for these debt securities was 4.1 years at end-September 2017, up from 3.9 years a year earlier. The short-term liquidity requirement, Liquidity Coverage Ratio, LCR, remained stable at above 100 per cent throughout the third quarter and was 118 per cent at end-September. Total assets in the banking group were NOK 2 447 billion at end-September 2017, up from NOK 2 350 billion a year earlier. Average net loans to customers were up NOK 8 billion or 0.6 per cent from end-September 2016. Average customer deposits were up NOK 31 billion or 3.2 per cent during the same period. The ratio of customer deposits to net loans to customers was up from 62.8 per cent at end-September 2016 to 66.9 per cent a year later. This is in line with the ambition to have a ratio of customer deposits to net loans of minimum 60 per cent. Risk and capital adequacy The banking group quantifies risk by measuring economic capital. Net economic capital was reduced by NOK 5.3 billion during the third quarter and came to NOK 66.4 billion at end-September 2017. Economic capital for the banking group 30 Sept. 30 June 31 March 30 Sept. Amounts in NOK billion 2017 2017 2017 2016
Credit risk 53.0 56.1 54.8 54.8 Market risk 6.9 7.8 8.1 6.8 Operational risk 8.5 8.5 8.5 8.6 Business risk 7.2 7.2 7.2 6.4 Gross economic capital 75.6 79.7 78.6 76.7 Diversification effect 1) (9.2) (8.0) (9.5) (9.3) Net economic capital 66.4 71.7 69.1 67.4 Diversification effect in per cent of gross economic capital 1) 12.2 10.0 12.1 12.1
1) The diversification effect refers to the risk-mitigating effect achieved by the banking group by having operations which are affected by different types of risk where unexpected losses are unlikely to occur at the same time.
Economic capital for credit risk was down NOK 3.1 billion, mainly as a consequence of lower credit volumes in the large corporate segment. Exposure at default, EAD, for large corporates and inter-national customers declined by NOK 46 billion. Approximately one-third of this can be ascribed to the weaker US dollar. The price of oil remained relatively strong throughout the quarter, resulting in growing optimism and higher activity levels in the market. It looks as though oil-related activities have reached the trough this time round. There is a slightly increasing level of activity in the rig and offshore markets, though contracts are still short and
DNB BANK – THIRD QUARTER REPORT 2017 (UNAUDITED) / 5

rates low. On the Norwegian shelf, offshore shipowners are still struggling with a utilisation rate for anchor handling ships below 50 per cent. The cost reductions have helped make market players better able to withstand low oil prices and investment levels. Dry bulk freight rates more than doubled from low levels during the third quarter, and ship values increased correspondingly. The fleet is growing at a slower rate than demand. Tanker rates are still close to historically low levels. There were no significant changes in the risk picture for information security. The highest risk is still related to computer fraud and industrial espionage. A higher level of activity among state and state-sponsored actors somewhat increases the threat level. The challenges facing the banking group are accentuated by a number of serious security incidents in large international companies. Calculated according to transitional rules, risk-weighted assets were NOK 1 027 billion, down from NOK 1 035 billion at end-September 2016. The common equity Tier 1 capital ratio was 16.3 per cent, while the capital adequacy ratio was 20.6 per cent. New regulatory framework Substantial changes in the Financial Contracts Act The Ministry of Justice and Public Security has circulated a draft for a new Financial Contracts Act for consultation. The draft will implement in Norwegian law the EU Mortgage Credit Directive (MCD), the Consumer Credit Directive (CCD), the Payment Accounts Directive (PAD) and the contractual parts of the Revised Payment Services Directive (PSD2). Among others, the draft aims to ensure stronger consumer protection for credit customers and provides certain specific rules for home mortgages. Customers will be ensured access to modern account and payment services, their protection against legal liability will be strengthened, and the duties which must be observed by the service provider in connection with financial contracts and the activities of finance brokers, financial agents and financial advisers will be clarified. The current obligation to dissuade will be replaced by a duty to reject loan applications from customers with a weak ability to pay. Lenders breaching their obligations may be held liable for customers’ possible debt problems. It has also been proposed to establish by law that sellers of investment services, credit or other financial contracts shall not sell products that the customer has no need for, and to prohibit creditors from charging unreasonably high interest rates to exploit customers. Furthermore, it has been proposed that the financial services industry itself should take greater responsibility for errors and misuse of electronic solutions and thus ensure that consumers are better protected against fraud. New Personal Data Act will strengthen consumer rights The Ministry of Justice and Public Security has circulated a draft for a new Personal Data Act for consultation.The Act will implement the EU's General Data Protection Regulation (GDPR) in Norwegian law. The purpose of GDPR is to strengthen and harmonise data protection across the EEA. The Ministry proposes that the regula-tion be implemented in Norwegian law through a referral provision in the new Personal Data Act. This is in line with the EEA Agreement and implies that the regulation will be introduced in Norway “as is”. GDPR will facilitate the free flow of digital services in the European market and generally make information processing more transparent and predictable for consumers. Among other things, a new right will be introduced for consumers to receive all personal data companies have stored about them and to have the infor-mation corrected, deleted or transferred from one service provider to another. The Norwegian Data Protection Authority will be given the opportunity to levy a significantly higher non-compliance fee, and the Ministry thus proposes that violations of the Act should no longer be punishable.
Another purpose of GDPR is to ensure more uniform regula-tions in Europe. It will thus be easier for both individuals and companies to relate to legislation, and to assert their rights, throughout the EU/EEA. The regulations are also better adapted to technological advances. The new Personal Data Act is intended to enter into force in Norway on 25 May 2018, on the same date as the regulation be-comes effective in the EU. Entry into force on this date is conditio-nal on the regulation being formally incorporated in the EEA Agreement, and on the Norwegian Parliament agreeing thereto. Macroeconomic developments Global GDP growth is expected to rise from 2.9 per cent in 2016 to 3.3 per cent in 2017, reflecting higher growth in both industrialised countries and emerging economies. Persistent strong growth in demand from China and widespread optimism have contributed to a synchronous boost in growth across countries and sectors. The growth in the industrialised countries is expected to remain higher than normal in the period ahead, resulting in a further decline in unemployment. Parallel to this, wage growth is restrained by national and global factors in a number of countries. This puts a damper on inflation and limits the rise in interest rates. Chinese GDP rose by 6.7 per cent in 2016 and is expected to grow by 6.8 per cent in 2017. The strong momentum in China is driven by increasing growth in the corporate sector along with persistently high growth in the household sector. In turn, this reflects low interest rates and a growth-promoting fiscal policy. A gentle, policy-driven cool-down is expected from 2018. The risk of a crisis in China further ahead in time seems to have decreased in light of smaller imbalances in the real estate market and fewer business liquidations. Japanese GDP rose by 1.6 per cent in 2017, which was significantly higher than the potential growth rate. We expect growth to decline to a level closer to the potential rate over the next few years. The cyclical upturn in the US has lasted for eight years, and there are no clear signs of a slowdown. While growth was weak in the first quarter, it picked up in the second quarter. GDP growth is estimated to be around 2 per cent over the coming years. Since this is somewhat higher than the potential economic growth rate, the unemployment rate will probably decline further. The core rate of inflation is down since February this year, in spite of a strong labour market. The unexpectedly low inflation suggests a gradual rise in interest rates. The Federal Reserve is expected to raise its policy rate in December this year, twice next year and twice in 2019. In September, the Federal Reserve announced that it will start to scale down its balance sheet as from October this year by reducing reinvestments in Treasury bills and mortgage-backed securities. In the eurozone, the increase in GDP was 1.8 per cent in 2016 and is likely to pick up to 2.1 per cent in 2017. So far this year all of the major member states have experienced higher growth. Busi-ness investment is up and will probably represent a higher share of GDP in the period ahead. Confidence indexes for households and businesses also indicate a further recovery in the eurozone, but the cool-down in China is expected to dampen the upturn from next year. Growth will nevertheless be higher than normal. This is ex-pected to lead to lower unemployment. Wage and price growth is also expected to increase somewhat in reflection of less slack in the economy. In consequence of this, the European Central Bank will begin to gradually depart from its expansionary policy by scaling down its asset purchases and eliminating the negative deposit rate by the end of next year. The British ‘No’ to further EU membership had fewer negative consequences than expected in the short term. There will probably be weaker growth in the period ahead as a result of uncertainty about the exit agreement with the EU and new trade agreements. This is expected to result in a decline in consumption and invest-ments, and the unemployment rate is assumed to rise slightly in the coming years. The depreciation of the British pound in the after-
6 / DNB BANK – THIRD QUARTER REPORT 2017 (UNAUDITED)

math of the Brexit vote has given a temporarily rise in inflation. In consequence of this, the Bank of England is likely to raise its policy rate in the course of the autumn, though weaker growth prospects and higher unemployment will probably prevent further interest rate hikes. Uncertainty regarding the process around Brexit and the results thereof makes future prospects more unpredictable than normal. The growth in GDP for Mainland Norway in the first and second quarter of the year was significantly stronger than throughout last year and also showed signs of being more broadly based. Growth is estimated to be 2 per cent this year. A smaller drop in oil invest-ments and higher growth in private consumption and corporate investment than last year will contribute to a higher growth rate. Over the next few years, the upswing in the Norwegian economy will probably be curbed by lower housing investment and a more neutral contribution from fiscal policy. Higher manufacturing growth has also been reflected in lower unemployment. The unemployment rate has declined gradually since the summer of 2016, mainly due to a lower labour force participation rate. Over the last few quarters, employment growth has also picked up and contributed to a further drop in the un-employment rate. A slight rise in employment is expected in the period ahead, resulting in a reduction in the unemployment rate. There was a steep rise in housing prices in 2016, especially in Oslo. In February this year, the average annual increase was 13 per cent for the entire country and 24 per cent in Oslo. At the time, housing prices were expected to level off. Seasonally adjusted, housing prices have fallen over the past five months. Many unsold homes, particularly in Oslo, indicate that the decline in prices will continue for another few quarters. Low interest rates and a more positive situation in the Norwegian economy, with falling un-employment and rising income growth, will nevertheless limit the downward trend in housing prices, which are expected to show modest growth from the middle of 2018.
In 2016, consumer price growth reflected strong increases in import prices as a result of the depreciation of the Norwegian krone through 2014 and 2015. Consumer price growth ended at 3.6 per cent last year, while core inflation was slightly lower at 3.1 per cent. DNB estimates that core inflation will be 1.6 per cent this year and 1.5 per cent next year. In 2019, there are prospects of even lower inflation before a new increase to 1.4 per cent in 2020. A stronger krone and continued low wage growth are the main factors behind the low core inflation. Due to a rise in interest rates among Norway's principal trading partners, Norges Bank is also expected to raise its key policy rate in the autumn of 2019, despite the fact that the inflation rate will remain below the target of 2.5 per cent. Future prospects DNB’s principal target is to achieve a return on equity above 12 per cent towards 2019. Several factors will contribute to reaching the return on equity target, including strong emphasis on profitability, lower impairment and more efficient use of capital. Lending volumes are expected to increase by around 2 per cent in 2017. DNB aims to increase commission and fee income by approximately 3 per cent per year. Total impairment losses for the period 2016 to 2018 are estimated to be up to NOK 18 billion, with the highest impairment losses during the first part of the period. DNB has set a target for its common equity Tier 1 capital ratio of 16.0 per cent from year-end 2017, including the announced change in the counter-cyclical buffer. DNB will present its updated financial ambitions on the Capital Markets Day in London on 21 November.
Oslo, 25 October 2017 The Board of Directors of DNB Bank ASA Anne Carine Tanum Gro Bakstad (chairman) (vice-chairman) Lillian Hattrem Kim Wahl Rune Bjerke (group chief executive)
DNB BANK – THIRD QUARTER REPORT 2017 (UNAUDITED) / 7

Income statement DNB Bank ASA 3rd quarter 3rd quarter January-September Full year Amounts in NOK million Note 2017 2016 2017 2016 2016 Total interest income 5 9 317 8 671 27 790 25 991 35 163 Total interest expenses 5 (3 270) (2 764) (9 554) (8 267) (11 555) Net interest income 5 6 047 5 907 18 236 17 725 23 608 Commission and fee income 6 1 816 1 611 5 427 4 890 6 739 Commission and expenses 6 (826) (714) (2 428) (2 159) (2 924) Net gains on financial instruments at fair value 7 1 152 2 279 4 195 6 142 8 834 Other income 949 977 2 751 3 443 5 837 Net other operating income 3 092 4 153 9 945 12 316 18 486 Total income 9 138 10 060 28 181 30 041 42 094 Salaries and other personnel expenses 8 (2 390) (2 254) (7 170) (7 067) (9 248) Other expenses 8 (1 581) (1 420) (5 054) (4 503) (6 118) Depreciation and impairment of fixed and intangible assets 8 (460) (406) (1 351) (1 429) (2 050) Total operating expenses 8 (4 431) (4 080) (13 575) (12 999) (17 417) Pre-tax operating profit before impairment 4 707 5 980 14 607 17 042 24 677 Net gains on fixed and intangible assets 753 7 769 8 14 Impairment of loans and guarantees 9 (704) (1 517) (1 063) (3 636) (4 679) Pre-tax operating profit 4 756 4 470 14 313 13 414 20 012 Tax expense (1 094) (1 010) (3 292) (3 031) (5 223) Profit for the period 3 662 3 460 11 021 10 382 14 789 Portion attributable to shareholders of DNB Bank ASA 3 445 3 332 10 326 10 025 14 193 Portion attributable to additional Tier 1 capital holders 218 128 695 358 595 Profit for the period 3 662 3 460 11 021 10 382 14 789
Comprehensive income statement DNB Bank ASA 3rd quarter 3rd quarter January-September Full year Amounts in NOK million 2017 2016 2017 2016 2016 Profit for the period 3 662 3 460 11 021 10 382 14 789 Actuarial gains and losses (106) (144) (166) Items that will not be reclassified to the income statement (106) (144) (166) Currency translation of foreign operations (14) (48) 11 (154) (135) Items that may subsequently be reclassified to the income statement (14) (48) 11 (154) (135) Other comprehensive income for the period (net of tax) (14) (153) 11 (298) (301) Comprehensive income for the period 3 648 3 306 11 032 10 084 14 487
8 / DNB BANK – THIRD QUARTER REPORT 2017 (UNAUDITED)

Balance sheet DNB Bank ASA 30 Sept. 31 Dec. 30 Sept. Amounts in NOK million Note 2017 2016 2016
Assets Cash and deposits with central banks 325 187 207 934 174 843 Due from credit institutions 12, 13 518 673 549 093 550 748 Loans to customers 10, 11, 12, 13 723 526 690 060 681 403 Commercial paper and bonds at fair value 13, 14 193 845 223 360 213 441 Shareholdings 13 5 922 5 178 4 245 Financial derivatives 13 144 949 170 317 199 343 Commercial paper and bonds, held to maturity 12, 14 9 738 12 760 13 185 Investments in associated companies 1 595 995 975 Investments in subsidiaries 119 775 118 233 115 207 Intangible assets 3 665 3 598 3 556 Deferred tax assets 1 873 1 882 6 331 Fixed assets 7 473 7 034 7 037 Other assets 16 274 13 462 15 659 Total assets 2 072 496 2 003 906 1 985 974
Liabilities and equity Due to credit institutions 12, 13 342 824 338 731 321 327 Deposits from customers 12, 13 994 667 920 664 907 972 Financial derivatives 13 163 563 181 794 205 520 Debt securities issued 12, 13, 16 332 165 336 941 332 229 Payable taxes 2 629 4 2 908 Deferred taxes 58 56 13 Other liabilities 25 806 23 893 20 985 Provisions 1 785 1 916 1 623 Pension commitments 2 687 2 454 2 669 Subordinated loan capital 12, 13, 16 28 554 29 347 28 202 Total liabilities 1 894 739 1 835 802 1 823 448 Share capital 18 256 18 314 18 314 Share premium 19 895 19 895 19 895 Additional Tier 1 capital 15 960 15 952 9 641 Other equity 123 646 113 942 114 675 Total equity 177 756 168 104 162 526 Total liabilities and equity 2 072 496 2 003 906 1 985 974
DNB BANK – THIRD QUARTER REPORT 2017 (UNAUDITED) / 9

Income statement DNB Bank Group 3rd quarter 3rd quarter January-September Full year Amounts in NOK million 2017 2016 2017 2016 2016 Total interest income 5 13 783 13 107 40 979 39 478 52 887 Total interest expenses 5 (4 646) (4 513) (14 055) (13 458) (18 369) Net interest income 5 9 137 8 594 26 924 26 020 34 517 Commission and fee income 6 2 357 2 103 7 002 6 328 8 628 Commission and fee expenses 6 (853) (738) (2 491) (2 214) (2 994) Net gains on financial instruments at fair value 7 1 056 1 411 2 824 4 803 6 506 Profit from investments accounted for by the equity method (17) (0) (38) 1 234 1 189 Net gains on investment properties (3) (5) (3) (28) (35) Other income 523 518 1 507 1 646 2 023 Net other operating income 3 062 3 288 8 801 11 769 15 316 Total income 12 199 11 882 35 725 37 788 49 833 Salaries and other personnel expenses 8 (2 901) (2 711) (8 692) (8 534) (11 206) Other expenses 8 (1 925) (1 671) (5 894) (5 365) (7 207) Depreciation and impairment of fixed and intangible assets 8 (500) (462) (1 461) (1 610) (2 103) Total operating expenses 8 (5 325) (4 844) (16 048) (15 509) (20 516) Pre-tax operating profit before impairment 6 873 7 038 19 677 22 279 29 317 Net gains on fixed and intangible assets 750 20 773 (6) (19) Impairment of loans and guarantees 9 (867) (2 176) (2 026) (5 672) (7 424) Pre-tax operating profit 6 756 4 881 18 424 16 601 21 874 Tax expense (1 554) (1 074) (4 238) (3 652) (3 964) Profit from operations held for sale, after taxes 33 1 2 (22) 4 Profit for the period 5 235 3 808 14 189 12 926 17 914 Portion attributable to shareholders of DNB Bank ASA 5 018 3 680 13 494 12 569 17 319 Portion attributable to additional Tier 1 capital holders 218 128 695 358 595 Profit for the period 5 235 3 808 14 189 12 926 17 914
Comprehensive income statement DNB Bank Group 3rd quarter 3rd quarter January-September Full year Amounts in NOK million 2017 2016 2017 2016 2016 Profit for the period 5 235 3 808 14 189 12 926 17 914 Actuarial gains and losses (106) (144) (179) Items that will not be reclassified to the income statement (106) (144) (179) Currency translation of foreign operations 1) (2 974) (4 320) (1 552) (10 038) (6 478) Currency translation reserve reclassified to the income statement (43) (43) Hedging of net investment 2) 1 894 2 950 1 125 6 761 4 346 Investments according to the equity method 3) 20 4 119 (29) (25) Investments according to the equity method, reclassified to the income statement 3) (855) (855) Items that may subsequently be reclassified to the income statement (1 061) (1 366) (308) (4 204) (3 055) Other comprehensive income for the period (net of tax) (1 061) (1 472) (308) (4 348) (3 233) Comprehensive income for the period 4 174 2 337 13 881 8 578 14 680
1) Currency translation effects related to the Baltics represented a loss of NOK 163 million in the third quarter of 2017. 2) Hedging of net investments in the Baltics represented a gain of NOK 92 million in the third quarter of 2017, net of tax. 3) DNB had indirect ownership interests in Visa Europe through its membership in Visa Norge. In connection with the valuation of the holdings in Visa Europe
as at 31 March 2016 an accumulated gain of NOK 855 million was recognised in other comprehensive income. Upon the completion of the acquisition of Visa Europe by Visa Inc in the second quarter of 2016, this amount was reclassified to profit and a total gain of NOK 1 128 million was recognised as "Profit from investments accounted for by the equity method" in the income statement.
10 / DNB BANK – THIRD QUARTER REPORT 2017 (UNAUDITED)

Balance sheet DNB Bank Group 30 Sept. 31 Dec. 30 Sept. Amounts in NOK million Note 2017 2016 2016
Assets Cash and deposits with central banks 325 842 208 263 175 212 Due from credit institutions 12, 13 154 682 174 908 191 656 Loans to customers 10, 11, 12, 13 1 524 855 1 492 268 1 479 529 Commercial paper and bonds at fair value 13, 14 189 386 217 887 212 494 Shareholdings 13 6 867 6 200 5 211 Financial derivatives 13 130 345 157 957 186 840 Commercial paper and bonds, held to maturity 12, 14 9 738 12 760 13 185 Investment properties 889 1 175 1 193 Investments accounted for by the equity method 4 250 3 570 3 596 Intangible assets 4 073 3 981 3 918 Deferred tax assets 1 168 1 392 943 Fixed assets 7 563 7 117 7 094 Assets held for sale 15 70 359 52 541 52 482 Other assets 17 246 8 255 16 408 Total assets 2 447 263 2 348 272 2 349 761
Liabilities and equity Due to credit institutions 12, 13 246 056 211 606 192 264 Deposits from customers 12, 13 1 019 896 945 694 929 756 Financial derivatives 13 108 143 130 990 156 188 Debt securities issued 12, 13, 16 758 003 767 750 786 823 Payable taxes 3 842 8 847 5 642 Deferred taxes 2 310 2 382 6 405 Other liabilities 27 319 15 781 22 564 Liabilities held for sale 15 51 001 41 243 39 547 Provisions 1 867 2 038 1 713 Pension commitments 2 779 2 516 2 725 Subordinated loan capital 12, 13, 16 28 554 29 347 28 202 Total liabilities 2 249 770 2 158 194 2 171 831 Share capital 18 256 18 314 18 314 Share premium 20 611 20 611 20 611 Additional Tier 1 capital 15 960 15 952 9 641 Other equity 142 667 135 200 129 364 Total equity 197 494 190 078 177 931 Total liabilities and equity 2 447 263 2 348 272 2 349 761
DNB BANK – THIRD QUARTER REPORT 2017 (UNAUDITED) / 11

Statement of changes in equity DNB Bank ASA Additional Actuarial Currency Share Share Tier 1 gains and translation Other Total Amounts in NOK million capital premium Capital losses reserve equity equity Balance sheet as at 31 Dec. 2015 18 314 19 895 8 353 (459) 652 104 777 151 533 Profit for the period 358 10 025 10 382 Other comprehensive income (net of tax) (144) (154) (298) Comprehensive income for the period 358 (144) (154) 10 025 10 084 Additional Tier 1 capital issued 1 400 1 400 Interest payments additional Tier 1 capital (458) (458) Currency movements taken to income (11) 11 Transfer of lending portfolio to subsidiary (continuity) (33) (33) Balance sheet as at 30 Sept. 2016 18 314 19 895 9 641 (603) 498 114 781 162 526 Balance sheet as at 31 Dec. 2016 18 314 19 895 15 952 (619) 517 114 045 168 104 Profit for the period 695 10 326 11 021 Other comprehensive income (net of tax) 11 11 Comprehensive income for the period 695 11 10 326 11 032 Demerger Vipps AS (59) (641) (700) Interest payments additional Tier 1 capital (681) (681) Currency movements taken to income (7) 7 Transfer of lending portfolio to subsidiary (continuity) 2 2 Balance sheet as at 30 Sept. 2017 18 256 19 895 15 960 (619) 527 123 738 177 756
DNB Bank Group Net Additional Actuarial Currency investment Share Share Tier 1 gains and translation hedge Other Total Amounts in NOK million capital premium capital losses reserve 1) reserve 1) equity equity 1) Balance sheet as at 31 Dec. 2015 18 314 20 611 8 353 (479) 18 289 (11 848) 120 171 173 412 Profit for the period 358 12 569 12 926 Other comprehensive income (net of tax) (144) (10 081) 6 761 (884) (4 348) Comprehensive income for the period 358 (144) (10 081) 6 761 11 684 8 578 Additional Tier 1 capital issued 1 400 1 400 Interest payments additional Tier 1 capital (458) (458) Currency movements taken to income (11) 11 Group contribution to DNB ASA (5 000) (5 000) Balance sheet as at 30 Sept. 2016 18 314 20 611 9 641 (623) 8 207 (5 087) 126 866 177 931 Balance sheet as at 31 Dec. 2016 18 314 20 611 15 952 (641) 11 768 (7 502) 131 575 190 078 Profit for the period 695 13 494 14 189 Other comprehensive income (net of tax) (1 552) 1 125 119 (308) Comprehensive income for the period 695 (1 552) 1 125 13 613 13 881 Demerger Vipps AS (59) (641) (700) Interest payments additional Tier 1 capital (681) (681) Currency movements taken to income (7) 7 Group contribution to DNB ASA (5 084) (5 084) Balance sheet as at 30 Sept. 2017 18 256 20 611 15 960 (641) 10 215 (6 376) 139 470 197 494 1) Of which OCI related to the Baltics: Balance sheet as at 31 December 2016 1 015 (712) 304 Other comprehensive income 291 (174) 117 Balance sheet as at 30 September 2017 1 307 (886) 421 Currency translation reserve and net investment hedge reserve related to the Baltics totaled NOK 421 million as at 30 September 2017, of which
NOK 338 million represented accumulated tax on the hedging instruments.
12 / DNB BANK – THIRD QUARTER REPORT 2017 (UNAUDITED)

Cash flow statement DNB Bank ASA
January-September Full year Amounts in NOK million 2017 2016 2016
Operating activities Net payments on loans to customers (38 411) (1 553) (1 193) Interest received from customers 20 578 20 080 26 974 Net receipts on deposits from customers 80 896 34 329 37 498 Interest paid to customers (1 809) (1 629) (5 219) Net receipt on loans to credit institutions 36 078 121 494 144 571 Interest received from credit institutions 3 837 2 686 3 774 Interest paid to credit institutions (2 226) (1 129) (1 975) Net receipts/payments on the sale of financial assets for investment or trading 30 163 (91) (8 655) Interest received on bonds and commercial paper 3 982 3 676 4 327 Net receipts on commissions and fees 2 725 2 598 3 998 Payments to operations (11 794) (11 570) (15 995) Taxes paid (930) (808) (1 268) Other net receipts 5 255 3 436 8 563 Net cash flow from operating activities 128 345 171 520 195 401
Investing activities Net payments on the acquisition of fixed assets (1 115) (941) (1 627) Receipts on the sale of long-term investments in shares 89 861 861 Payments on the acquisition of long-term investments in shares (3 602) (3 708) (3 700) Dividends received on long-term investments in shares 347 48 57 Net cash flow from investment activities (4 281) (3 739) (4 408)
Financing activities Receipts on issued bonds and commercial paper 1 365 828 8 697 625 8 943 961 Payments on redeemed bonds and commercial paper (1 362 930) (8 682 158) (8 935 044) Interest payments on issued bonds and commercial paper (4 945) (5 051) (6 238) Receipts on the raising of subordinated loan capital 10 106 738 Redemptions of subordinated loan capital (10 544) (3) (3) Interest payments on subordinated loan capital (746) (694) (920) Receipts on issued additional Tier 1 capital 1 400 7 520 Interest payments on additional Tier 1 capital (681) (458) (516) Group contribution payments (4 018) (6 942) (6 942) Net cash flow from funding activities (7 930) 3 719 2 555 Effects of exchange rate changes on cash and cash equivalents 1 580 (9 545) (1 663) Net cash flow 117 713 161 955 191 884 Cash as at 1 January 211 768 19 884 19 884 Net receipts of cash 117 713 161 955 191 884 Cash at end of period *) 329 481 181 839 211 768
*) Of which: Cash and deposits with central banks 325 187 174 843 207 934 Deposits with credit institutions with no agreed period of notice 1) 4 294 6 996 3 835
1) Recorded under "Due from credit institutions" in the balance sheet.
DNB BANK – THIRD QUARTER REPORT 2017 (UNAUDITED) / 13

Cash flow statement (continued) DNB Bank Group
January-September Full year Amounts in NOK million 2017 2016 2016
Operating activities Net payments on loans to customers (44 866) (40 070) (35 187) Interest received from customers 35 846 35 398 47 420 Net receipts on deposits from customers 81 413 33 168 40 724 Interest paid to customers (1 247) (422) (3 711) Net receipts on loans to credit institutions 60 640 125 866 163 235 Interest received from credit institutions 1 866 890 1 261 Interest paid to credit institutions (1 732) (899) (1 661) Net receipts on the sale of financial assets for investment or trading 27 140 11 542 4 076 Interest received on bonds and commercial paper 3 898 3 625 4 271 Net receipts on commissions and fees 4 294 3 975 5 757 Payments to operations (14 198) (13 925) (19 014) Taxes paid (9 631) (1 113) (1 455) Other net receipts 10 350 1 661 8 327 Net cash flow from operating activities 153 773 159 696 214 042
Investing activities Net payments on the acquisition of fixed assets (1 175) (934) (1 529) Net receipts/payments, investment properties 321 470 (605) Receipts on the sale of long-term investments in shares 89 860 861 Acquisition of long-term investments in shares (557) Dividends received on long-term investments in shares 7 48 66 Net cash flow from investment activities (1 314) 443 (1 206)
Financing activities Receipts on issued bonds and commercial paper 1 411 117 8 754 331 8 995 908 Payments on redeemed bonds and commercial paper (1 414 759) (8 726 620) (9 000 786) Interest payments on issued bonds and commercial paper (11 495) (12 835) (16 016) Receipts on the raising of subordinated loan capital 10 106 738 Redemptions of subordinated loan capital (10 544) (3) (3) Interest payments on subordinated loan capital (749) (696) (923) Receipts on issued additional Tier 1 capital 1 400 7 520 Interest payments on additional Tier 1 capital (681) (458) (516) Group contributions payments (5 318) (6 849) (6 849) Net cash flow from funding activities (22 322) 8 269 (20 928) Effects of exchange rate changes on cash and cash equivalents 1 000 (10 353) (312) Net cash flow 131 136 158 054 191 596 Cash as at 1 January 214 790 23 194 23 194 Net receipts of cash 131 136 158 054 191 596 Cash at end of period *) 345 926 181 248 214 790
*) Of which: Cash and deposits with central banks 337 274 177 935 211 908
Deposits with credit institutions with no agreed period of notice 1) 8 651 3 313 2 881
1) Recorded under "Due from credit institutions" in the balance sheet.
14 / DNB BANK – THIRD QUARTER REPORT 2017 (UNAUDITED)

Note 1 Basis for preparation
The quarterly financial statements for the DNB Bank Group have been prepared in accordance with IAS 34 Interim Financial Reporting as issued by the International Accounting Standards Board and as adopted by the European Union. DNB Bank ASA has prepared the financial statements according to the Norwegian Ministry of Finance's regulations on annual accounts, Section 1-6, on the use of IFRS. When preparing the consolidated financial statements, management makes estimates, judgments and assumptions that affect the application of the accounting principles and the carrying amount of assets, liabilities, income and expenses. Estimates and assumptions are subject to continual evaluation and are based on historical experience and other factors, including expectations of future events that are believed to be probable on the balance sheet date. A description of the accounting policies, significant estimates and areas where judgment is applied by the DNB Bank Group, can be found in note 1 Accounting principles in the annual report for 2016.
The customer segments were redefined in the first quarter of 2017. See note 2 Segments for further information. The change only affetcs the allocation between the segments and has no impact on the DNB Bank Group’s financial statements. Figures for comparable periods have been restated. Approved standards and interpretations that have not yet entered into force IFRS 9 Financial Instruments The new rules are applicable from 1 January 2018. See chapter 17 in note 1 Accounting principles in the annual report for 2016 for a more detailed description. Impact for DNB Bank Group Classification and measurement The banking group has completed the analysis related to classification and measurement. It has been concluded that the “hold to collect” business model will be used for the three main customer segments, which implies that amortised cost is the measurement method to be applied. This is the same as in the current IAS 39 rules. In DNB Markets a more distinct border has been determined between the business model in the trading book and the banking book. Hence, some portfolios measured at fair value today will be measured at amortised cost from 2018 onwards. There are some reclassifications caused by reduced use of the fair value option. The reclassifications will have no material impact on the DNB Bank Group’s financial statements. Impairment IFRS 9 changes the measurement of the provision for credit losses for financial assets. At initial recognition, as well as if the credit risk has not increased significantly since initial recognition, the provision should equal 12-month expected credit losses (“stage 1”). If the credit risk has increased significantly, the provision should equal lifetime expected credit losses (“stage 2”). This dual approach replaces today’s collective impairment model. For individual impairment there are no significant changes in the rules compared with the current IAS 39 rules. Individual impairment is from now on referred to as the third stage (“stage 3”).
In DNB Bank Group, the assessment of what is considered to be a significant change in credit risk is based on a combination of quantitative and qualitative indicators and backstops. The most important driver of significant change in credit risk in the banking group is the quantita-tive indicator determined by comparing the remaining lifetime PD at the reporting date with the remaining lifetime PD at the reporting date expected at initial recognition. Using this as a measurement, a change of 2.5 times lifetime PD from initial recognition is assessed as a significant change in credit risk. Further, the change in PD must be a minimum of 0.6 percentage points for the deterioration in credit risk to be considered to be significant. In the high end of the risk scale a change of 7.5 percentage points or more is considered to be a significant deterioration in credit risk even if this is less than a change of 2.5 times lifetime PD. These limits reflect the high sensitivity to change in the low end of the risk scale and the low sensitivity to change in the high end of the scale.
DNB Bank Group will calculate the loss provision for financial assets in “stage 1” and “stage 2” under the new rules as the present value of exposure at default (EAD) multiplied by the probability of default (PD) multiplied by loss given default (LGD). The work to establish the methodology and loss provision model has been completed. This includes converting PD, LGD and EAD to be point in time and more forward looking as the modelling is built on the IRB framework. The measurement of loss provisions will incorporate the effect of DNB’s forward-looking view (macro scenarios). The banking group has grouped instruments with similar credit risk characteristics into 18 port-folios. Based on an historical analysis, key risk drivers (macro factors) impacting the PD are identified for the different portfolios. The number of macro factors identified per portfolio varies from one to four. The forecast for the different macro factors will be updated quarterly and provided internally from DNB Markets. The forecast period varies between three and four years. After this period, the drivers are assumed to be mean reverting.
Thorough testing, calibration and analysis are still ongoing and will continue throughout 2017, included testing of the entire IT value chain for the financial reporting process. The implementation impact will be calculated on 1 January 2018 and be recognised as a change in the collective impairment provision in the balance sheet with the offsetting entry recognised directly in equity, hence there will be no impact on the income statement.
DNB BANK – THIRD QUARTER REPORT 2017 (UNAUDITED) / 15

Note 2 Segments
Financial governance in DNB is geared to the different customer segments. The follow-up of total customer relationships and segment profitability are two important dimensions when making strategic priorities and deciding where to allocate the DNB Bank Group’s resources. Special product areas are responsible for production and development for parts of the product range and for ensuring that DNB Bank Group meets the needs of the various customer segments. Reported figures for the different segments will reflect the banking group’s total sales of products and services to the relevant customer segments. Following the reorganisation announced in September 2016, the DNB Bank Group has changed its distribution of the profit from DNB Finans’ operations between the three customer segments. As of 1 January 2017, profit from DNB Finans’ operations in Sweden are divided between the personal customer segment, the small and medium-sized enterprises segment and the large corporates and international customers segment. Profit from DNB Finans’ operations in Denmark are divided between the small and medium-sized enterprises segment and the large corporates and international customers segment. Previously, profits from these operations were included in the large corporates and international customers segment. The distribution of profit from DNB Finans’ operations in Norway on the various segments has also been changed. Figures for 2016 have been adjusted correspondingly.
Personal customers - includes the banking group’s total products and activities to private customers in all channels, both digital and physical. DNB Bank Group offers a wide range of products through Norway’s largest distribution network, comprising branches, telephone banking (24/7), digital banking, real estate broking as well as external channels (post offices and in-store postal outlets). Credit cards and consumer financing in Sweden are also included in this business area.
Small and medium - is responsible for product sales and advisory services to small and medium-sized enterprises in Norway. sized enterprises Customers in this segment range from small businesses and start-up companies to relatively large
corporate customers, and the product offerings are adapted to the customers’ different needs. Small and medium-sized enterprises are served through the banking group’s physical distribution network throughout Norway as well as digital and telephone banking (24/7). Factoring, leasing and asset financing for small and medium-sized enterprises in Sweden and Denmark are also included in this business area.
Large corporates and - includes large Norwegian and international corporate customers and all customers served by the DNB Bank international customers Group’s subsidiary banks in the Baltics and Poland. Operations are based on sound industry expertise and
long-term customer relationships. Trading - includes market making and other trading activities in fixed income, currencies and commodities (FICC) as
well as equities, including risk management of the risk inherent in customer transactions. Markets’ trading activities support the customer activities.
The income statement and balance sheet for the segments have been prepared on the basis of internal financial reporting for the functional organisation of the DNB Bank Group into segments, as reported to group management (chief operating decision maker) for an assessment of current developments and the allocation of resources. Figures for segments are based on the banking group’s accounting principles and DNB’s management model. Allocation of costs and capital between segments involves a number of assumptions, estimates and discretionary distributions.
Capital allocated to the segments is calculated on the basis of the DNB bank group’s common equity Tier 1 capital and long-term capitalisation ambition. The allocation of capital to all units is based on the banking group’s adaptation to Basel III with capital requirement related to credit risk, market risk and operational risk. The allocation of capital for credit risk is based on the DNB bank group’s internal measurement of risk-adjusted capital requirements for credit. Capital requirements for market risk are allocated directly in accordance with risk-weighted volume, and operational risk is allocated based on the respective units’ total income.
16 / DNB BANK – THIRD QUARTER REPORT 2017 (UNAUDITED)

Note 2 Segments (continued) Income statement, third quarter Large DNB Bank Group corporates Small and and Other Personal medium-sized international operations/ DNB customers enterprises customers Trading eliminations 1) Bank Group 3rd quarter 3rd quarter 3rd quarter 3rd quarter 3rd quarter 3rd quarter Amounts in NOK million 2017 2016 2017 2016 2017 2016 2017 2016 2017 2016 2017 2016 Net interest income 3 427 3 164 2 141 1 952 3 211 3 273 (20) 19 379 188 9 137 8 594 Net other operating income 1 014 963 358 341 1 293 1 444 712 1 134 (315) (594) 3 062 3 288 Total income 4 441 4 127 2 499 2 292 4 504 4 716 691 1 153 64 (407) 12 199 11 882 Operating expenses (1 943) (1 823) (988) (939) (1 777) (1 664) (80) (127) (539) (291) (5 325) (4 844) Pre-tax operating profit before impairment 2 499 2 304 1 511 1 353 2 727 3 052 611 1 025 (474) (698) 6 873 7 038 Net gains on fixed and intangible assets (0) 1 (3) 18 754 1 750 20 Impairment of loans and guarantees 2) (80) (80) (146) (339) (642) (1 757) 1 (1) (867) (2 176) Profit from repossessed operations 30 (6) (2) 4 (28) 1 Pre-tax operating profit 2 419 2 225 1 395 1 010 2 080 1 318 611 1 025 252 (696) 6 756 4 881 Tax expense (605) (556) (349) (252) (582) (356) (141) (256) 122 347 (1 554) (1 074) Profit from operations held for sale, after taxes 0 (0) 33 1 33 1 Profit for the period 1 814 1 669 1 046 757 1 498 962 470 769 407 (349) 5 235 3 808
1) See the tables below for more information about Other operations/eliminations. 2) See note 9 Impairment of loans and guarantees for an analysis of the gross change in impairment for the banking group. Main average balance sheet items Large DNB Bank Group corporates Small and and Other Personal medium-sized international operations/ DNB customers enterprises customers Trading eliminations Bank Group 3rd quarter 3rd quarter 3rd quarter 3rd quarter 3rd quarter 3rd quarter Amounts in NOK billion 2017 2016 2017 2016 2017 2016 2017 2016 2017 2016 2017 2016 Loans to customers 1) 2) 730.9 694.7 277.9 259.9 485.8 533.1 32.5 20.0 (2.5) 7.8 1 524.6 1 515.4 Deposits from customers 1) 2) 406.8 407.9 208.6 179.5 377.2 374.4 94.5 111.1 (33.2) (12.1) 1 053.8 1 060.8 Allocated capital 3) 36.9 36.8 25.4 26.2 82.0 86.7 6.1 7.2
Key figures Large DNB Bank Group corporates Small and and Personal medium-sized international Other DNB customers enterprises customers Trading operations Bank Group 3rd quarter 3rd quarter 3rd quarter 3rd quarter 3rd quarter 3rd quarter Per cent 2017 2016 2017 2016 2017 2016 2017 2016 2017 2016 2017 2016 Cost/income ratio 4) 43.7 44.2 39.5 41.0 39.4 35.3 11.6 11.0 43.7 40.8 Ratio of deposits to loans 2) 5) 55.6 58.7 75.0 69.1 77.6 70.2 69.1 70.0 Return on allocated capital, annualised 3) 19.7 18.0 16.5 11.5 7.3 4.4 30.5 42.7 11.1 8.7
1) Loans to and deposits from customers in the Baltics are included under Large corporates and international customers in spite of being reclassified as assets and liabilities held for sale in August 2016. The reclassification is reflected under Other operations/elimination. In the third quarter of 2017 reclassified loans amounted to NOK 47.3 billion and deposits to NOK 37.6 billion.
2) Loans to customers include accrued interest, impairment and value adjustments. Correspondingly, deposits from customers include accrued interest and value adjustments.
3) Allocated capital for the segments is calculated based on the external capital adequacy requirement (Basel III) which must be met by the banking group. The capital allocated in 2017 corresponds to a common equity Tier 1 capital ratio of 18.0 per cent compared to 17.2 per cent in 2016. Recorded capital is used for the banking group.
4) Total operating expenses relative to total income. 5) Deposits from customers relative to loans to customers. Calculated on the basis of average balance sheet items.
DNB BANK – THIRD QUARTER REPORT 2017 (UNAUDITED) / 17

Note 2 Segments (continued) Income statement, January-September Large DNB Bank Group corporates Small and and Other Personal medium-sized international operations/ DNB customers enterprises customers Trading eliminations Bank Group Jan.-Sept. Jan.-Sept. Jan.-Sept. Jan.-Sept. Jan.-Sept. Jan.-Sept. Amounts in NOK million 2017 2016 2017 2016 2017 2016 2017 2016 2017 2016 2017 2016
Net interest income 9 825 9 652 6 296 5 821 9 640 9 885 5 27 1 158 634 26 924 26 020
Net other operating income 2 905 2 827 1 143 1 070 3 892 3 949 1 889 2 159 (1 028) 1 764 8 801 11 769
Total income 12 730 12 479 7 439 6 891 13 532 13 834 1 894 2 186 130 2 398 35 725 37 788
Operating expenses (5 878) (6 131) (3 062) (2 850) (5 482) (5 106) (344) (389) (1 282) (1 033) (16 048) (15 509)
Pre-tax operating profit before impairment 6 852 6 348 4 377 4 041 8 050 8 728 1 551 1 797 (1 152) 1 365 19 677 22 279
Net gains on fixed and intangible assets (0) 0 (0) 2 20 27 754 (35) 773 (6)
Impairment of loans and guarantees (70) 271 (264) (806) (1 701) (5 143) 8 6 (2 026) (5 672)
Profit from repossessed operations 3 (34) (6) 1 2 33
Pre-tax operating profit 6 782 6 619 4 116 3 203 6 364 3 614 1 551 1 797 (388) 1 368 18 424 16 601
Taxes (1 695) (1 655) (1 029) (801) (1 782) (976) (357) (449) 625 228 (4 238) (3 652) Profit from operations held for sale, after taxes (1) (0) 3 2 (25) 2 (22)
Profit for the period 5 086 4 963 3 087 2 403 4 582 2 641 1 194 1 347 240 1 572 14 189 12 926
Balance sheet items Large DNB Bank Group corporates Small and and Other Personal medium-sized international operations/ DNB customers enterprises customers Trading eliminations Bank Group 30 September 30 September 30 September 30 September 30 September 30 September Amounts in NOK billion 2017 2016 2017 2016 2017 2016 2017 2016 2017 2016 2017 2016 Loans to customers 738,1 701,2 282,3 262,7 476,3 505,7 30,9 22,1 (2,7) (12,2) 1 524,9 1 479,5 Deposits from customers 405,0 399,2 206,0 178,2 375,3 365,5 69,9 18,3 (36,3) (31,4) 1 019,9 929,8 Other operations/eliminations Other operations/eliminations include IT and Operations, HR (Human Resources), Group Finance including Group Treasury, Risk Management, Corporate Communications, the partially owned company Eksportfinans and investments in IT infrastructure. In addition, Other operations/eliminations include that part of the banking group’s equity that is not allocated to the segments. Profits from repossessed operations which are fully consolidated in the DNB Bank Group are presented net under ”Profit from repossessed operations” in the internal reporting of segments. The acquired companies and all intra-group eliminations are included in Other operations/eliminations.
In the third quarter of 2017 NOK 754 million was recognised as Net gains on fixed and intangible assets and presented within the Other operations/eliminations following the establishment of Vipps AS and the agreement DNB entered into with 105 other Norwegian banks. DNB will have an ownership interest in the new legal entity (Vipps AS) of close to 52 per cent. However, due to the terms and conditions in the shareholder agreement, it has been decided to define Vipps AS as an associated company. DNB can only vote for 49.9 per cent at the General Meeting, and has only three of seven board members. In the future, Vipps AS will be consolidated in DNB according to the equity method. Pre-tax operating profit DNB Bank Group 3rd quarter 3rd quarter Amounts in NOK million 2017 2016 Unallocated interest income 181 43 Income from equity investments 13 13 Gains on fixed and intangible assets 754 1 Mark-to-market adjustments on financial instruments (410) (322) Basis swaps (54) (444) Profit from associated companies (17) (0) Net gains on investment properties 3 11 Profit from repossessed operations (28) 1 Unallocated personnel expenses (67) (82) Unallocated IT and Operations expenses (27) 79 Other (97) 3 Pre-tax operating profit 252 (696)
18 / DNB BANK – THIRD QUARTER REPORT 2017 (UNAUDITED)

Note 3 Capital adequacy
Capital adequacy is calculated and reported in accordance with the EU capital requirements regulations for banks and investment firms (CRD IV/CRR). The regulatory consolidation deviates from consolidation in the accounts and comprises the parent company, subsidiaries and associated companies within the financial sector. Associated companies are consolidated pro rata. DNB Bank ASA Primary capital DNB Bank Group
31 Dec. 30 Sept. 30 Sept. 31 Dec. 2016 2017 Amounts in NOK million 2017 2016
168 104 167 430 Total equity 184 000 190 078 Effect from regulatory consolidation (181) (181)
(15 574) (15 574) Additional Tier 1 capital instruments included in total equity (15 574) (15 574) (284) (289) Net accrued interest on additional Tier 1 capital instruments (289) (284)
152 246 151 567 Common equity Tier 1 capital instruments 167 956 174 039 Deductions (9) Pension funds above pension commitments (9)
(2 900) (2 894) Goodwill (2 949) (2 951) (224) (224) Deferred tax assets that are not due to temporary differences (599) (482) (699) (771) Other intangible assets (1 584) (946)
Group contribution, payable (5 084) (6) (594) Expected losses exceeding actual losses, IRB portfolios (799) (153)
(479) (415) Value adjustment due to the requirements for prudent valuation (AVA) (743) (786)
107 107 Adjustments for unrealised losses/(gains) on debt recorded at fair value (90) (90)
(580) (501) Adjustments for unrealised losses/(gains) arising from the institution's own credit risk related to derivative liabilities (DVA) (122) (159)
147 467 146 268 Common equity Tier 1 capital 161 062 163 388
151 465
Common equity Tier 1 capital incl. 50 per cent of profit for the period 167 672
17 471 15 574 Additional Tier 1 capital instruments 15 574 17 471 164 938 161 842 Tier 1 capital 176 636 180 860
167 039 Tier 1 capital incl. 50 per cent of profit for the period 183 246 5 602 5 216 Perpetual subordinated loan capital 5 216 5 602
21 249 23 123 Term subordinated loan capital 23 123 21 249 26 851 28 339 Tier 2 capital 28 339 26 851
191 789 190 181 Total eligible capital 204 975 207 711
195 378 Total eligible capital incl. 50 per cent of profit for the period 211 585
773 244 823 223 Risk-weighted volume, transitional rules 1 027 408 1 040 888 61 860 65 858 Minimum capital requirement, transitional rules 82 193 83 271
19.1 18.4 Common equity Tier 1 capital ratio, transitional rules (%) 16.3 15.7 21.3 20.3 Tier 1 capital ratio, transitional rules (%) 17.8 17.4 24.8 23.7 Capital ratio, transitional rules (%) 20.6 20.0
17.8 Common equity Tier 1 capital ratio, transitional rules, excluding 50 per cent of profit for the period (%) 15.7
19.7 Tier 1 capital ratio, transitional rules, excluding 50 per cent of profit for the period (%) 17.2
23.1 Capital ratio, transitional rules, excluding 50 per cent of profit for the period (%) 20.0
DNB BANK – THIRD QUARTER REPORT 2017 (UNAUDITED) / 19

Note 3 Capital adequacy (continued) Basel III The majority of the credit portfolios are reported according to the IRB approach. However, one portfolio, banks and financial institutions (DNB Bank) is still subject to final IRB approval from Finanstilsynet. Specification of risk-weighted volume and capital requirements DNB Bank ASA Average Risk- Capital Capital Nominal risk weights weighted require- require- exposure EAD 1) in per cent volume ments ments 30 Sept. 30 Sept. 30 Sept. 30 Sept. 30 Sept. 31 Dec. Amounts in NOK million 2017 2017 2017 2017 2017 2016 IRB approach
Corporate 715 027 582 241 56.0 326 265 26 101 23 407 Specialised lending (SL) 10 945 10 276 50.0 5 141 411 311 Retail - mortgages 95 314 95 314 24.3 23 182 1 855 1 593 Retail - other exposures 97 733 83 653 25.9 21 626 1 730 1 901 Securitisation 9 738 9 738 86.1 8 382 671 937
Total credit risk, IRB approach 928 757 781 223 49.2 384 597 30 768 28 149 Standardised approach
Central government 53 990 56 543 0.1 60 5 6 Institutions 539 431 360 952 25.6 92 393 7 391 6 194 Corporate 112 018 84 142 93.3 78 478 6 278 6 009 Retail - mortgages 7 978 7 460 39.2 2 927 234 210 Retail - other exposures 113 144 37 304 74.5 27 807 2 225 2 018 Equity positions 122 220 122 220 100.2 122 452 9 796 9 639 Other assets 9 814 9 814 85.6 8 399 672 820
Total credit risk, standardised approach 958 594 678 435 49.0 332 516 26 601 24 896 Total credit risk 1 887 352 1 459 658 49.1 717 113 57 369 53 045 Market risk
Position risk, debt instruments 20 684 1 655 1 855 Position risk, equity instruments 300 24 25 Currency risk Commodity risk 21 2 6 Credit value adjustment risk (CVA) 10 672 854 974
Total market risk 31 677 2 534 2 860 Operational risk 74 433 5 955 5 955 Total risk-weighted volume and capital requirements before transitional rules 823 223 65 858 61 860 Additional capital requirements according to transitional rules Total risk-weighted volume and capital requirements 823 223 65 858 61 860
1) EAD, exposure at default.
20 / DNB BANK – THIRD QUARTER REPORT 2017 (UNAUDITED)

Note 3 Capital adequacy (continued) Specification of risk-weighted volume and capital requirements DNB Bank Group Average Risk- Capital Capital Nominal risk weights weighted require- require- exposure EAD 1) in per cent volume ments ments 30 Sept. 30 Sept. 30 Sept. 30 Sept. 30 Sept. 31 Dec. Amounts in NOK million 2017 2017 2017 2017 2017 2016 IRB approach
Corporate 973 975 799 519 57.0 455 482 36 439 32 619 Specialised Lending (SL) 11 902 11 233 51.3 5 765 461 356 Retail - mortgages 739 683 739 683 21.9 162 193 12 975 12 465 Retail - other exposures 97 733 83 653 25.9 21 626 1 730 1 901 Securitisation 9 738 9 738 86.1 8 382 671 937
Total credit risk, IRB approach 1 833 031 1 643 827 39.8 653 448 52 276 48 279 Standardised approach
Central government 74 719 78 694 0.1 61 5 7 Institutions 269 112 128 965 29.6 38 141 3 051 2 243 Corporate 176 497 138 552 86.5 119 846 9 588 8 799 Retail - mortgages 57 287 54 681 44.3 24 238 1 939 1 805 Retail - other exposures 129 798 50 881 75.2 38 250 3 060 2 939 Equity positions 8 030 8 029 110.8 8 892 711 703 Securitisation 1 049 449 61.7 277 22 41 Other assets 13 143 13 143 68.7 9 030 722 859
Total credit risk, standardised approach 729 635 473 394 50.4 238 735 19 099 17 395 Total credit risk 2 562 667 2 117 221 42.1 892 182 71 375 65 674 Market risk
Position risk, debt instruments 11 965 957 1 169 Position risk, equity instruments 301 24 25 Currency risk Commodity risk 21 2 6 Credit value adjustment risk (CVA) 5 414 433 493
Total market risk 17 701 1 416 1 692 Operational risk 83 440 6 675 6 675 Total risk-weighted volume and capital requirements before transitional rules 993 324 79 466 74 042 Additional capital requirements according to transitional rules 2) 34 084 2 727 9 229 Total risk-weighted volume and capital requirements 1 027 408 82 193 83 271
1) EAD, exposure at default. 2) Due to transitional rules, the minimum capital adequacy requirements cannot be reduced below 80 per cent of the corresponding figure calculated
according to the Basel I regulations.
DNB BANK – THIRD QUARTER REPORT 2017 (UNAUDITED) / 21

Note 4 Liquidity risk
Liquidity risk is the risk that the DNB Bank Group will be unable to meet its payment obligations. Overall liquidity management in the banking group implies that DNB Bank ASA is responsible for funding domestic and international group entities. Liquidity risk is managed and measured by means of various measurement techniques.
The Board of Directors has approved internal limits which restrict the volume of short-term liabilities within different time frames. The various maturities are subject to stress testing based on a bank-specific crisis, a systemic crisis and a combination thereof, and a contingency plan has been established to handle market events. In addition, limits have been set for structural liquidity risk, which implies that lending to customers should largely be financed through customer deposits, subordinated capital and long-term funding. Ordinary senior bond debt and covered bonds are the major sources of long-term funding. The deposits-to-loans ratio is a key figure in liquidity risk management, and in order to avoid an increasing strain on funding from capital markets over time, the overall ambition is to retain a minimum deposits-to-loans ratio of 60 per cent. The banking group’s ratio of deposits to net loans was 66.9 per cent at end-September 2017, up from 62.8 per cent a year earlier. The ratio of deposits to net loans in DNB Bank ASA was 137.5 per cent at end-September 2017.
The short-term funding markets were sound in the third quarter of 2017. Due to low European interest rates, investors still showed limited interest, apart from in the United Kingdom, where there was an increasing level of activity as interest rates climbed upwards. In the US, expectations of a rate hike ensured continued strong interest in short maturities of less than one month and for floating rate commercial paper in the six to twelve-month range. Maturities of more than four months on short-term funding are still priced somewhat higher than earlier. In light of its sound liquidity situation, DNB is trying not to be price-leading. DNB had ample access to short-term funding throughout the quarter.
There was a sound increase in the level of activity in the long-term funding markets in the third quarter. There was brisk issue activity in the euro market, with several issues of both ordinary senior bonds, covered bonds and so-called non-preferred senior bonds, which are in-cluded in the banks’ minimum requirement for own funds and eligible liabilities, MREL. The European Central Bank, ECB, still dominated the covered bond market and has not yet announced a possible reduction in its ongoing targeted longer-term refinancing operations, TLTRO. The level of activity in the US dollar market was somewhat lower than in the third quarter of 2016, but significantly higher than in the second quarter of 2017. In addition, there were extensive issues of ordinary senior bonds in the market. Prices of all types of instru-ments, including subordinated loans, declined further in the third quarter.
The short-term liquidity requirement, Liquidity Coverage Ratio, LCR, remained stable at above 100 per cent throughout the quarter. At end-September, the total LCR was 118 per cent, with an LCR of 247 per cent for EUR, 112 per cent for USD and 87 per cent for NOK.
The average remaining term to maturity for the portfolio of senior bond debt and covered bonds was 4.1 years at end-September 2017, up from 3.9 years a year earlier. The banking group aims to maintain a sound and stable maturity structure for funding over the next five years.
22 / DNB BANK – THIRD QUARTER REPORT 2017 (UNAUDITED)

Note 5 Net interest income
DNB Bank ASA 3rd quarter 3rd quarter January-September Full year Amounts in NOK million 2017 2016 2017 2016 2016 Interest on amounts due from credit institutions 1 377 950 3 895 2 712 3 879 Interest on loans to customers 5 917 5 872 17 759 17 526 23 387 Interest on impaired loans and guarantees 235 179 621 431 622 Interest on commercial paper and bonds 974 1 183 3 311 3 439 4 630 Front-end fees etc. 68 63 215 194 260 Other interest income 746 425 1 989 1 690 2 385 Total interest income 9 317 8 671 27 790 25 991 35 163 Interest on amounts due to credit institutions (814) (435) (2 224) (1 244) (2 138) Interest on deposits from customers (1 842) (1 594) (5 327) (4 775) (6 373) Interest on debt securities issued (884) (905) (2 784) (2 767) (3 683) Interest on subordinated loan capital (104) (131) (342) (398) (529) Guarantee fund levy 1) (143) (159) (436) (477) (638) Other interest expenses 2) 517 458 1 558 1 394 1 804 Total interest expenses (3 270) (2 764) (9 554) (8 267) (11 555) Net interest income 6 047 5 907 18 236 17 725 23 608 DNB Bank Group 3rd quarter 3rd quarter January-September Full year Amounts in NOK million 2017 2016 2017 2016 2016 Interest on amounts due from credit institutions 767 302 1 945 908 1 339 Interest on loans to customers 11 353 11 221 33 957 33 607 44 735 Interest on impaired loans and guarantees 329 245 887 594 911 Interest on commercial paper and bonds 944 1 183 3 220 3 405 4 578 Front-end fees etc. 76 69 233 213 294 Other interest income 315 88 737 752 1 029 Total interest income 13 783 13 107 40 979 39 478 52 887 Interest on amounts due to credit institutions (655) (325) (1 754) (942) (1 705) Interest on deposits from customers (1 941) (1 689) (5 627) (5 024) (6 703) Interest on debt securities issued (2 700) (3 055) (8 344) (9 452) (12 385) Interest on subordinated loan capital (105) (132) (345) (401) (532) Guarantee fund levy 1) (173) (187) (524) (567) (768) Other interest expenses 2) 928 874 2 540 2 928 3 722 Total interest expenses (4 646) (4 513) (14 055) (13 458) (18 369) Net interest income 9 137 8 594 26 924 26 020 34 517
1) The amount recorded in the quarter represents a proportional share of the estimated annual levy. 2) Other interest expenses include interest rate adjustments resulting from interest swaps.
DNB BANK – THIRD QUARTER REPORT 2017 (UNAUDITED) / 23

Note 6 Net commission and fee income
DNB Bank ASA 3rd quarter 3rd quarter January-September Full year Amounts in NOK million 2017 2016 2017 2016 2016 Money transfers 988 924 2 792 2 655 3 451 Asset management services 94 84 271 247 342 Custodial services 76 75 267 241 319 Securities broking 158 126 519 386 573 Corporate finance 127 79 406 298 575 Interbank fees 6 7 15 18 23 Credit broking 72 79 327 352 494 Sale of insurance products 96 93 296 278 372 Other commissions and fees 199 145 533 414 589 Total commission and fee income 1 816 1 611 5 427 4 890 6 739 Money transfers (552) (452) (1 562) (1 309) (1 754) Asset management services (3) (8) (15) Custodial services (33) (68) (126) (130) (170) Securities broking (36) (15) (107) (133) (173) Corporate finance (12) (12) (90) (54) (73) Interbank fees (12) (14) (36) (43) (57) Credit broking (14) (20) (51) (65) (87) Sale of insurance products (30) (31) (87) (87) (114) Other commissions and fees (133) (101) (361) (338) (481) Total commission and fee expenses (826) (714) (2 428) (2 159) (2 924) Net commission and fee income 990 898 3 000 2 731 3 815 DNB Bank Group 3rd quarter 3rd quarter January-September Full year Amounts in NOK million 2017 2016 2017 2016 2016 Money transfers 1 067 994 3 023 2 862 3 731 Asset management services 110 99 315 287 406 Custodial services 83 82 284 259 344 Securities broking 227 137 601 416 616 Corporate finance 164 124 571 429 767 Interbank fees 6 7 15 18 23 Credit broking 79 108 328 382 491 Sales of insurance products 103 99 317 297 397 Real estate broking 277 273 900 861 1 121 Other commissions and fees 242 180 648 517 732 Total commission and fee income 2 357 2 103 7 002 6 328 8 628 Money transfers (563) (464) (1 592) (1 340) (1 795) Asset management services (3) (8) (15) Custodial services (33) (68) (128) (132) (172) Securities broking (38) (17) (110) (136) (176) Corporate finance (12) (12) (90) (54) (73) Interbank fees (12) (14) (36) (43) (57) Credit broking (4) (9) (11) (23) (26) Sale of insurance products (30) (31) (87) (87) (114) Other commissions and fees (158) (123) (430) (400) (567) Total commission and fee expenses (853) (738) (2 491) (2 214) (2 994) Net commission and fee income 1 503 1 364 4 511 4 114 5 634
24 / DNB BANK – THIRD QUARTER REPORT 2017 (UNAUDITED)

Note 7 Net gains on financial instruments at fair value
DNB Bank ASA 3rd quarter 3rd quarter January-September Full year Amounts in NOK million 2017 2016 2017 2016 2016 Dividends 11 4 76 93 124 Net gains on commercial paper and bonds (137) (864) (75) 285 (1 680) Net gains on shareholdings and equity-related derivatives 7 310 32 1 116 1 201 Net unrealised gains on basis swaps 22 136 420 136 649 Net gains on other financial instruments 1 250 2 693 3 742 4 513 8 541 Net gains on financial instruments at fair value 1 152 2 279 4 195 6 142 8 834 DNB Bank Group 3rd quarter 3rd quarter January-September Full year Amounts in NOK million 2017 2016 2017 2016 2016 Dividends 13 13 79 102 133 Net gains on commercial paper and bonds (143) (900) (88) 141 (1 815) Net gains on shareholdings and equity-related derivatives 46 313 91 277 361 Net unrealised gains on basis swaps (54) (444) (734) 171 (542) Net gains on other financial instruments 1 193 2 429 3 476 4 112 8 368 Net gains on financial instruments at fair value 1 056 1 411 2 824 4 803 6 506
DNB BANK – THIRD QUARTER REPORT 2017 (UNAUDITED) / 25

Note 8 Operating expenses
DNB Bank ASA 3rd quarter 3rd quarter January-September Full year Amounts in NOK million 2017 2016 2017 2016 2016 Salaries (1 625) (1 581) (4 704) (4 644) (6 138) Employer's national insurance contributions (301) (228) (902) (687) (968) Pension expenses (278) (272) (826) (805) (872) Restructuring expenses (25) (21) (261) (477) (656) Other personnel expenses (161) (152) (477) (455) (614) Total salaries and other personnel expenses (2 390) (2 254) (7 170) (7 067) (9 248) Fees 1) (408) (345) (1 316) (987) (1 474) IT expenses 1) (502) (488) (1 529) (1 494) (1 886) Postage and telecommunications (37) (41) (115) (132) (179) Office supplies (6) (5) (19) (18) (25) Marketing and public relations (101) (110) (410) (399) (567) Travel expenses (39) (33) (123) (108) (173) Reimbursement to Norway Post for transactions executed (49) (49) (147) (151) (198) Training expenses (11) (6) (38) (30) (49) Operating expenses on properties and premises (278) (277) (826) (848) (1 112) Operating expenses on machinery, vehicles and office equipment (17) (11) (46) (46) (63) Other operating expenses (134) (55) (485) (290) (391) Total other expenses (1 581) (1 420) (5 054) (4 503) (6 118) Depreciation and impairment of fixed and intangible assets (460) (406) (1 351) (1 429) (2 050) Total depreciation and impairment of fixed and intangible assets (460) (406) (1 351) (1 429) (2 050) Total operating expenses (4 431) (4 080) (13 575) (12 999) (17 417) DNB Bank Group 3rd quarter 3rd quarter January-September Full year Amounts in NOK million 2017 2016 2017 2016 2016 Salaries (2 013) (1 934) (5 887) (5 758) (7 622) Employer's national insurance contributions (361) (279) (1 076) (852) (1 190) Pension expenses (305) (300) (908) (884) (968) Restructuring expenses (31) (21) (267) (502) (693) Other personnel expenses (191) (177) (554) (538) (733) Total salaries and other personnel expenses (2 901) (2 711) (8 692) (8 534) (11 206) Fees 1) (435) (372) (1 388) (1 069) (1 575) IT expenses 1) (549) (540) (1 665) (1 652) (2 087) Postage and telecommunications (46) (52) (147) (166) (222) Office supplies (17) (18) (51) (54) (74) Marketing and public relations (160) (170) (611) (592) (804) Travel expenses (52) (43) (164) (144) (225) Reimbursement to Norway Post for transactions executed (49) (49) (147) (151) (198) Training expenses (14) (9) (48) (38) (61) Operating expenses on properties and premises (319) (315) (960) (970) (1 285) Operating expenses on machinery, vehicles and office equipment (23) (18) (65) (69) (92) Other operating expenses (261) (87) (649) (459) (585) Total other expenses (1 925) (1 671) (5 894) (5 365) (7 207) Depreciation and impairment of fixed and intangible assets (500) (462) (1 461) (1 610) (2 103) Total depreciation and impairment of fixed and intangible assets (500) (462) (1 461) (1 610) (2 103) Total operating expenses (5 325) (4 844) (16 048) (15 509) (20 516)
1) Fees also include system development fees and must be viewed relative to IT expenses.
26 / DNB BANK – THIRD QUARTER REPORT 2017 (UNAUDITED)

Note 9 Impairment of loans and guarantees
DNB Bank ASA 3rd quarter 3rd quarter January-September Full year Amounts in NOK million 2017 2016 2017 2016 2016
Write-offs (221) (69) (560) (516) (873) New/increased individual impairment (820) (1 253) (2 366) (3 302) (4 260) Total new/increased individual impairment (1 040) (1 322) (2 925) (3 817) (5 133) Reassessed individual impairment previous years 195 31 1 523 526 614 Recoveries on loans and guarantees previously written off 39 66 108 761 957 Net individual impairment (806) (1 226) (1 294) (2 530) (3 562) Change in collective impairment of loans 102 (292) 232 (1 105) (1 117) Impairment of loans and guarantees 1) (704) (1 517) (1 063) (3 636) (4 679) Write-offs covered by individual impairment made in previous years 400 206 1 483 1 025 1 278 1) Of which individual impairment of guarantees (27) (147) (43) (241) (346) DNB Bank Group 3rd quarter 3rd quarter January-September Full year Amounts in NOK million 2017 2016 2017 2016 2016 Write-offs (503) (103) (872) (904) (1 359) New/increased individual impairment (839) (1 663) (3 244) (4 391) (5 910) Total new/increased individual impairment (1 343) (1 767) (4 116) (5 295) (7 269) Reassessed individual impairment previous years 306 113 1 912 813 990 Recoveries on loans and guarantees previously written off 52 74 201 782 999 Net individual impairment (985) (1 580) (2 003) (3 700) (5 280) Change in collective impairment of loans 118 (596) (24) (1 971) (2 144) Impairment of loans and guarantees 1) (867) (2 176) (2 026) (5 672) (7 424) Write-offs covered by individual impairment made in previous years 864 464 2 470 1 954 2 803 1) Of which individual impairment of guarantees (26) (147) (43) (239) (344)
DNB BANK – THIRD QUARTER REPORT 2017 (UNAUDITED) / 27

Note 10 Loans to customers
DNB Bank ASA DNB Bank Group 30 Sept. 31 Dec. 30 Sept. 30 Sept. 31 Dec. 30 Sept.
2016 2016 2017 Amounts in NOK million 2017 2016 2016
Loans at amortised cost 639 921 639 628 669 439 Loans to customers, nominal amount 1 427 901 1 391 602 1 381 975 (5 982) (6 646) (6 154) Individual impairment (7 948) (8 566) (7 683)
633 940 632 982 663 286 Loans to customers, after individual impairment 1 419 953 1 383 036 1 374 292 1 305 1 214 1 238 Accrued interest and amortisation 1 791 1 791 2 022
(425) (374) (390) Individual impairment of accrued interest and amortisation (483) (494) (562)
(2 769) (2 787) (2 531) Collective impairment (4 389) (4 481) (4 205) 632 051 631 034 661 603 Loans to customers, at amortised cost 1 416 871 1 379 852 1 371 547
Loans at fair value 49 215 58 937 61 812 Loans to customers, nominal amount 107 150 111 742 106 711
53 63 45 Accrued interest 116 151 151 84 26 65 Adjustment to fair value 718 523 1 121
49 352 59 026 61 923 Loans to customers, at fair value 107 984 112 416 107 982 681 403 690 060 723 526 Loans to customers *) 1) 1 524 855 1 492 268 1 479 529
21 771 29 466 30 617 *) Of which repo trading volumes 30 617 29 466 21 771
1) Loans to customers in the Baltics were reclassified as assets held for sale in August 2016, and amounted to NOK 48 068 million at end-September 2017.
Note 11 Net impaired loans and guarantees for principal customer groups
DNB Bank ASA DNB Bank Group 30 Sept. 31 Dec. 30 Sept. 30 Sept. 31 Dec. 30 Sept.
2016 2016 2017 Amounts in NOK million 2017 2016 2016 1 226 1 074 1 290 Private individuals 2 348 2 281 2 463
1 414 2 081 1 223 Transportation by sea and pipelines and vessel construction 1 749 2 748 2 185
1 074 1 223 658 Real estate 1 221 1 826 1 710 2 284 2 405 958 Manufacturing 1 729 3 986 3 749
614 771 355 Services 393 797 645 415 728 357 Trade 412 790 486
3 109 3 625 2 853 Oil and gas 2 853 3 625 3 478 3 342 2 138 1 483 Transportation and communication 2 290 3 905 3 426
983 691 441 Building and construction 494 749 1 051 10 10 744 Power and water supply 1 383 386 105 10 44 17 Seafood 17 44 10 27 27 22 Hotels and restaurants 47 61 60 38 22 42 Agriculture and forestry 96 107 153 0 0 Central and local government 0 0
10 4 2 Other sectors 17 19 25 14 554 14 843 10 446 Total customers 15 050 21 323 19 546
Credit institutions 14 554 14 843 10 446 Total net impaired loans and guarantees 15 050 21 323 19 546
1 040 1 953 2 780 Non-performing loans and guarantees not subject to impairment 4 103 4 320 3 034
15 594 16 796 13 227 Total net non-performing and doubtful loans and guarantees 19 153 25 644 22 580
Includes loans and guarantees subject to individual impairment and total non-performing loans and guarantees not subject to impairment. The breakdown into principal customer groups corresponds to the EU's standard industrial classification, NACE Rev.2.
The DNB Bank Group figure includes volumes in the Baltics, reclassified as assets held for sale in August 2016, of which net non-performing and net doubtful loans and guarantees totalled NOK 1 880 million at end-September 2017.
28 / DNB BANK – THIRD QUARTER REPORT 2017 (UNAUDITED)

Note 12 Fair value of financial instruments at amortised cost
DNB Bank ASA 30 September 2017 30 September 2016 Carrying Fair Carrying Fair Amounts in NOK million amount value amount value Cash and deposits with central banks 9 218 9 218 2 755 2 755 Due from credit institutions 213 163 213 163 190 591 190 591 Loans to customers 661 603 665 898 632 051 635 007 Commercial paper and bonds, held to maturity 9 738 9 585 13 185 12 786 Total financial assets 893 722 897 865 838 582 841 139 Due to credit institutions 46 563 46 563 31 197 31 197 Deposits from customers 933 380 933 380 862 482 862 482 Securities issued 1) 138 632 142 198 166 099 168 111 Subordinated loan capital 1) 25 677 25 399 26 951 26 962 Total financial liabilities 1 144 252 1 147 540 1 086 729 1 088 753 DNB Bank Group 30 September 2017 30 September 2016 Carrying Fair Carrying Fair Amounts in NOK million amount value amount value Cash and deposits with central banks 9 873 9 873 3 125 3 125 Due from credit institutions 19 190 19 190 15 564 15 564 Loans to customers 1 416 871 1 421 959 1 371 547 1 374 954 Commercial paper and bonds, held to maturity 9 738 9 585 13 185 12 786 Total financial assets 1 455 672 1 460 607 1 403 420 1 406 428 Due to credit institutions 39 526 39 526 26 867 26 867 Deposits from customers 958 608 958 608 884 267 884 267 Securities issued 1) 488 668 497 613 542 416 548 611 Subordinated loan capital 1) 25 677 25 399 26 951 26 962 Total financial liabilities 1 512 480 1 521 146 1 480 501 1 486 707
1) Includes hedged liabilities.
DNB BANK – THIRD QUARTER REPORT 2017 (UNAUDITED) / 29

Note 13 Financial instruments at fair value
DNB Bank ASA Valuation Valuation based on Valuation based on quoted prices based on other than in an active observable observable market market data market data Amounts in NOK million Level 1 Level 2 Level 3 Total
Assets as at 30 September 2017 Deposits with central banks 315 969 315 969 Due from credit institutions 305 511 305 511 Loans to customers 48 752 13 171 61 923 Commercial paper and bonds at fair value 43 448 149 982 416 193 845 Shareholdings 5 132 254 536 5 922 Financial derivatives 131 143 583 1 236 144 949
Liabilities as at 30 September 2017 Due to credit institutions 296 261 296 261 Deposits from customers 61 287 61 287 Debt securities issued 193 533 193 533 Subordinated loan capital 2 876 2 876 Financial derivatives 150 162 438 975 163 563 Other financial liabilities 1) 4 020 61 4 081 DNB Bank ASA Valuation Valuation based on Valuation based on quoted prices based on other than in an active observable observable market market data market data Amounts in NOK million Level 1 Level 2 Level 3 Total
Assets as at 30 September 2016 Deposits with central banks 172 088 172 088 Due from credit institutions 360 157 360 157 Loans to customers 32 369 16 983 49 352 Commercial paper and bonds at fair value 51 067 162 175 199 213 441 Shareholdings 3 306 249 690 4 245 Financial derivatives 0 198 105 1 238 199 343
Liabilities as at 30 September 2016 Due to credit institutions 290 130 290 130 Deposits from customers 45 489 45 489 Debt securities issued 166 130 166 130 Subordinated loan capital 1 251 1 251 Financial derivatives 0 204 519 1 000 205 520 Other financial liabilities 1) 2 809 30 2 839
1) Short positions, trading activities.
30 / DNB BANK – THIRD QUARTER REPORT 2017 (UNAUDITED)

Note 13 Financial instruments at fair value (continued) DNB Bank Group Valuation Valuation based on Valuation based on quoted prices based on other than in an active observable observable market market data market data Amounts in NOK million Level 1 Level 2 Level 3 Total
Assets as at 30 September 2017 Deposits with central banks 315 969 315 969 Due from credit institutions 135 492 135 492 Loans to customers 48 752 59 232 107 984 Commercial paper and bonds at fair value 48 709 140 261 416 189 386 Shareholdings 6 009 260 599 6 867 Financial derivatives 131 128 978 1 236 130 345
Liabilities as at 30 September 2017 Due to credit institutions 206 531 206 531 Deposits from customers 61 287 61 287 Debt securities issued 269 335 269 335 Subordinated loan capital 2 876 2 876 Financial derivatives 150 107 018 975 108 143 Other financial liabilities 1) 4 020 61 4 081 DNB Bank Group Valuation Valuation based on Valuation based on quoted prices based on other than in an active observable observable market market data market data Amounts in NOK million Level 1 Level 2 Level 3 Total
Assets as at 30 September 2016 Deposits with central banks 172 088 172 088 Due from credit institutions 176 092 176 092 Loans to customers 32 369 75 613 107 982 Commercial paper and bonds at fair value 53 763 158 531 199 212 494 Shareholdings 4 113 254 843 5 211 Financial derivatives 0 185 602 1 238 186 840
Liabilities as at 30 September 2016 Due to credit institutions 165 397 165 397 Deposits from customers 45 489 45 489 Debt securities issued 244 407 244 407 Subordinated loan capital 1 251 1 251 Financial derivatives 0 155 188 1 000 156 188 Other financial liabilities 1) 2 809 30 2 839
1) Short positions, trading activities. For a further description of the instruments and valuation techniques, see the annual report for 2016.
DNB BANK – THIRD QUARTER REPORT 2017 (UNAUDITED) / 31

Note 13 Financial instruments at fair value (continued) Financial instruments at fair value, level 3 DNB Bank ASA Financial Financial assets liabilities Commercial Loans to paper and Share- Financial Financial Amounts in NOK million customers bonds holdings derivatives derivatives Carrying amount as at 31 December 2016 16 052 375 799 1 319 1 062 Net gains recognised in the income statement 29 (33) 27 (161) (121) Additions/purchases 1 747 264 53 570 490 Sales (925) (248) (263) Settled (3 732) (481) (466) Transferred from level 1 or level 2 81 Transferred to level 1 or level 2 (25) (80) Other 2 (11) 9 Carrying amount as at 30 September 2017 13 171 416 536 1 236 975 Financial instruments at fair value, level 3 DNB Bank Group Financial Financial assets liabilities Commercial Loans to paper and Share- Financial Financial Amounts in NOK million customers bonds holdings derivatives derivatives Carrying amount as at 31 December 2016 69 442 375 946 1 319 1 062 Net gains recognised in the income statement 168 (33) 51 (161) (121) Additions/purchases 4 264 264 53 570 490 Sales (248) (372) Settled (14 642) 0 (481) (466) Transferred from level 1 or level 2 81 Transferred to level 1 or level 2 (25) (80) Other 2 (11) 9 Carrying amount as at 30 September 2017 59 232 416 599 1 236 975
32 / DNB BANK – THIRD QUARTER REPORT 2017 (UNAUDITED)

Note 13 Financial instruments at fair value (continued) DNB Bank ASA Breakdown of fair value, level 3 DNB Bank Group
30 Sept. 2017 30 Sept. 2017 Commercial Commercial
Share- paper and Loans to Loans to paper and Share- holdings bonds customers Amounts in NOK million customers bonds holdings
485 441 13 074 Principal amount/purchase price 58 412 441 503 51 (25) 63 Fair value adjustment 1) 716 (25) 96
34 Accrued interest 104 536 416 13 171 Carrying amount 59 232 416 599
1) Changes in the fair value of customer loans mainly result from changes in swap rates. A corresponding negative adjustment is made in the fair value of financial instruments used for financial hedging.
DNB Bank ASA Breakdown of shareholdings, level 3 DNB Bank Group
Private Private Equity (PE) Unquoted Unquoted Equity (PE)
Total Other funds equities Amounts in NOK million equities funds Other Total
536 19 209 308 Carrying amount as at 30 September 2017 371 209 19 599
DNB Bank ASA Sensitivity analysis, level 3 DNB Bank Group
Effect of reasonably Effect of reasonably possible alternative Carrying amount Carrying amount possible alternative
assumptions 30 Sept. 2017 Amounts in NOK million 30 Sept. 2017 assumptions (25) 13 171 Loans to customers 59 232 (130) (2) 416 Commercial paper and bonds 416 (2) 536 Shareholdings 599 261 Financial derivatives, net 261
In order to show the sensitivity of the loan portfolio, the discount rate on fixed-rate loans and the margin requirement on margin-based loans have been increased by 10 basis points.
Level 3 bonds mainly represent investments in Norwegian industries and power companies. A 10 basis point increase in the discount rate has had insignificant effects.
DNB BANK – THIRD QUARTER REPORT 2017 (UNAUDITED) / 33

Note 14 Commercial paper and bonds, held to maturity
DNB Bank ASA DNB Bank Group 30 Sept. 31 Dec. 30 Sept. 30 Sept. 31 Dec. 30 Sept.
2016 2016 2017 Amounts in NOK million 2017 2016 2016 13 185 12 760 9 738 International bond portfolio 9 738 12 760 13 185
13 185 12 760 9 738 Commercial paper and bonds, held to maturity 9 738 12 760 13 185
As part of ongoing liquidity management, DNB Bank has invested in a portfolio of securities. The portfolio can be used to regulate the liquidity requirement and as a basis for furnishing collateral for operations in various countries. Among other things, the securities serve as collateral for short and long-term borrowing in a number of central banks and as a basis for liquidity buffers to meet regulatory requirements. With effect from 1 July 2008, the international bond portfolio was reclassified from the category "fair value through profit or loss" to "held-to-maturity investments". In the period following the reclassification some additional investments were classified as held-to-maturity. Portfolios in this category are recorded at amortised cost and written down if there is objective evidence of a decrease in value. Effects of the reclassifications of the international bond portfolio By measuring the portfolio at amortised cost, the value of the portfolio as at 30 September 2017 was NOK 0.2 billion higher than if the previous valuation principle had been retained. On the reclassification date, the carrying amount of the portfolio was NOK 88.0 billion, compared with NOK 8.3 billion at end-September 2017. The average term to maturity of the portfolio was 5.0 years, and the change in value resulting from a credit spread adjustment of one basis point was NOK 4.0 million at end-September 2017. Effects on profits of the reclassification DNB Bank Group 3rd quarter 3rd quarter January-September Full year Amounts in NOK million 2017 2016 2017 2016 2016 Recorded amortisation effect 19 31 87 65 84 Net gain, if valued at fair value 65 319 282 383 448 Effects of reclassification on profits (46) (288) (195) (317) (364) Effects on the balance sheet of the reclassification DNB Bank Group 30 Sept. 31 Dec. 30 Sept. Amounts in NOK million 2017 2016 2016 Recorded unrealised losses 231 318 337 Unrealised losses, if valued at fair value 383 665 730 Effects of reclassification on the balance sheet 152 347 394 Development in the portfolio after the reclassification DNB Bank Group 30 Sept. 31 Dec. 30 Sept. Amounts in NOK million 2017 2016 2016 Reclassified portfolio, carrying amount 8 275 10 414 10 712 Reclassified portfolio, if valued at fair value 8 123 10 067 10 319 Effects of reclassification on the balance sheet 152 347 394
34 / DNB BANK – THIRD QUARTER REPORT 2017 (UNAUDITED)

Note 15 Assets and liabilities held for sale
On 25 August 2016, DNB and Nordea announced an agreement to combine their operations in Estonia, Latvia and Lithuania. The transaction was closed on 1 October 2017. DNB’s ownership interest in Luminor Group AB of approximately 44 per cent will be consolidated by the equity method with effect from 1 October 2017.
At end-September 2017 all assets and liabilities related to DNB’s Baltic operations were presented as held for sale, while there were no changes in the presentation in the income statement. The capital adequacy reporting was not affected. No impairment loss has been recognised in the income statement following the reclassification. The subsidiaries are part of DNB’s Large corporates and international customers segment.
The table below shows consolidated balance sheet amounts reclassified as assets and liabilities held for sale. DNB Baltics 30 Sept. Amounts in NOK million 2017
Assets Cash and deposits with central banks 11 432 Due from credit institutions 5 733 Loans to customers 48 068 Commercial paper and bonds at fair value 1 581 Shareholdings 470 Financial derivatives 68 Investment properties 406 Intangible assets 63 Deferred tax assets 110 Fixed assets 385 Other assets 2 001 Total assets 70 318
Liabilities Due to credit institutions 4 347 Deposits from customers 38 260 Financial derivatives 163 Payable taxes 29 Other liabilities 8 191 Provisions 3 Total liabilities 50 993
DNB BANK – THIRD QUARTER REPORT 2017 (UNAUDITED) / 35

Note 16 Debt securities issued and subordinated loan capital
As an element in liquidity management, the DNB Bank Group issues and redeems own securities. Debt securities issued DNB Bank ASA Balance Exchange Balance sheet Matured/ rate Other sheet 30 Sept. Issued redeemed movements adjustments 31 Dec. Amounts in NOK million 2017 2017 2017 2017 2017 2016 Commercial paper issued, nominal amount 182 764 1 363 065 (1 327 338) (6 379) 153 415 Bond debt, nominal amount 141 500 2 762 (35 592) 962 173 368 Adjustments 7 901 (2 257) 10 158 Total debt securities issued 332 165 1 365 828 (1 362 930) (5 417) (2 257) 336 941 Debt securities issued DNB Bank ASA Balance Exchange Balance sheet Matured/ rate Other sheet 30 Sept. Issued redeemed movements adjustments 31 Dec. Amounts in NOK million 2016 2016 2016 2016 2016 2015 Commercial paper issued, nominal amount 147 687 8 670 881 (8 670 495) (12 687) 159 988 Bond debt, nominal amount 172 901 26 744 (11 663) (10 157) 167 978 Adjustments 11 640 (493) 12 133 Total debt securities issued 332 229 8 697 625 (8 682 158) (22 844) (493) 340 099 Debt securities issued DNB Bank Group Balance Exchange Balance sheet Matured/ rate Other sheet 30 Sept. Issued redeemed movements adjustments 31 Dec. Amounts in NOK million 2017 2017 2017 2017 2017 2016 Commercial paper issued, nominal amount 182 764 1 363 065 (1 327 338) (6 379) 153 415 Bond debt, nominal amount 1) 550 035 48 051 (87 421) 7 958 581 447 Adjustments 25 204 (7 684) 32 888 Total debt securities issued 758 003 1 411 117 (1 414 759) 1 579 (7 684) 767 750 Debt securities issued DNB Bank Group Balance Exchange Balance sheet Matured/ rate Other sheet 30 Sept. Issued redeemed movements adjustments 31 Dec. Amounts in NOK million 2016 2016 2016 2016 2016 2015 Commercial paper issued, nominal amount 147 687 8 670 881 (8 670 495) (12 687) 159 988 Bond debt, nominal amount 1) 599 424 83 450 (56 126) (35 904) 608 004 Adjustments 39 712 894 38 819 Total debt securities issued 786 823 8 754 331 (8 726 620) (48 591) 894 806 810 1) Minus own bonds. The total nominal amount of outstanding covered bonds in DNB Boligkreditt was NOK 418.1 billion as at 30 September 2017. The
market value of the cover pool represented NOK 616.0 billion.
36 / DNB BANK – THIRD QUARTER REPORT 2017 (UNAUDITED)

Note 16 Debt securities issued and subordinated loan capital (continued)
Subordinated loan capital and perpetual subordinated loan capital securities DNB Bank ASA Balance Exchange Balance sheet Matured/ rate Other sheet 30 Sept. Issued redeemed movements adjustments 31 Dec. Amounts in NOK million 2017 2017 2017 2017 2017 2016 Term subordinated loan capital, nominal amount 23 123 10 106 (6 812) 414 19 415 Perpetual subordinated loan capital, nominal amount 5 216 (386) 5 602 Perpetual subordinated loan capital securities, nominal amount (3 732) 3 732 Adjustments 215 (384) 599 Total subordinated loan capital and perpetual subordinated loan capital securities 28 554 10 106 (10 544) 28 (384) 29 347 Subordinated loan capital and perpetual subordinated loan capital securities DNB Bank ASA Balance Exchange Balance sheet Matured/ rate Other sheet 30 Sept. Issued redeemed movements adjustments 31 Dec. Amounts in NOK million 2016 2016 2016 2016 2016 2015 Term subordinated loan capital, nominal amount 18 424 (3) (1 411) 19 838 Perpetual subordinated loan capital, nominal amount 5 310 (392) 5 702 Perpetual subordinated loan capital securities, nominal amount 3 635 (926) 4 561 Adjustments 834 (19) 853 Total subordinated loan capital and perpetual subordinated loan capital securities 28 202 (3) (2 729) (19) 30 953 Subordinated loan capital and perpetual subordinated loan capital securities DNB Bank Group Balance Exchange Balance sheet Matured/ rate Other sheet 30 Sept. Issued redeemed movements adjustments 31 Dec. Amounts in NOK million 2017 2017 2017 2017 2017 2016 Term subordinated loan capital, nominal amount 23 123 10 106 (6 812) 414 19 415 Perpetual subordinated loan capital, nominal amount 5 216 (386) 5 602 Perpetual subordinated loan capital securities, nominal amount (3 732) 3 732 Adjustments 215 (384) 599 Total subordinated loan capital and perpetual subordinated loan capital securities 28 554 10 106 (10 544) 28 (384) 29 347 Subordinated loan capital and perpetual subordinated loan capital securities DNB Bank Group Balance Exchange Balance sheet Matured/ rate Other sheet 30 Sept. Issued redeemed movements adjustments 31 Dec. Amounts in NOK million 2016 2016 2016 2016 2016 2015 Term subordinated loan capital, nominal amount 18 424 (3) (1 411) 19 838 Perpetual subordinated loan capital, nominal amount 5 310 (392) 5 702 Perpetual subordinated loan capital securities, nominal amount 3 635 (926) 4 561 Adjustments 834 (19) 853 Total subordinated loan capital and perpetual subordinated loan capital securities 28 202 (3) (2 729) (19) 30 953
DNB BANK – THIRD QUARTER REPORT 2017 (UNAUDITED) / 37

Note 17 Information on related parties DNB Boligkreditt AS In the first three quarters of 2017, portfolios representing NOK 9.9 billion were transferred in accordance with the ”Agreement relating to transfer of loan portfolio between DNB Bank ASA and DNB Boligkreditt AS”.
At end-September 2017 the bank had invested NOK 9.9 billion in covered bonds issued by DNB Boligkreditt. The management fee paid to the bank for purchased services amounted to NOK 748 million at end-September 2017 (NOK 1 907 million in 2016). In the first three quarters of 2017 DNB Boligkreditt entered into reverse repurchasing agreements (reverse repos) with the bank as counterparty. The value of the repos amounted to NOK 6.2 billion at end-September 2017. The company has a long-term overdraft facility in DNB Bank ASA with a limit of NOK 190 billion. DNB Næringskreditt AS At end-September 2017, loans with a total value of NOK 1.9 billion had been transferred from the bank to DNB Næringskreditt in accordance with the ”Agreement relating to transfer of loan portfolio between DNB Bank ASA and DNB Næringskreditt AS”. The management fee paid to the bank for purchased services amounted to NOK 71 million at end-September 2017 (NOK 55 million in 2016). At end-September 2017 DNB Næringskreditt entered into reverse repurchase agreements (reverse repos) with the bank as counterparty. The value of the repos amounted to NOK 108 million at end-September 2017. The company has a long-term overdraft facility in DNB Bank ASA with a limit of NOK 30 billion. DNB Livsforsikring AS At end-September 2017 DNB Livsforsikring’s holding of DNB Boligkreditt bonds was valued at NOK 1.9 billion. During the first three quarters of the year, home mortgages for a total of just over NOK 1 billion were sold from DNB Livsforsikring AS to DNB Bank ASA.
38 / DNB BANK – THIRD QUARTER REPORT 2017 (UNAUDITED)

Note 18 Off-balance sheet transactions
DNB Bank ASA Off-balance sheet transactions and additional information DNB Bank Group
30 Sept. 31 Dec. 30 Sept. 30 Sept. 31 Dec. 30 Sept. 2016 2016 2017 Amounts in NOK million 2017 2016 2016
29 048 29 930 25 545 Performance guarantees 26 734 30 900 29 933 33 931 32 547 31 712 Payment guarantees 33 567 34 472 35 399 16 293 17 979 17 881 Loan guarantees 17 796 17 898 16 212 6 538 6 535 5 930 Guarantees for taxes etc. 5 954 6 557 6 558 2 219 2 213 2 278 Other guarantee commitments 2 819 2 714 2 696
88 029 89 205 83 346 Total guarantee commitments 86 871 92 541 90 799 Support agreements 6 097 6 106 11 096
88 029 89 205 83 346 Total guarantee commitments etc. *) 92 968 98 647 101 894 461 908 479 792 472 625 Unutilised credit lines and loan offers 598 135 606 122 606 076
3 024 3 861 3 542 Documentary credit commitments 3 613 3 948 3 165 Other commitments 229 37 101
464 933 483 653 476 167 Total commitments 601 977 610 107 609 342
552 961 572 858 559 513 Total guarantee and off-balance commitments 694 945 708 754 711 237
9 446 9 322 7 900 Pledged securities
*) Of which counter-guaranteed by financial institutions 302 326 290
DNB BANK – THIRD QUARTER REPORT 2017 (UNAUDITED) / 39
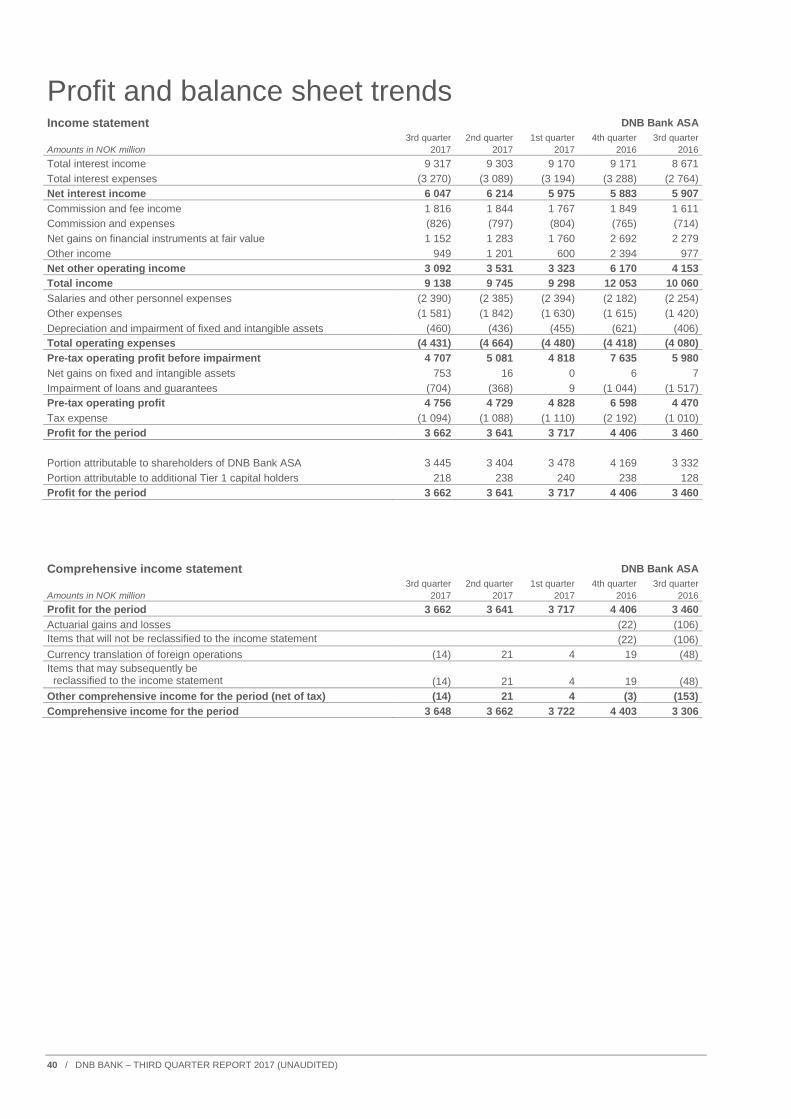
Profit and balance sheet trends
Income statement DNB Bank ASA 3rd quarter 2nd quarter 1st quarter 4th quarter 3rd quarter Amounts in NOK million 2017 2017 2017 2016 2016 Total interest income 9 317 9 303 9 170 9 171 8 671 Total interest expenses (3 270) (3 089) (3 194) (3 288) (2 764) Net interest income 6 047 6 214 5 975 5 883 5 907 Commission and fee income 1 816 1 844 1 767 1 849 1 611 Commission and expenses (826) (797) (804) (765) (714) Net gains on financial instruments at fair value 1 152 1 283 1 760 2 692 2 279 Other income 949 1 201 600 2 394 977 Net other operating income 3 092 3 531 3 323 6 170 4 153 Total income 9 138 9 745 9 298 12 053 10 060 Salaries and other personnel expenses (2 390) (2 385) (2 394) (2 182) (2 254) Other expenses (1 581) (1 842) (1 630) (1 615) (1 420) Depreciation and impairment of fixed and intangible assets (460) (436) (455) (621) (406) Total operating expenses (4 431) (4 664) (4 480) (4 418) (4 080) Pre-tax operating profit before impairment 4 707 5 081 4 818 7 635 5 980 Net gains on fixed and intangible assets 753 16 0 6 7 Impairment of loans and guarantees (704) (368) 9 (1 044) (1 517) Pre-tax operating profit 4 756 4 729 4 828 6 598 4 470 Tax expense (1 094) (1 088) (1 110) (2 192) (1 010) Profit for the period 3 662 3 641 3 717 4 406 3 460 Portion attributable to shareholders of DNB Bank ASA 3 445 3 404 3 478 4 169 3 332 Portion attributable to additional Tier 1 capital holders 218 238 240 238 128 Profit for the period 3 662 3 641 3 717 4 406 3 460
Comprehensive income statement DNB Bank ASA 3rd quarter 2nd quarter 1st quarter 4th quarter 3rd quarter Amounts in NOK million 2017 2017 2017 2016 2016 Profit for the period 3 662 3 641 3 717 4 406 3 460 Actuarial gains and losses (22) (106) Items that will not be reclassified to the income statement (22) (106) Currency translation of foreign operations (14) 21 4 19 (48) Items that may subsequently be reclassified to the income statement (14) 21 4 19 (48) Other comprehensive income for the period (net of tax) (14) 21 4 (3) (153) Comprehensive income for the period 3 648 3 662 3 722 4 403 3 306
40 / DNB BANK – THIRD QUARTER REPORT 2017 (UNAUDITED)
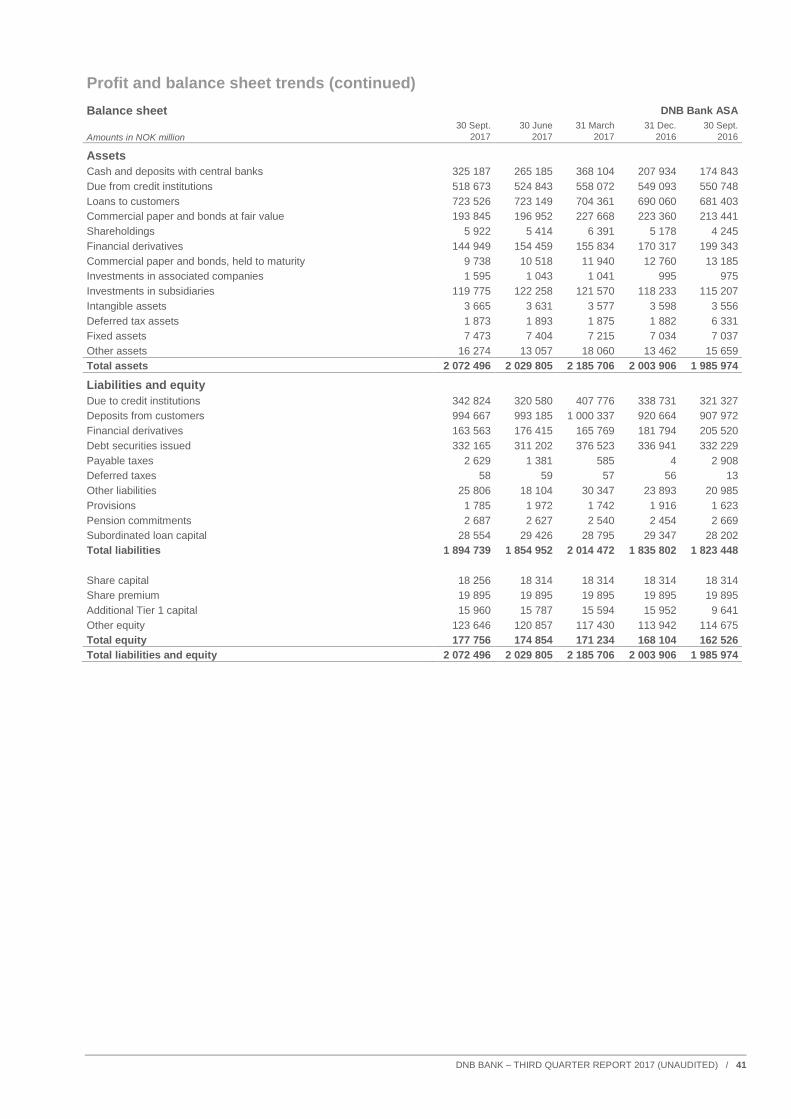
Profit and balance sheet trends (continued) Balance sheet DNB Bank ASA 30 Sept. 30 June 31 March 31 Dec. 30 Sept. Amounts in NOK million 2017 2017 2017 2016 2016
Assets Cash and deposits with central banks 325 187 265 185 368 104 207 934 174 843 Due from credit institutions 518 673 524 843 558 072 549 093 550 748 Loans to customers 723 526 723 149 704 361 690 060 681 403 Commercial paper and bonds at fair value 193 845 196 952 227 668 223 360 213 441 Shareholdings 5 922 5 414 6 391 5 178 4 245 Financial derivatives 144 949 154 459 155 834 170 317 199 343 Commercial paper and bonds, held to maturity 9 738 10 518 11 940 12 760 13 185 Investments in associated companies 1 595 1 043 1 041 995 975 Investments in subsidiaries 119 775 122 258 121 570 118 233 115 207 Intangible assets 3 665 3 631 3 577 3 598 3 556 Deferred tax assets 1 873 1 893 1 875 1 882 6 331 Fixed assets 7 473 7 404 7 215 7 034 7 037 Other assets 16 274 13 057 18 060 13 462 15 659 Total assets 2 072 496 2 029 805 2 185 706 2 003 906 1 985 974
Liabilities and equity Due to credit institutions 342 824 320 580 407 776 338 731 321 327 Deposits from customers 994 667 993 185 1 000 337 920 664 907 972 Financial derivatives 163 563 176 415 165 769 181 794 205 520 Debt securities issued 332 165 311 202 376 523 336 941 332 229 Payable taxes 2 629 1 381 585 4 2 908 Deferred taxes 58 59 57 56 13 Other liabilities 25 806 18 104 30 347 23 893 20 985 Provisions 1 785 1 972 1 742 1 916 1 623 Pension commitments 2 687 2 627 2 540 2 454 2 669 Subordinated loan capital 28 554 29 426 28 795 29 347 28 202 Total liabilities 1 894 739 1 854 952 2 014 472 1 835 802 1 823 448 Share capital 18 256 18 314 18 314 18 314 18 314 Share premium 19 895 19 895 19 895 19 895 19 895 Additional Tier 1 capital 15 960 15 787 15 594 15 952 9 641 Other equity 123 646 120 857 117 430 113 942 114 675 Total equity 177 756 174 854 171 234 168 104 162 526 Total liabilities and equity 2 072 496 2 029 805 2 185 706 2 003 906 1 985 974
DNB BANK – THIRD QUARTER REPORT 2017 (UNAUDITED) / 41

Profit and balance sheet trends (continued) Income statement DNB Bank Group 3rd quarter 2nd quarter 1st quarter 4th quarter 3rd quarter Amounts in NOK million 2017 2017 2017 2016 2016 Total interest income 13 783 13 837 13 359 13 409 13 107 Total interest expenses (4 646) (4 692) (4 717) (4 911) (4 513) Net interest income 9 137 9 146 8 642 8 498 8 594 Commission and fee income 2 357 2 358 2 286 2 300 2 103 Commission and fee expenses (853) (819) (819) (780) (738) Net gains on financial instruments at fair value 1 056 958 811 1 703 1 411 Profit from investments accounted for by the equity method (17) 23 (45) (45) (0) Net gains on investment properties (3) (14) 14 (7) (5) Other income 523 527 457 377 518 Net other operating income 3 062 3 034 2 705 3 547 3 288 Total income 12 199 12 179 11 347 12 045 11 882 Salaries and other personnel expenses (2 901) (2 902) (2 889) (2 672) (2 711) Other expenses (1 925) (2 107) (1 862) (1 842) (1 671) Depreciation and impairment of fixed and intangible assets (500) (466) (496) (493) (462) Total operating expenses (5 325) (5 476) (5 247) (5 007) (4 844) Pre-tax operating profit before impairment 6 873 6 704 6 100 7 038 7 038 Net gains on fixed and intangible assets 750 17 6 (12) 20 Impairment of loans and guarantees (867) (597) (562) (1 753) (2 176) Pre-tax operating profit 6 756 6 124 5 544 5 273 4 881 Tax expense (1 554) (1 409) (1 275) (312) (1 074) Profit from operations held for sale, after taxes 33 (14) (17) 26 1 Profit for the period 5 235 4 702 4 252 4 988 3 808 Portion attributable to shareholders of DNB Bank ASA 5 018 4 464 4 012 4 750 3 680 Portion attributable to additional Tier 1 capital holders 218 238 240 238 128 Profit for the period 5 235 4 702 4 252 4 988 3 808
Comprehensive income statement DNB Bank Group 3rd quarter 2nd quarter 1st quarter 4th quarter 3rd quarter Amounts in NOK million 2017 2017 2017 2016 2016 Profit for the period 5 235 4 702 4 252 4 988 3 808 Actuarial gains and losses (35) (106) Items that will not be reclassified to the income statement (35) (106) Currency translation of foreign operations 1) (2 974) 892 530 3 561 (4 320) Currency translation reserve reclassified to the income statement Hedging of net investment 2) 1 894 (516) (252) (2 415) 2 950 Investments according to the equity method 3) 20 12 87 4 4 Items that may subsequently be reclassified to the income statement (1 061) 388 365 1 150 (1 366) Other comprehensive income for the period (net of tax) (1 061) 388 365 1 115 (1 472) Comprehensive income for the period 4 174 5 090 4 617 6 103 2 337
1) Currency translation effects related to the Baltics represented a loss of NOK 163 million in the third quarter of 2017. 2) Hedging of net investments in the Baltics represented a gain of NOK 92 million in the third quarter of 2017, net of tax. 3) DNB had indirect ownership interests in Visa Europe through its membership in Visa Norge. In connection with the valuation of the holdings in Visa Europe
as at 31 March 2016 an accumulated gain of NOK 855 million was recognised in other comprehensive income. Upon the completion of the acquisition of Visa Europe by Visa Inc in the second quarter of 2016, this amount was reclassified to profit and a total gain of NOK 1 128 million was recognised as "Profit from investments accounted for by the equity method" in the income statement.
42 / DNB BANK – THIRD QUARTER REPORT 2017 (UNAUDITED)
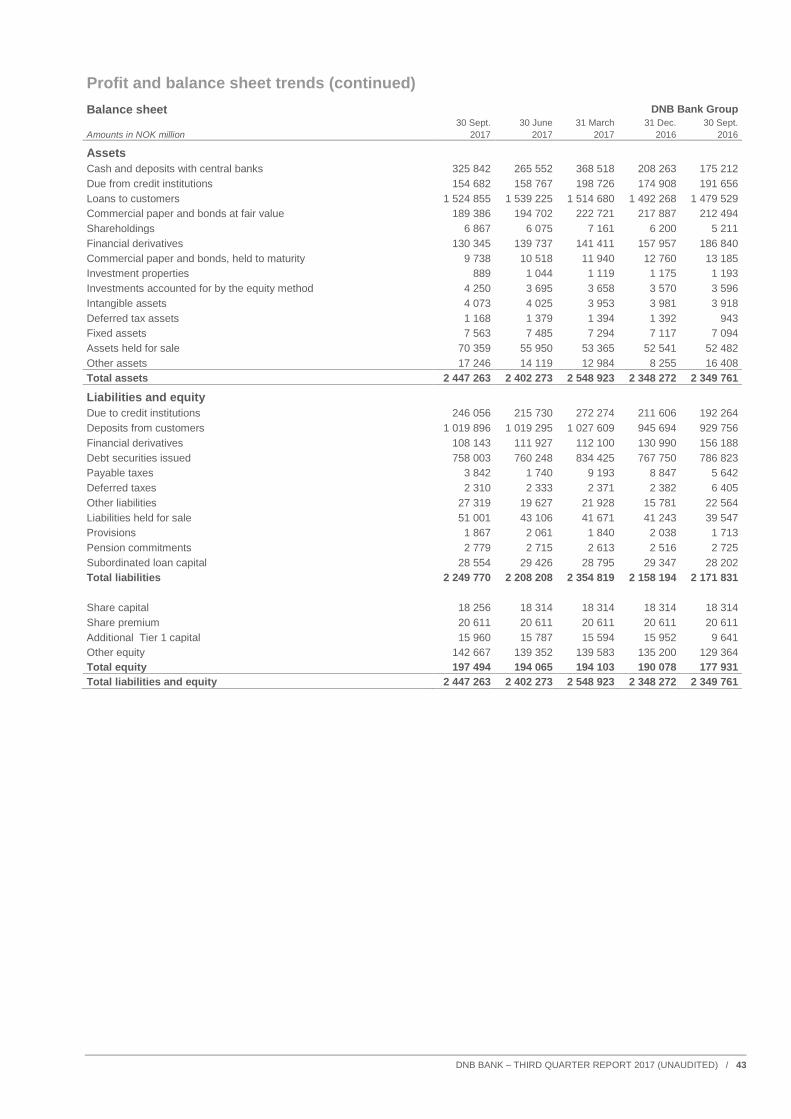
Profit and balance sheet trends (continued) Balance sheet DNB Bank Group 30 Sept. 30 June 31 March 31 Dec. 30 Sept. Amounts in NOK million 2017 2017 2017 2016 2016
Assets Cash and deposits with central banks 325 842 265 552 368 518 208 263 175 212 Due from credit institutions 154 682 158 767 198 726 174 908 191 656 Loans to customers 1 524 855 1 539 225 1 514 680 1 492 268 1 479 529 Commercial paper and bonds at fair value 189 386 194 702 222 721 217 887 212 494 Shareholdings 6 867 6 075 7 161 6 200 5 211 Financial derivatives 130 345 139 737 141 411 157 957 186 840 Commercial paper and bonds, held to maturity 9 738 10 518 11 940 12 760 13 185 Investment properties 889 1 044 1 119 1 175 1 193 Investments accounted for by the equity method 4 250 3 695 3 658 3 570 3 596 Intangible assets 4 073 4 025 3 953 3 981 3 918 Deferred tax assets 1 168 1 379 1 394 1 392 943 Fixed assets 7 563 7 485 7 294 7 117 7 094 Assets held for sale 70 359 55 950 53 365 52 541 52 482 Other assets 17 246 14 119 12 984 8 255 16 408 Total assets 2 447 263 2 402 273 2 548 923 2 348 272 2 349 761
Liabilities and equity Due to credit institutions 246 056 215 730 272 274 211 606 192 264 Deposits from customers 1 019 896 1 019 295 1 027 609 945 694 929 756 Financial derivatives 108 143 111 927 112 100 130 990 156 188 Debt securities issued 758 003 760 248 834 425 767 750 786 823 Payable taxes 3 842 1 740 9 193 8 847 5 642 Deferred taxes 2 310 2 333 2 371 2 382 6 405 Other liabilities 27 319 19 627 21 928 15 781 22 564 Liabilities held for sale 51 001 43 106 41 671 41 243 39 547 Provisions 1 867 2 061 1 840 2 038 1 713 Pension commitments 2 779 2 715 2 613 2 516 2 725 Subordinated loan capital 28 554 29 426 28 795 29 347 28 202 Total liabilities 2 249 770 2 208 208 2 354 819 2 158 194 2 171 831 Share capital 18 256 18 314 18 314 18 314 18 314 Share premium 20 611 20 611 20 611 20 611 20 611 Additional Tier 1 capital 15 960 15 787 15 594 15 952 9 641 Other equity 142 667 139 352 139 583 135 200 129 364 Total equity 197 494 194 065 194 103 190 078 177 931 Total liabilities and equity 2 447 263 2 402 273 2 548 923 2 348 272 2 349 761
DNB BANK – THIRD QUARTER REPORT 2017 (UNAUDITED) / 43

Alternative performance measures The banking group’s alternative performance measures (APMs) present useful information which supplements the financial statements. These measures are not defined under IFRS and may not be directly comparable with other companies’ adjusted measures. The APMs are not intended to be a substitute for, or superior to, any IFRS measures of performance, but have been included to provide insight into DNB’s performance and represent important measures for how management governs the company and its business activities.
Key financial ratios regulated by IFRS or other legislation (CRR/CRD) are not considered APMs, neither are non-financial data. The banking group’s APMs are presented in the financial highlights and in the directors' report. APMs are shown with comparable figures for earlier periods. The banking group’s APMs and definitions Return on equity (ROE), and Return on allocated capital These measures give relevant information on the banking group’s profitability by measuring the ability to generate profits from the shareholders’ investments. ROE is one of DNB’s main financial targets. Return on allocated capital is used to assess the profitability of the segments in relation to their use of capital and ensures that the returns achieved by the various segments are measured on a comparable basis.
Return on equity (ROE) is calculated as: Shareholders’ share of profits for the period divided by average equity excluding additional Tier 1 capital.
Return on allocated capital is calculated as: Profit for the period divided by allocated capital. Allocated capital for the segments is based on DNB’s capital adequacy requirement for credit risk, market risk and operational risk. See also note 2 Segments.
Average interest rate spreads These measures give relevant information on the banking group’s net interest income by measuring the respective average interest rate relative to the 3-month money market rate.
Average spread for ordinary lending to customers is calculated as: Margin income on performing loans relative to average performing loans for the period. Margin income is defined as interest income on the loans less funding costs corresponding to the 3-month money market rate.
Average spread for deposits from customers is calculated as: Margin income on deposits relative to average deposits for the period. Margin income on deposits is defined as estimated interest income on the deposits based on the 3-month money market rate less interest expenses on the deposits.
Combined weighted average interest spread for lending to and deposits from customers is calculated as: Total margin income on loans and deposits relative to total average performing loans and deposits.
Net non-performing and net doubtful loans and guarantees in per cent of net loans, Impairment relative to average net loans to customers and Individual impairment relative to average net loans to customers These ratios are included to show the banking group’s provisions relating to credit exposure.
Calculated as: Net non-performing and net doubtful loans plus guarantees divided by net loans.
Calculated as: Impairment divided by average net loans to customers, annualised.
Calculated as: Individual impairment divided by average net loans to customers, annualised. Ratio of customer deposits to net loans to customers at end of period, also adjusted for short-term money market deposits These measures give relevant information on the banking group’s liquidity position.
Calculated as: Customer deposits divided by net loans to customers at the end of the period. Customer deposits minus short-term money market deposits divided by net loans to customers at the end of the period.
Cost/income ratio This ratio is included to provide information on the correlation between income and expenses and is considered to be one of DNB’s key financial targets.
Calculated as: Total operating expenses divided by total income.
44 / DNB BANK – THIRD QUARTER REPORT 2017 (UNAUDITED)

Information about the DNB Bank Group Head office DNB ASA Mailing address P.O.Box 1600 Sentrum, NO-0021 Oslo Visiting address Dronning Eufemias gate 30, Oslo Telephone +47 915 04800 Internet dnb.no Organisation number Register of Business Enterprises NO 981 276 957 MVA DNB Bank ASA Organisation number Register of Business Enterprises NO 984 851 006 MVA Board of Directors in DNB Bank ASA Anne Carine Tanum, chairman Gro Bakstad, vice-chairman Lilliam Hattrem Kim Wahl Investor Relations Kjerstin Braathen, chief financial officer tel. +47 9056 6848 [email protected] Rune Helland, head of Investor Relations tel. +47 2326 8400 [email protected] Amra Koluder, SVP Investor Relations tel. +47 2326 8404 [email protected] Thor Tellefsen, Long Term Funding tel. +47 2326 8404 [email protected] Financial calendar 2017 21 November Capital markets day 2018 1 February Q4 2017 8 March Annual report 2017 26 April Q1 2017 12 July Q2 2017 25 October Q3 2017 14 November Capital markets day Other sources of information Annual and quarterly reports Separate annual and quarterly reports are prepared for the DNB Group, DNB Boligkreditt, DNB Næringskreditt and DNB Livsforsikring. The reports are available on dnb.no. Annual and quarterly reports can be ordered by sending an e-mail to Investor Relations. The quarterly report has been produced by Group Financial Reporting in DNB. Cover design: REDINK
DNB BANK – THIRD QUARTER REPORT 2017 (UNAUDITED) / 45

DNBMailing address:P.O.Box 1600 SentrumN-0021 Oslo
Visiting address:Dronning Eufemias gate 30Bjørvika, Oslo
dnb.no