do credit-based insurance scores proxy for income in
TRANSCRIPT
Georgetown University Law Center Georgetown University Law Center
Scholarship @ GEORGETOWN LAW Scholarship @ GEORGETOWN LAW
2016
Do Credit-Based Insurance Scores Proxy for Income in Predicting Do Credit-Based Insurance Scores Proxy for Income in Predicting
Auto Claim Risk? Auto Claim Risk?
Darcy Steeg Morris U.S. Census Bureau
Daniel Schwarcz University of Minnesota - Twin Cities
Joshua C. Teitelbaum Georgetown University Law Center, [email protected]
This paper can be downloaded free of charge from:
https://scholarship.law.georgetown.edu/facpub/1521
http://ssrn.com/abstract=2685304
J. Empirical Legal Stud. (forthcoming)
This open-access article is brought to you by the Georgetown Law Library. Posted with permission of the author. Follow this and additional works at: https://scholarship.law.georgetown.edu/facpub
Part of the Insurance Law Commons, and the Law and Economics Commons
Do Credit-Based Insurance Scores Proxy for Income in Predicting Auto Claim Risk?*
Darcy Steeg Morris Daniel Schwarcz Joshua C. Teitelbaum U.S. Census Bureau University of Minnesota Georgetown University
Draft: June 15, 2016 Prior version: October 30, 2015
Abstract
Auto insurers often use credit-based insurance scores in their underwriting and rating processes. The practice is controversial—many consumer groups oppose it, and most states regulate it, in part out of concern that insurance scores proxy for policyholder income in predicting claim risk. We offer new evidence on this issue in the context of auto insurance. Prior studies on the subject suffer from the limitation that they rely solely on aggregate measures of income, such as the median income in a policyholder's census tract or zip code. We analyze a panel of households that purchased auto and home policies from a U.S. insurance company. Because we observe the households' home policies as well as their auto policies, we are able to employ two measures of income: the median income in a household's census tract, an aggregate measure, and the insured value of the household's dwelling, a policyholder-level measure. Using these measures, we find that insurance score does not act as proxy for income in a standard actuarial model of auto claim risk.
Keywords: auto insurance, income, insurance score, proxy.
JEL codes: G22, K23.
* Address correspondence to Joshua C. Teitelbaum, Georgetown University Law Center, 600 New Jersey Avenue NW, Washington, DC 20001; email: [email protected]. Morris is Research Mathematical Statistician, Center for Statistical Research and Methodology, U.S. Census Bureau; Schwarcz is Julius E. Davis Professor of Law, University of Minnesota Law School; Teitelbaum is Professor of Law, Georgetown University Law Center.
Teitelbaum acknowledges financial support from National Science Foundation grant SES-1031136. For helpful comments and feedback, we thank the editor, three anonymous referees, and participants at the following conferences and seminars: the American Risk and Insurance Association Annual Meeting, the American Law and Economics Association Annual Meeting, the European Association of Law and Economics Annual Conference, the Annual Meeting of the Section on Insurance Law of the Association of American Law Schools, the Law and Economics Seminar at Boston University School of Law, the Faculty Workshop at George Washington University Law School, the Law and Economics Colloquium at George Mason University School of Law, and the Law and Economics Workshop at the University of Virginia School of Law. This paper is released to inform interested parties of research and to encourage discussion. The views expressed are those of the authors and not necessarily those of the U.S. Census Bureau.
1
I. INTRODUCTION
Insurance companies are in the business of classifying policyholders into risk-based categories. Insurers build actuarial models to relate policyholder characteristics to claim risk. They then use these models to predict the rates at which policyholders with different characteristics will generate claims. These claim rate predictions, along with predictions about claim amounts, play a central role in determining whether insurers offer coverage to prospective policyholders and, if so, the premiums that they set for this coverage.
In the United States, federal and state laws limit the scope of insurers' underwriting and risk classification schemes. These laws often restrict insurers' capacity to discriminate among policyholders on the basis of characteristics such as race and gender, which are viewed as potentially suspect classifications in a wide variety of settings (Brilmayer et al. 1983). They also may target discrimination on the basis of policyholder characteristics, such as income or wealth, which are potentially suspect in the specific context of insurance, though not always in other settings. Finally, insurance anti-discrimination laws may regulate insurers' use of characteristics, such as occupation and zip code, that are not independently suspect, but which may correlate with one or more suspect classifications. This final form of regulation is often quite controversial, resulting in widely varying legal regimes across states (Avraham et al. 2014a, 2014b).
Credit-based insurance scores ("insurance scores") are perhaps the most important example of a policyholder characteristic that is regulated because it potentially correlates with suspect classifications. Many property and casualty insurers use insurance scores in their actuarial models for their automobile and homeowners coverage lines. The widespread use of insurance scores in these lines of coverage stems from a simple fact: they are predictive of claim risk (Miller and Smith 2003; Golden et al. 2016). At the same time, however, insurance scores may be correlated with one or more suspect classifications, including, most importantly, race and income. For this reason, most states regulate insurers' use of insurance scores in auto and home insurance, and a few states ban their use altogether (Avraham et al. 2014a, 2014b).
Any correlation between insurance scores, on the one hand, and race or income, on the other, is potentially troubling from a policy standpoint for two reasons that are not always clearly distinguished. The first is that insurance scoring may have a disparate impact on racial minorities and low income households, causing members of these groups to pay higher premiums on average. Whether this fact, by itself, warrants legal intervention is highly controversial and context dependent (O'Neill 2007). Generally, however, critics have had little success arguing that insurers' classification schemes should be limited solely because they have a disparate impact on certain groups. This is particularly true outside of the domain of race and certain types of property insurance, where enhanced federal scrutiny applies due to the Fair Housing Act. But
2
even under the Fair Housing Act, insurance practices that have a disparate impact on protected groups are generally permissible if no less discriminatory alternative is available.1
The second, and more potent, reason for regulating the use of insurance scores is that they may proxy for race or income. A correlation between insurance scores and a suspect classifier such as race or income is a necessary, but not a sufficient, condition for insurance scores to operate as a proxy for the suspect classifier. In addition to such a correlation, this "proxy variable" argument presumes that the predictive power of insurance scores would greatly diminish in a regression model that also includes the suspect classifier as a predictor (Pope and Sydnor 2011). To the extent this is so, the predictive value of insurance scores would be largely attributable to its correlation with the suspect classifier. This is distinctly troubling from a public policy perspective because it would mean not only that racial minorities and low income households are disparately impacted by insurers' use of insurance scores, but also that insurers are effectively circumventing prohibitions on the use of suspect classifications (either intentionally or unknowingly) by relying on a proxy variable that is not itself directly prohibited.
The relative merits of the disparate impact and proxy variable arguments are reasonably well established when it comes to the relationship between insurance scores and race. In 2007, the Federal Trade Commission (FTC) published an influential study finding that insurance scoring has a disparate impact on African Americans and Hispanics (FTC 2007). The FTC study also concluded, however, that insurance scores do not operate principally as a proxy for race. The FTC found that insurance scores predict claim risk within racial groups and that they remain substantially predictive of claim risk after controlling for race. Although critics have claimed that the FTC study was methodologically problematic because it relied on data voluntarily provided by insurers (Brobeck and Hunter 2012), it clearly has had a substantial impact on policy debates regarding the propriety of insurance scoring.
Unlike in the case of race, the nature of the relationship between insurance scores and income remains unclear. Extant research is mixed about the correlation between insurance scores and income, and it provides virtually no guidance on the extent to which insurance scores proxy for income in predicting claim risk. At root, this gap in the literature stems from the fact that the existing studies rely on aggregate measures of income, such as the median income within the policyholder's geographic region (e.g., census tract or zip code). This approach often yields limited results that are hard to evaluate, for two reasons. First, income can be quite heterogeneous within a geographic region. Second, the individuals within a geographic region who purchase insurance may not be representative of the overall population living within that geographic region.
1 Implementation of the Fair Housing Act's Discriminatory Effects Standard, 78 Fed. Reg. 11,460 (Feb. 15, 2013), http://portal.hud.gov/hudportal/documents/huddoc?id=discriminatoryeffectrule.pdf. Recently, the Supreme Court held that disparate impact claims are indeed cognizable under the Fair Housing Act, giving new vitality to this issue. See Texas Department of Housing & Community Affairs v. The Inclusive Communities Project, Inc., 135 S. Ct. 2507 (2015).
3
In the face of this empirical uncertainty, policy concerns about the impact of insurance scoring on low income populations remain influential. After all, it is reasonable to assume that income may correlate with insurance scores; all else equal, it presumably is harder to promptly repay debt when one routinely earns little income. Such a correlation, moreover, could well mean that insurance scores operate as a proxy for income, which would explain the still contested relationship between insurance scores and claim risk (Brockett and Golden 2007). There may be good reasons to expect that low income policyholders might experience claims more frequently. For instance, they may be more willing to file claims when small losses occur or less able to invest in precautions that would prevent losses in the first place.
Perhaps for these reasons, the relationship between insurance scores and income has received renewed attention in recent years. In the past three years, for instance, the Consumer Federation of America published several reports that focus on this relationship (e.g., Brobeck and Hunter 2012; Brobeck et al. 2013), and the National Association of Insurance Commissioners (NAIC) established an Automobile Insurance Study Group to "review issues relating to low-income households and the auto insurance marketplace and to make recommendations as may be appropriate" (NAIC 2012b). More recently, Consumer Reports published a high profile Special Report concluding that "behind the rate quotes is a pricing process that judges [consumers] less on driving habits and increasingly on socioeconomic factors" including "credit history," and it launched a campaign designed to encourage state regulators to require insurers to base rates solely on how consumers drive (Consumer Reports 2015).
This paper aims to improve our understanding of the relationships among insurance scores, income, and claim risk. We offer new evidence on the question of whether insurance score acts as a proxy for income in predicting auto claim risk. We utilize a proprietary data set acquired from a large U.S. property and casualty insurance company that specializes in personal automobile and homeowners coverage. Our main sample comprises an unbalanced panel of 66,444 households who purchased auto and home policies from the company between 1998 and 2006. Among other things, we observe in the data the number of claims filed during the period of observation by each household in two lines of auto coverage: collision and comprehensive. In addition, we observe detailed information about the households and their policies. Although we do not directly observe a household's income, we observe two indirect measures of income: (i) the median income in the household's census tract ("median income") and (ii) the insured value of the dwelling covered by its home policy ("home value"). The paper's main contribution lies in our empirical strategy of using home value, in addition to median income, to measure a household's income. Indeed, insofar as we observe and utilize home value, a policyholder-level measure of income, in addition to median income, an aggregate measure of income (and, in fact, the same aggregate measure used by the FTC), we believe that our study greatly improves upon the extant literature.
We begin our empirical analysis by specifying a standard actuarial model of auto claim risk: the Poisson random effects model. We then examine whether insurance score acts as a proxy for
4
income in the model. In particular, we follow the approach taken by the FTC and analyze three related questions: (i) whether insurance score predicts claim risk within income groups (yes); (ii) whether income predicts claim risk (mixed), and (iii) whether controlling for income changes the impact of insurance score on predicted claim risk (no). Our analysis leads us to conclude that insurance score does not proxy for income in predicting auto claim risk. Lastly, we repeat our analysis on a sample of 8,685 renters,2 to probe whether our conclusion for homeowners holds equally for renters. We find that it does.
The remainder of the paper is organized as follows. Section II provides further background information on insurance scoring and its regulation. Section III surveys prior studies on insurance scoring, race, and income. Section IV contains our empirical analysis. It describes our data, presents the model, and reports our results. Finally, Section V discusses the policy implications of our findings as well as a number of caveats of our analysis.
II. INSURANCE SCORING AND ITS REGULATION
In the early 1980's, individual insurers started to investigate ways to incorporate credit history information into their actuarial models (FTC 2007). But it was not until 1993 that the precursor to modern insurance scores emerged, with the development by Fair Isaac Corporation (FICO) of a credit-based insurance score to predict the likelihood of claims in homeowners insurance. Two years later, FICO released a credit-based insurance score for automobile insurance. Thereafter, other credit scoring companies and some insurers began designing their own proprietary insurance scoring methodologies.
Today, personal lines insurers routinely rely on insurance scores in pricing and underwriting their policies. According to FICO, in the absence of state prohibitions, 95 percent of automobile insurers and 85 percent of home insurers employ insurance scores in either the underwriting or rating process (NAIC 2012a). The prevalence of insurance scoring in these markets reflects the fact that insurance scores are predictive of claim risk, as demonstrated by numerous industry and government studies (Insurance Information Institute 2015). Additionally, and just as importantly, credit information is readily and cheaply available to insurers, who can largely tap into the existing infrastructure for collecting and reporting this information that has developed in connection with credit scoring (Abraham 1986).
Like credit scores, insurance scores are derived from information contained in individuals' credit reports. These reports contain hundreds of data points that are grouped into five broad categories: prior credit performance; current levels of indebtedness; length of credit history; pursuit of new credit; and types of credit used (Shepard 2012). They are compiled by Credit Reporting Agencies, such as Equifax, Experian, and Transunion, which are regulated under the Fair Credit
2 The only difference is that in the renters sample our policyholder-level measure of income is the insured value of the personal property covered by the household's renters policy ("property value").

5
Reporting Act.3 This law requires Credit Reporting Agencies to make available to consumers free copies of their credit reports and to conduct reasonable investigations of items on a consumer's report that he or she disputes (Carnell et al. 2013).
Credit scores and insurance scores differ both in the subset of data from credit reports that they incorporate and in how they weight these data. This divergence follows naturally from the distinct objectives of the two scores. Credit scores are designed to measure credit risk, whereas insurance scores seek to quantify insurance risk. Thus insurance scores only incorporate credit history characteristics that are considered predictive of insurance risk (NAIC 2012a; Insurance Information Institute 2015). Insurers typically use about 30 of the data points contained in credit reports (Consumer Reports 2015). In some cases, insurance scores may also incorporate noncredit characteristics. Similarly, credit scores and insurance scores weigh credit history characteristics differently. For instance, data on "types of credit used" are less important for FICO insurance scores than they are for FICO credit scores.4 By contrast, "payment history" data—which include number and severity of past delinquencies and presence of bankruptcies, liens, judgments, and other derogatory public records—generally influence FICO insurance scores more than FICO credit scores.5
Variation also exists across different insurance scoring models. Different models are developed both by data analytics firms, such as FICO, ChoicePoint, and Transunion, and by specific insurance carriers. These models vary both in the credit data they use and in the weight assigned to different types of data. Thus, some insurers consider types of credit while some do not; some consider the age of the oldest account and some average the ages (FTC 2007; North Carolina Department of Insurance 2010). Usually, credit characteristics encompassed by insurance scores include: late payments or delinquencies; judgments against the consumer and bankruptcies; other credit score inquiries; use of all available credit; and types of credit used (FTC 2007; Insurance Information Institute 2015; Allstate Insurance Company 2015). Unfortunately, more fine-grained comparisons among the various different insurance scoring models are difficult because these models are not publicly disclosed in most states and insurers use simplified, and more homogeneous, insurance scoring models in states requiring disclosure (FTC 2007).
Insurance scoring has long proven controversial. The primary source of this controversy stems from accusations that insurance scores correlate with policyholder race and income (Center for
3 15 U.S.C. § 1681 et seq. 4 This data comprises only 5 percent of a FICO insurance score for an average consumer, but comprises 10 percent of the average consumer's FICO credit score. For both insurance scores and credit scores, an average consumer's score is 30 percent impacted by current level of indebtedness, 15 percent by length of credit history, and 10 percent by new credit and pursuit of new credit. See FICO (2015a, 2015b). 5 Such information comprises 40 percent of an average consumer's FICO insurance score, but only 35 percent of an average consumer's FICO credit score (FICO 2015a).
6
Economic Justice 2005; Wu and Birnbaum 2007; Robinson 2011).6 Such correlations could arise through a number of different mechanisms. Most notably, individuals with limited financial resources may have a relatively hard time managing their credit and be susceptible to shocks, such as job losses or medical events, that are likely to produce an adverse credit history. Alternatively, those with distressed finances may be less likely to have cars in good condition, more likely to file low value claims, or more likely to drive long distances.
To the extent that insurance scores are correlated with policyholder race and income, insurers' classification practices have a disparate impact on racial minorities and low income groups. Whether this is troubling from a legal or regulatory perspective is a matter of long-standing debate. Outside of the context of property insurance practices having a disparate impact on protected minority groups' access to housing, which implicate the federal Fair Housing Act, insurers have generally prevailed in arguing that disparate impact theory should not apply to insurance. Their basic argument is that discrimination on the basis of risk is fundamental to insurance, and that subjecting the industry to disparate impact analysis would consequently raise insurance rates for a majority of consumers and throw into question numerous long-standing industry practices (National Association of Mutual Insurance Companies 2004).
Critics argue that insurance practices that have a disparate impact on minority and low income groups end up both reflecting and reinforcing social and economic inequalities, undermining broader social values such as racial equality and economic mobility (Abraham 1985). They argue that it is possible to construct formulas that exclude credit attributes but still yield sufficiently accurate assessments of risk (Wu and Birnbaum 2007). California, they emphasize, has long banned auto insurers' use of insurance scores without any dire consequences (Hunter et al. 2013). In fact, in contrast to most states, California has generally experienced a decrease in rates and residual market size since it banned auto insurance scoring as part of a larger package of regulatory reforms (Hunter et al. 2013).
Potential correlations between insurance scores and race and income take on special importance because of the lack of a clear causal connection between credit information and insurance risk. Simply put, it is not obvious why individuals who take on too much credit or fail to keep up with their bills are more likely to experience a car accident, home fire, or any other insured loss. To be sure, many have offered explanations, most often arguing that people with poor credit scores are less careful or responsible in general, and thus tend to be more likely to experience accidents (Brocket and Golden 2007; Golden et al. 2016). But these claims are difficult, if not impossible, to prove. Moreover, to many, they are inconsistent with the fact that two of the major drivers of credit risk are unemployment and health problems, neither of which seems to reflect irresponsible behavior such as reckless driving or lack of fire safety.
6 Critics of insurance scoring also argue that it unfairly penalizes people for adverse events that are beyond their control, such as unemployment or unexpected healthcare costs (Birnbaum 2015).
7
In the absence of a compelling neutral explanation for why insurance scoring works, critics often suggest that the predictive capacity of insurance scores stems substantially from their correlation with race and income. According to this claim, insurance scores not only have a disparate impact on minority and low income policyholders, but also operate as a proxy for policyholder race and income. In other words, they allow insurers to indirectly rate policyholders on the basis of their race and income without explicitly taking these characteristics into account in their models. Implicitly, this argument assumes that race and income are themselves predictive of losses, or at least that insurers believe them to be so. Nonetheless, the argument goes, insurers are unable or unwilling to explicitly discriminate on the basis of policyholder race and income because of legal and regulatory forces. Using insurance scores allows them to accomplish such discrimination in practice while avoiding regulatory and legal constraints.
The prospect that insurers are using insurance scores to proxy for policyholder race and income is more clearly troubling from a policy perspective than is the unadorned argument that these scores produce a disparate impact. Many—though not all—states explicitly prohibit the use of race in the pricing, issuance, and renewal of insurance coverage (Avraham et al. 2014a). And while no state bans insurers' explicit use of policyholder income in underwriting or rating, this practice "appears to be generally regarded as an illegitimate variable for those purposes" (FTC 2007). Indeed, insurers in a number of coverage lines appear to frequently avoid discriminating on the basis of policyholder characteristics that, while predictive of policyholder claims, may trigger regulatory backlash (Finkelstein and Poterba 2014). Using insurance scores to proxy for these illicit policyholder characteristics directly undermines these laws and norms.7 All of this becomes particularly troubling because insurers have a history of using other facially neutral categories to discriminate against protected groups. Throughout the 1950s and 1960s, home insurers routinely "redlined" certain poor, black geographic regions and refused to sell coverage in these areas, ostensibly because of geographically-based considerations (Squires 2003).
Taken together, these concerns about insurers' use of insurance scores have prompted various legal and regulatory responses in the last twenty years. Most notably, three states—California, Hawaii, and Massachusetts—ban the use of credit-based insurance scores in auto insurance, and two states—Maryland and Massachusetts—ban the use of insurance scores in homeowners'
7 An important regulatory principle is that insurers cannot be allowed to do indirectly what they are prohibited from doing directly. This point is well reflected in the NAIC's Market Regulation Handbook, which is designed to help state regulators conduct uniform, standardized market analysis and market conduct examinations The handbook explains that regulators conducting a market conduct exam should identify any underwriting guidelines in which "there any 'red flags,' such as . . . a factor that is an obvious proxy for a prohibited characteristic" (NAIC 2009, p. 68). If the underwriting guideline raises such a red flag, then regulators must next ask whether "the underwriting guideline serve[s] a necessary underwriting purpose, by identifying a characteristic of the consumer, vehicle or property that is demonstrably related to risk of loss and does not duplicate some other factor that has already been taken into account" (NAIC 2009, p. 68).
8
insurance (Insurance Information Institute 2015).8
Virtually all of the remaining states restrict or condition insurers' use of insurance scores in underwriting and rating. In many cases, states have adopted in whole or in part the National Conference of Insurance Legislators' (NCOIL) Model Act Regarding Use of Credit Information in Personal Insurance (NCOIL 2009). The NCOIL Model Act prohibits insurers from relying solely on credit-based information to raise premiums or to deny, cancel, or refuse to renew a policy (NCOIL 2009; FTC 2007; Robinson 2011). It also requires insurers using credit-based insurance scores to notify their customers of this fact and to separately disclose any adverse actions they take on the basis of credit information. Recent amendments to the NCOIL Model Act allow consumers to affirmatively request that their insurance scores not be used to increase their rates if they have experienced "extraordinary life circumstances" beyond their control that undermined their credit (NCOIL 2009; FTC 2007).
Many other states have adopted additional or different restrictions on insurance scoring than those contained in the NCOIL Model Act (see, generally, FTC 2007; Robinson 2011; Insurance Information Institute 2015). For instance, some states prohibit the use of insurance scores in calculating premiums during policy renewal,9 or allow it only if it positively impacts a customer's premium.10 Similarly, some states have extraordinary life circumstance exceptions that differ from the NCOIL Model Act's.11 States also have adopted rules governing insurance scoring that have limited parallels in the NCOIL Model Act. For instance, some states limit the types of credit information that insurers can consider.
The controversy surrounding insurance scoring has also prompted federal attention, a rarity in insurance regulation, where state regulation typically dominates outside of health insurance (Meier 1998). In 2006, Congress passed the Fair and Accurate Credit Transactions Act (FACTA), which required the FTC, in conjunction with several other federal agencies, to study whether insurance scoring adversely impacts the availability and affordability of consumer automobile and homeowners insurance.12 Additionally, the Fair Credit Reporting Act requires insurers to notify a consumer if the company took an adverse action based in whole or in part on
8 Maryland also bans the use of credit history in renewal rating decisions in auto insurance (Insurance Information Institute 2015). 9 Alaska and Oregon have these laws (Robinson 2011). Despite a lack of state law proscription, some insurers choose not to use insurance scores during the policy renewal stage to foster customer relations (FTC 2007). 10 These states are Connecticut, Delaware, Maryland (for auto insurance), New York, Oregon, Pennsylvania (through regulation), Utah (for auto insurance), and Virginia (Robinson 2011). Some states require that an insurer recalculate premiums using insurance scores upon a customer's request, and update the premium accordingly if the recalculation lessens the amount the customer pays. Some insurers offer this service in the absence of state legislation (FTC 2007). 11 These states are Connecticut, Florida, Delaware, Iowa, Minnesota, Montana, New Mexico, Rhode Island, Texas, and Virginia (Robinson 2011; Insurance Information Institute 2015). 12 Fair and Accurate Credit Transactions Act § 215, 15 U.S.C. § 1681 note (2013).

9
the consumer's report.13 The company must provide the contact information of the credit bureau supplying the report and must furnish a copy of the credit report for free, for up to sixty days. 14
In recent years, the claim that insurance scoring disproportionately harms low income consumers has again garnered sustained regulatory attention. In 2012, the Consumer Federation of America published an influential report arguing that low income individuals are systematically charged higher rates for automobile insurance coverage (Brobeck and Hunter 2012). A principal culprit of this effect, according to the report, is insurers' use of insurance scores. Additionally, various consumer advocates have suggested that insurance scoring may operate as a proxy for policyholder income (Balber et al. 2007). Largely as a result of these claims, the NAIC formed an Auto Insurance Committee to study "issues relating to low-income households and the auto insurance marketplace and to make recommendations as may be appropriate" (NAIC 2012b). In 2014, the Federal Insurance Office entered the fray, requesting comments on the availability of affordable auto insurance in minority and low and moderate income communities (Federal Insurance Office 2014).
In parallel with these regulatory developments, state legislatures have considered legislation in recent years that would alter the rules governing insurers' use of credit-based insurance scores.15 For instance, in 2013 alone, bills were introduced in thirteen states that would have banned insurance scoring in whole or in part.16 In that same year, legislatures in seven states considered
13 15 U.S.C. § 1681g(f). See also Robinson (2011). Adverse actions, which apply to new policies and renewals, are denials, cancellations, increases in premiums (or other charges), or reductions of coverage. 15 U.S.C. § 1681a(k). 14 15 U.S.C. § 1681g(f). See also Robinson (2011). 15 In addition, in 2012, three members of Congress introduced a bill to amend the Fair Credit Reporting Act to "prohibit the use of consumer reports and consumer information in making any determination involving auto insurance with respect to a consumer." H.R. 6129, 112th Cong. (2012). 16 S.B. 55, 28th Leg., 1st Sess. (Alaska 2013) (Alaska Senate bill to broaden the definition of "adverse action" and to remove language that prevented insurers from failing to underwrite or rate a consumer on account of credit history (in whole or in part) during the renewal phase); S.B. 1395, 51st Legis., 1st Sess. (Ariz. 2013) (Arizona bill to prohibit use of insurance scores at any time in any type of insurance); H.B. 5510, 2013 Leg., Jan. Sess. (Conn. 2013) (Connecticut bill to ban insurance scoring in private motor insurance); H.B. 1073, 2013 Gen. Assemb., 2013 Reg. Sess. (Ind. 2013) (Indiana bill to prohibit use of credit history for any reason during renewal); H.F. 47, 88th Leg., 2013-2014 Reg. Sess. (Minn. 2013); S.F. 1387, 88th Leg., 2013-2014 Reg. Sess. (Minn. 2013) (Minnesota House and Senate bill to prohibit insurance scores in underwriting automobile insurance); L.B. 92, 103d Leg., 1st Sess. (Neb. 2013) (Nebraska bill to wholly ban the use of insurance scoring); S.B. 1107, 215th Leg., 2012-2013 Reg. Sess. (N.J. 2012) (New Jersey bill to ban insurers from using scores in home insurance); S.B. 2975, 2013 Assemb., Reg. Sess. (N.Y. 2013) (New York bill to ban scoring for automobile insurance). S.B. 73, 130th Gen. Assemb., 2013-2014 Reg. Sess. (Ohio 2013) (Ohio bill to ban insurance scoring altogether). S.B. 439, 2013 Gen. Assemb., Jan. Sess. (R.I. 2013); H.B. 5028, 2013 Gen. Assemb., Jan. Sess. (R.I. 2013) (Rhode Island bill to prohibiting insurance scoring in whole or for automobile insurance); H.B. 1007, 83rd Leg., Reg. Sess. (Tex. 2013); S.B. 72, 83rd Leg., Reg. Sess. (Tex. 2013) (Texas bill to ban the use of credit scoring). H.B. 1212, 63d Leg., 2013 Reg. Sess. (Wash. 2013) (Washington bill to ban scoring for homeowner's insurance). H.B. 2282, 81st Leg., 2013 Reg. Sess. (W. Va. 2013) (West Virginia bill banning insurance scoring altogether).
10
adding more restrictions to the use of insurance scores.17
III. PRIOR STUDIES ON INSURANCE SCORING, RACE, AND INCOME
By far the most important and influential study on insurance scoring is the 2007 FTC study that FACTA mandated a year earlier (FTC 2007). The FTC report first confirmed the correlation between insurance scores and claim risk with respect to four types of automobile coverage: property damage liability, bodily injury liability, collision, and comprehensive. To do so, the study focused on automobile insurance policy data voluntarily provided to the FTC by five insurance companies.18 This data included policy and driver characteristics, claims, and the "ChoicePoint Attract Standard Auto" insurance score for the first named policyholder.19 The FTC concluded that, even after controlling for standard risk factors such as age and driving history, there were strong correlations between drivers' insurance scores and their ultimate insurance claims.20 The FTC report acknowledged the possibility that this correlation might stem from the capacity of credit-based information to measure policyholders' levels of responsibility or prudence in managing their financial affairs, which might itself predict the likelihood that policyholders will suffer an insured loss. But it concluded that insufficient information was available to confirm this explanation, or alternative explanations, for the correlation between insurance scores and auto claim risk.
The FTC report focused particular attention on how insurance scoring impacts minority groups. It combined the data described above with data on individuals' race and ethnicity derived from matching policyholder names with Social Security data on race, ethnicity, and national origin. As long claimed by critics, the FTC study confirmed that certain minority groups do indeed have lower insurance scores on average than non-Hispanic whites and Asians. The FTC found that
17 H.B. 1231, 2013 Gen. Assemb. 2013 Reg. Sess. (Ind. 2013) (Indiana bill to prohibit including disability in an insurance score); H.B. 136, 2013 Gen. Assemb., 13 Reg. Sess. (Ky. 2013) (Kentucky bill to require insurers to consider other factors in addition to credit and to treat those with no history as neutral, as defined by the insurer); H.B. 4511, 2013-2014 Leg., Reg. Sess. (Mich. 2013) (Michigan bill to prohibit scoring during the renewal phase if it will result in an adverse action and to prohibit scoring when an insurer determines installment payment options); H.B. 260, 97th Gen. Assemb., 1st Reg. Sess. (Mo. 2013) (Missouri bill to amend the definition of "adverse action" to conform with FCRA's definition; require insurers to consider other factors if an applicant has no credit history and the insurer is contemplating taking and adverse action; and prohibit insurers from considering credit history during the renewal phase); B. 5126, 2013 Assemb., Reg. Sess. (N.Y. 2013) (New York bill to prevent insurers from making an adverse action based on insurance score alone); H.B. 1175, 108th Gen. Assemb., 2013-2014 Reg. Sess. (Tenn. 2013); S.B. 931, 108th Gen. Assemb., 2013-2014 Reg. Sess. (Tenn. 2013) (Tennessee bill to prevent insurers from taking adverse actions based primarily on insurance scores); H.B. 3010, 81st Leg., 2013 Reg. Sess. (W. Va. 2013) (West Virginia bill to incorporate an extraordinary life circumstances provision). 18 Perhaps the most vociferous objection to the FTC study by consumer groups was the fact that the study relied so heavily on information voluntarily provided by insurance companies. Consumer groups argued that this might have represented a skewed sample from insurance companies that were least likely to have problematic practices. 19 The FTC evaluated its results by replacing credit scores with FICO credit-based insurance scores. These results were "qualitatively similar regardless of whether the ChoicePoint or the Fair Isaac score was used." 20 The FTC found this same effect using an alternative data source for policyholder claims: their Comprehensive Loss Underwriting Exchange (CLUE) reports.
11
non-Hispanic whites and Asians were relatively evenly distributed across the range of insurance scores, whereas African Americans and Hispanics were over-represented in groupings of individuals with the lowest insurance scores and under-represented in groupings of individuals with the highest insurance scores. As a result, insurance scoring decreased expected prices for non-Hispanic whites and Asians (by an estimated 1.6 percent and 4.9 percent, respectively), but increased expected prices for African Americans and Hispanics (by an estimated 10.0 percent and 4.2 percent, respectively).
Despite the correlation between insurance scores and race, the FTC study found little evidence that insurance scores operate as a proxy for race or ethnicity. The FTC evaluated this possibility in several ways, the most important of which was to build two insurance pricing models: one that explicitly included policyholder race, ethnicity and insurance scores, and one that included insurance scores but not policyholder race or ethnicity.21 To the extent that insurance scores similarly predicted claim risk in both models, the FTC reasoned that the explanation for this fact must not stem from it operating as a proxy for race or ethnicity. For three of the four types of auto insurance coverage studied, the FTC found that low insurance scores increased expected claims for African Americans and Hispanics by somewhat more in models excluding race and ethnicity than in models including these variables. At the same time, it found that insurance scores continued to substantially predict claim risk in both models. Putting these findings together, the FTC concluded that insurance scores may operate as a partial proxy for race or ethnicity for three of the four types of coverage studied, but that its operation as a proxy for these characteristics was not the primary explanation for its predictive capacity. In fact, the FTC found that the magnitude of the proxy effect of insurance scores was similar to the capacity of much less contentious policyholder characteristics—such as tenure with an insurer, the make and model of the policyholder's car, and the car's body type and safety systems—to proxy for race or ethnicity. Perhaps just as importantly, the FTC found that it was unable to construct a credit-based insurance scoring model that would substantially decrease the disparate impact on minority groups while maintaining comparable predictive accuracy.
The FTC study reached far less conclusive results regarding the relationship between insurance scores and income. Unlike in the case of race and ethnicity, the FTC did not have access to any individuated data about the income of consumers in its data. Instead, the FTC divided individuals into low, medium, and high income groups based on the median income of the census tract in which consumers resided. Using this aggregate measure of income, the FTC found that
21 The FTC also used two other approaches to test this possibility. First, it evaluated whether insurance scores are predictive of risk within racial or ethnic groups, reasoning that insurance scores must operate solely as a proxy for race or ethnicity if they are not predictive of risk within groups. The FTC found that insurance scores were predictive of risk within these groups, and hence did not operate solely as a proxy for these characteristics. Second, it evaluated whether average risk varied across racial or ethnic groups as measured by all factors other than insurance scores. It reasoned that if there were no such difference then there would be nothing for which insurance scores could proxy. Here the FTC found there are indeed risk differences across racial and ethnic groups, at least for three of the four types of auto coverage studied.
12
individuals categorized as low income did tend to have lower insurance scores than individuals categorized as high income, though the correlation was weaker than in the case of race or ethnicity. And, using the same approach as in the case of race and ethnicity, the FTC found limited evidence that insurance scores tend to proxy for income. Because of its inability to analyze individuated data on income, however, the FTC was hesitant to reach any firm conclusions regarding the relationship between insurance scores and income. Thus, the FTC noted that its results on the relationship between insurance scores and income "may simply be the result of only having data on income at the neighborhood level." Similarly, the FTC report excluded any conclusion about whether insurance scores operate as a proxy for income in its Executive Summary.
In addition to the FTC's study, numerous states have conducted their own examinations into the impact of insurers' use of credit-based information on policyholders (NAIC 2014). Most of these studies focus on the overall impact that insurers' use of credit-based information has on policyholder premiums, without focusing on issues of potentially unfair discrimination (Honey 2015). However, a few state studies focus more specifically on how insurance scoring impacts potentially suspect groups. For instance, in 2004 the Texas Department of Insurance (TDI) produced two reports on insurers' use of credit information pursuant to a legislative requirement to study the issue (TDI 2004, 2005). Mirroring the results of the FTC study, the TDI studies found that policyholders' credit scores were predictive of risk both in univariate analysis and in multivariate analysis that included other common rating variables. The TDI studies also found that insurers' use of credit scores disproportionately impacted both protected racial and ethnic groups, as well as lower and moderate income level populations. The TDI studies were notable because they were the first to use individual data on policyholders' race and ethnicity to assess the impact of insurance scoring on these groups. However, as with the FTC analysis, the TDI studies did not employ policyholder-level data on income, which was not available to the department. Instead, they relied on median income within zip code as their measure of income.
Around the same time as the TDI study, Missouri also released a notable study on insurers' use of credit-based information (Kabler 2004). That study used credit scores collected directly from Missouri's highest volume automobile and homeowners insurers to assess the prospect that insurers' use of this information disproportionately impacted vulnerable groups. Consistent with the findings of both the FTC and TDI studies, the Missouri study concluded that policyholders' credit scores "are significantly correlated with minority status and income, as well as a host of other socio-economic characteristics, the most prominent of which are age, marital status and educational attainment." But like both the FTC and TDI studies, the Missouri study did not employ policyholder-level data on income, instead relying on median income within zip code as its measure of income.
13
IV. EMPIRICAL ANALYSIS
We offer new evidence on the question of whether insurance score proxies for income in an actuarial model of auto claim risk. In Section IV.A, we describe our data and main sample, which comprises 66,444 homeowners. In Section IV.B, we specify a standard actuarial model of auto claim counts. In Section IV.C, we present our results. Our bottom line finding is that insurance score does not act as a proxy for income in the model. The underlying reason is that insurance score and income are very weakly correlated. Lastly, in Section IV.D, mindful of the possibility that renters may differ from homeowners in terms of income and insurance scores, we analyze a sample of 8,685 renters. The bottom line is the same, with the caveat that in the renters sample our policyholder-level measure of income is the insured value of the household's personal property.
A. Data and Main Sample
The source of our data is a large U.S. property and casualty insurance company that specializes in personal automobile and homeowners insurance. Our main sample comprises an unbalanced panel of 66,444 households who purchased automobile and homeowners policies from the company in one or more years between 1998 and 2006. In all, our main sample has 319,784 household-year records. We observe all the information in the company's records regarding the households and their policies. In addition, we observe the number of claims that each household filed with the company under each of its policies during the period of observation. We focus our attention on claim counts in two lines of auto coverage: collision and comprehensive. Collision coverage pays for damage to the insured vehicle caused by a collision with another vehicle or object, without regard to fault. Comprehensive coverage pays for damage to the insured vehicle from all other causes (e.g., theft, fire, flood, windstorm, glass breakage, vandalism, hitting or being hit by an animal or by falling or flying objects), without regard to fault.22
Table 1 reports descriptive statistics for the key variables. (It also lists the other variables used as controls in the model, though they are not our primary interest.) As the table indicates, we observe three key variables in addition to the households' collision and comprehensive claim counts: insurance score, median income in the household's census tract ("median income"), and the insured value of the dwelling covered by its homeowners policy ("home value"). However,
22 In addition to data on claim counts in collision and comprehensive, we also have information on claim amounts in these coverages and on claim counts and claim amounts in property damage liability and bodily injury liability. We focus our attention on claim counts in collision and comprehensive for two reasons. First, we believe that claim frequency is the primary component of claim risk in collision and comprehensive; we believe that claim severity is secondary because the administrative cost of a claim often exceeds the amount of the claim, in part because the maximum claim amount—the auto's fair market value—rapidly declines over time while administrative costs do not. Second, we have certain doubts about the reliability of the information we have on claim amounts. This second reason also explains why we do not focus our attention on property damage liability and bodily injury liability, as we believe that claim severity is the primary component of claim risk in these coverages. Nevertheless, we may in future work turn our attention to claim counts in property damage liability and bodily injury liability.
14
we do not directly observe income. Of course, the ideal data set would contain household-level information on claim counts, insurance scores, and income. But company data like ours—which is the best source of household-level information on claims and insurance scores—often omits income; companies typically cannot or do not collect this variable. For this reason, we use median income and home value to measure household income.23
B. Actuarial Model of Auto Claim Counts
We model household claim counts using a Poisson model with multiplicative random effects. This is a standard actuarial model for use with longitudinal data on property and casualty insurance claims. For textbook treatments, see, e.g., Cameron and Trivedi (1998), Wooldridge (2002), and Denuit et al. (2007).24
Let denote the number of claims for household in year under coverage , where 1,… , , 1,… , , and ∈ , . In the set of coverages, denotes collision and denotes
comprehensive. Let 1, , … , denote a vector of characteristics (plus a constant)
for household in year under coverage , and define , … , . In addition, let
denote household 's income in year , and define , … , . Finally, let denote
household 's baseline claim rate in year under coverage , and let denote a time-constant random effect for household under coverage .
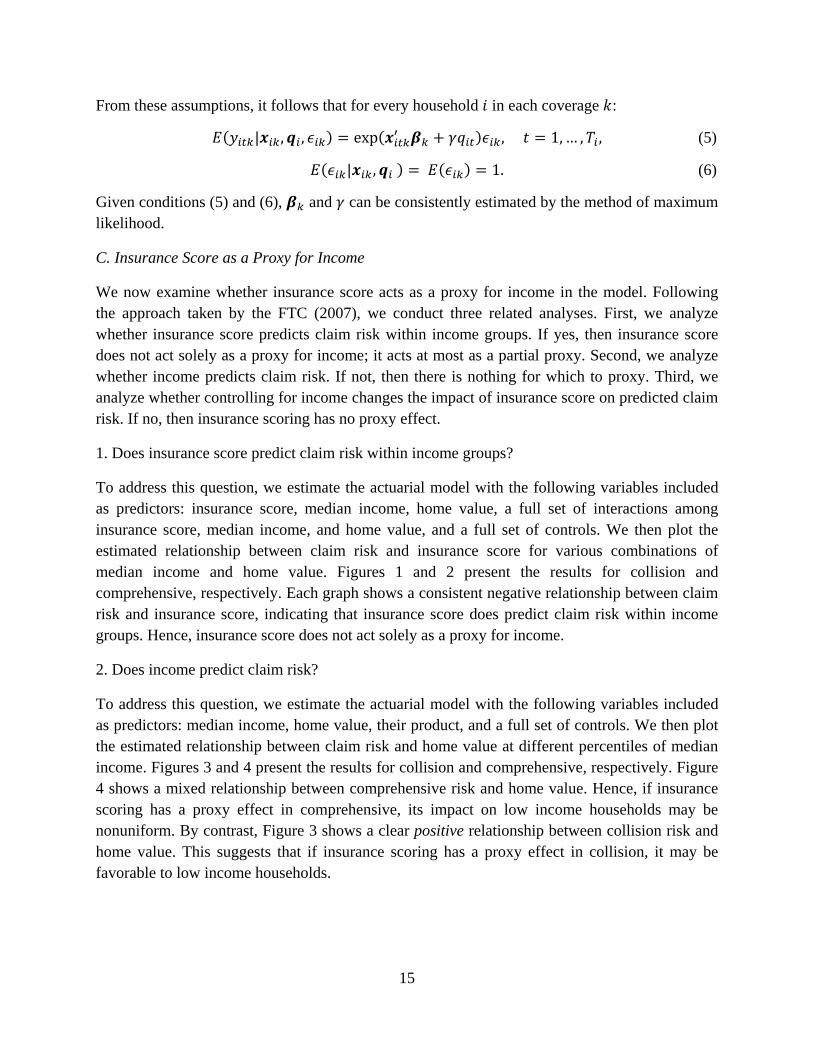
In each coverage , we assume for every household :
| , , ~Poisson , 1,… , , (1)
exp , (2)
| , , , , (3)
, , and ~Gamma , 1/ , (4)
so that 1 and 1/ .25
23 Because we do not observe income, we do not know the correlation between home value and income in our data. However, using combined extract data (1998-2010) from the Survey of Consumer Finance (SCF), a triennial survey of U.S. households sponsored by the Board of Governors of the Federal Reserve System, we find that the correlation between home value and income is 0.35 (std. err. = 0.002). 24 The Poisson model is the standard model for auto claim counts because the Poisson distribution is "the probability distribution of the number of occurrences of an event that happens rarely but that has very many opportunities to happen" (Denuit et al. 2007, p. 3). This is because the Binomial , distribution—the discrete probability distribution of the number of successes in a sequence of independent yes/no experiments with success probability
—is well approximated by the Poisson distribution with mean when the number of experiments is large and the success probability is small. (Denuit et al. 2007, p. 3). Random effects are incorporated into the model to allow for unobserved heterogeneity and relax the (unrealistic) restriction of equidispersion (i.e., mean = variance). 25 In equations (3) and (4), the symbol denotes independence.
15
From these assumptions, it follows that for every household in each coverage :
| , , exp , 1,… , , (5)
| , 1. (6)
Given conditions (5) and (6), and can be consistently estimated by the method of maximum likelihood.
C. Insurance Score as a Proxy for Income
We now examine whether insurance score acts as a proxy for income in the model. Following the approach taken by the FTC (2007), we conduct three related analyses. First, we analyze whether insurance score predicts claim risk within income groups. If yes, then insurance score does not act solely as a proxy for income; it acts at most as a partial proxy. Second, we analyze whether income predicts claim risk. If not, then there is nothing for which to proxy. Third, we analyze whether controlling for income changes the impact of insurance score on predicted claim risk. If no, then insurance scoring has no proxy effect.
1. Does insurance score predict claim risk within income groups?
To address this question, we estimate the actuarial model with the following variables included as predictors: insurance score, median income, home value, a full set of interactions among insurance score, median income, and home value, and a full set of controls. We then plot the estimated relationship between claim risk and insurance score for various combinations of median income and home value. Figures 1 and 2 present the results for collision and comprehensive, respectively. Each graph shows a consistent negative relationship between claim risk and insurance score, indicating that insurance score does predict claim risk within income groups. Hence, insurance score does not act solely as a proxy for income.
2. Does income predict claim risk?
To address this question, we estimate the actuarial model with the following variables included as predictors: median income, home value, their product, and a full set of controls. We then plot the estimated relationship between claim risk and home value at different percentiles of median income. Figures 3 and 4 present the results for collision and comprehensive, respectively. Figure 4 shows a mixed relationship between comprehensive risk and home value. Hence, if insurance scoring has a proxy effect in comprehensive, its impact on low income households may be nonuniform. By contrast, Figure 3 shows a clear positive relationship between collision risk and home value. This suggests that if insurance scoring has a proxy effect in collision, it may be favorable to low income households.
16
3. Does controlling for income change the impact of insurance score on predicted claim risk?
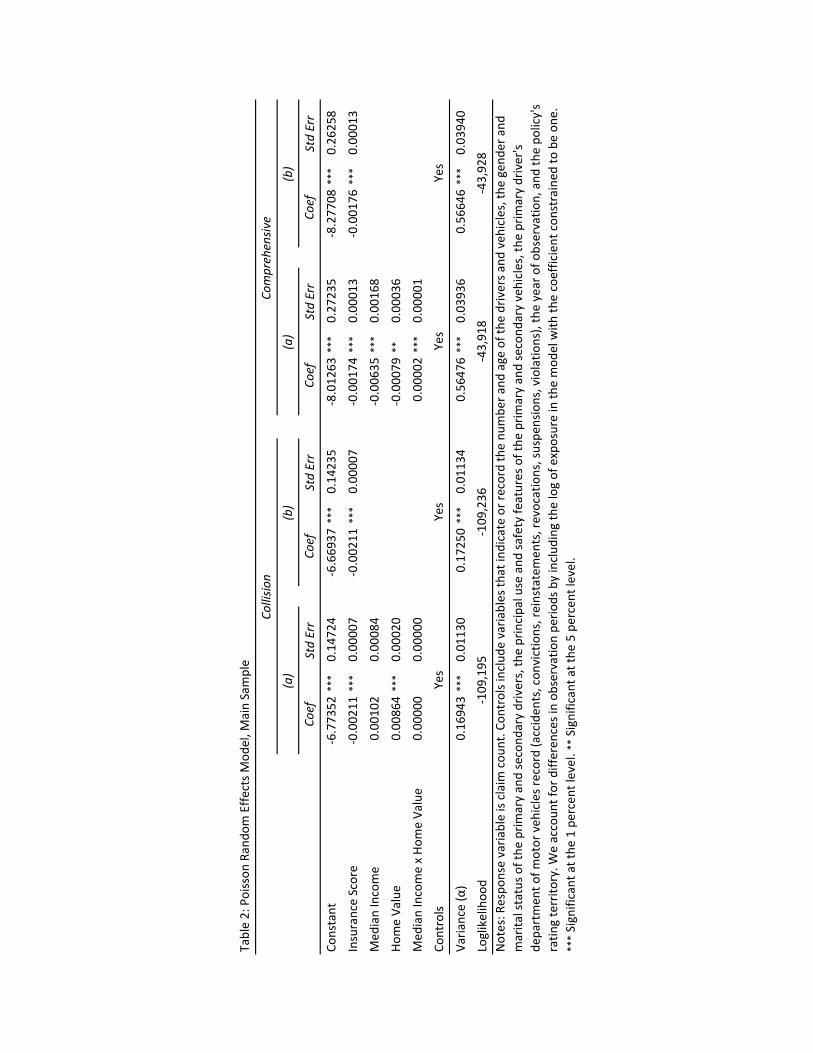
The answer to this question goes to the heart of the matter. If insurance score acts as a proxy for income, even as a partial proxy, the answer should be yes. If the answer is no, then insurance scoring has no proxy effect. To answer the question, we estimate the actuarial model with insurance score and a full set of controls included as predictors, both with and without the income variables (median income, home value, and their product) included as predictors. Table 2 reports the results. In both collision and comprehensive, controlling for income has little to no effect on the coefficient for insurance score.26 Hence, we conclude that insurance scoring has little to no proxy effect. The lack of a proxy effect is made clear in Figures 5 and 6. They show, for collision and comprehensive, respectively, that there is no discernible change in the density of the predicted claim rate when controls for income are included in the model.
* * *
In sum, we find that insurance score does not proxy for income in predicting auto claim risk. The underlying reason is that insurance score and income are very weakly correlated. For instance, when we calculate the Pearson correlation coefficient between insurance score and = median income + home value + (median income × home value), we find that the correlation is 0.0284 (p-value = 0.0000). This is very weak. Moreover it is negative, implying a slightly favorable impact of insurance scoring on low income households.27
D. Renters versus Homeowners
All of the households in our main sample are homeowners; none are renters. However, there are reasons to believe that renters may differ from homeowners in terms of their incomes and insurance scores. An important question, therefore, is whether our main finding for homeowners—that insurance score does not proxy for income in predicting auto claim risk—holds equally for renters.
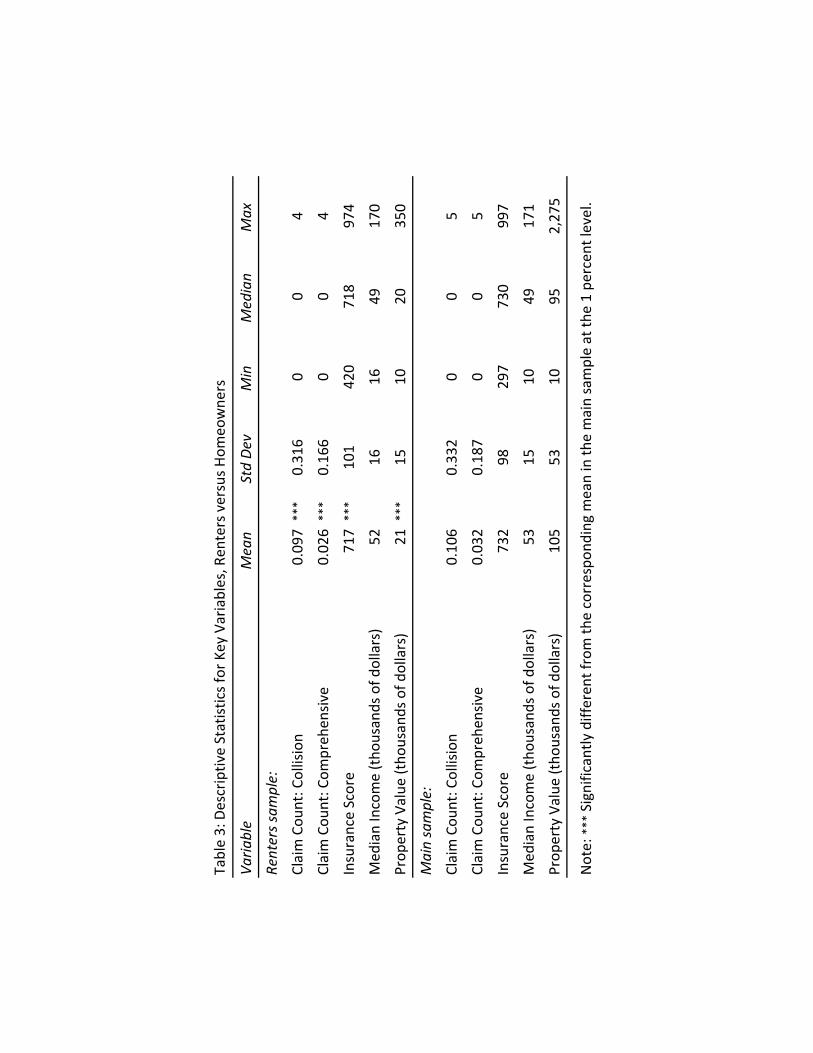
In an effort to address this question, we analyze a sample of 8,685 households who purchased auto and renters insurance from the company in one or more years between 1998 and 2006. We repeat the same analyses on the renters sample that we conduct on the main sample. The only difference is that in the renters sample our policyholder-level measure of income is the insured value of the personal property covered by the household's renters policy ("property value").
26 It is important to note that measurement error arising from using home value in lieu of income biases this effect towards zero. But because of the fairly strong correlation between home value and income (0.35 in the SCF data), we are comfortable that the bias is not driving the result. The degree of bias implied by this correlation is not sufficient to drive to zero what otherwise would be a substantial effect in the absence of measurement error. 27 What's more, if we break down the main sample by median income and home value quartiles, we find that the correlation is very weak in each subsample. This suggests that the very weak correlation we find in the main sample is not masking systematic differences across income categories that are just cancelling out.
17
In all, the renters sample has 28,643 household-year records. Table 3 reports descriptive statistics for the key variables. For purposes of comparison, the table also reports the corresponding statistics for the main sample. On average, the households in the renters sample have lower claim counts and insurance scores than the households in the main sample. Although they have similar median incomes, the households in the renters sample have substantially lower property values than the households in the main sample.
Notwithstanding the differences between the two samples, the results of our analysis for the renters sample are qualitatively the same as the results for the main sample. We again find that insurance score does not proxy for income in predicting auto claim risk—insurance score predicts claim risk within income groups, income does not predict claim risk, and controlling for income does not change the impact of insurance score on predicted claim risk (see Table 4). And again the underlying reason is that the correlation between insurance score and income is very weak: 0.0395 (p-value =0.0000).28
V. DISCUSSION
We conclude the paper in this section by discussing the policy implications of our findings. Before turning to this discussion, however, we want to highlight four caveats of our analysis.
The first caveat relates to our income measures. We employ two measures of a household's income in our main analysis: (i) the median income in the household's census tract ("median income") and (ii) the insured value of the dwelling covered by its homeowners policy ("home value"). Insofar as we observe and utilize home value, a policyholder-level measure of income, in addition to median income, an aggregate measure of income (and, indeed, the same aggregate measure used by the FTC), we believe that our study greatly improves upon the existing literature. The fact remains, however, that we do not directly observe a household's income—median income and home value are indirect measure of income.29 Ideally, one would have a direct measure of income.30
The second caveat relates to our data. Our data is high quality administrative data. However, it comes from a single insurer operating in a single state. Consequently, it may not be representative of other insurers in other states. We have no reason to believe that the insurer is not representative of other insurers in other states. But it is possible.
28 In the case of the renters sample, we measure income by = median income + property value + (median income × property value). 29 Also, we do not directly observe census tract. Rather, we observe zip code and we use HUD "crosswalk files" to allocate census tract data to zip codes. 30 In our analysis of the renters sample, we use the insured value of the personal property covered by the household's renters policy ("property value") as our policyholder-level measure of income. The foregoing caveat applies equally to property value.
18
The third caveat relates to our model. The Poisson model with gamma distributed random effects is a standard actuarial model of claim risk. Nevertheless, there are other models that one might consider. Moreover, although the model, under certain conditions, can be consistently estimated via maximum likelihood, there are other estimation methods that one might use (e.g., generalized estimating equations based on marginal moments) and which, under certain conditions, may be more efficient.
The fourth caveat relates to the renters sample. The renters sample comprises households that purchase an HO-4 policy, common known as a renters policy. However, HO-4 policies are purchased not only by tenants but also by members of housing cooperatives (aka co-op owners). Arguably, co-op owners are more like homeowners than renters. We do not know the exact number of co-op owners in the renters sample. Based on the households' territory codes, however, we believe that the number of co-op owners is very small (less than 1 percent of the renters sample).
With these caveats in mind, we now turn to the policy implications of our findings.
Our results tend to undermine two objections to insurers' use of credit-based information in their rating and underwriting practices. First, our finding that insurance scores do not operate as a proxy for income in predicting claims risk refutes the strongest argument for regulating insurers' use of credit-based information. As described in Section II, it is theoretically plausible that insurers knowingly or unknowingly use credit-based insurance scores to proxy for policyholders' income. Such a practice, even if it were actuarially justified, would raise substantial regulatory concerns given the norm against income-based discrimination in insurance and the principle that insurers cannot be permitted to accomplish indirectly what they are prohibited from doing directly. It is for precisely these reasons that critics of insurance scoring often invoke the income-proxy argument. Our findings tend to diminish the weight that these concerns should be given in policy and regulatory debates.
Second, our findings tend to suggest that insurance scoring does not always or necessarily have a disparate impact on low income policyholders. In our sample, policyholders' incomes, as measured by median incomes and home values, are very weakly correlated with their insurance scores. By contrast, advocates and policymakers often assume that insurance scores do tend to correlate with policyholder income or wealth, as those with higher incomes can presumably more easily avoid defaulting on their debt or otherwise encountering credit-related problems. As noted in Section II, the legal relevance of any such disparate impact effect is highly contested. But the prospect that insurance scoring may disparately impact low income policyholders has obvious political salience. By demonstrating that policyholder income does not necessarily correlate with insurance scores, our results again undermine the case for regulatory or legal restrictions on insurance scoring.
19
What's more, our results tend to buttress the claim advanced by the insurance industry, as well as by Brockett and Golden (2007) and Golden et al. (2016), that insurance scores are predictive of risk because they operate as a rough measure of policyholders' "responsibility" or level of caution. Of course, our results do not directly test this hypothesis for the same reason that no prior study has been able to do so: it is not clear how researchers could measure policyholder responsibility independently of credit-based information. But the primary alternative explanation for the predictive capacity of insurance scores is that they proxy for income. By demonstrating that insurance scores are substantially predictive of policyholder claims even when they are not correlated to policyholder income, our study lends further credence to the responsibility-based theory of insurance scores' predictive power.
At bottom the policy debate about insurance scoring is a debate about equity versus efficiency, and the terms of the debate are much the same as they are in the debates about other methods of risk classification (Abraham 1985, 1986; Avraham et al. 2014a). Proponents of legal restrictions on insurance scoring and other risk classification methods typically point to distributional and deontological equity considerations that may be furthered thereby, including, for instance, access to insurance for high-risk, low-income insureds (Meier 1991). Opponents, meanwhile, typically point to efficiency considerations, including, foremost, that such restrictions may artificially create asymmetric information and thereby induce "regulatory" adverse selection (Hoy 2006). There is a rich academic literature on the equity-efficiency tradeoff of risk classification in insurance markets, including both theoretical treatments (see, e.g., Dionne and Rothschild 2014 and sources cited therein) and empirical studies (see, e.g., sources cited in Einav et al. 2010). While we do not engage here with all sides of the equity-versus-efficiency debate surrounding insurance scoring, our analysis contributes to the debate by offering new evidence on the validity of an important equity-based objection to the practice of insurance scoring.
REFERENCES
Abraham, Kenneth S. (1985) "Efficiency and Fairness in Insurance Risk Classification," 71 Virginia Law Review 403.
Abraham, Kenneth S. (1986) Distributing Risk: Insurance, Legal Theory, and Public Policy. New Haven, CT: Yale University Press.
Allstate Insurance Company (2015) "Allstate's Use of Credit Information to Evaluate Insurance Policies," https://www.allstate.com/about/credit.aspx.
Avraham, Ronen, Kyle D. Logue, & Daniel Schwarcz (2014a) "Understanding Insurance Discrimination," 87 Southern California Law Review 195.
——— (2014b) "Towards a Universal Framework for Insurance Anti-Discrimination Laws," 21 Connecticut Insurance Law Journal 1.
20
Balber, Carmen, Birny Birnbaum, Nadine Cohen, Deirdre Cummings, Stephen D. Amato, Robert Hunter, Allan Rodgers, Paul Schlaver, Paul Schrader, & Chi Chi Wu (2007) "Letter to Massachusetts Insurance Commissioner 8-1-07 RE: Banning the Use of Socioeconomic Factors by Auto Insurance Companies in Private Passenger Automobile Insurance," http://www.consumerwatchdog.org/feature/letter-massachusetts-insurance-commissioner-8-1-07-re-banning-use-socioeconomic-factors-auto.
Birnbaum, Birny (2015) "Credit Scoring in Insurance: An Unfair Practice,"” United Policyholders, http://www.uphelp.org/library/resource/credit-scoring-insurance-unfair-practice.
Brilmayer, Lea, Douglas Laycock, & Teresa A. Sullivan (1983) "The Efficient Use of Group Averages as Nondiscrimination: A Rejoinder to Professor Benston," 50 University of Chicago Law Review 222.
Brobeck, Stephen, & J. Robert Hunter (2012) "Lower-Income Households and the Auto Insurance Marketplace: Challenges and Opportunities," Consumer Federation of America, http://www.consumerfed.org/pdfs/Hunter-Brobeck-LMI-HOUSEHOLDS+AUTOINSURANCEMARKETPLACECHALLENGES+OPPORTUNITIES.pdf.
Brobeck, Stephen, J. Robert Hunter, & Tom Feltner (2013) "Use of Credit Scores by Auto Insurers Adversely Impacts Low- and Moderate-Income Drivers," Consumer Federation of America, http://consumerfed.org/reports/use-of-credit-scores-by-auto-insurers-adversely-impacts-low-and-moderate-income-drivers/.
Brockett, Patrick L., & Linda L. Golden (2007) "Biological and Psychobehavioral Correlates of Credit Scores and Automobile Insurance Losses: Toward an Explication of Why Credit Scoring Works," 74 Journal of Risk and Insurance 23.
Cameron, A. Colin, & Pravin K. Trivedi (1998) Regression Analysis of Count Data. Cambridge: Cambridge University Press.
Carnell, Richard Scott, Jonathan R. Macey, & Geoffrey P. Miller (2013) The Law of Financial Institutions, 5th edition. New York: Aspen.
Center for Economic Justice (2005) "Insurance Credit Scoring: An Unfair Practice," http://www.cej-online.org/cej%20report%20ins%20cr%20scoring%200501.pdf.
Consumer Reports (2015) "The Truth About Car Insurance," http://www.consumerreports.org/cro/car-insurance/auto-insurance-special-report/index.htm.

21
Denuit, Michel, Xavier Maréchal, Sandra Pitrebois, & Jean-FrançoisWalhin (2007) Actuarial Modelling of Claim Counts: Risk Classification, Credibility and Bonus-Malus Systems. Chichester, UK: John Wiley.
Dionne, Georges, & Casey G. Rothschild (2014) "Economic Effects of Risk Classification Bans," 39 Geneva Risk and Insurance Review 184.
Einav, Liran, Amy Finkelstein, & Jonathan Levin (2010) "Beyond Testing: Empirical Models of Insurance Markets," 2 Annual Review of Economics 311.
Fair Isaac Corporation (2015a) "FICO Insurance Scores: What's In Your Score," http://insurancescores.fico.com/InScore.
——— (2015b) "myFICO: What's in My Score, http://www.myfico.com/CreditEducation/WhatsInYourScore.aspx.
Federal Insurance Office (2014) "Monitoring Availability and Affordability of Auto Insurance," https://www.federalregister.gov/articles/2014/04/10/2014-08100/monitoring-availability-and-affordability-of-auto-insurance.
Federal Trade Commission (2007) "Credit-Based Insurance Scores: Impacts on Consumers of Automobile Insurance," http://www.ftc.gov/os/2007/07/P044804FACTA_Report_Credit-Based_lnsurance_Scores.pdf.
Finkelstein, Amy, & James Poterba (2014) "Testing for Asymmetric Information Using 'Unused Observables' in Insurance Markets: Evidence from the U.K. Annuity Market," 81 Journal of Risk and Insurance, 709.
Golden, Linda L., Patrick L. Brockett, & Jing Ai (2016) "Empirical Evidence on the Use of Credit Scoring for Predicting Insurance Losses with Psycho-Social and Biochemical Explanations," 20 North American Actuarial Journal ___.
Honey, Dan (2015) "Use and Impact of Credit in Personal Lines Insurance Premiums Pursuant to Ark. Code Ann. § 23-67-415," http://www.insurance.arkansas.gov/index_htm_files/2015Credit.pdf.
Hoy, Michael (2006) "Risk Classification and Social Welfare," 31 Geneva Papers on Risk and Insurance: Issues and Practice 245.
Hunter, J. Robert, Tom Feltner, & Douglas Heller (2013) "What Works: A Review of Auto Insurance Rate Regulation in America and How Best Practices Save Billions of Dollars,"” Consumer Federation of America, http://www.consumerfed.org/pdfs/whatworks-report_nov2013_hunter-feltner-heller.pdf.
22
Insurance Information Institute (2015) "Credit Scoring," http://www.iii.org/issue-update/credit-scoring.
Kabler, Brent (2004) "Insurance-Based Credit Scores: Impact on Minority and Low Income Populations in Missouri," Missouri Department of Insurance, http://www.insurance.mo.gov/reports/credscore.pdf.
Meier, Kenneth J. (1991) "The Politics of Insurance Regulation," 58 Journal of Risk and Insurance 700.
Meier, Kenneth J. (1998) The Political Economy of Regulation: The Case of Insurance. Albany, NY: SUNY Press.
Miller, Michael J., & Richard A. Smith (2003) "The Relationship of Credit-Based Insurance Scores to Private Passenger Automobile Insurance Loss Propensity," http://www.ask-epic.com/Publications/Relationship%20of%20Credit%20Scores_062003.pdf.
National Association of Insurance Commissioners (2009) Market Regulation Handbook. Kansas City, MO: NAIC.
National Association of Insurance Commissioners (2012a) "Credit-Based Insurance Scores: How an Insurance Company Can Use Your Credit to Determine Your Premium," http://www.naic.org/documents/consumer_alert_credit_based_insurance_scores.htm.
——— (2012b) "Work Plan for Auto Insurance (C/D) Study Group," http://www.naic.org/documents/committees_c_d_auto_insurance_study_group_related_docs_work_plan.pdf.
——— (2014) "compendium of Reports on the Pricing of Personal Auto Insurance,” http://www.naic.org/documents/committees_c_d_auto_insurance_study_group_related_nal_auto_study_report.pdf.
National Association of Mutual Insurance Companies (2004) "The Legal Theory of Disparate Impact Does Not Apply to the Regulation of Credit-Based Insurance Scoring," http://www.namic.org/pdf/publicpolicy/04DisparateImpact.pdf.
National Conference of Insurance Legislators (2009) "Model Act Regarding Use of Credit Information in Personal Insurance," http://www.ncoil.org/Private/2009/Docs/07172009CreditScoringModel.pdf.
North Carolina Department of Insurance (2010) "A Consumer's Guide to Insurance Companies’ Use of Credit Information," http://www.ncdoi.com/_Publications/Consumer%20Guide%20to%20Understanding%20How%20Insurers%20use%20Credit%20Information_CSH1.pdf.
23
O'Neill, Ian (2007) "Disparate Impact, Federal/State Tension, and the Use of Credit Scores by Insurance Companies," 19 Loyola Consumer Law Review 151.
Pope, Devin G., & Justin R. Sydnor (2011) "Implementing Anti-Discrimination Policies in Statistical Profiling Models, "3 American Economic Journal: Economic Policy 206.
Robinson, Angel N. (2011) "The Use of Credit-Based Insurance Scoring in Iowa," Iowa Insurance Division, http://insuranceca.iowa.gov/hot_consumer_topics/insurancescoringreport.pdf.
Shepard, Lea (2012)" Toward a Stronger Financial History Antidiscrimination Norm," 53 Boston College Law Review 1695.
Squires, Gregory D. (2003) "Racial Profiling, Insurance Style: Insurance Redlining and the Uneven Development of Metropolitan Areas," 25 Journal of Urban Affairs 391.
Texas Department of Insurance (2004) "Use of Credit Information by Insurers in Texas," https://www.tdi.state.tx.us/reports/documents/creditall04.pdf.
——— (2005) "Use of Credit Information by Insurers in Texas: The Multivariate Analysis," http://www.tdi.texas.gov/reports/documents/credit05sup.pdf.
Wooldridge, Jeffrey M. (2002) Econometric Analysis of Cross Section and Panel Data. Cambridge, MA: MIT Press.
Wu, Chi Chi, & Birny Birnbaum (2007) "Credit Scoring and Insurance: Costing Customers Billions and Perpetuating the Economic Racial Divide," National Consumer Law Center, http://www.nclc.org/images/pdf/report-insurance-scoring-2007.pdf.

Varia
ble
Mean
Std De
vMin
5th Pctl
25th Pctl
Median
75th Pctl
95th Pctl
Max
Claim Cou
nt: C
ollision
0.10
60.33
20
05
Claim Cou
nt: C
ompreh
ensiv
e0.03
20.18
70
05
Insurance Score
732
9829
756
967
073
079
988
699
7
Med
ian Income (tho
usands of d
ollars)
5315
1035
4249
6099
171
Home Va
lue (tho
usands of d
ollars)
153
771
7010
813
918
028
13,25
0
Table 1: Descriptiv
e Statistics for Key Variables, M
ain Sample
Std Err
Std Err
Std Err
Std Err
Constant
‐6.773
52***
0.14
724
‐6.669
37***
0.14
235
‐8.012
63***
0.27
235
‐8.277
08***
0.26
258
Insurance Score
‐0.002
11***
0.00
007
‐0.002
11***
0.00
007
‐0.001
74***
0.00
013
‐0.001
76***
0.00
013
Med
ian Income
0.00
102
0.00
084
‐0.006
35***
0.00
168
Home Va
lue
0.00
864
***
0.00
020
‐0.000
79**
0.00
036
Med
ian Income x Ho
me Va
lue
0.00
000
0.00
000
0.00
002
***
0.00
001
Controls
Varia
nce (α)
0.16
943
***
0.01
130
0.17
250
***
0.01
134
0.56
476
***
0.03
936
0.56
646
***
0.03
940
Loglikelihoo
dNotes: R
espo
nse varia
ble is claim cou
nt. Con
trols include
variables th
at indicate or record the nu
mbe
r and
age of the
driv
ers a
nd veh
icles, th
e gend
er and
marita
l status o
f the
prim
ary and second
ary drivers, th
e principal use and
safety fe
atures of the
prim
ary and second
ary vehicles, the
prim
ary driver's
departmen
t of m
otor veh
icles record (acciden
ts, con
victions, reinstatemen
ts, revocations, suspe
nsions, violatio
ns), the year of o
bservatio
n, and
the po
licy's
ratin
g territo
ry. W
e accoun
t for differen
ces in ob
servation pe
riods by includ
ing the log of exposure in th
e mod
el with
the coefficient con
strained
to be on
e.
*** Significant at the
1 percent level. ** Significant a
t the
5 percent level.
‐43,91
8
Table 2: Poisson
Rando
m Effe
cts M
odel, M
ain Sample
Collisio
nCo
mprehensiv
e
Yes
Yes
(b)
Coef
Yes
‐43,92
8‐109
,195
‐109
,236
(a)
(a)
(b)
Coef
Coef
Coef
Yes
Varia
ble
Mean
Std De
vMin
Median
Max
Renters sam
ple:
Claim Cou
nt: C
ollision
0.09
7***
0.31
60
04
Claim Cou
nt: C
ompreh
ensiv
e0.02
6***
0.16
60
04
Insurance Score
717
***
101
420
718
974
Med
ian Income (tho
usands of d
ollars)
5216
1649
170
Prop
erty Value
(tho
usands of d
ollars)
21***
1510
2035
0
Main sample:
Claim Cou
nt: C
ollision
0.10
60.33
20
05
Claim Cou
nt: C
ompreh
ensiv
e0.03
20.18
70
05
Insurance Score
732
9829
773
099
7
Med
ian Income (tho
usands of d
ollars)
5315
1049
171
Prop
erty Value
(tho
usands of d
ollars)
105
5310
952,27
5
Table 3: Descriptiv
e Statistics for Key Variables, R
enters versus H
omeo
wne
rs
Note: *** Significantly
differen
t from th
e correspo
nding mean in th
e main sample at th
e 1 pe
rcen
t level.

Std Err
Std Err
Std Err
Std Err
Constant
‐5.069
32***
0.44
966
‐4.996
26***
0.43
749
‐6.768
74***
0.90
384
‐7.234
05***
0.87
664
Insurance Score
‐0.002
16***
0.00
023
‐0.002
19***
0.00
023
‐0.002
38***
0.00
045
‐0.002
39***
0.00
045
Med
ian Income
0.00
098
0.00
224
‐0.009
81**
0.00
472
Prop
erty Value
0.00
704
**0.00
330
‐0.009
200.00
668
Med
ian Income x Prop
erty Value
‐0.000
060.00
005
0.00
013
0.00
009
Controls
Varia
nce (α)
0.15
345
***
0.04
620
0.15
750
***
0.04
639
0.46
796
***
0.17
924
0.47
366
***
0.17
952
Loglikelihoo
dNotes: R
espo
nse varia
ble is claim cou
nt. Con
trols include
variables th
at indicate or record the nu
mbe
r and
age of the
driv
ers a
nd veh
icles, th
e gend
er and
marita
l status o
f the
prim
ary and second
ary drivers, th
e principal use and
safety fe
atures of the
prim
ary and second
ary vehicles, the
prim
ary driver's
departmen
t of m
otor veh
icles record (acciden
ts, con
victions, reinstatemen
ts, revocations, suspe
nsions, violatio
ns), the year of o
bservatio
n, and
the po
licy's
ratin
g territo
ry. W
e accoun
t for differen
ces in ob
servation pe
riods by includ
ing the log of exposure in th
e mod
el with
the coefficient con
strained
to be on
e.
*** Significant at the
1 percent level. ** Significant a
t the
5 percent level.
Yes
Yes
Table 4: Poisson
Rando
m Effe
cts M
odel, R
enters Sam
ple
Collisio
nCo
mprehensiv
e
(a)
(b)
(a)
(b)
‐9,317
‐9,320
‐3,274
‐3,276
Coef
Coef
Coef
Coef
Yes
Yes
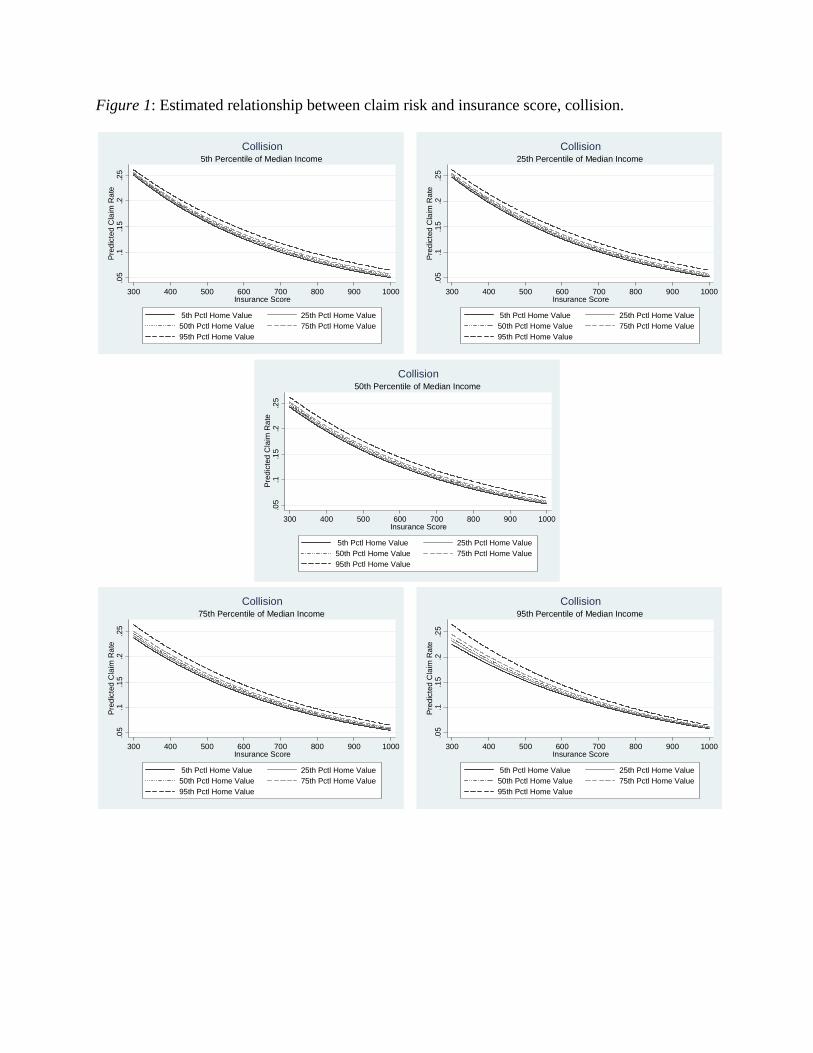
Figure 1: Estimated relationship between claim risk and insurance score, collision.
.05
.1.1
5.2
.25
Pre
dic
ted
Cla
im R
ate
300 400 500 600 700 800 900 1000Insurance Score
5th Pctl Home Value 25th Pctl Home Value50th Pctl Home Value 75th Pctl Home Value95th Pctl Home Value
5th Percentile of Median IncomeCollision
.05
.1.1
5.2
.25
Pre
dic
ted
Cla
im R
ate
300 400 500 600 700 800 900 1000Insurance Score
5th Pctl Home Value 25th Pctl Home Value50th Pctl Home Value 75th Pctl Home Value95th Pctl Home Value
25th Percentile of Median IncomeCollision
.05
.1.1
5.2
.25
Pre
dic
ted
Cla
im R
ate
300 400 500 600 700 800 900 1000Insurance Score
5th Pctl Home Value 25th Pctl Home Value50th Pctl Home Value 75th Pctl Home Value95th Pctl Home Value
50th Percentile of Median IncomeCollision
.05
.1.1
5.2
.25
Pre
dic
ted
Cla
im R
ate
300 400 500 600 700 800 900 1000Insurance Score
5th Pctl Home Value 25th Pctl Home Value50th Pctl Home Value 75th Pctl Home Value95th Pctl Home Value
75th Percentile of Median IncomeCollision
.05
.1.1
5.2
.25
Pre
dic
ted
Cla
im R
ate
300 400 500 600 700 800 900 1000Insurance Score
5th Pctl Home Value 25th Pctl Home Value50th Pctl Home Value 75th Pctl Home Value95th Pctl Home Value
95th Percentile of Median IncomeCollision
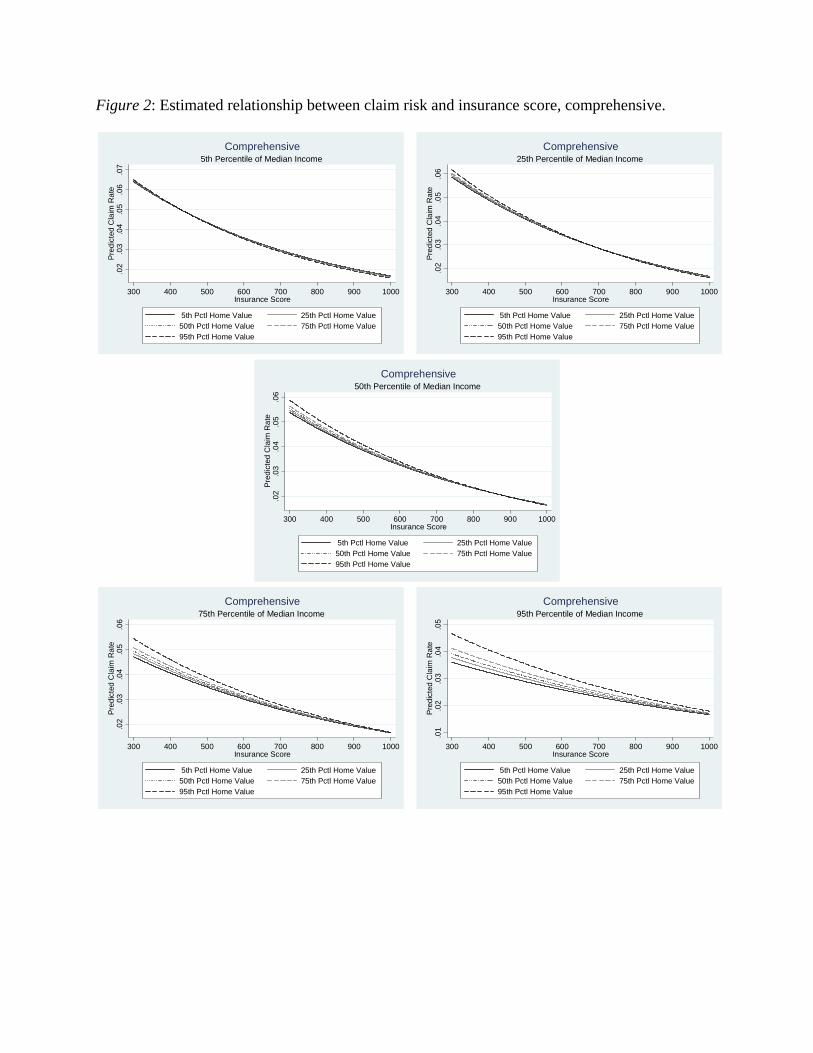
Figure 2: Estimated relationship between claim risk and insurance score, comprehensive.
.02
.03
.04
.05
.06
.07
Pre
dic
ted
Cla
im R
ate
300 400 500 600 700 800 900 1000Insurance Score
5th Pctl Home Value 25th Pctl Home Value50th Pctl Home Value 75th Pctl Home Value95th Pctl Home Value
5th Percentile of Median IncomeComprehensive
.02
.03
.04
.05
.06
Pre
dic
ted
Cla
im R
ate
300 400 500 600 700 800 900 1000Insurance Score
5th Pctl Home Value 25th Pctl Home Value50th Pctl Home Value 75th Pctl Home Value95th Pctl Home Value
25th Percentile of Median IncomeComprehensive
.02
.03
.04
.05
.06
Pre
dic
ted
Cla
im R
ate
300 400 500 600 700 800 900 1000Insurance Score
5th Pctl Home Value 25th Pctl Home Value50th Pctl Home Value 75th Pctl Home Value95th Pctl Home Value
50th Percentile of Median IncomeComprehensive
.02
.03
.04
.05
.06
Pre
dic
ted
Cla
im R
ate
300 400 500 600 700 800 900 1000Insurance Score
5th Pctl Home Value 25th Pctl Home Value50th Pctl Home Value 75th Pctl Home Value95th Pctl Home Value
75th Percentile of Median IncomeComprehensive
.01
.02
.03
.04
.05
Pre
dic
ted
Cla
im R
ate
300 400 500 600 700 800 900 1000Insurance Score
5th Pctl Home Value 25th Pctl Home Value50th Pctl Home Value 75th Pctl Home Value95th Pctl Home Value
95th Percentile of Median IncomeComprehensive

Figure 3: Estimated relationship between claim risk and income, collision.
Figure 4: Estimated relationship between claim risk and income, comprehensive.
.09
.1.1
1.1
2.1
3P
red
icte
d C
laim
Ra
te
0 100 200 300 400 500Home Value
5th Pctl Median Income 25th Pctl Median Income50th Pctl Median Income 75th Pctl Median Income95th Pctl Median Income
Collision.0
2.0
22.0
24.0
26.0
28.0
3P
red
icte
d C
laim
Ra
te
0 100 200 300 400 500Home Value
5th Pctl Median Income 25th Pctl Median Income50th Pctl Median Income 75th Pctl Median Income95th Pctl Median Income
Comprehensive
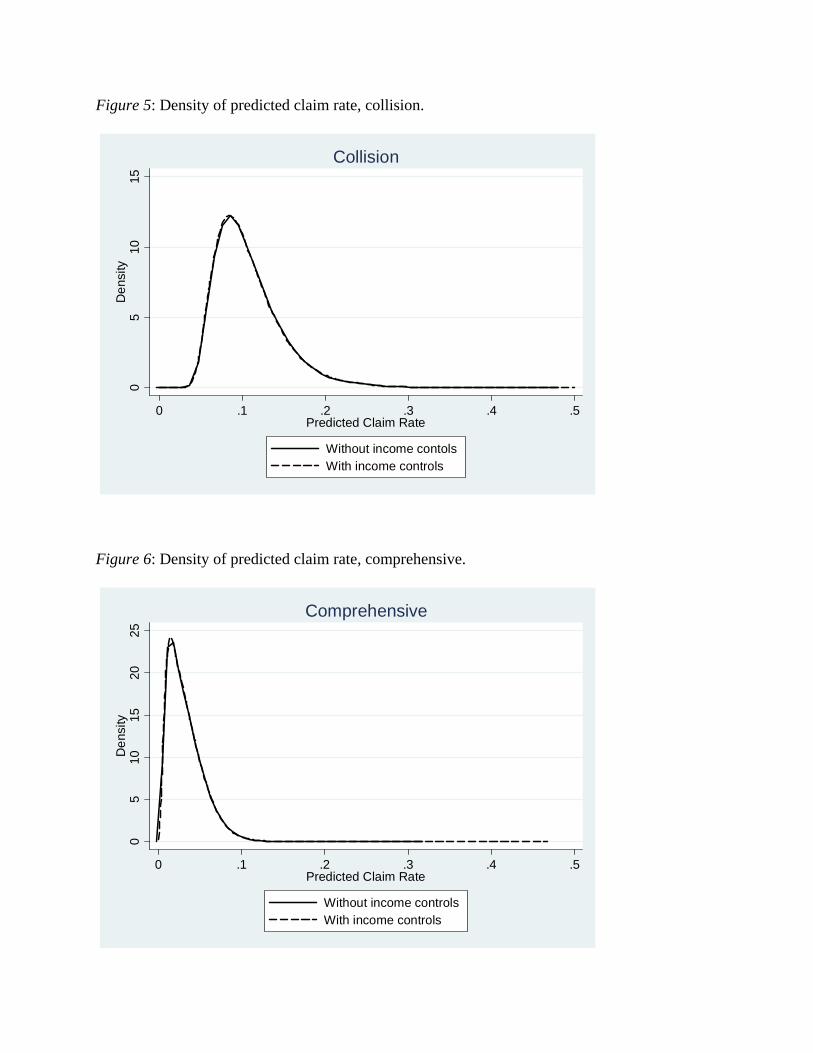
Figure 5: Density of predicted claim rate, collision.
Figure 6: Density of predicted claim rate, comprehensive.
05
1015
De
nsity
0 .1 .2 .3 .4 .5Predicted Claim Rate
Without income contolsWith income controls
Collision0
510
1520
25D
ens
ity
0 .1 .2 .3 .4 .5Predicted Claim Rate
Without income controlsWith income controls
Comprehensive