do the uk government's welfare reforms make work … · do the uk government’s welfare...
TRANSCRIPT
Do the UK Government’s welfare reforms make work pay?
IFS Working Paper W13/26 Stuart Adam James Browne
© Institute for Fiscal Studies, 2013
1
Do the UK government’s welfare reforms
make work pay?
Stuart Adam and James Browne*
Institute for Fiscal Studies
Executive Summary
The UK government is in the process of introducing a radical package of welfare reforms that
it hopes will encourage more people to work as well as reducing government expenditure. The
largest structural change planned is the introduction of universal credit to combine six existing
means-tested benefits for those of working age into a single payment, which is intended to
reduce administration costs and errors, simplify claims, encourage take-up, and increase the
incentive to work for those currently facing the weakest incentives. But the deficit reduction
package has also involved tax changes and large benefit cuts that have an impact on financial
work incentives. At the same time as these reforms have been introduced, weakness in the
economy has meant that earnings have increased less quickly than benefit rates, which tends to
make working less attractive. In this paper, we use micro-simulation techniques to investigate
whether financial work incentives will indeed be stronger in 2015–16 than they were in 2010–11
and to separate out the impact of changes to taxes, benefit cuts and the introduction of universal
credit from the impact of wider economic changes.
We distinguish between two kinds of work incentive: the incentive to be in paid work at all
and the incentive for those in work to increase their earnings. The financial incentive to be in
work at all can be measured using the replacement rate (RR), which gives the income an
individual would receive if they were not working as a percentage of the income they would
receive if they were working, and the participation tax rate (PTR), the proportion of total gross
earnings lost in the form of tax and withdrawn benefits. The incentive for those in work to
increase their earnings can be measured by the effective marginal tax rate (EMTR), the
proportion of a small increase in earnings lost in tax and withdrawn benefits. In all cases, higher
numbers mean weaker work incentives. These measures of work incentives are affected both by
changes in the gross amount individuals can earn if they are working, and by reforms to taxes
and benefits that affect the relationship between gross earnings and net income.
Falling real earnings since the start of the recession are reducing household incomes in the
UK. They are also changing people’s incentives to work, as nominal earnings are increasing more
slowly than rates and thresholds in the tax and benefit system, which mostly increase in line with
inflation in the absence of discretionary reforms. In the absence of reforms, we find that RRs
would increase, as we would expect when earnings increase less quickly than benefits. The mean
RR rises from 55.3% to 57.0%, and the median RR from 56.6% to 58.6%. PTRs and EMTRs would
also increase on average, but by less.
* This research was funded by the ESRC Centre for the Microeconomic Analysis of Public Policy at the Institute for Fiscal
Studies (RES-544-28-5001). The Family Resources Survey was collected by the Department for Work and Pensions and made available through the Economic and Social Data Service (ESDS), which bears no responsibility for the interpretation of the data in this Working Paper. Living Costs and Food Survey data are collected by the Office for National Statistics and distributed by the Economic and Social Data Service. Crown copyright material is reproduced with the permission of the Controller of HMSO and the Queen‖s Printer for Scotland. The authors thank Carl Emmerson and Paul Johnson for comments on an earlier draft and Emma Dain of T&T Productions Ltd for copy-editing. Any errors and omissions are the responsibility of the authors.
© Institute for Fiscal Studies, 2013
2
We then consider the impact of tax and benefit reforms that have been implemented, or are
due to be implemented, from when the UK’s coalition government took office in May 2010 until
the scheduled end of its term of office in May 2015. These comprise:
changes to taxes, which bring in revenue (£11 billion in all) predominantly from the richest
tenth of households (indeed households in the middle of the income distribution benefit
from tax changes on average, mainly because of large increases in the income tax personal
allowance);
changes to benefits (excluding universal credit), almost all cuts (raising a net £22 billion),
which unsurprisingly take money predominantly from the bottom half of the income
distribution; and
universal credit (which is forecast to cost £1 billion in 2015–16 but to be revenue-neutral in
the longer term) is neither clearly progressive nor clearly regressive overall, but is
nevertheless of most benefit to one-earner couples with children, with workless households
losing out on average.
These reforms strengthen average incentives for individuals to be in work. Taking tax and
benefit reforms together, they reduce the mean RR by 2.7 percentage points (ppts) excluding
universal credit and 3.4ppts including it, and reduce the mean PTR by 1.8ppts excluding
universal credit and 2.5ppts including it. These reductions more than offset the impact of falling
real earnings.
But while these changes to average RRs and PTRs are far from negligible, they are relatively
modest considering the sheer scale of the reforms in question. The averages conceal far bigger
changes at the individual level: for example, 30% of working-age adults (11 million people) see
their PTR change by more than 5ppts (7.5 million down by at least 5 ppts and 3.5 million up by at
least 5ppts), 17% by more than 10ppts (4 million down by at least 10 ppts and 2.3 million up by
at least 10 ppts) and 7% by more than 20 ppts (1.6 million down by at least 20 ppts and 1.1
million up by at least 20 ppts) as a result of the benefit reforms (including universal credit). The
relatively modest averages reflect strengthening of incentives for some being offset by
weakening for others.
Benefit changes other than universal credit are responsible for the bulk of the reduction in the
mean RR and PTR. For those without a working partner (i.e. single people and people with non-
working partners), the effect of the benefit changes on incentives to be in work is in principle
ambiguous: it depends whether in-work support or out-of-work support is cut by more. In
practice, relatively few of those without children are entitled to tax credits if they work, so cuts to
out-of-work benefits dominate and these groups see the biggest increases in their average RRs
and PTRs. For those with children, however, reductions in the tax credits they receive if they
work are significant while tax credits (though not benefits) for non-working families have
actually been increased. Lone parents and parents with non-working partners – particularly
those who earn little if they work – thus see the smallest reductions in their mean RRs, and
indeed see their mean PTRs increased by benefit changes excluding universal credit. For those
with a working partner – about half the working-age population – the strengthening of incentives
is largely unambiguous. Benefit cuts mean less (if any) support with one partner in work, and so
less to lose by a second partner working.
Universal credit also has different effects on different groups. Since the main gainers from the
introduction of universal credit are one-earner couples with children, it increases the
attractiveness of being a one-earner couple relative to being a zero-earner or a two-earner
couple. Thus it strengthens the incentive for couples to have one person in work rather than
none, but also weakens the incentive for both members of a couple to work rather than just one,
unlike the other benefit reforms. Another notable effect of universal credit is to remove most of
© Institute for Fiscal Studies, 2013
3
the very highest RRs and PTRs that exist under the current tax and benefit system: it reduces the
number of individuals with RRs of 75% or more by 400,000 and reduces the number of
individuals with PTRs of 75% or more by half (or 1.5 million).
Turning to the incentive for those in work to increase their earnings, we again see dramatic
effects at the individual level. One in five working adults (5 million people) see their EMTR
change by more than 5 ppts as a result of the benefit reforms (including universal credit,
3.3 million down by at least 5 ppts and 1.7 million up by at least 5ppts) and one in ten (3 million)
see a change of more than 20 ppts (2 million down by at least 20ppts and 1 million up by at least
20 ppts).
Big changes at the individual level offset each other for the population as a whole. universal
credit reduces EMTRs for those who face the very highest EMTRs under the current system,
significantly reducing the average EMTR for lone parents in particular, but increases EMTRs for
many others. Reductions in the generosity of means-tested benefits mean that fewer workers
face the high EMTRs associated with benefit tapers; but tax changes, in particular increases in
rates of National Insurance contributions and VAT, tend to increase EMTRs, except at very low
levels of earnings where increases in thresholds have taken many people out of income tax (and
some people out of NICs) altogether. Taking all tax and benefit reforms together, it turns out that
the average EMTR across all workers barely changes at all.
To summarise: the government’s welfare reforms strengthen financial incentives to be in
work, on average, more than offsetting the weakening caused by falling real wages. The patterns
vary across the population, however, and particularly between first and second earners in
couples. Universal credit contributes to this strengthening of incentives to be in work – a notable
achievement given that it is broadly revenue-neutral and distributionally neutral. But the
strengthening is predominantly caused by reductions in the generosity of means-tested benefits,
though reductions in average RRs and PTRs are perhaps less dramatic than might be expected
given the scale of the cuts, in part because of the way the government has changed tax credits for
families with children. Benefit cuts also reduce the number of people on means-tested benefit
tapers, but the reduction in average EMTRs this causes is no greater than the rise in average
EMTRs caused by the tax increases introduced by the coalition government. However, while
these changes are true on average, it is worth emphasising the huge amount of variation there is
at the individual level, with large numbers of people seeing large rises or falls in effective tax
rates. And one unambiguously welcome aspect of the reforms is how universal credit reduces the
number of people facing the very weakest work incentives.
Although this paper focuses on financial work incentives, changes in non-financial incentives
and in the perception of how the tax and benefit system works are also likely to be important.
While universal credit will change the overall entitlements of people in different circumstances,
arguably just as important is the way it integrates different strands of support into a single
benefit. This offers the prospect of greater simplicity and more transparent work incentives –
though perhaps with a less visible and salient incentive to work than working tax credit provides,
and with much depending on how successful the practical implementation proves to be.
Universal credit may also extend work search requirements to many more low earners,
especially in couples, than are subject to them now. Universal credit is not the only benefit
reform being introduced that will affect non-financial work incentives. The Work Programme
involves a significant reorganisation of welfare-to-work; and work search requirements are
being imposed for the first time on many lone parents and previous claimants of disability
benefits. While these changes might be expected to increase moves from non-employment to
employment in principle, in practice it is not clear how large the impact will be.
Finally, we should remember that labour market outcomes do not depend only on incentives
and preferences: given that fairly high levels of unemployment are expected to persist for the
© Institute for Fiscal Studies, 2013
4
coming years, the state of labour demand will also be a key determinant of total employment in
the years to come.
1. Introduction
The UK government is in the process of introducing a radical package of welfare reforms that
it hopes will encourage more people to work, as well as reduce government expenditure. The
largest structural change planned is the introduction of universal credit to combine six means-
tested benefits for those of working age into a single payment, which is intended to reduce
administration costs and errors, simplify claims, encourage take-up, and increase the incentive to
work for those currently facing the weakest incentives. But the deficit reduction package has also
involved tax changes and large benefit cuts that have an impact on financial work incentives. At
the same time as these reforms have been introduced, weakness in the economy has meant that
earnings have increased less quickly than benefit rates, which tends to make working less
attractive. In this paper, we use micro-simulation techniques to investigate whether financial
work incentives will indeed be stronger in 2015–16 than they were in 2010–11 and to separate
out the impact of changes to taxes, benefit cuts and the introduction of universal credit from the
impact of wider economic changes.
In Section 2, we explain how we measure financial work incentives. The focus of this paper is
on welfare reforms; but to put that discussion into context, in Section 3 we look at changes to
financial work incentives that are not directly caused by tax and benefit reforms at all but by
changes in wider economic variables (notably falls in real earnings). Section 4 then describes the
tax and benefit reforms being introduced in the UK between 2010 and 2015. Using the IFS’s tax
and benefit micro-simulation model, TAXBEN, Section 5 shows the distributional impact of these
reforms, while Section 6 quantifies their impact on financial work incentives across the
population. This is done separately excluding and including universal credit, allowing us to assess
the impact of this reform on its own, and because universal credit will in practice be only partly
rolled-out by 2015. Section 7 concludes.
2. Measuring financial work incentives
Financial work incentives depend on the relationship between hours of work and net income
(that is, income after taxes and benefits). Thus, they will depend on both the gross wage rate an
individual can command and the taxes and benefits payable from/to them at different levels of
earnings.
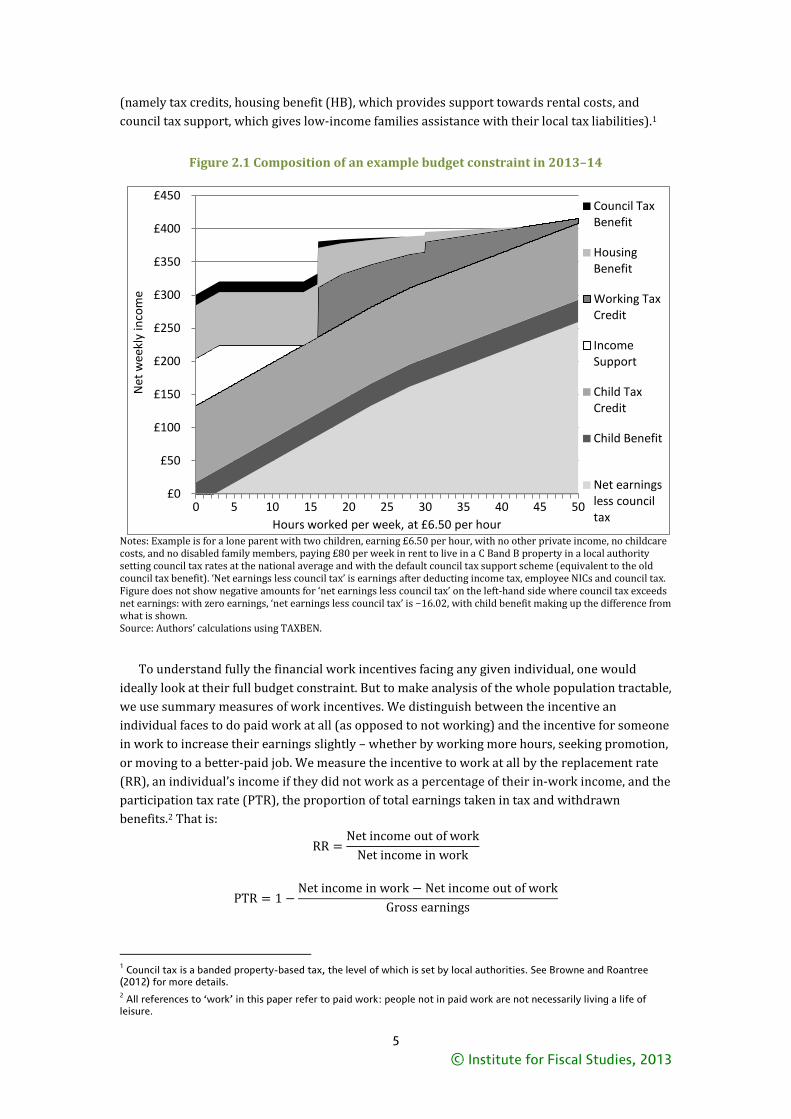
Figure 2.1 shows the budget constraint for one example low-wage lone parent under the
current tax and benefit system and the role of different benefits and tax credits in creating it. One
striking feature is the sheer number of different benefits involved, demonstrating one of the
government’s arguments in favour of the introduction of universal credit, which will combine
most of these benefits into a single payment. At low levels of hours worked, the budget constraint
is completely flat because means-tested out-of-work benefits (income support (IS), income-based
jobseeker’s allowance (JSA) or employment and support allowance (ESA)), which top up
claimants’ income to a minimum level, are reduced pound-for-pound as private income rises until
that minimum level is reached. Working tax credit (WTC) provides support for those who are in
work but have a low income and gives a strong incentive for this lone parent to work at least
16 hours per week; but once over the 16-hour threshold they receive little gain from increasing
their earnings, as they face withdrawal of multiple benefits over the same range of income
© Institute for Fiscal Studies, 2013
5
£0
£50
£100
£150
£200
£250
£300
£350
£400
£450
0 5 10 15 20 25 30 35 40 45 50
Net
wee
kly
inco
me
Hours worked per week, at £6.50 per hour
Council Tax Benefit
Housing Benefit
Working Tax Credit
Income Support
Child Tax Credit
Child Benefit
Net earnings less council tax
(namely tax credits, housing benefit (HB), which provides support towards rental costs, and
council tax support, which gives low-income families assistance with their local tax liabilities).1
Figure 2.1 Composition of an example budget constraint in 2013–14
Notes: Example is for a lone parent with two children, earning £6.50 per hour, with no other private income, no childcare costs, and no disabled family members, paying £80 per week in rent to live in a C Band B property in a local authority setting council tax rates at the national average and with the default council tax support scheme (equivalent to the old council tax benefit). ‘Net earnings less council tax’ is earnings after deducting income tax, employee NICs and council tax. Figure does not show negative amounts for ‘net earnings less council tax’ on the left-hand side where council tax exceeds net earnings: with zero earnings, ‘net earnings less council tax’ is −16.02, with child benefit making up the difference from what is shown. Source: Authors’ calculations using TAXBEN.
To understand fully the financial work incentives facing any given individual, one would
ideally look at their full budget constraint. But to make analysis of the whole population tractable,
we use summary measures of work incentives. We distinguish between the incentive an
individual faces to do paid work at all (as opposed to not working) and the incentive for someone
in work to increase their earnings slightly – whether by working more hours, seeking promotion,
or moving to a better-paid job. We measure the incentive to work at all by the replacement rate
(RR), an individual’s income if they did not work as a percentage of their in-work income, and the
participation tax rate (PTR), the proportion of total earnings taken in tax and withdrawn
benefits.2 That is:
1 Council tax is a banded property-based tax, the level of which is set by local authorities. See Browne and Roantree
(2012) for more details. 2 All references to ―work‖ in this paper refer to paid work: people not in paid work are not necessarily living a life of
leisure.
© Institute for Fiscal Studies, 2013
6
We measure the incentive for those in work to increase their earnings by the effective
marginal tax rate (EMTR), the proportion of a small increase in earnings taken in tax and
withdrawn benefits. In this paper, we calculate EMTRs by increasing individuals’ earnings by one
penny a week, but leaving their hours of work unchanged. In all cases, higher numbers mean
weaker work incentives.
When calculating these measures, we include employer National Insurance Contributions
(NICs) (so our measure of ‘gross earnings’ might more accurately be termed ‘employer cost’), and
we include indirect taxes by imputing an indirect tax rate for each household and assuming that
this rate would apply to any change in their household’s net income.
When looking at work incentives for members of couples, we focus on the relationship
between an individual’s working behaviour and their family’s net income. This implicitly assumes
that couples fully pool their income between them – not a wholly realistic assumption, but
alternative extreme scenarios seem even less plausible and modelling truly realistic within-
household allocations would be too difficult.
The fact that the PTR is based on the difference between in-work and out-of-work income,
while the RR is based on the ratio between them gives them significantly different properties:
something that changes in-work and out-of-work incomes by the same proportion – such as
a uniform VAT – will affect PTRs but have no effect on RRs;
something that changes in-work and out-of-work incomes by the same cash amount – such
as a non-means-tested benefit – will affect RRs but have no effect on PTRs (that is, PTRs do
not reflect income effects). Note that, given how we measure these for couples, something
that changes the income brought in by one member of a couple irrespective of their partner’s
income (a change in their income tax when the family is not subject to a means test, for
example) will therefore change their partner’s RR but not their PTR.
Arguably, the RR is a better measure of the financial incentive to be in work, while the PTR is
a better measure of how far the tax and benefit system weakens the financial incentive to be in
work.
When measuring work incentives, we examine the long-term impact of an individual moving
into work or increasing their earnings on their family’s disposable income, ignoring features of
the tax and benefit system that provide support only temporarily or after a certain waiting
period.
Examining how individual reforms affect example people can be informative. But there is a
limit to what can be achieved by looking at individual examples when circumstances vary so
widely it is hard to be sure how representative a particular person is. And when, on top of that,
we wish to assess the combined effect of a large number of reforms that interact with household
characteristics in complicated ways, a micro-simulation model of the tax and benefit system is
indispensable. The analysis in this paper makes heavy use of the IFS’s tax and benefit micro-
simulation model, TAXBEN, which can be used to calculate how actual and alternative tax and
benefit systems would affect the incomes of a representative sample of the UK population, and
how those same tax and benefit systems would affect their incomes if they stopped working,
increased their earnings, etc.
© Institute for Fiscal Studies, 2013
7
3. The impact of wider economic and demographic
changes on work incentives
Falling real earnings since the start of the recession are reducing household incomes in the
UK.3 They are also changing people’s incentives to work.
RRs, PTRs and EMTRs depend on, among other things, how people’s (actual or potential)
earnings and other private income compare to rates and thresholds in the tax and benefit system.
If individuals’ earnings grow at different rates from tax thresholds or from benefit rates and
thresholds, then the work incentives they face will change.
Under the regime the coalition government inherited in 2010, in the absence of discretionary
reforms, most rates and thresholds affecting those of working age increased in line with Retail
Prices Index (RPI) inflation.4 Earnings have been growing much less quickly than this: from
2010–11 to 2012–13 average earnings fell by 5.4% relative to the RPI figures used for uprating
over that period; forecasts from the Office for Budget Responsibility suggest that the fall will be
5.6% by 2015–16 as further real earnings reductions in 2013–14 are offset by a modest rebound
in 2015–16.5
We can model the consequences for work incentives of these changes in real earnings – along
with changes in other (e.g. demographic) characteristics of the working-age population.
We ignore the fact that if the government had not introduced any tax and benefit reforms,
earnings (and other characteristics) might have evolved in different ways – indeed, given that the
reforms change people’s incentives to work and increase their earnings, we might positively
expect that they would have. Conversely, the government might have adopted different tax and
benefit policies if employment and earnings had evolved differently since 2010. Modelling
responses to tax and benefit changes on the wider economy, including feedback effects such as
through fiscal multipliers, goes beyond the scope of this paper. When we consider the effect of
reforms in later sections, we consider only the first-order, ‘mechanical’, effects of policies
introduced by the government. In contrast, when we examine the impact of wider economic
changes here, we are examining the impact of changes that are not directly under the
government’s control.
Methodology
Our approach in this section is to compare the pattern of work incentives in 2010–11 with
what the pattern would be in 2015–16 excluding the impact of policy reforms. To estimate the
distribution of financial work incentives in 2010–11, we run data from the 2010–11 Family
Resources Survey (FRS) through a 2010–11 tax and benefit system in TAXBEN. Estimating work
incentives in 2015–16 required us to simulate a 2015–16 population and a 2015–16 tax and
benefit system. The tax and benefit system was obtained by taking the actual 2010–11 tax and
benefit system and applying default indexation rules (as they stood in 2010) to create a ‘no
reform’ 2015–16 system in 2015–16 prices.
Simulating a 2015–16 population is more complicated; our methodology is very similar to
that of Brewer et al. (2013), and more detail is available in that paper. We start with the 2010–11
3 See Brewer et al. (2013) for analysis of how household incomes are likely to change over this period.
4 This was not true of all rates and thresholds, however: means-tested benefit rates were increased in line with Rossi, a
slightly different inflation measure, and a few benefit rates and thresholds were frozen by default. As we discuss in Section 4, the government has since switched to using CPI inflation to uprate most benefit rates and tax thresholds. 5 See Table 4.1 of Office for Budget Responsibility (2013). The figures in the text compare nominal earnings growth in
each fiscal year to RPI inflation in the September of the previous fiscal year, since that is what was used for uprating most tax and benefit parameters.
© Institute for Fiscal Studies, 2013
8
FRS data and first uprate financial variables in the data (most importantly for our purposes, gross
earnings) in line with observed or forecast changes. Earnings are increased with actual nominal
earnings growth as reported by the ONS between 2010–11 and 2012–13, and then in line with
the Office for Budget Responsibility (OBR) forecasts of average earnings growth from 2012–13 to
2015–16 (Office for Budget Responsibility 2013). In each case, earnings growth is allowed to vary
by industry according to projections from Oxford Economics. The data are then reweighted
(using the algorithm set out in Gomulka (1992), implemented in Stata by the reweight2
command (Browne 2012)) to account for forecast changes to employment and other socio-
demographic variables: loosely speaking, this increases the relative weights given to types of
people and households forecast to become relatively more common. The demographic changes
we account for are listed in Table 3.1; of most importance to our analysis here is how we account
for changes in employment. To account for changes in employment rates, we use in total
employment using employment growth between 2010–11 and 2012–13 as reported by the OBR,
and again incorporate heterogeneity, allowing for differential employment changes by region and
industry in line with forecasts provided by Oxford Economics. Our analysis of work incentives
focuses only on those aged between 19 and the State Pension Age in 2010 (in other words,
women aged 19–59 and men aged 19–64).6 This gives us 30,991 observations.
Table 3.1. Characteristics controlled for in simulations by reweighting the data
Dimension Categories
Total population Constituent nation and English region
Households Household type, constituent nation and English region
Age and sex (jointly) Males and females split into the following age categories: 0–9, 10–15, 16–19 (dependent child), 16–19 (non-dependent), 20–24, 25–29, 30–44, 45–59, 60+
Employment Industry, constituent nation and English region
Ethnicity Asian or non-Asian (Great Britain only)
Note: The sources of the population and household control totals we use for future years are Office for National Statistics (2011, 2012), Northern Ireland Statistics and Research Agency (2010), Department for Communities and Local Government (2012), Welsh Assembly Government (2011), General Register Office for Scotland (2010). We control for changes in total employment using forecasts from the Office of Budget Responsibility (2013). Within that total, changes in employment are allowed to vary by constituent nation and English region, and by industry, according to forecasts provided by Oxford Economics.
Work incentive measures for those in paid work are calculated at their actual level of hours
and earnings. For those not in paid work, financial incentives to move into work depend on what
they would earn (and how many hours they would work) if they did so. For each non-working
individual, we calculate RRs and PTRs at four different hours points, using predicted earnings
based on an Ordinary Least Squares regression of log weekly earnings of individuals observed
employed in the relevant hours category on various characteristics including age, sex, region,
ethnicity, education, housing tenure, number and ages of children, partnership status, and any
partner’s employment status and earnings. Once we have calculated four PTRs and RRs for each
non-worker, these are weighted according to estimated probabilities of that individual choosing
to work that number of hours were they to enter paid work. Probabilities are calculated using a
multinomial logit model, again estimated using the behaviour of individuals in paid work in our
data with the same set of explanatory variables.7 As the FRS does not contain information on
6 The female State Pension Age is in the process of being increased from 60 to 65 between April 2010 and November
2018. 7 This methodology is the same as that used in Adam and Phillips (2012): a fuller description is given in Appendix A of
that paper.
© Institute for Fiscal Studies, 2013
9
spending patterns for each household, we give each household an average consumption tax rate
for their household type (single without children, lone parent, couple without children, couple
with children) and income decile calculated using TAXBEN run on the 2010 Living Costs and
Food Survey (LCFS).
Throughout our analysis, we assume full take-up of benefit and tax credit entitlements: while
that is clearly an unrealistic assumption, and is particularly unsatisfactory when we are
considering a reform such as universal credit, which is likely to increase means-tested benefit
take-up rates by simplifying the benefits system, it is difficult to model non-take-up in a
satisfactory manner and it is difficult to know how families’ take-up behaviour would change if
they changed their work patterns, potentially giving them different entitlements.
Results
When we compare our measures of financial work incentives for our 2015–16 synthetic
population under an unreformed 2010–11 tax and benefit system (one where all benefit rates
and tax thresholds are increased in line with default indexation) with those from the actual
2010–11 population, we find that the RR, the ratio of out-of-work income to in-work income,
increases, as we would expect when earnings increase less quickly than benefits. The mean RR
rises from 55.3% to 57.0%, and the median RR from 56.6% to 58.6%. To put this into context, as
shown by Adam and Browne (2010), this is a smaller increase in average RRs than occurred in
2003–04, when employee and employer NIC rates were each increased by one percentage point
(ppt) and the current tax credit system was introduced.
The effect of lower real earnings on PTRs is less clear-cut. It depends on whether the extra
earnings would have been subject to a higher or lower effective tax rate (including benefit
withdrawal) than their overall earnings – in other words (for small changes in earnings) whether
an individual’s EMTR is higher or lower than their PTR. This varies across the population; we find
that, in the absence of reforms, PTRs would have increased on average, but by less than RRs, with
the mean PTR rising from 51.3% to 52.4%, and the median from 49.9% to 51.0%.
Similarly, the impact of lower real earnings on EMTRs depends on whether an individual’s
EMTR would be lower or higher if their earnings were slightly lower. Again we find that, in the
absence of reforms, EMTRs of those in work would have increased on average, but these
increases are even smaller: the mean EMTR rises from 52.9% to 53.5%, and the median from
49.2% to 49.9%. Lower earnings mean that there are fewer workers paying income tax and NICs
and fewer paying higher-rate income tax, but also that there are more workers facing withdrawal
of means-tested benefits.
In the absence of discretionary reforms, then, changes in population characteristics from
2010 to 2015 – in particular real earnings growing less quickly than taxes and benefits were due
to be uprated – would have weakened average work incentives on all of our measures, though
not uniformly so.
In the remainder of this paper we look at how tax and benefit reforms are due to change the
outlook for work incentives in 2015 relative to this no-reform baseline.
4. Tax and benefit reforms from 2010 to 2015
The reforms we consider in this paper are those that have been implemented, or are due to be
implemented, from when the UK’s coalition government took office in May 2010 until the
scheduled end of its term of office in May 2015. That is not the same as examining reforms
announced by the coalition. The present government has chosen to go ahead with certain changes
announced by its Labour predecessor (such as increasing NIC rates, limiting local housing
© Institute for Fiscal Studies, 2013
10
allowance to actual rent paid, and allowing the generosity of winter fuel payments to fall when a
temporary increase expired) and cancel others (such as the introduction of a ‘toddler tax credit’).
It has also announced some reforms that are due to be implemented after May 2015 (such as the
changes to childcare support announced in the 2013 Budget); and as some of the reforms
introduced by the present government affect the way that benefit and tax credit rates are
increased year on year, they will have an increasing effect over time. Looking at the effect of
reforms that will have taken effect by the end of the government’s term of office compares the tax
and benefit it inherited from its predecessor with the one it will bequeath to its successor. The
full set of tax and benefit reforms that we model is listed in Appendix A.8
The main tax changes that affect work incentives are the following.
Changes in tax rates: The government has raised significant revenue by increasing employer,
employee and self-employed NIC rates by 1 ppt each, and by increasing the main rate of VAT
from 17.5% to 20%, partly offset by substantial real reductions in fuel duties. These rises in tax
rates straightforwardly increase EMTRs and PTRs. But the effect on RRs is different: NIC rises do
increase RRs for people without working partners but have ambiguous effects on RRs for people
with working partners (since both in-work and out-of-work income fall, by amounts that depend
on the two partners’ earnings), while changes to indirect tax rates do not affect RRs at all (since
in-work and out-of-work income are reduced by the same fraction).
Changes in tax thresholds: The government has announced big increases in the point at
which income tax starts to be paid (and much smaller increases in the points at which employer
and employee NICs start to be paid) while reducing the point at which higher-rate income-tax
(but a reduced rate of employee NICs) starts to be paid. These reforms reduce EMTRs for those
low earners taken out of income tax and increase EMTRs for those higher earners brought into
higher-rate tax. In terms of the incentive to be in work at all, the reforms increase PTRs for
higher-rate taxpayers and reduce them for everyone else; the same is true of RRs, except for
people with working partners, for whom the effects are again ambiguous.
Welfare reforms that affect financial work incentives can be divided into three main groups:
changes in the generosity of ‘safety-net’ benefits; cuts to in-work support; and means-testing
more aggressively.9
Changes in the generosity of safety-net benefits: The majority of the welfare reforms
involve changing the maximum amount of means-tested support that can be received by those
with no other income. This includes (amongst others) cuts to HB and council tax support.10 These
cuts straightforwardly strengthen work incentives, reducing out-of-work income, meaning there
is less to lose from moving into work, and reducing the number of people on means-tested
benefit tapers. In some cases the government has increased the generosity of safety-net benefits,
8 Note that there are some reforms that we do not model here, including most changes to business taxes (including
corporation tax and business rates, though not employer NICs), most changes to capital taxes (including capital gains tax, inheritance tax and stamp duty) and some changes to benefits, including changes to the way in which in-year changes in income affect tax credit awards. 9 A fourth group – changes to non-means-tested benefits – includes fewer reforms affecting the working-age
households that are the subject of this paper, and in any case typically has much less effect on work incentives. 10
Since council tax support has been localised, its generosity (in England) is now a decision for individual local authorities. In this report we assume that all local authorities in England adopt a scheme which mirrors the old council tax benefit, but reduces the maximum amount of support that can be claimed to 89.6% of the household‖s council tax liability, the average reduction local authorities in England have made in 2013–14, in response to the cut in funding from central government.
© Institute for Fiscal Studies, 2013
11
notably increasing the child element of child tax credit, which has the opposite effect, weakening
work incentives for those affected.
Cuts to in-work support: WTC provides support to low-income working families. The
coalition has introduced real-terms cuts to the maximum value of WTC and increased the weekly
hours that couples with children must work to qualify from 16 to 24.These cuts to WTC weaken
the incentive for families to have someone in low-paid work. However, with less generous in-
work support, those already receiving WTC before the reforms have less to lose from increasing
their family earnings. One way in which a couple can increase their earnings is, of course, for both
partners to work instead of one. Thus, for couples, cuts to WTC weaken the incentive for the first
partner to be in work, but strengthen the incentive for both members of a couple to work rather
than just one. Being a one-earner couple is being made less attractive, both relative to being a no-
earner couple and relative to being a two-earner couple.11
Means-testing more aggressively: As well as changing the maximum amount of means-
tested benefits and tax credits that can be received, the government’s welfare reforms also
involve means-testing tax credits more aggressively and means-testing child benefit for the first
time. These cuts affect only those in work, so they weaken the incentive for families to have
someone in work. In the case of tax credits, the effect for couples will often be similar to that of
cutting WTC: while the incentive to have a first earner in work is weakened, the reduced support
for one-earner couples can mean that there is less to be lost by – and thus a stronger incentive for
– the second member of the couple entering work.12 Turning to incentives for those in work to
increase their earnings, the means-testing of child benefit clearly reduces the incentive for those
in work (just the higher earner in the case of couples) to increase their earnings through the
£50,000 to £60,000 range over which the benefit will be withdrawn. The effect of reforms to the
means-testing of tax credits on the incentive for those in work to increase their earnings is more
complicated, with higher and lower EMTRs applying to people in different income ranges.
By far the biggest cut to welfare introduced by the coalition government is the switch to
uprating most working-age benefit rates annually in line with the CPI measure of inflation, rather
than the RPI and Rossi measures used previously (reform 4).13 Since CPI inflation is usually lower
than the measures it was replacing, this change leads to steadily falling benefit rates relative to
what they would otherwise have been. Five years of this lower indexation starting from April
2011 was expected at the time to be saving the Exchequer £10.6 billion a year by 2015–16, a
figure that will keep rising thereafter.14 Furthermore, most benefit and tax credit rates are being
increased by only 1% in nominal terms in April 2013, 2014 and 2015 (less than projected CPI
11
This is not true, however, of the reduction in the childcare element of WTC. To qualify for childcare support, both members of the couple must be in paid work, so reducing it has no effect on the incentive for the first partner to be in work (since the presence of a non-working partner disqualifies them from the childcare support anyway) but weakens the incentive for a second earner to be in work (since working entitles them to less childcare support than before the reforms). 12
However, that is not always the case: if the couple‖s combined income would still leave them entitled to tax credits in the absence of the reforms (perfectly possible given that entitlement extended up to family income of more than £58,000), it is possible that the reforms can reduce the couple‖s entitlement by more if both partners work than if only one does, in which case the incentive to have a second partner in work is also weaker. In the case of Child Benefit, all that is relevant is the income of the higher-income parent: the reform weakens the incentive for the higher-income parent to stay in (or move into) work if their income would be more than £50,000 (unless both partners have income above £60,000).
13 Rossi had been used to uprate IS, ESA and JSA (and consequently the threshold for withdrawing HB and council tax benefit, which were set at that same level), while the RPI was used to uprate most other benefits and tax credits. 14 Note that this revenue effect also includes the effect of a shift to CPI-uprating of public service pensions, which we do not discuss further in this paper. The actual saving will depend on the size of the difference between RPI and CPI inflation, which has been revised downwards since Budget 2011, meaning that the actual saving will likely be much
lower than this.
© Institute for Fiscal Studies, 2013
12
inflation), saving a further £2.3 billion a year by 2015–16 (reforms 30, 31 and 32). Since changes
to uprating policy affect rates of both in-work and out-of-work benefits, its effects combine the
features of both.
The government has made a number of changes to the benefits system that affect non-
financial work incentives – that is, they do not directly affect the relationship between hours of
work and net income but might nevertheless have an effect on people’s work behaviour.
The introduction of the Work Programme, in which welfare-to-work services are
delivered by a mix of private, voluntary and public-sector organisations, with payments
to providers based on the results achieved in terms of returning welfare claimants to
employment, with amounts varying according to the duration of the employment and the
perceived barriers to work faced by different groups. The intention is that the Work
Programme should give providers greater flexibility to innovate and stronger incentives
to get claimants into work, though initial results have been disappointing.15
Lone parents with children aged 5 or over now have to claim JSA rather than IS. This
does not affect their monetary entitlements in most cases, but does place additional
work search requirements on these claimants.
Tougher medical tests for disability benefits are reducing benefit entitlements and/or
increasing work search requirements for some of those who would previously have
qualified for disability benefits.
Overall, one would expect these changes to have a positive impact on the likelihood of people
entering work, though the magnitude of this effect is unclear.
Universal credit
The introduction of universal credit is perhaps the most radical restructuring of the working-
age benefits system since the 1940s. Universal credit is a new benefit, which will replace six of
the seven main existing means-tested benefits and tax credits for those of working age: IS,
income-based JSA, income-related ESA, HB, child tax credit (CTC) and WTC. The seventh main
means-tested benefit for those of working age, council tax benefit, is not being brought within
universal credit, though it has also been reformed. And benefits for those above the qualifying
age for Pension Credit (the female State Pension Age) will remain separate from universal credit
– although couples where one partner is above and one below the Pension Credit age, who can
currently claim Pension Credit, will in future have to claim the (usually less generous) universal
credit instead.16
The first claims to universal credit were made in April 2013 in Ashton-under-Lyne. It is
gradually being extended to other areas, and although the roll-out to more areas and more
claimant groups is running behind the government’s original schedule, the current plan remains
for universal credit fully to replace the existing set of means-tested benefits and tax credits by the
end of 2017. There will be transitional protection for existing claimants of means-tested benefits
and tax credits who would otherwise receive less in universal credit than they currently receive
in benefits and tax credits when they are moved across. The combination of a long phase-in
period and transitional protection for existing claimants means that it will be a long time before
universal credit rates apply to everyone. Because of this we model the two extreme scenarios:
one that ignores universal credit completely, and one that treats it as being fully implemented
15 See Comptroller and Auditor General (2012) and Public Accounts Committee (2013). 16
Although universal credit will not apply to pensioners, once HB for those of working age has been subsumed into universal credit the government also intends to replace HB for pensioners with a housing costs component in Pension Credit, thus achieving a degree of integration for pensioners too.

© Institute for Fiscal Studies, 2013
13
immediately with no transitional protection. The actual position in 2015–16 will be somewhere
in between these two extremes.
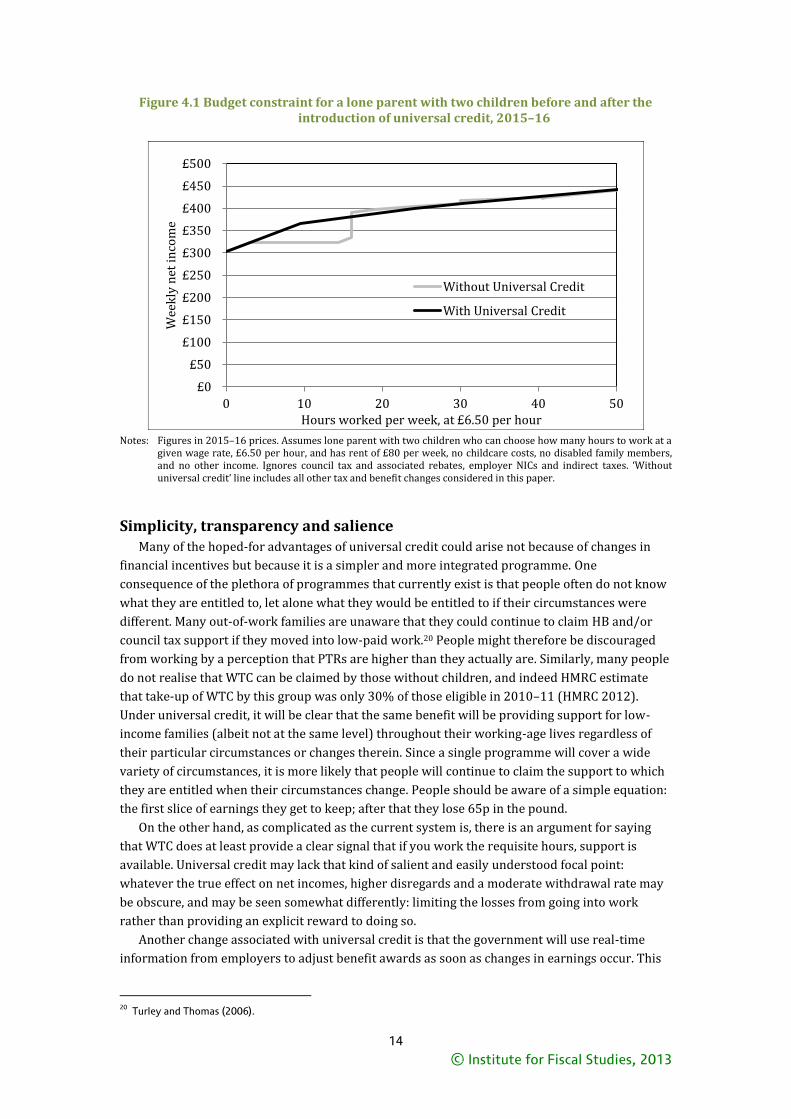
The impact of universal credit on benefit entitlements and work incentives The budget constraint in Figure 4.1 shows the impact of universal credit on the financial work
incentives faced by the example lone parent we encountered in Section 2 in 2015–16. This
illustrates some of the key features of universal credit; in particular:17
Entitlements for those with no other income or assets are the same as under the current
benefit system. This is because each of the components of universal credit is set equal to
the equivalent benefit under the current system.18
There is an earnings disregard, which varies by family type and by whether a family is
claiming the housing component. The disregard is much larger in universal credit than in
the existing out-of-work benefits.
Earnings (net of income tax and National Insurance contributions) above the disregard
are subject to a taper rate of 65%. The 100% taper rates on earnings associated with IS,
JSA and ESA will no longer exist, and by combining several overlapping means tests into
a single one, universal credit reduces the maximum EMTR an individual can face below
that created by tax credits and HB together. However, special rules are used to impute
income from savings, which place a very high effective tax rate on savings in certain
ranges, and other unearned income reduces entitlement pound-for-pound.
There are no longer any jumps in the budget constraint when an individual works a
certain number of hours each week and qualifies for WTC (16 in this case, but 24 or 30 in
others).19
Figure 4.1 ignores council tax and associated rebates. Although universal credit by itself leads
to a reduction in the highest overall EMTRs, the fact that council tax support will remain separate
from universal credit still leads to the possibility that two strands of support will be withdrawn
simultaneously, creating EMTRs that are nearly as high as under the current system. How the
new council tax support schemes designed by local authorities interact with universal credit will
have significant implications for work incentives. In this paper we assume that local authorities
follow the central government’s default scheme in counting universal credit as income for the
purposes of the means test (with allowances set equal to a family’s maximum entitlement to
universal credit to ensure that income from universal credit alone is not enough to reduce rebate
entitlement) and the current 20% withdrawal rate is maintained. This would involve a maximum
EMTR of 80.96%, which is higher than the maximum 76.2% EMTR if council tax rebate were not
being withdrawn in parallel to universal credit, but still lower than the highest EMTRs that can
arise under the current system.
17
This section gives brief details on universal credit, focusing on its impacts on financial work incentives. A fuller description and analysis of its impacts are available in Browne and Roantree (2013). 18
That is, a family‖s ―personal amount‖ will be set equal to their maximum entitlement to JSA or IS, additional amounts for children will be set equal to the child element of CTC and the housing component will be similar to HB in that it will cover the full amount of rent for those in the social rented sector (unless they are deemed to be under-occupying their property) and private sector rents up to a ―local reference rent‖ level. 19
Note that as we assume hours worked remain constant when calculating EMTRs, we are perhaps overestimating how much universal credit strengthens individuals‖ incentives to increase their earnings, since in reality some individuals will increase their earnings by increasing their hours worked, which may qualify them for WTC under the current system. Such effects are not captured by our measure of EMTRs, and are no longer relevant under universal credit, which does not have hours rules.
© Institute for Fiscal Studies, 2013
14
Figure 4.1 Budget constraint for a lone parent with two children before and after the introduction of universal credit, 2015–16
Notes: Figures in 2015–16 prices. Assumes lone parent with two children who can choose how many hours to work at a
given wage rate, £6.50 per hour, and has rent of £80 per week, no childcare costs, no disabled family members, and no other income. Ignores council tax and associated rebates, employer NICs and indirect taxes. ‘Without universal credit’ line includes all other tax and benefit changes considered in this paper.
Simplicity, transparency and salience Many of the hoped-for advantages of universal credit could arise not because of changes in
financial incentives but because it is a simpler and more integrated programme. One
consequence of the plethora of programmes that currently exist is that people often do not know
what they are entitled to, let alone what they would be entitled to if their circumstances were
different. Many out-of-work families are unaware that they could continue to claim HB and/or
council tax support if they moved into low-paid work.20 People might therefore be discouraged
from working by a perception that PTRs are higher than they actually are. Similarly, many people
do not realise that WTC can be claimed by those without children, and indeed HMRC estimate
that take-up of WTC by this group was only 30% of those eligible in 2010–11 (HMRC 2012).
Under universal credit, it will be clear that the same benefit will be providing support for low-
income families (albeit not at the same level) throughout their working-age lives regardless of
their particular circumstances or changes therein. Since a single programme will cover a wide
variety of circumstances, it is more likely that people will continue to claim the support to which
they are entitled when their circumstances change. People should be aware of a simple equation:
the first slice of earnings they get to keep; after that they lose 65p in the pound.
On the other hand, as complicated as the current system is, there is an argument for saying
that WTC does at least provide a clear signal that if you work the requisite hours, support is
available. Universal credit may lack that kind of salient and easily understood focal point:
whatever the true effect on net incomes, higher disregards and a moderate withdrawal rate may
be obscure, and may be seen somewhat differently: limiting the losses from going into work
rather than providing an explicit reward to doing so.
Another change associated with universal credit is that the government will use real-time
information from employers to adjust benefit awards as soon as changes in earnings occur. This
20 Turley and Thomas (2006).
£0
£50
£100
£150
£200
£250
£300
£350
£400
£450
£500
0 10 20 30 40 50
Wee
kly
net
in
com
e
Hours worked per week, at £6.50 per hour
Without Universal Credit
With Universal Credit
© Institute for Fiscal Studies, 2013
15
contrasts with the previous system, in which in-year income increases of less than £5,000 a year
do not reduce a family’s tax credit award and there are various benefit run-ons which mean that
families’ benefit payments do not immediately change when someone enters work. As explained
in Section 2, in this report we measure work incentives on a long-run basis. But in practice how
soon people see their benefits withdrawn might be a particularly prominent consideration when
they consider moving into work or increasing their earnings.
If people overestimate the return to work (rather than underestimate it), a simpler, more
transparent system might actually weaken perceived work incentives. Changes in perception
may, therefore, not be unambiguously positive.
Changes in conditionality As well as significantly changing benefit withdrawal rates and income disregards, universal
credit in principle involves a significant change in the job-search conditions for those in receipt of
means-tested benefits. Presently, only those claiming JSA (who cannot work for more than
16 hours a week) are subject to conditionality. Under universal credit, an hours threshold below
which there are work-search requirements is to be replaced by an earnings threshold that is
significantly tougher. The universal credit regulations give the government the power to demand
that people look for higher-paid employment (whether through more hours or a higher wage) if
their earnings are below a particular threshold. Importantly, for couples the work-search
requirements may (with some exceptions) apply to any partner not working full time if the
couple’s combined earnings are below the relevant (rather high) threshold.21 However, it is not
clear as yet to what extent these new powers will actually be used; the government has said that,
initially, full conditionality will apply to ‘groups roughly equivalent to those subject to the current
JSA conditionality regime’ (Department for Work and Pensions 2012). But at the time of writing
it remains somewhat unclear exactly which claimants will face exactly what level of
conditionality initially and how this will change over time.
Although one may expect increased job-search requirements to increase the likelihood of
moving in to work and increasing one’s earnings, existing evidence tells us little about the impact
of such requirements on those already in work.
5. The distributional impact of tax and benefit reforms
The principal focus of this paper is micro-simulation estimates of how work incentives are
affected by macroeconomic and tax and benefit changes. But before turning to that, it is useful
background to look at the distribution of gains and losses from the different reforms. This
analysis is done on the synthetic 2015–16 population described in Section 2, for whom we
compare incomes (and, in the next section, work incentives) in the ‘no-reform’ tax and benefit
system considered in Section 2 with alternative 2015 tax and benefit systems which in turn
include the tax reforms only, all tax and benefit reforms excluding universal credit, and finally all
tax and benefit reforms including universal credit. 22
Official estimates suggest that the tax measures we consider in this paper raise £11.1 billion a
year, welfare reforms reduce total benefit and tax credit expenditure by around £22.3 billion a
year, and that universal credit will increase benefit expenditure by around £0.9 billion a year in
21
The self-employed will automatically be assumed to be meeting these conditions (and will be paid a commensurate amount of universal credit, i.e. their earned income for the purposes of the universal credit means test will be taken to be this level if it is below). 22
As the reforms interact with each other, the impact of a particular reform depends on whether it is implemented with or without other reforms. It is possible that changing the order in which we examine the reforms would affect our results slightly.
© Institute for Fiscal Studies, 2013
16
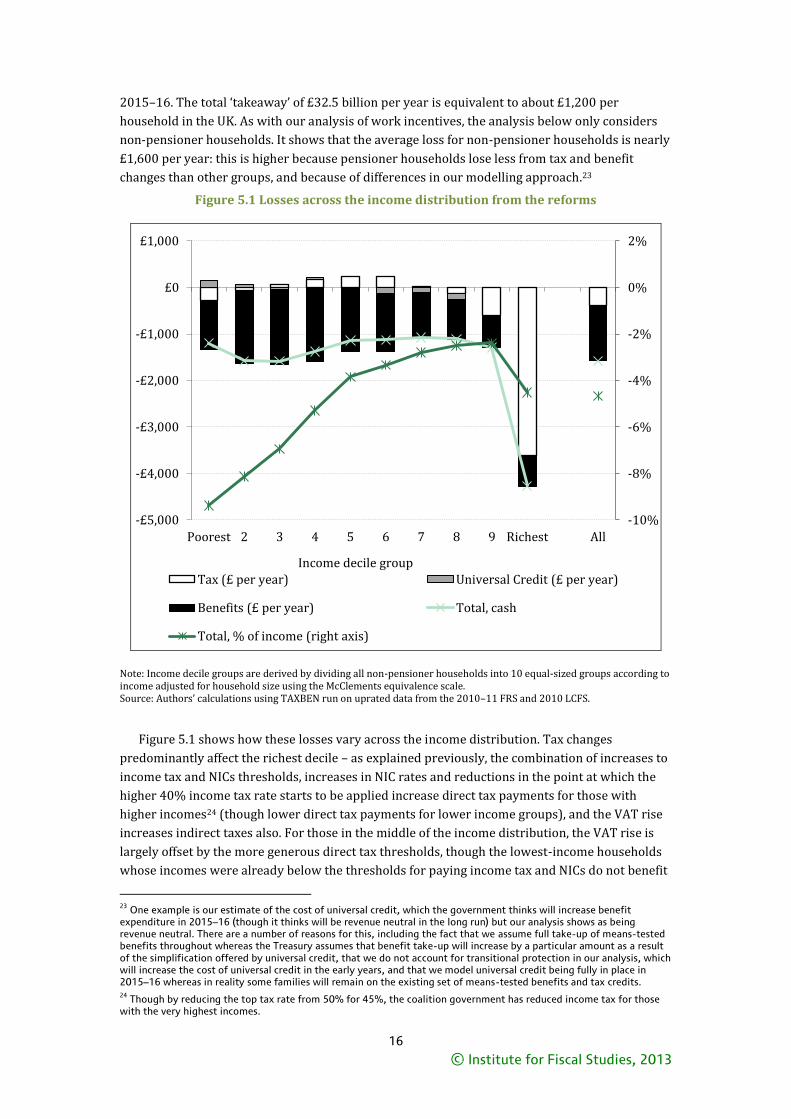
2015–16. The total ‘takeaway’ of £32.5 billion per year is equivalent to about £1,200 per
household in the UK. As with our analysis of work incentives, the analysis below only considers
non-pensioner households. It shows that the average loss for non-pensioner households is nearly
£1,600 per year: this is higher because pensioner households lose less from tax and benefit
changes than other groups, and because of differences in our modelling approach.23
Figure 5.1 Losses across the income distribution from the reforms
Note: Income decile groups are derived by dividing all non-pensioner households into 10 equal-sized groups according to income adjusted for household size using the McClements equivalence scale. Source: Authors’ calculations using TAXBEN run on uprated data from the 2010–11 FRS and 2010 LCFS.
Figure 5.1 shows how these losses vary across the income distribution. Tax changes
predominantly affect the richest decile – as explained previously, the combination of increases to
income tax and NICs thresholds, increases in NIC rates and reductions in the point at which the
higher 40% income tax rate starts to be applied increase direct tax payments for those with
higher incomes24 (though lower direct tax payments for lower income groups), and the VAT rise
increases indirect taxes also. For those in the middle of the income distribution, the VAT rise is
largely offset by the more generous direct tax thresholds, though the lowest-income households
whose incomes were already below the thresholds for paying income tax and NICs do not benefit
23
One example is our estimate of the cost of universal credit, which the government thinks will increase benefit expenditure in 2015–16 (though it thinks will be revenue neutral in the long run) but our analysis shows as being revenue neutral. There are a number of reasons for this, including the fact that we assume full take-up of means-tested benefits throughout whereas the Treasury assumes that benefit take-up will increase by a particular amount as a result of the simplification offered by universal credit, that we do not account for transitional protection in our analysis, which will increase the cost of universal credit in the early years, and that we model universal credit being fully in place in 2015–16 whereas in reality some families will remain on the existing set of means-tested benefits and tax credits. 24
Though by reducing the top tax rate from 50% for 45%, the coalition government has reduced income tax for those with the very highest incomes.
-10%
-8%
-6%
-4%
-2%
0%
2%
-£5,000
-£4,000
-£3,000
-£2,000
-£1,000
£0
£1,000
Poorest 2 3 4 5 6 7 8 9 Richest All
Income decile group
Tax (£ per year) Universal Credit (£ per year)
Benefits (£ per year) Total, cash
Total, % of income (right axis)
© Institute for Fiscal Studies, 2013
17
from the higher thresholds, but do lose out from higher VAT. The coalition’s welfare reforms
(excluding universal credit) take money predominantly from the bottom half of the income
distribution. Since the bulk of the reforms represent cuts to means-tested benefits, it is hardly
surprising that those higher up the income distribution (who are entitled to less benefits, if any)
lose less than the bottom half, although better-off households do lose out from some cuts to
‘middle-class welfare’ such as the freeze in Child Benefit, the withdrawal of Child Benefit from
incomes of £50,000 upwards and the withdrawal of the family element of Child Tax Credit at
lower income than before. Universal credit does not significantly affect average benefit
entitlements at any point in the income distribution, though as we shall see later, the impact
varies significantly by household type. Overall, the impact of reforms is regressive across the
bottom 90% of the income distribution, with the richest decile still losing less as a percentage of
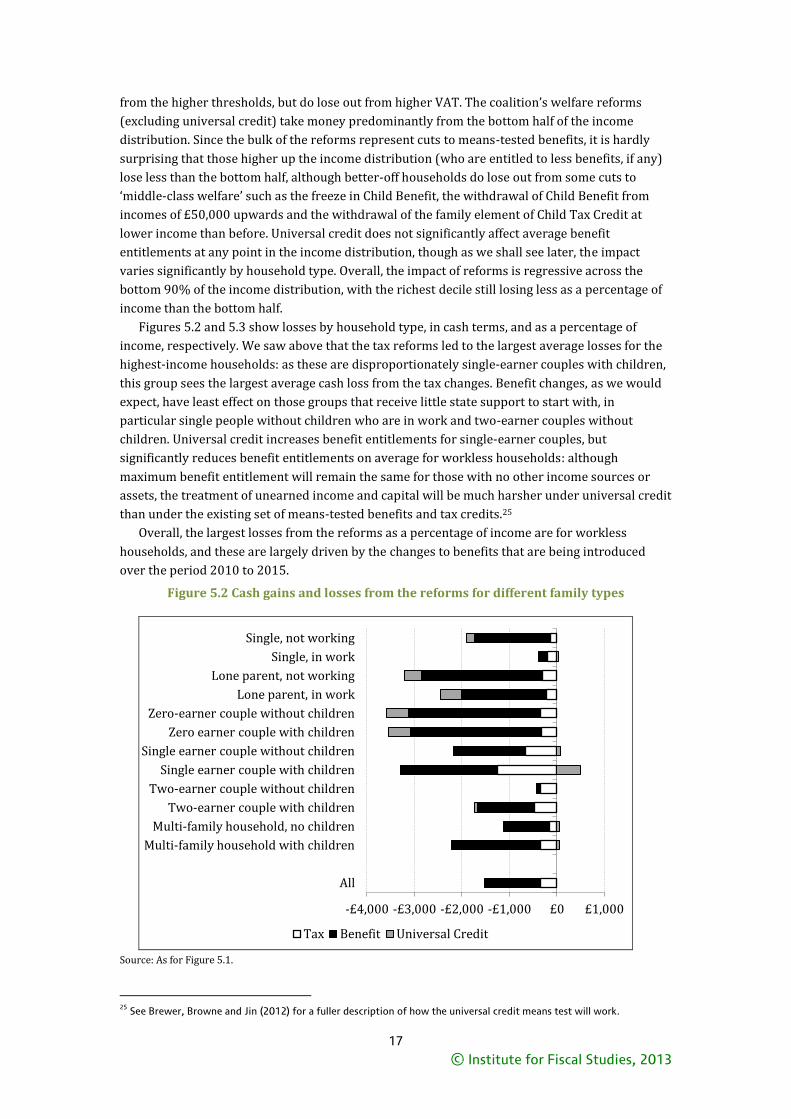
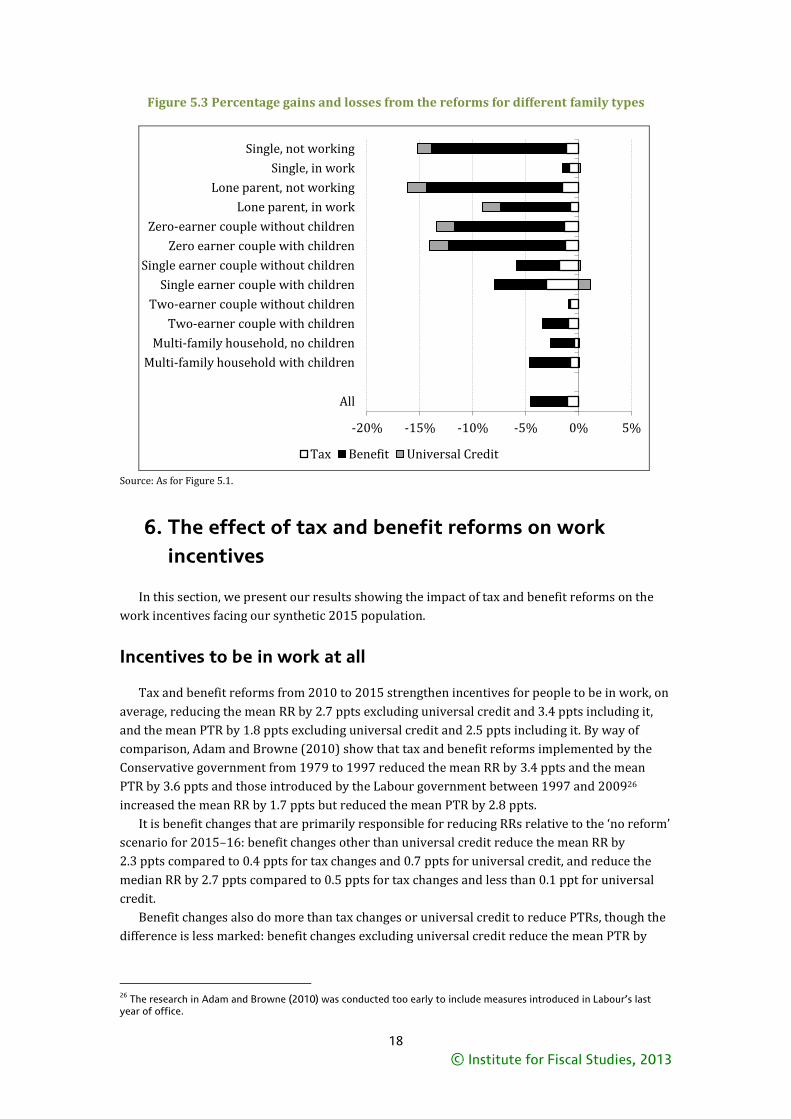
income than the bottom half. Figures 5.2 and 5.3 show losses by household type, in cash terms, and as a percentage of
income, respectively. We saw above that the tax reforms led to the largest average losses for the
highest-income households: as these are disproportionately single-earner couples with children,
this group sees the largest average cash loss from the tax changes. Benefit changes, as we would
expect, have least effect on those groups that receive little state support to start with, in
particular single people without children who are in work and two-earner couples without
children. Universal credit increases benefit entitlements for single-earner couples, but
significantly reduces benefit entitlements on average for workless households: although
maximum benefit entitlement will remain the same for those with no other income sources or
assets, the treatment of unearned income and capital will be much harsher under universal credit
than under the existing set of means-tested benefits and tax credits.25
Overall, the largest losses from the reforms as a percentage of income are for workless
households, and these are largely driven by the changes to benefits that are being introduced
over the period 2010 to 2015.
Figure 5.2 Cash gains and losses from the reforms for different family types
Source: As for Figure 5.1.
25
See Brewer, Browne and Jin (2012) for a fuller description of how the universal credit means test will work.
-£4,000 -£3,000 -£2,000 -£1,000 £0 £1,000
Single, not working
Single, in work
Lone parent, not working
Lone parent, in work
Zero-earner couple without children
Zero earner couple with children
Single earner couple without children
Single earner couple with children
Two-earner couple without children
Two-earner couple with children
Multi-family household, no children
Multi-family household with children
All
Tax Benefit Universal Credit
© Institute for Fiscal Studies, 2013
18
Figure 5.3 Percentage gains and losses from the reforms for different family types
Source: As for Figure 5.1.
6. The effect of tax and benefit reforms on work
incentives
In this section, we present our results showing the impact of tax and benefit reforms on the
work incentives facing our synthetic 2015 population.
Incentives to be in work at all
Tax and benefit reforms from 2010 to 2015 strengthen incentives for people to be in work, on
average, reducing the mean RR by 2.7 ppts excluding universal credit and 3.4 ppts including it,
and the mean PTR by 1.8 ppts excluding universal credit and 2.5 ppts including it. By way of
comparison, Adam and Browne (2010) show that tax and benefit reforms implemented by the
Conservative government from 1979 to 1997 reduced the mean RR by 3.4 ppts and the mean
PTR by 3.6 ppts and those introduced by the Labour government between 1997 and 200926
increased the mean RR by 1.7 ppts but reduced the mean PTR by 2.8 ppts.
It is benefit changes that are primarily responsible for reducing RRs relative to the ‘no reform’
scenario for 2015–16: benefit changes other than universal credit reduce the mean RR by
2.3 ppts compared to 0.4 ppts for tax changes and 0.7 ppts for universal credit, and reduce the
median RR by 2.7 ppts compared to 0.5 ppts for tax changes and less than 0.1 ppt for universal
credit.
Benefit changes also do more than tax changes or universal credit to reduce PTRs, though the
difference is less marked: benefit changes excluding universal credit reduce the mean PTR by
26
The research in Adam and Browne (2010) was conducted too early to include measures introduced in Labour‖s last year of office.
-20% -15% -10% -5% 0% 5%
Single, not working
Single, in work
Lone parent, not working
Lone parent, in work
Zero-earner couple without children
Zero earner couple with children
Single earner couple without children
Single earner couple with children
Two-earner couple without children
Two-earner couple with children
Multi-family household, no children
Multi-family household with children
All
Tax Benefit Universal Credit
© Institute for Fiscal Studies, 2013
19
1.2ppts, compared to 0.6ppts for tax changes and 0.9ppts for universal credit, and they reduce
the median PTR by 0.7ppts compared to 0.5ppts for tax changes and 0.4 ppts for universal credit.
These modest changes in average incentives conceal far greater variation across the
population, however. Table 6.1 shows that, for example, 30% of working-age adults (11 million
people) see their PTR change by more than 5 ppts, 17% by more than 10 ppts and 7% by more
than 20 ppts as a result of the benefit reforms (including universal credit). Many more people see
big falls in their RRs and PTRs than see big rises.
Table 6.1 Number of people seeing changes in RRs and PTRs of different magnitudes as a result of benefit reforms
Number of individuals (millions) whose rate:
Benefit reforms excluding UC
Benefit reforms including UC
RRs PTRs RRs PTRs
Falls more than 20 ppts 0.5 0.6 1.2 1.6
Falls 10–20 ppts 1.6 1.1 3.0 2.5
Falls 5–10 ppts 2.7 2.4 3.9 3.4
Stay within ±5 ppts 31.4 30.9 27.0 25.5
Rises 5–10 ppts 0.2 0.9 1.0 1.3
Rises 10–20 ppts 0.2 0.4 0.4 1.2
Rises more than 20 ppts <0.05 0.3 0.2 1.1
Total 36.6 36.6 36.6 36.6
Note: Figures may not sum to totals because of rounding. Source: As for Figure 5.1.
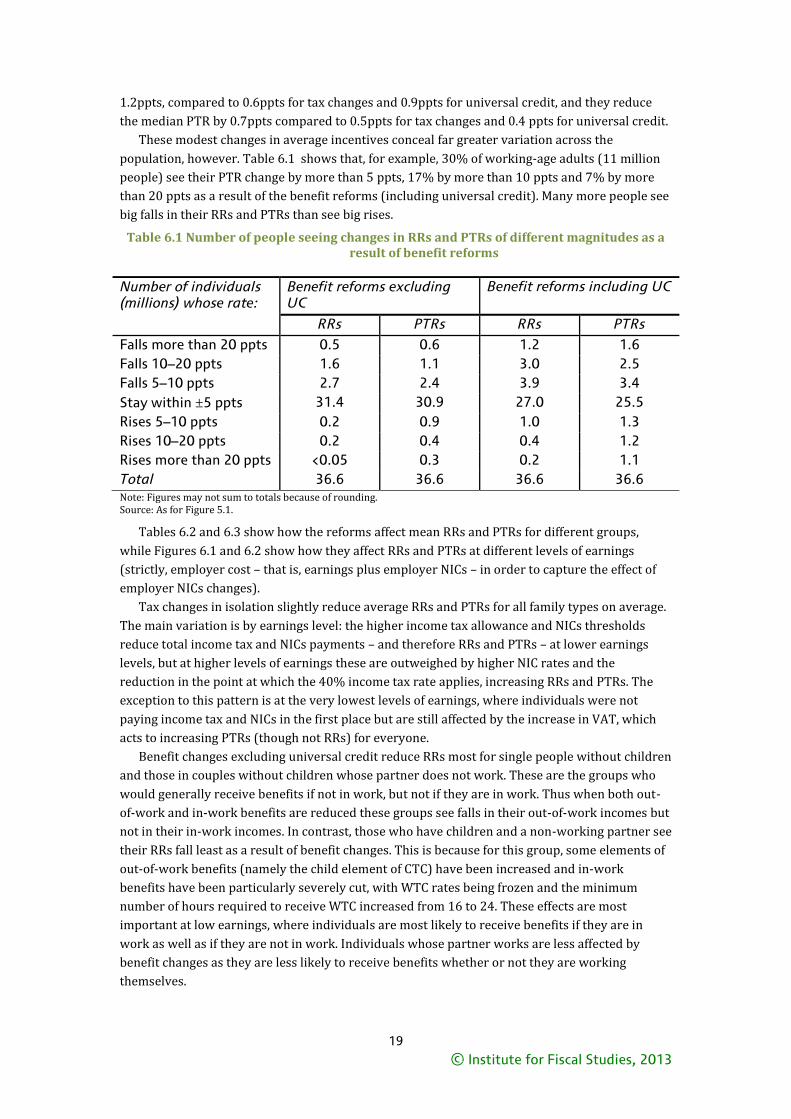
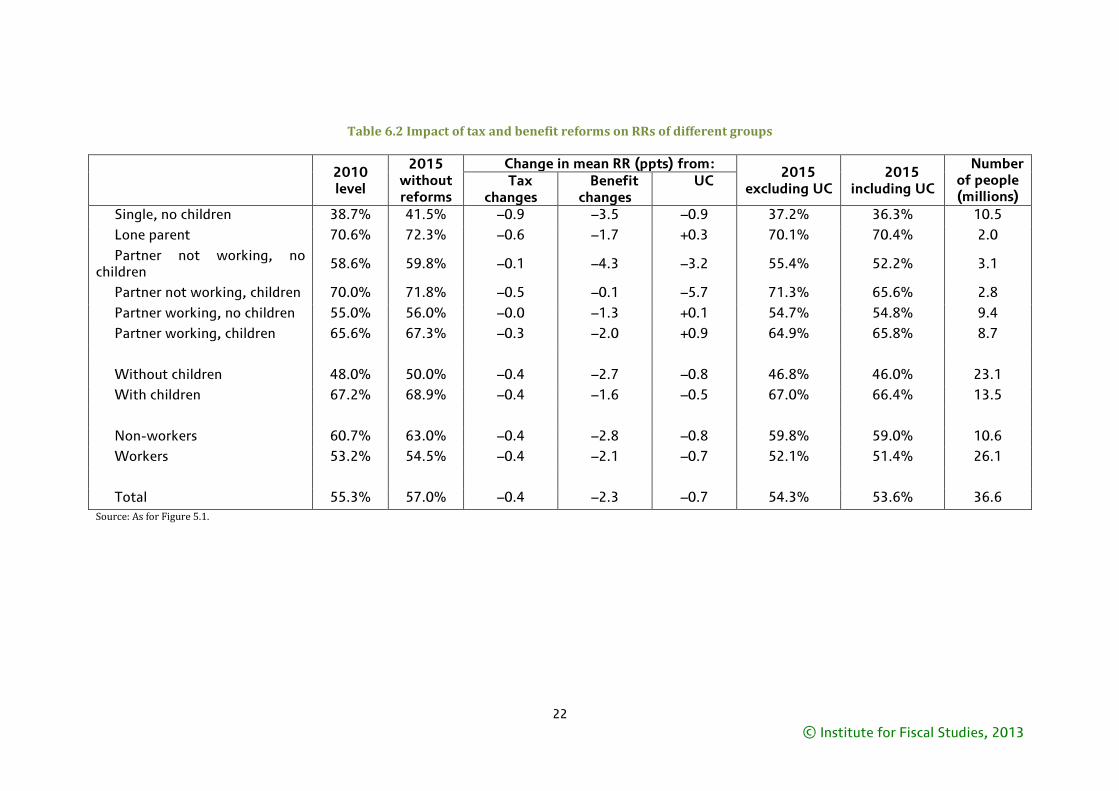
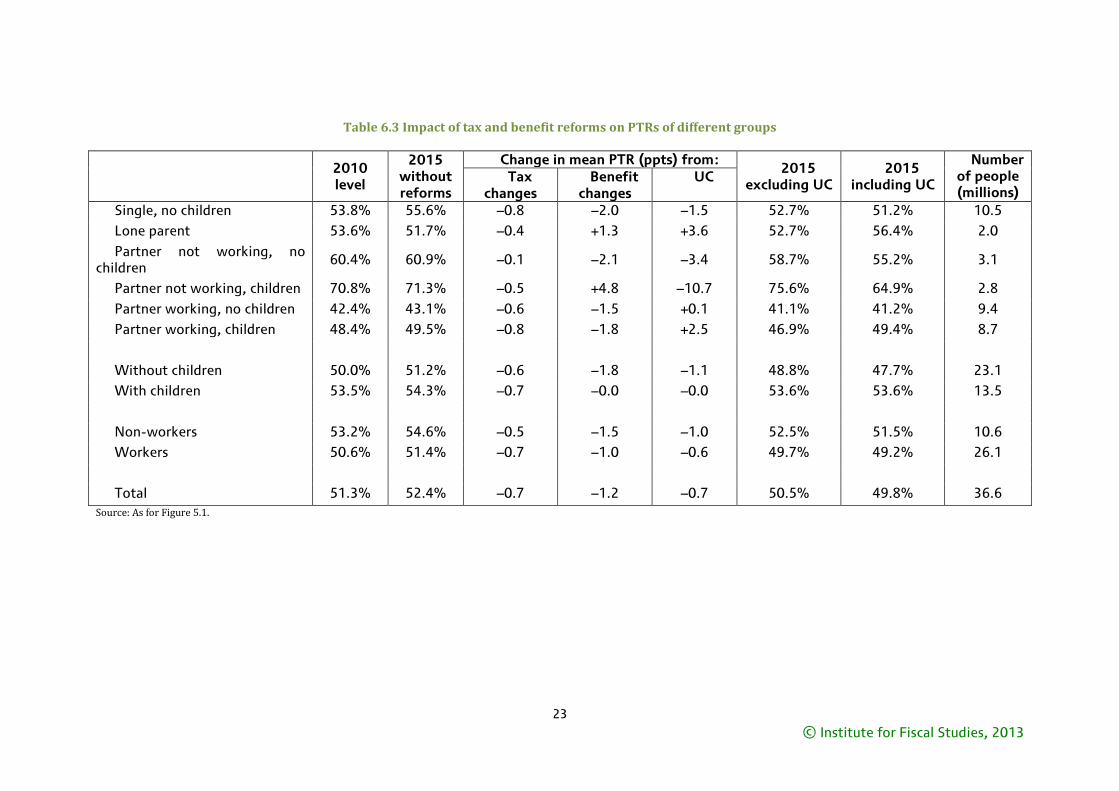
Tables 6.2 and 6.3 show how the reforms affect mean RRs and PTRs for different groups,
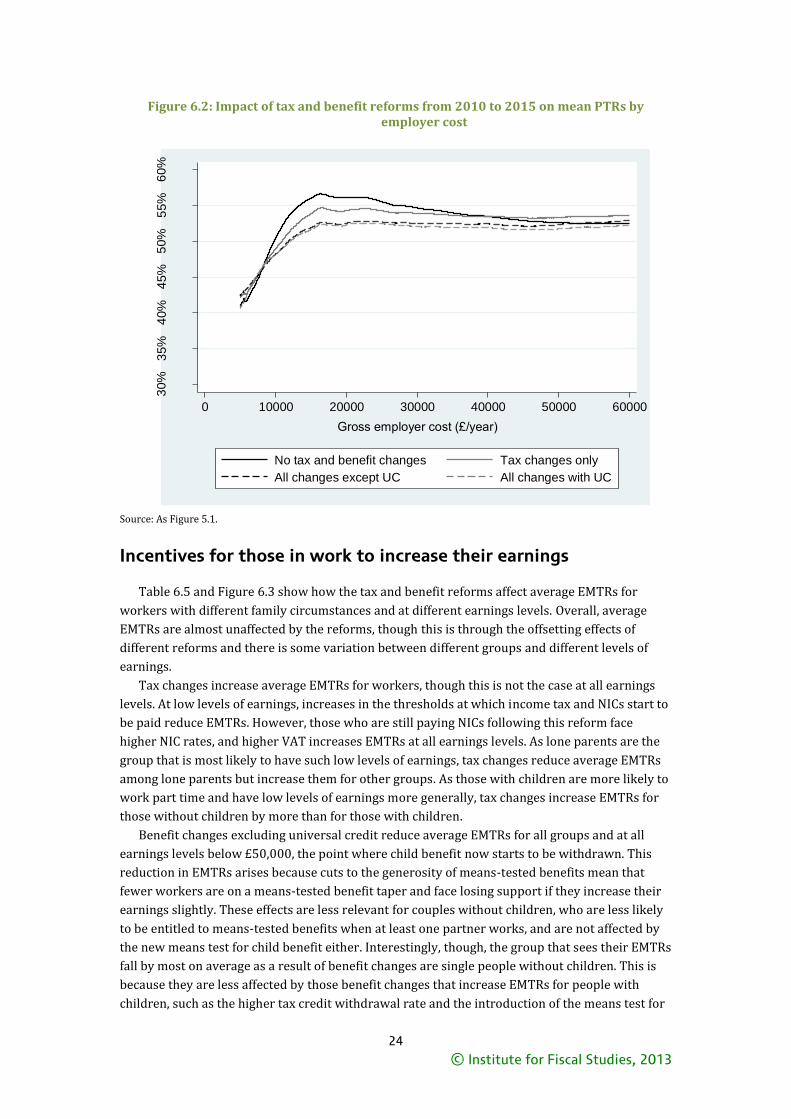
while Figures 6.1 and 6.2 show how they affect RRs and PTRs at different levels of earnings
(strictly, employer cost – that is, earnings plus employer NICs – in order to capture the effect of
employer NICs changes).
Tax changes in isolation slightly reduce average RRs and PTRs for all family types on average.
The main variation is by earnings level: the higher income tax allowance and NICs thresholds
reduce total income tax and NICs payments – and therefore RRs and PTRs – at lower earnings
levels, but at higher levels of earnings these are outweighed by higher NIC rates and the
reduction in the point at which the 40% income tax rate applies, increasing RRs and PTRs. The
exception to this pattern is at the very lowest levels of earnings, where individuals were not
paying income tax and NICs in the first place but are still affected by the increase in VAT, which
acts to increasing PTRs (though not RRs) for everyone.
Benefit changes excluding universal credit reduce RRs most for single people without children
and those in couples without children whose partner does not work. These are the groups who
would generally receive benefits if not in work, but not if they are in work. Thus when both out-
of-work and in-work benefits are reduced these groups see falls in their out-of-work incomes but
not in their in-work incomes. In contrast, those who have children and a non-working partner see
their RRs fall least as a result of benefit changes. This is because for this group, some elements of
out-of-work benefits (namely the child element of CTC) have been increased and in-work
benefits have been particularly severely cut, with WTC rates being frozen and the minimum
number of hours required to receive WTC increased from 16 to 24. These effects are most
important at low earnings, where individuals are most likely to receive benefits if they are in
work as well as if they are not in work. Individuals whose partner works are less affected by
benefit changes as they are less likely to receive benefits whether or not they are working
themselves.

© Institute for Fiscal Studies, 2013
20
Benefit changes also particularly reduce PTRs for single people and those in couples without
children whose partner does not work. However, benefit changes increase PTRs for those in
couples with children whose partner does not work and lone parents as a result of cuts to in-
work support for these groups.
Universal credit reduces the mean RR and the mean PTR. But it does not reduce the median
RR or PTR: the reductions in the means arise because universal credit strengthens work
incentives for those who face the weakest incentives to start with. The rationalisation of work
incentives under universal credit means that the extremely high RRs and PTRs that exist under
the current tax and benefit system disappear. universal credit reduces the number of individuals
with RRs of 75% or more by 400,000 and reduces the number with PTRs of 75% or more by half
(1.5 million) relative to the situation where it is not introduced (see Figures B.1 and B.2 in
Appendix B). Since (perhaps understandably) most of the individuals who face such weak
incentives to do paid work do not do so, universal credit reduces the mean RRs and PTRs of non-
workers by more than those of workers.
Universal credit also has significant differences in its impact between different types of
individual. It strengthens the incentive for couples to have one person in work rather than none,
but also weakens the incentive for both members of a couple to work rather than just one –
reflecting the findings of the distributional analysis in Section 4 that the main gainers from the
introduction of universal credit are single-earner couples with children, increasing the
attractiveness of being a single-earner couple relative to being a zero-earner or a two-earner
couple. The reduction of more than 10ppts in the mean PTR of parents with non-working
partners is particularly striking.
Universal credit only slightly reduces average RRs at PTRs at all earnings levels: since there
are individuals with and without working partners at all income levels, the incentive-weakening
effects for second earners are balanced out by the incentive-strengthening effects for first
earners. Its biggest net effect is at very low levels of earnings, where the higher earnings
disregards are particularly effective at reducing average PTRs.
© Institute for Fiscal Studies, 2013
21
Figure 6.1: Impact of tax and benefit reforms from 2010 to 2015 on mean RRs by employer cost
Source: As Figure 5.1.
30%
40%
50%
60%
70%
80%
0 10000 20000 30000 40000 50000 60000
Gross employer cost (£/year)
No tax and benefit changes Tax changes only
All changes except UC All changes with UC
© Institute for Fiscal Studies, 2013
22
Table 6.2 Impact of tax and benefit reforms on RRs of different groups
2010 level
2015 without reforms
Change in mean RR (ppts) from: 2015
excluding UC 2015
including UC
Number of people (millions)
Tax changes
Benefit changes
UC
Single, no children 38.7% 41.5% –0.9 –3.5 –0.9 37.2% 36.3% 10.5
Lone parent 70.6% 72.3% –0.6 –1.7 +0.3 70.1% 70.4% 2.0
Partner not working, no children
58.6% 59.8% –0.1 –4.3 –3.2 55.4% 52.2% 3.1
Partner not working, children 70.0% 71.8% –0.5 –0.1 –5.7 71.3% 65.6% 2.8
Partner working, no children 55.0% 56.0% –0.0 –1.3 +0.1 54.7% 54.8% 9.4
Partner working, children 65.6% 67.3% –0.3 –2.0 +0.9 64.9% 65.8% 8.7
Without children 48.0% 50.0% –0.4 –2.7 –0.8 46.8% 46.0% 23.1
With children 67.2% 68.9% –0.4 –1.6 –0.5 67.0% 66.4% 13.5
Non-workers 60.7% 63.0% –0.4 –2.8 –0.8 59.8% 59.0% 10.6
Workers 53.2% 54.5% –0.4 –2.1 –0.7 52.1% 51.4% 26.1
Total 55.3% 57.0% –0.4 –2.3 –0.7 54.3% 53.6% 36.6
Source: As for Figure 5.1.
© Institute for Fiscal Studies, 2013
23
Table 6.3 Impact of tax and benefit reforms on PTRs of different groups
2010 level
2015 without reforms
Change in mean PTR (ppts) from: 2015
excluding UC 2015
including UC
Number of people (millions)
Tax changes
Benefit changes
UC
Single, no children 53.8% 55.6% –0.8 –2.0 –1.5 52.7% 51.2% 10.5
Lone parent 53.6% 51.7% –0.4 +1.3 +3.6 52.7% 56.4% 2.0
Partner not working, no children
60.4% 60.9% –0.1 –2.1 –3.4 58.7% 55.2% 3.1
Partner not working, children 70.8% 71.3% –0.5 +4.8 –10.7 75.6% 64.9% 2.8
Partner working, no children 42.4% 43.1% –0.6 –1.5 +0.1 41.1% 41.2% 9.4
Partner working, children 48.4% 49.5% –0.8 –1.8 +2.5 46.9% 49.4% 8.7
Without children 50.0% 51.2% –0.6 –1.8 –1.1 48.8% 47.7% 23.1
With children 53.5% 54.3% –0.7 –0.0 –0.0 53.6% 53.6% 13.5
Non-workers 53.2% 54.6% –0.5 –1.5 –1.0 52.5% 51.5% 10.6
Workers 50.6% 51.4% –0.7 –1.0 –0.6 49.7% 49.2% 26.1
Total 51.3% 52.4% –0.7 –1.2 –0.7 50.5% 49.8% 36.6
Source: As for Figure 5.1.
© Institute for Fiscal Studies, 2013
24
Figure 6.2: Impact of tax and benefit reforms from 2010 to 2015 on mean PTRs by employer cost
Source: As Figure 5.1.
Incentives for those in work to increase their earnings
Table 6.5 and Figure 6.3 show how the tax and benefit reforms affect average EMTRs for
workers with different family circumstances and at different earnings levels. Overall, average
EMTRs are almost unaffected by the reforms, though this is through the offsetting effects of
different reforms and there is some variation between different groups and different levels of
earnings.
Tax changes increase average EMTRs for workers, though this is not the case at all earnings
levels. At low levels of earnings, increases in the thresholds at which income tax and NICs start to
be paid reduce EMTRs. However, those who are still paying NICs following this reform face
higher NIC rates, and higher VAT increases EMTRs at all earnings levels. As lone parents are the
group that is most likely to have such low levels of earnings, tax changes reduce average EMTRs
among lone parents but increase them for other groups. As those with children are more likely to
work part time and have low levels of earnings more generally, tax changes increase EMTRs for
those without children by more than for those with children.
Benefit changes excluding universal credit reduce average EMTRs for all groups and at all
earnings levels below £50,000, the point where child benefit now starts to be withdrawn. This
reduction in EMTRs arises because cuts to the generosity of means-tested benefits mean that
fewer workers are on a means-tested benefit taper and face losing support if they increase their
earnings slightly. These effects are less relevant for couples without children, who are less likely
to be entitled to means-tested benefits when at least one partner works, and are not affected by
the new means test for child benefit either. Interestingly, though, the group that sees their EMTRs
fall by most on average as a result of benefit changes are single people without children. This is
because they are less affected by those benefit changes that increase EMTRs for people with
children, such as the higher tax credit withdrawal rate and the introduction of the means test for
30%
35%
40%
45%
50%
55%
60%
0 10000 20000 30000 40000 50000 60000
Gross employer cost (£/year)
No tax and benefit changes Tax changes only
All changes except UC All changes with UC
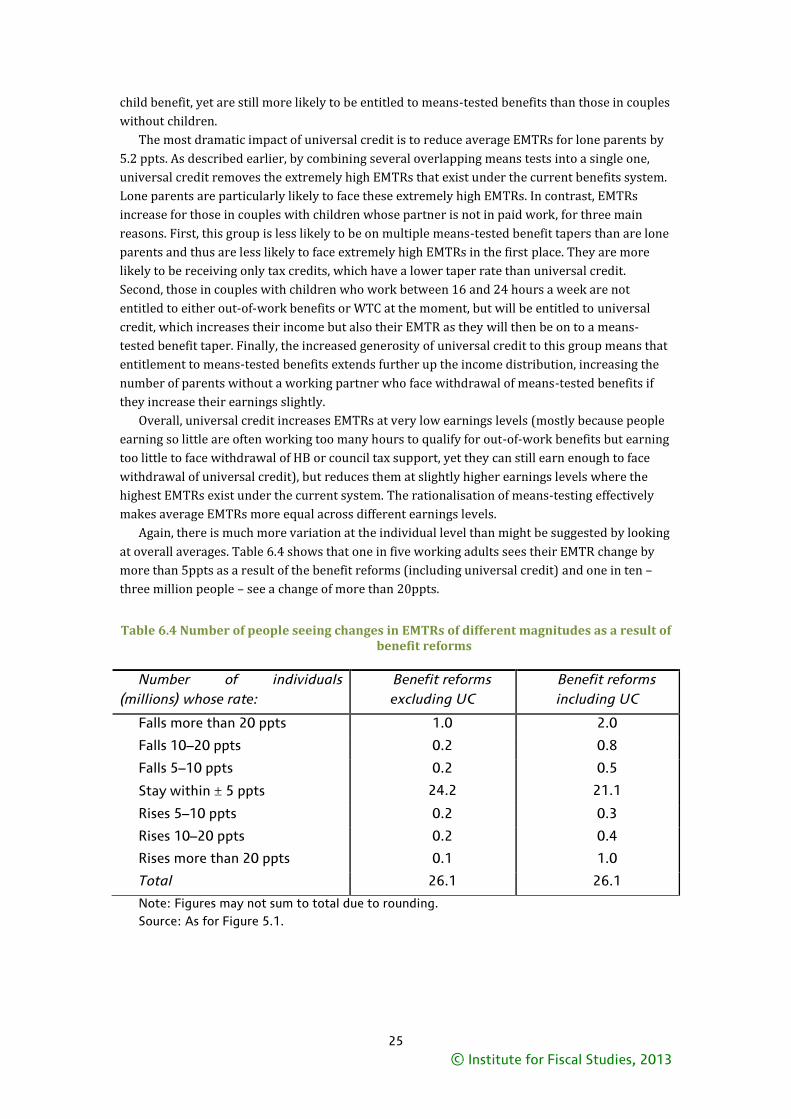
© Institute for Fiscal Studies, 2013
25
child benefit, yet are still more likely to be entitled to means-tested benefits than those in couples
without children.
The most dramatic impact of universal credit is to reduce average EMTRs for lone parents by
5.2 ppts. As described earlier, by combining several overlapping means tests into a single one,
universal credit removes the extremely high EMTRs that exist under the current benefits system.
Lone parents are particularly likely to face these extremely high EMTRs. In contrast, EMTRs
increase for those in couples with children whose partner is not in paid work, for three main
reasons. First, this group is less likely to be on multiple means-tested benefit tapers than are lone
parents and thus are less likely to face extremely high EMTRs in the first place. They are more
likely to be receiving only tax credits, which have a lower taper rate than universal credit.
Second, those in couples with children who work between 16 and 24 hours a week are not
entitled to either out-of-work benefits or WTC at the moment, but will be entitled to universal
credit, which increases their income but also their EMTR as they will then be on to a means-
tested benefit taper. Finally, the increased generosity of universal credit to this group means that
entitlement to means-tested benefits extends further up the income distribution, increasing the
number of parents without a working partner who face withdrawal of means-tested benefits if
they increase their earnings slightly.
Overall, universal credit increases EMTRs at very low earnings levels (mostly because people
earning so little are often working too many hours to qualify for out-of-work benefits but earning
too little to face withdrawal of HB or council tax support, yet they can still earn enough to face
withdrawal of universal credit), but reduces them at slightly higher earnings levels where the
highest EMTRs exist under the current system. The rationalisation of means-testing effectively
makes average EMTRs more equal across different earnings levels.
Again, there is much more variation at the individual level than might be suggested by looking
at overall averages. Table 6.4 shows that one in five working adults sees their EMTR change by
more than 5ppts as a result of the benefit reforms (including universal credit) and one in ten –
three million people – see a change of more than 20ppts.
Table 6.4 Number of people seeing changes in EMTRs of different magnitudes as a result of benefit reforms
Number of individuals
(millions) whose rate:
Benefit reforms
excluding UC
Benefit reforms
including UC
Falls more than 20 ppts 1.0 2.0
Falls 10–20 ppts 0.2 0.8
Falls 5–10 ppts 0.2 0.5
Stay within ± 5 ppts 24.2 21.1
Rises 5–10 ppts 0.2 0.3
Rises 10–20 ppts 0.2 0.4
Rises more than 20 ppts 0.1 1.0
Total 26.1 26.1
Note: Figures may not sum to total due to rounding.
Source: As for Figure 5.1.
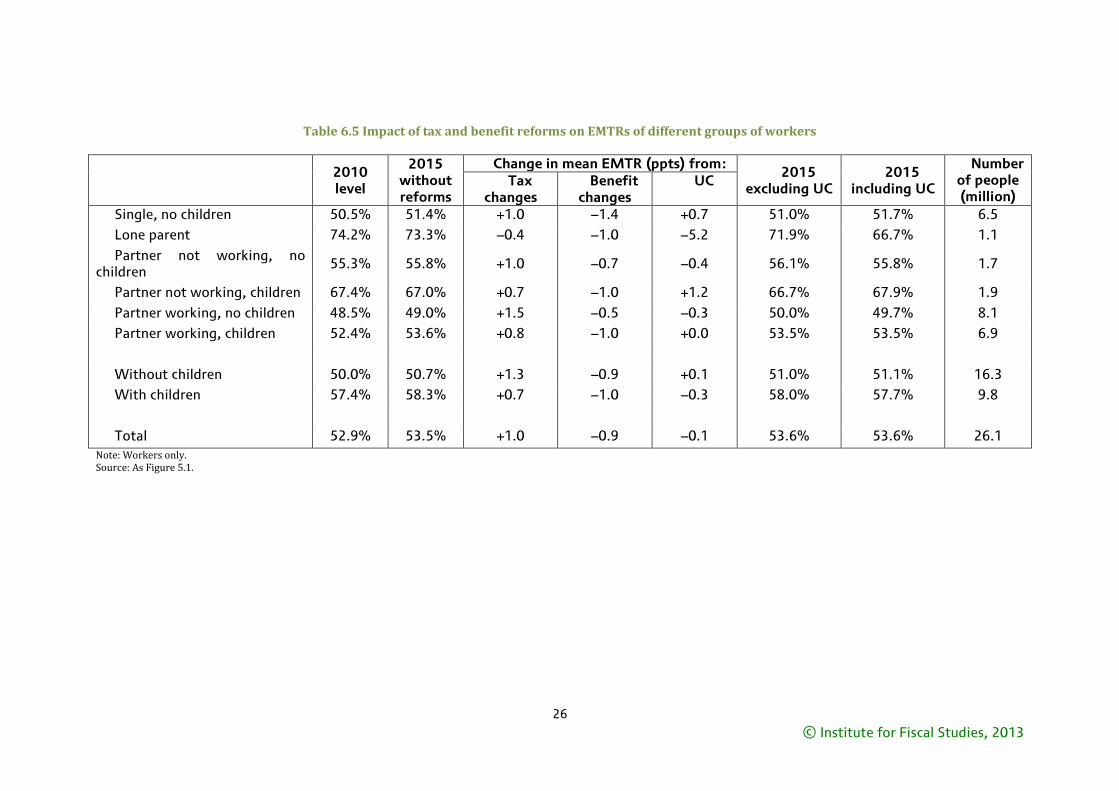
© Institute for Fiscal Studies, 2013
26
Table 6.5 Impact of tax and benefit reforms on EMTRs of different groups of workers
2010 level
2015 without reforms
Change in mean EMTR (ppts) from: 2015
excluding UC 2015
including UC
Number of people (million)
Tax changes
Benefit changes
UC
Single, no children 50.5% 51.4% +1.0 –1.4 +0.7 51.0% 51.7% 6.5
Lone parent 74.2% 73.3% –0.4 –1.0 –5.2 71.9% 66.7% 1.1
Partner not working, no children
55.3% 55.8% +1.0 –0.7 –0.4 56.1% 55.8% 1.7
Partner not working, children 67.4% 67.0% +0.7 –1.0 +1.2 66.7% 67.9% 1.9
Partner working, no children 48.5% 49.0% +1.5 –0.5 –0.3 50.0% 49.7% 8.1
Partner working, children 52.4% 53.6% +0.8 –1.0 +0.0 53.5% 53.5% 6.9
Without children 50.0% 50.7% +1.3 –0.9 +0.1 51.0% 51.1% 16.3
With children 57.4% 58.3% +0.7 –1.0 –0.3 58.0% 57.7% 9.8
Total 52.9% 53.5% +1.0 –0.9 –0.1 53.6% 53.6% 26.1
Note: Workers only. Source: As Figure 5.1.
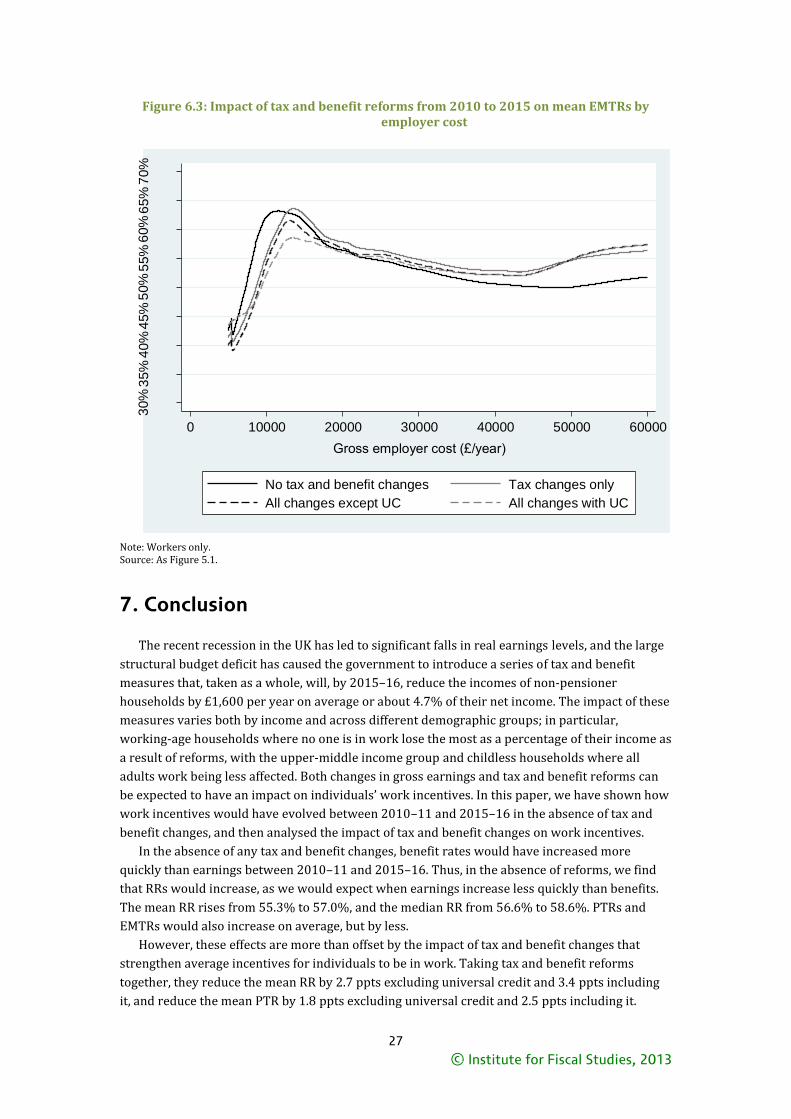
© Institute for Fiscal Studies, 2013
27
Figure 6.3: Impact of tax and benefit reforms from 2010 to 2015 on mean EMTRs by employer cost
Note: Workers only. Source: As Figure 5.1.
7. Conclusion
The recent recession in the UK has led to significant falls in real earnings levels, and the large
structural budget deficit has caused the government to introduce a series of tax and benefit
measures that, taken as a whole, will, by 2015–16, reduce the incomes of non-pensioner
households by £1,600 per year on average or about 4.7% of their net income. The impact of these
measures varies both by income and across different demographic groups; in particular,
working-age households where no one is in work lose the most as a percentage of their income as
a result of reforms, with the upper-middle income group and childless households where all
adults work being less affected. Both changes in gross earnings and tax and benefit reforms can
be expected to have an impact on individuals’ work incentives. In this paper, we have shown how
work incentives would have evolved between 2010–11 and 2015–16 in the absence of tax and
benefit changes, and then analysed the impact of tax and benefit changes on work incentives.
In the absence of any tax and benefit changes, benefit rates would have increased more
quickly than earnings between 2010–11 and 2015–16. Thus, in the absence of reforms, we find
that RRs would increase, as we would expect when earnings increase less quickly than benefits.
The mean RR rises from 55.3% to 57.0%, and the median RR from 56.6% to 58.6%. PTRs and
EMTRs would also increase on average, but by less.
However, these effects are more than offset by the impact of tax and benefit changes that
strengthen average incentives for individuals to be in work. Taking tax and benefit reforms
together, they reduce the mean RR by 2.7 ppts excluding universal credit and 3.4 ppts including
it, and reduce the mean PTR by 1.8 ppts excluding universal credit and 2.5 ppts including it.
30%
35%
40%
45%
50%
55%
60%
65%
70%
0 10000 20000 30000 40000 50000 60000
Gross employer cost (£/year)
No tax and benefit changes Tax changes only
All changes except UC All changes with UC

© Institute for Fiscal Studies, 2013
28
But while these changes to average RRs and PTRs are far from negligible, they are relatively
modest considering the sheer scale of the reforms in question. The averages conceal far bigger
changes at the individual level: for example, 30% of working-age adults (11 million people) see
their PTR change by more than 5ppts (7.5 million down by at least 5ppts and 3.5 million up by at
least 5ppts), 17% by more than 10ppts (4 million down by at least 10ppts and 2.3 million up by
at least 10ppts) and 7% by more than 20ppts (1.6 million down by at least 20ppts and 1.1 million
up by at least 20ppts) as a result of the benefit reforms (including universal credit). The
relatively modest averages reflect strengthening of incentives for some being offset by
weakening for others.
Benefit changes other than universal credit are responsible for the bulk of the reduction in the
mean RR and PTR. For those without a working partner (i.e. single people and people with non-
working partners), the effect of the benefit changes on incentives to be in work is in principle
ambiguous: it depends whether in-work support or out-of-work support is cut by more. In
practice, relatively few of those without children are entitled to tax credits if they work, so cuts to
out-of-work benefits dominate and these groups see the biggest increases in their average RRs
and PTRs. For those with children, however, reductions in the tax credits they receive if they
work are significant while tax credits (though not benefits) for non-working families have
actually been increased. Lone parents and parents with non-working partners – particularly
those who earn little if they work – thus see the smallest reductions in their mean RRs, and
indeed see their mean PTRs increased by benefit changes excluding universal credit. For those
with a working partner – about half the working-age population – the strengthening of incentives
is largely unambiguous. Benefit cuts mean less (if any) support with one partner in work, and so
less to lose by a second partner working.
Universal credit also has different effects on different groups. Since the main gainers from the
introduction of universal credit are one-earner couples with children, it increases the
attractiveness of being a one-earner couple relative to being a zero-earner or a two-earner
couple. Thus it strengthens the incentive for couples to have one person in work rather than
none, but also weakens the incentive for both members of a couple to work rather than just one,
unlike the other benefit reforms. Another notable effect of universal credit is to remove most of
the very highest RRs and PTRs that exist under the current tax and benefit system: it reduces the
number of individuals with RRs of 75% or more by 400,000 and reduces the number of
individuals with PTRs of 75% or more by half (or 1.5 million).
Turning to the incentive for those in work to increase their earnings, we again see dramatic
effects at the individual level. One in five working adults (5 million people) see their EMTR
change by more than 5 ppts as a result of the benefit reforms (including universal credit, 3.3
million down by at least 5 ppts and 1.7 million up by at least 5 ppts) and one in ten (3 million)
see a change of more than 20 ppts (2 million down by at least 20 ppts and 1 million up by at least
20 ppts).
Big changes at the individual level offset each other for the population as a whole. Universal
credit reduces EMTRs for those who face the very highest EMTRs under the current system,
significantly reducing the average EMTR for lone parents in particular, but increases EMTRs for
many others. Reductions in the generosity of means-tested benefits mean that fewer workers
face the high EMTRs associated with benefit tapers; but tax changes, in particular increases in
rates of NICs and VAT, tend to increase EMTRs except at very low levels of earnings where
increases in thresholds have taken many people out of income tax (and some people out of NICs)
altogether. Taking all tax and benefit reforms together, it turns out that the average EMTR across
all workers barely changes at all.
To summarise: the government’s welfare reforms strengthen financial incentives to be in
work, on average, more than offsetting the weakening caused by falling real wages. The patterns
© Institute for Fiscal Studies, 2013
29
vary across the population, however, and particularly between first and second earners in
couples. Universal credit contributes to this strengthening of incentives to be in work – a notable
achievement given that it is broadly revenue-neutral and distributionally neutral. But the
strengthening is predominantly caused by reductions in the generosity of means-tested benefits,
though reductions in average RRs and PTRs are perhaps less dramatic than might be expected
given the scale of the cuts, in part because of the way the government has changed tax credits for
families with children. Benefit cuts also reduce the number of people on means-tested benefit
tapers, but the reduction in average EMTRs this causes is no greater than the rise in average
EMTRs caused by the tax increases introduced by the coalition government. However, while
these changes are true on average, it is worth emphasising the huge amount of variation there is
at the individual level, with large numbers of people seeing large rises or falls in effective tax
rates. And one unambiguously welcome aspect of the reforms is how universal credit reduces the
number of people facing the very weakest work incentives.
Although this paper focuses on financial work incentives, changes in non-financial incentives
and in the perception of how the tax and benefit system works are also likely to be important.
While universal credit will change the overall entitlements of people in different circumstances,
arguably just as important is the way it integrates different strands of support into a single
benefit. This offers the prospect of greater simplicity and more transparent work incentives –
though perhaps with a less visible and salient incentive to work than working tax credit provides,
and with much depending on how successful the practical implementation proves to be.
Universal credit may also extend work search requirements to many more low earners,
especially in couples, than are subject to them now. Universal credit is not the only benefit
reform being introduced that will affect non-financial work incentives. The Work Programme
involves a significant reorganisation of welfare-to-work; and work search requirements are
being imposed for the first time on many lone parents and previous claimants of disability
benefits. While these changes might be expected to increase moves from non-employment to
employment in principle, in practice it is not clear how large the impact will be.
Finally, we should remember that labour market outcomes do not depend only on incentives
and preferences: given that fairly high levels of unemployment are expected to persist for the
coming years, the state of labour demand will also be a key determinant of total employment in
the years to come.
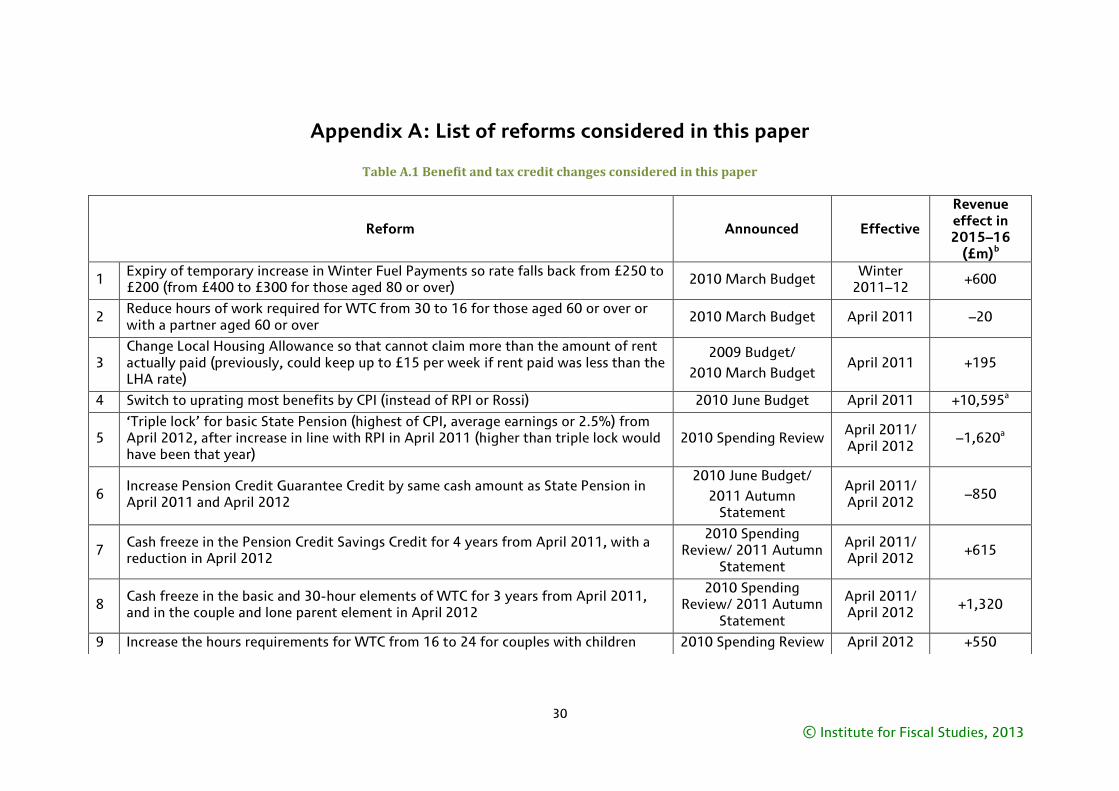
© Institute for Fiscal Studies, 2013
30
Appendix A: List of reforms considered in this paper
Table A.1 Benefit and tax credit changes considered in this paper
Reform Announced Effective
Revenue effect in 2015–16
(£m)b
1 Expiry of temporary increase in Winter Fuel Payments so rate falls back from £250 to £200 (from £400 to £300 for those aged 80 or over)
2010 March Budget Winter
2011–12 +600
2 Reduce hours of work required for WTC from 30 to 16 for those aged 60 or over or with a partner aged 60 or over
2010 March Budget April 2011 –20
3 Change Local Housing Allowance so that cannot claim more than the amount of rent actually paid (previously, could keep up to £15 per week if rent paid was less than the LHA rate)
2009 Budget/
2010 March Budget April 2011 +195
4 Switch to uprating most benefits by CPI (instead of RPI or Rossi) 2010 June Budget April 2011 +10,595a
5 ―Triple lock‖ for basic State Pension (highest of CPI, average earnings or 2.5%) from April 2012, after increase in line with RPI in April 2011 (higher than triple lock would have been that year)
2010 Spending Review April 2011/ April 2012
–1,620a
6 Increase Pension Credit Guarantee Credit by same cash amount as State Pension in April 2011 and April 2012
2010 June Budget/
2011 Autumn Statement
April 2011/ April 2012
–850
7 Cash freeze in the Pension Credit Savings Credit for 4 years from April 2011, with a reduction in April 2012
2010 Spending Review/ 2011 Autumn
Statement
April 2011/ April 2012
+615
8 Cash freeze in the basic and 30-hour elements of WTC for 3 years from April 2011, and in the couple and lone parent element in April 2012
2010 Spending Review/ 2011 Autumn
Statement
April 2011/ April 2012
+1,320
9 Increase the hours requirements for WTC from 16 to 24 for couples with children 2010 Spending Review April 2012 +550
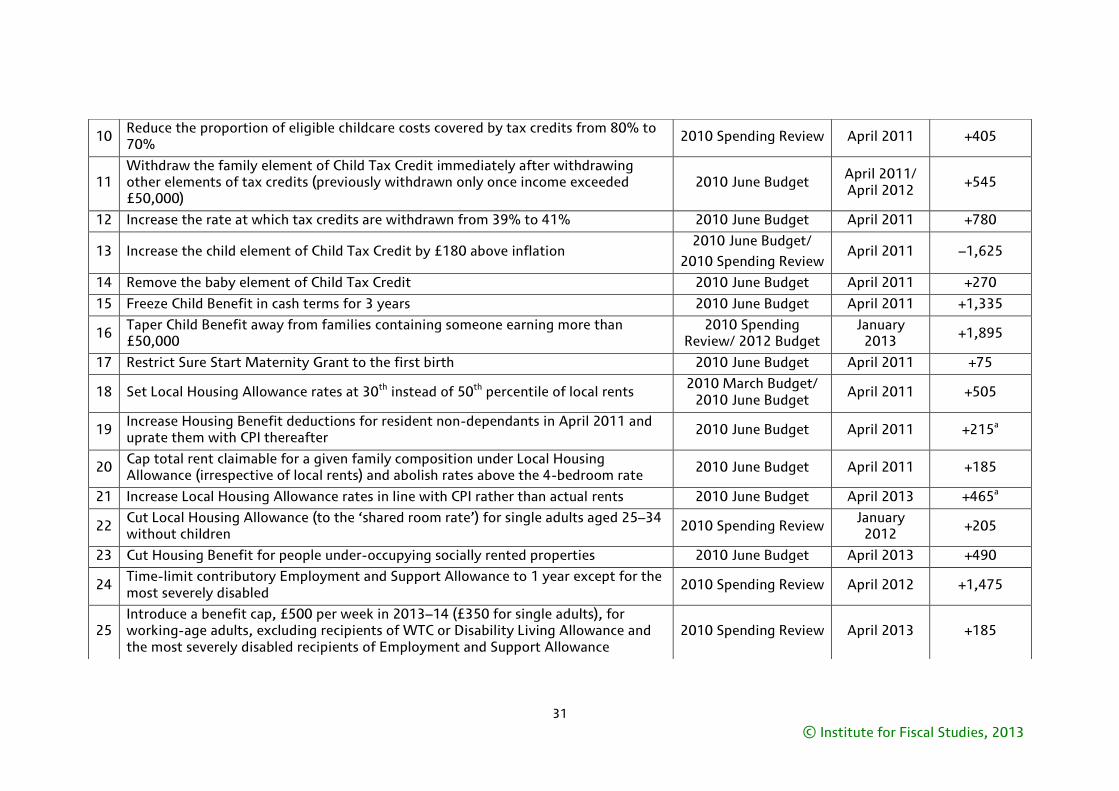
© Institute for Fiscal Studies, 2013
31
10 Reduce the proportion of eligible childcare costs covered by tax credits from 80% to 70%
2010 Spending Review April 2011 +405
11 Withdraw the family element of Child Tax Credit immediately after withdrawing other elements of tax credits (previously withdrawn only once income exceeded £50,000)
2010 June Budget April 2011/ April 2012
+545
12 Increase the rate at which tax credits are withdrawn from 39% to 41% 2010 June Budget April 2011 +780
13 Increase the child element of Child Tax Credit by £180 above inflation 2010 June Budget/
2010 Spending Review April 2011 –1,625
14 Remove the baby element of Child Tax Credit 2010 June Budget April 2011 +270
15 Freeze Child Benefit in cash terms for 3 years 2010 June Budget April 2011 +1,335
16 Taper Child Benefit away from families containing someone earning more than £50,000
2010 Spending Review/ 2012 Budget
January 2013
+1,895
17 Restrict Sure Start Maternity Grant to the first birth 2010 June Budget April 2011 +75
18 Set Local Housing Allowance rates at 30th instead of 50th percentile of local rents 2010 March Budget/
2010 June Budget April 2011 +505
19 Increase Housing Benefit deductions for resident non-dependants in April 2011 and uprate them with CPI thereafter
2010 June Budget April 2011 +215a
20 Cap total rent claimable for a given family composition under Local Housing Allowance (irrespective of local rents) and abolish rates above the 4-bedroom rate
2010 June Budget April 2011 +185
21 Increase Local Housing Allowance rates in line with CPI rather than actual rents 2010 June Budget April 2013 +465a
22 Cut Local Housing Allowance (to the ―shared room rate‖) for single adults aged 25–34 without children
2010 Spending Review January
2012 +205
23 Cut Housing Benefit for people under-occupying socially rented properties 2010 June Budget April 2013 +490
24 Time-limit contributory Employment and Support Allowance to 1 year except for the most severely disabled
2010 Spending Review April 2012 +1,475
25 Introduce a benefit cap, £500 per week in 2013–14 (£350 for single adults), for working-age adults, excluding recipients of WTC or Disability Living Allowance and the most severely disabled recipients of Employment and Support Allowance
2010 Spending Review April 2013 +185
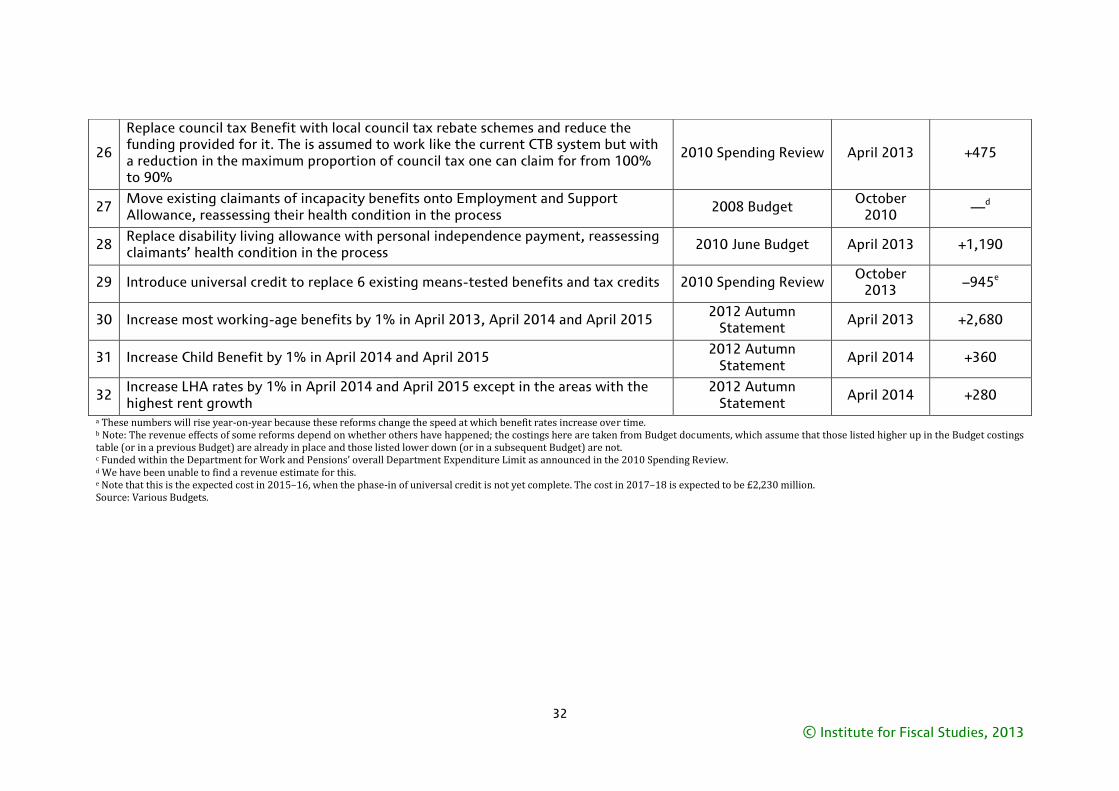
© Institute for Fiscal Studies, 2013
32
a These numbers will rise year-on-year because these reforms change the speed at which benefit rates increase over time. b Note: The revenue effects of some reforms depend on whether others have happened; the costings here are taken from Budget documents, which assume that those listed higher up in the Budget costings table (or in a previous Budget) are already in place and those listed lower down (or in a subsequent Budget) are not. c Funded within the Department for Work and Pensions’ overall Department Expenditure Limit as announced in the 2010 Spending Review. d We have been unable to find a revenue estimate for this. e Note that this is the expected cost in 2015–16, when the phase-in of universal credit is not yet complete. The cost in 2017–18 is expected to be £2,230 million. Source: Various Budgets.
26
Replace council tax Benefit with local council tax rebate schemes and reduce the funding provided for it. The is assumed to work like the current CTB system but with a reduction in the maximum proportion of council tax one can claim for from 100% to 90%
2010 Spending Review April 2013 +475
27 Move existing claimants of incapacity benefits onto Employment and Support Allowance, reassessing their health condition in the process
2008 Budget October
2010 —d
28 Replace disability living allowance with personal independence payment, reassessing claimants‖ health condition in the process
2010 June Budget April 2013 +1,190
29 Introduce universal credit to replace 6 existing means-tested benefits and tax credits 2010 Spending Review October
2013 –945e
30 Increase most working-age benefits by 1% in April 2013, April 2014 and April 2015 2012 Autumn
Statement April 2013 +2,680
31 Increase Child Benefit by 1% in April 2014 and April 2015 2012 Autumn
Statement April 2014 +360
32 Increase LHA rates by 1% in April 2014 and April 2015 except in the areas with the highest rent growth
2012 Autumn Statement
April 2014 +280
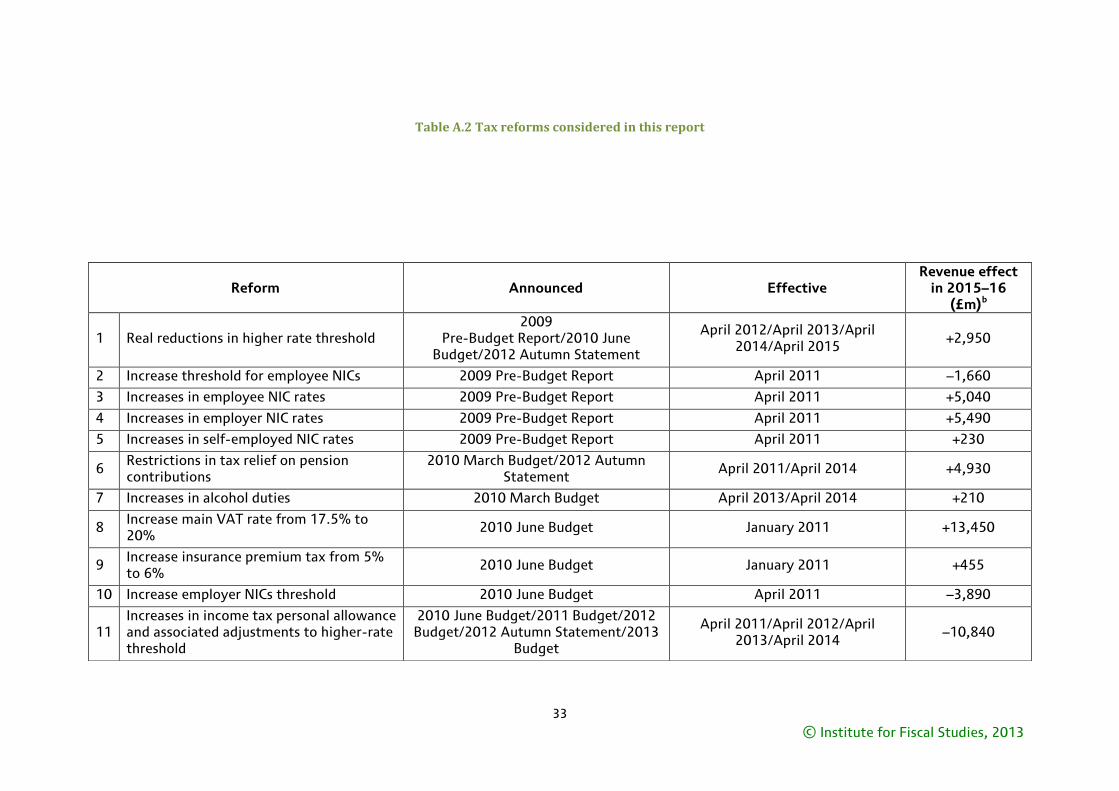
© Institute for Fiscal Studies, 2013
33
Table A.2 Tax reforms considered in this report
Reform Announced Effective Revenue effect
in 2015–16 (£m)b
1 Real reductions in higher rate threshold 2009
Pre-Budget Report/2010 June Budget/2012 Autumn Statement
April 2012/April 2013/April 2014/April 2015
+2,950
2 Increase threshold for employee NICs 2009 Pre-Budget Report April 2011 –1,660
3 Increases in employee NIC rates 2009 Pre-Budget Report April 2011 +5,040
4 Increases in employer NIC rates 2009 Pre-Budget Report April 2011 +5,490
5 Increases in self-employed NIC rates 2009 Pre-Budget Report April 2011 +230
6 Restrictions in tax relief on pension contributions
2010 March Budget/2012 Autumn Statement
April 2011/April 2014 +4,930
7 Increases in alcohol duties 2010 March Budget April 2013/April 2014 +210
8 Increase main VAT rate from 17.5% to 20%
2010 June Budget January 2011 +13,450
9 Increase insurance premium tax from 5% to 6%
2010 June Budget January 2011 +455
10 Increase employer NICs threshold 2010 June Budget April 2011 –3,890
11 Increases in income tax personal allowance and associated adjustments to higher-rate threshold
2010 June Budget/2011 Budget/2012 Budget/2012 Autumn Statement/2013
Budget
April 2011/April 2012/April 2013/April 2014
–10,840

© Institute for Fiscal Studies, 2013
34
a These numbers will rise year-on-year because these reforms change the speed at which tax thresholds increase over time. b Note: The revenue effects of some reforms depend on whether others have happened; the costings here are taken from Budget documents, which assume that those arbitrarily listed higher up in the
Budget costings table (or in a previous Budget) are already in place and those listed lower down (or in a subsequent Budget) are not. Source: Various Budgets.
12 Council tax freezes 2010 June Budget/2011 Autumn
Statement/2012 Autumn Statement April 2011/April 2012/April 2013 –1,690
13 Increase some direct tax thresholds in line with CPI inflation (as opposed to RPI inflation)
2011 Budget April 2012 +390a
14 Reduce NICs contracted out rebates 2011 Budget April 2012 +610
15 Reduce fuel duties in real terms 2011 Budget/2011 Autumn
Statement/2012 Autumn Statement/2013 Budget
April 2011/January 2012/August 2012/January 2013/September
2013 –5,525
16 Increase tobacco duties 2010 March Budget/2012 Budget March 2011/March 2012/March
2013/March 2014 +200
17 Reduce top tax rate from 50% to 45% 2012 Budget April 2013 –110
18 Freeze income tax personal allowances for those aged 65 and over and restrict to existing claimants
2012 Budget April 2013 +1,040
19 Reduce beer duty 2013 Budget March 2013 –210
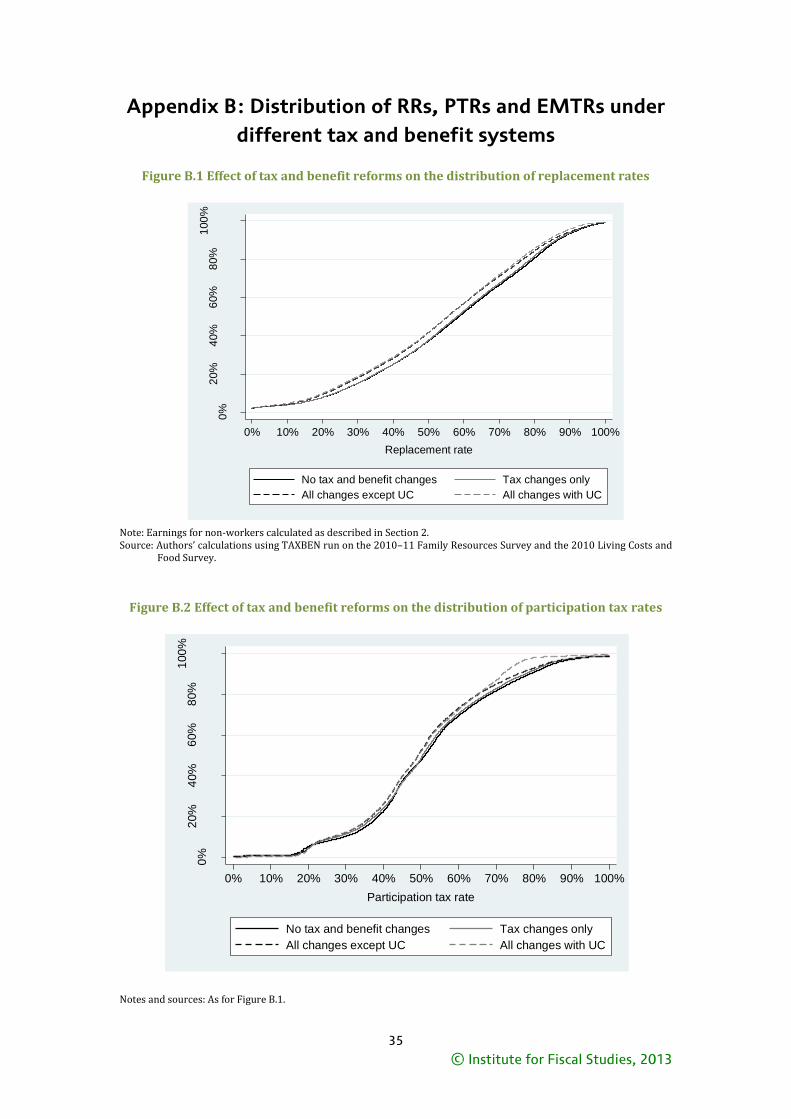
© Institute for Fiscal Studies, 2013
35
Appendix B: Distribution of RRs, PTRs and EMTRs under
different tax and benefit systems
Figure B.1 Effect of tax and benefit reforms on the distribution of replacement rates
Note: Earnings for non-workers calculated as described in Section 2. Source: Authors’ calculations using TAXBEN run on the 2010–11 Family Resources Survey and the 2010 Living Costs and
Food Survey.
Figure B.2 Effect of tax and benefit reforms on the distribution of participation tax rates
Notes and sources: As for Figure B.1.
0%
20%
40%
60%
80%
100
%
Pe
rcen
tage
with
RR
be
low
this
leve
l
0% 10% 20% 30% 40% 50% 60% 70% 80% 90% 100%
Replacement rate
No tax and benefit changes Tax changes only
All changes except UC All changes with UC
0%
20%
40%
60%
80%
100
%
Pe
rcen
tage
with
PT
R b
elo
w this
leve
l
0% 10% 20% 30% 40% 50% 60% 70% 80% 90% 100%
Participation tax rate
No tax and benefit changes Tax changes only
All changes except UC All changes with UC
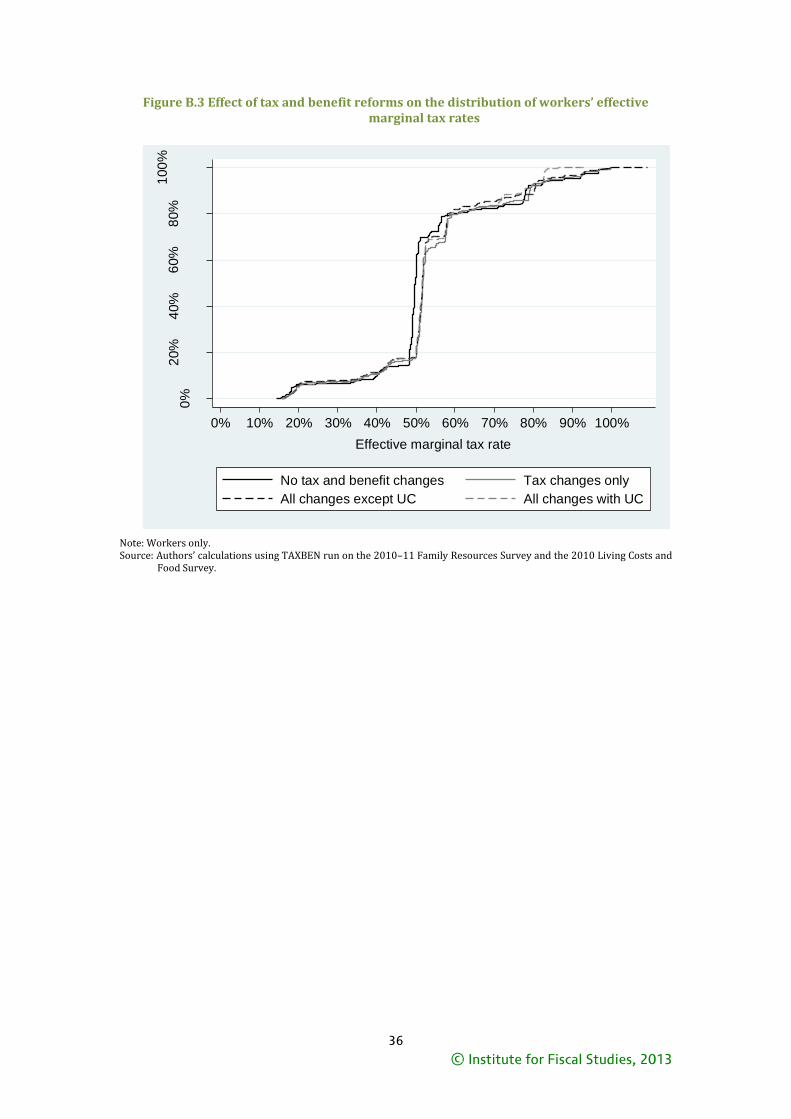
© Institute for Fiscal Studies, 2013
36
Figure B.3 Effect of tax and benefit reforms on the distribution of workers’ effective marginal tax rates
Note: Workers only. Source: Authors’ calculations using TAXBEN run on the 2010–11 Family Resources Survey and the 2010 Living Costs and
Food Survey.
0%
20%
40%
60%
80%
100
%
Pro
po
rtio
n o
f w
ork
ers
belo
w th
is E
MT
R
0% 10% 20% 30% 40% 50% 60% 70% 80% 90% 100%
Effective marginal tax rate
No tax and benefit changes Tax changes only
All changes except UC All changes with UC
© Institute for Fiscal Studies, 2013
37
References
Adam, S. and Browne, J. (2010), ‘Redistribution, Work Incentives and Thirty Years of UK Tax
and Benefit Reform’, IFS Working Paper No. W10/24, http://www.ifs.org.uk/publications/5367.
Adam, S. and Phillips, D. (2012), ‘An ex-ante analysis of the effects of the UK government’s
welfare reforms on labour supply in Wales’, IFS Report 75,
http://www.ifs.org.uk/publications/6586.
Brewer, M., Browne, J. and Jin, W. (2012), ‘Universal Credit: A Preliminary Analysis of Its
Impact on Incomes and Work Incentives’, Fiscal Studies vol. 33(1), pp. 39–71.
Brewer, M., Browne, J., Hood, A., Joyce, R. and Sibieta, L. (2013), ‘The Short- and Medium-
Term Impacts of the Recession on the UK Income Distribution’, Fiscal Studies vol. 34(2),
pp.179−202.
Browne, J. (2012), ‘Reweight2: Stata Command to Reweight Data to User-Defined Control
Totals’, http://www.ifs.org.uk/publications/6270.
Browne, J. and Roantree, B. (2012), ‘A Survey of the UK Tax System’, IFS Briefing Note 9,
http://www.ifs.org.uk/publications/1711.
Browne, J. and Roantree, B. (2013), ‘Universal Credit in Northern Ireland: What Will Its Impact
Be, and What Are the Challenges?’, IFS Report 77, http://www.ifs.org.uk/publications/6641.
Comptroller and Auditor General (2012), ‘A Commentary for the Committee of Public
Accounts on the Work Programme Outcome Statistics’, HC 832.
Cribb, J., Emmerson, C. and Tetlow, G. (2013), ‘Incentives, Shocks or Signals: Labour Supply
Effects of Increasing the Female State Pension Age in the UK’, IFS Working Paper W13/03
http://www.ifs.org.uk/publications/6622.
Department for Communities and Local Government (2012), ‘Household Projections’
https://www.gov.uk/government/statistical-data-sets/detailed-data-for-modelling-and-
analytical-purposes.
Department for Work and Pensions (2012), ‘Explanatory Memorandum for the Social Security
Advisory Committee’,
https://www.gov.uk/government/uploads/system/uploads/attachment_data/file/221579/uc-
draft-regs-2012-memorandum.pdf.
General Register Office for Scotland (2010), ‘Household Projections for Scotland 2008-based’,
http://www.gro-scotland.gov.uk/files2/stats/household-projections/2008-
projections/household-projections-2008-based.pdf.
Gomulka, J. (1992), ‘Grossing-up Revisited’, in R. Hancock and H. Sutherland (eds), ‘Micro-
simulation Models for Public Policy Analysis: New Frontiers’, STICERD Occasional Paper, London:
London School of Economics.
© Institute for Fiscal Studies, 2013
38
HM Revenue and Customs (2012), ‘Child Benefit, Child Tax Credit and Working Tax Credit
Take-Up Rates 2010–11’, http://www.hmrc.gov.uk/statistics/fin-takeup-stats/cwtc-take-up.pdf.
Northern Ireland Statistics and Research Agency (2010), ‘2008-Based Household Projections
for Northern Ireland’, http://www.nisra.gov.uk/demography/default.asp21.htm.
Office for Budget Responsibility (2013), ‘Economic and Fiscal Outlook – March 2013’ (Cm
8573). Norwich: TSO.
Office for National Statistics (2011), ‘2010-Based National Population Projections’,
http://www.ons.gov.uk/ons/rel/npp/national-population-projections/2010-based-
projections/index.html.
Office for National Statistics (2012), ‘2010-Based Subnational Population Projections for
England’,
http://www.ons.gov.uk/ons/rel/snpp/sub-national-population-projections/2010-based-
projections/index.html.
Public Accounts Committee (2013), ‘Department for Work and Pensions: Work Programme
outcome statistics’, HC936.
Turley, C. and A. Thomas (2006), ‘ and Council Tax Benefit as In-Work Benefits; Claimants’ and
Advisors’ Knowledge, Attitudes and Experiences’, Department for Work and Pensions Research
Report 383, Leeds: CDS, http://research.dwp.gov.uk/asd/asd5/rports2005-2006/rrep383.pdf.
Welsh Assembly Government (2011), ‘Household Projections for Wales (2008-Based)’,
http://wales.gov.uk/docs/statistics/2010/100929hseholdproj2008en.pdf.