do you really have a free chlorine residual? -breakpoint ... · as the water sample ages, the free...
TRANSCRIPT
1
Breakpoint
Chlorination…
Do you Really
Have a Free
Chlorine
Residual?
Opflow June 2008
Bob Spon, chemist
www.sponwater.com

2
Water Quality Problems in
Distribution Systems
160 responses to AWWA survey indicates %
of annual reported problems:
44% Taste & Odor
43% Color & Turbidity
5% High Heterotrophic Plate Count
5% DBP’s, coliforms, corrosion, misc.
3% Loss of disinfection residual
Do you have a free Cl2 residual?
3
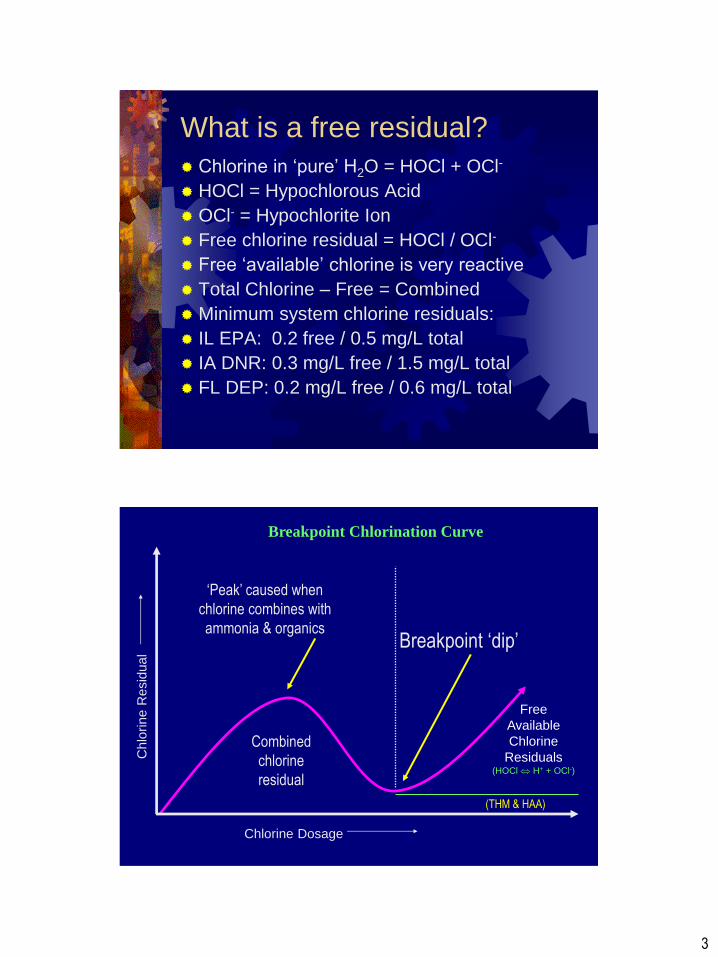
What is a free residual?
Chlorine in ‘pure’ H2O = HOCl + OCl-
HOCl = Hypochlorous Acid
OCl- = Hypochlorite Ion
Free chlorine residual = HOCl / OCl-
Free ‘available’ chlorine is very reactive
Total Chlorine – Free = Combined
Minimum system chlorine residuals:
IL EPA: 0.2 free / 0.5 mg/L total
IA DNR: 0.3 mg/L free / 1.5 mg/L total
FL DEP: 0.2 mg/L free / 0.6 mg/L total
Free
Available
Chlorine
Residuals (HOCl H+ + OCl-)
Chlorine Dosage
Chlo
rine R
esid
ual
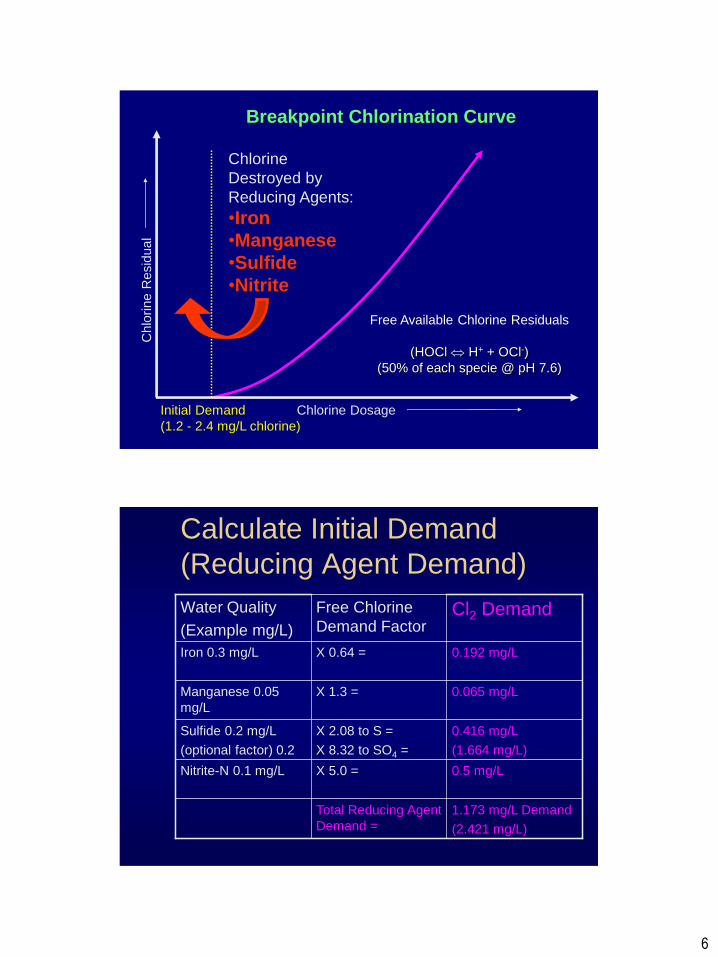
Breakpoint Chlorination Curve
Breakpoint ‘dip’
‘Peak’ caused when
chlorine combines with
ammonia & organics
Combined
chlorine
residual
(THM & HAA)

4
What is Chlorine Breakpoint?
The initial point where free ‘available’ chlorine
residual is present / detected
Breakpoint residual occurs after the chlorine
dosage rate exceeds the demand created by
reducing agents, ammonia, and organics
B.P. curve-shape is determined by contact
time, temp, chlorine and ammonia
concentration, pH, and water quality
Chlorine Dosage
Chlo
rine R
esid
ual
Breakpoint Chlorination Curve
(No/Low ammonia/organics present)
Free Available & Detectable
Chlorine Residuals
(HOCl H+ + OCl-)
Initial Chlorine Demand
Caused by Reducing Agents
NO Residual
Until Demand
is Exceeded

5
Initial Chlorine Demand-
Reducing Agents
Cl2 dosage - Demand = Residual
1 mg/ - 0.8 mg/L = 0.2 mg/L
Initial demand = Reducing Agent mg/L
(Fe+2, Mn+2, H2S, NO2-)
(Fe+2, H2S, NO2-) may reappear in plant/system
If Dosage </= Demand then ‘0’ residual
If Dosage > Demand then free residual exists
Reducing Agents donate / lose electrons
(consume oxidizing agents such as chlorine)
Reducing Agent Reactions with Chlorine
(Demand & Destroy Chlorine Residual)
NO2- + HOCl NO3
- + H+ + Cl-
H2S + Cl2 2HCl + S0
Cl2 + MnSO4 + 4NaOH
MnO2 + 2NaCl + Na2SO4 + 2H2O
2Fe(HCO3)2 + Cl2 + Ca(HCO3)2
2Fe(OH)3 + CaCl2 + 6CO2
6
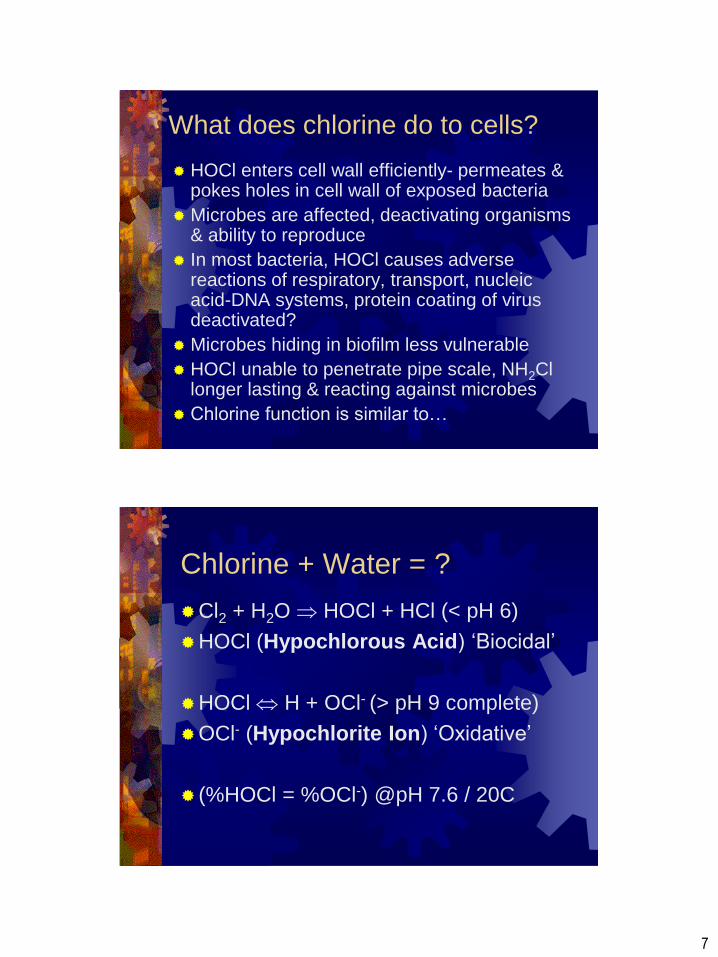
Initial Demand Chlorine Dosage
(1.2 - 2.4 mg/L chlorine)
Chlo
rine R
esid
ual
Breakpoint Chlorination Curve
Free Available Chlorine Residuals
(HOCl H+ + OCl-)
(50% of each specie @ pH 7.6)
Chlorine
Destroyed by
Reducing Agents:
•Iron
•Manganese
•Sulfide
•Nitrite
Calculate Initial Demand
(Reducing Agent Demand)
1.173 mg/L Demand
(2.421 mg/L)
Total Reducing Agent
Demand =
0.5 mg/L X 5.0 = Nitrite-N 0.1 mg/L
0.416 mg/L
(1.664 mg/L)
X 2.08 to S =
X 8.32 to SO4 =
Sulfide 0.2 mg/L
(optional factor) 0.2
0.065 mg/L X 1.3 = Manganese 0.05
mg/L
0.192 mg/L X 0.64 = Iron 0.3 mg/L
Cl2 Demand Free Chlorine
Demand Factor
Water Quality
(Example mg/L)
7
What does chlorine do to cells?
HOCl enters cell wall efficiently- permeates & pokes holes in cell wall of exposed bacteria
Microbes are affected, deactivating organisms & ability to reproduce
In most bacteria, HOCl causes adverse reactions of respiratory, transport, nucleic acid-DNA systems, protein coating of virus deactivated?
Microbes hiding in biofilm less vulnerable
HOCl unable to penetrate pipe scale, NH2Cl longer lasting & reacting against microbes
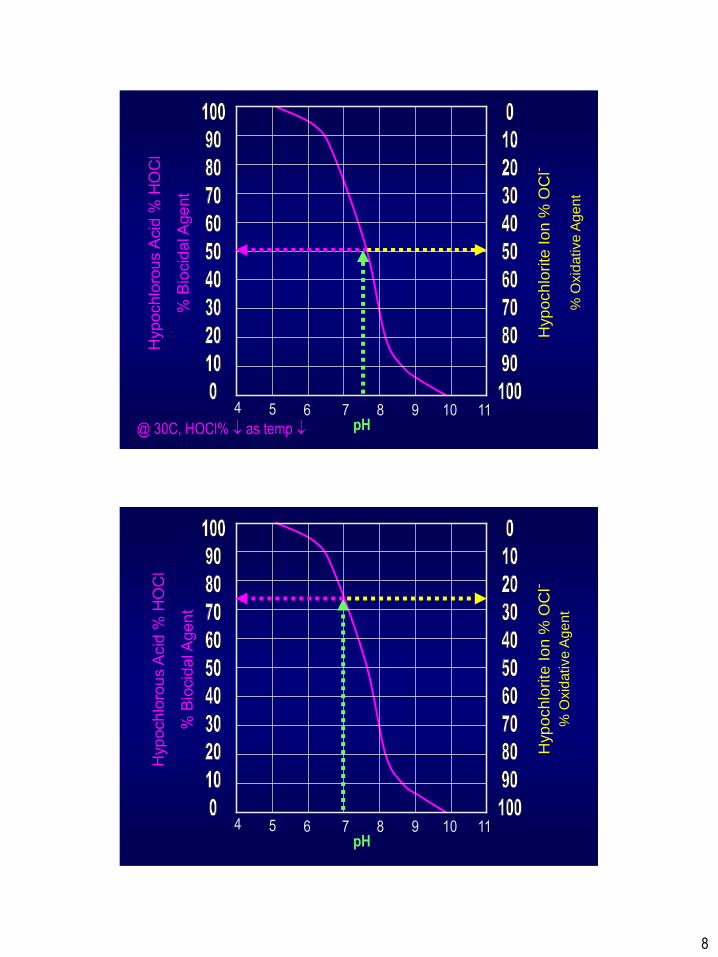
Chlorine function is similar to…
Chlorine + Water = ?
Cl2 + H2O HOCl + HCl (< pH 6)
HOCl (Hypochlorous Acid) ‘Biocidal’
HOCl H + OCl- (> pH 9 complete)
OCl- (Hypochlorite Ion) ‘Oxidative’
(%HOCl = %OCl-) @pH 7.6 / 20C
8
Hyp
och
lorite
Io
n %
OC
l-
% O
xid
ative A
gent
4 5 6 7 8 9 10 11 pH @ 30C, HOCl% as temp
Hyp
och
lorite
Io
n %
OC
l-
% O
xid
ative A
gent
4 5 6 7 8 9 10 11 pH
9
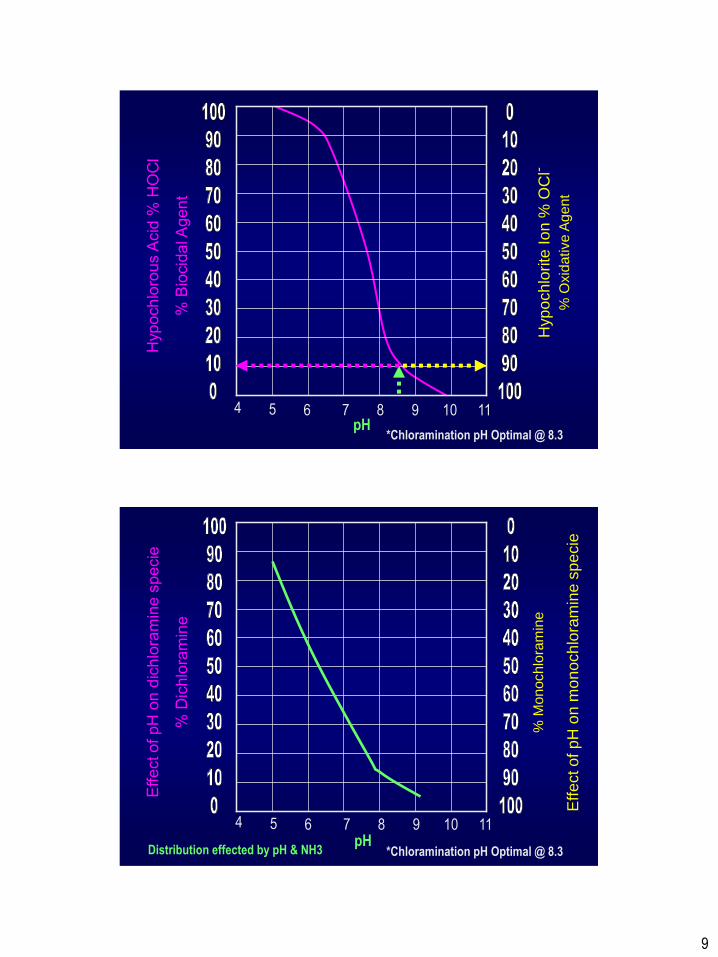
Hyp
och
lorite
Io
n %
OC
l-
% O
xid
ative A
gent
4 5 6 7 8 9 10 11 pH
*Chloramination pH Optimal @ 8.3
% M
onochlo
ram
ine
Eff
ect o
f p
H o
n m
on
och
lora
min
e s
pe
cie
*Chloramination pH Optimal @ 8.3 pH
4 5 6 7 8 9 10 11
Distribution effected by pH & NH3

10
Combined Chlorine Demand-
Combining Agents
Cl2 Dosage – Demand = Residual
Combining agents = ammonia, NOM (TOC/DOC), organic nitrogen, decayed plant/animal (proteins, amino acids)
Combined chlorine residuals are byproducts of ammonia-N and organic contaminants (tannins, lignins, color)
Chloramines / chlororganic compounds
Calculate Secondary Demand
(Combined Demand)
1.35 mg/L Demand Total Combined
Demand =
0.1mg/L
X 0.1 = Total Organic Carbon
1.0 mg/L
0.05mg/L X 1.0 = Organic-N 0.05 mg/L
1.2 mg/L X 10 to12 = Ammonia-N 0.1 mg/L
Cl2 Demand Free Chlorine
Demand Factor
Water Quality
(Example mg/L)

11
Total
Ammonia
0.1 mg/L
Free
Chlorine
Residual
(85% of
total)
Chlorine Dosage
Breakpoint
Chlo
rine R
esid
ual
Trichloramine / THM’s
Free
Ammonia Combined
Chlorine
Residuals
Breakpoint Chlorination Curve
Total Organic Carbon (TOC) 1 mg/l
(Combined demand
1.35 mg/L)
HOCl CT value
104 mg-min/L
NH2Cl CT value 1850 mg-min/L
O3 CT value 1.4 mg-min/L
Structure of Natural Organic-Humic Substance
C=O C=O
C=O C=O
OH
HO
C-OH
OH OH
HO-C

12
Chlorine / Bromine + NOM= Disinfection
Byproducts (DBPs- THM/HAA)
C=O C=O
OH
HO
C-OH HO-C
THM
HAA
HOCl
-CH4
-CH3COOH
THM = CHCl3 (4 possible combinations)
HAA5 = CH2ClCOOH (9 combinations)
Predictive Modeling for
THM, HAA formation
Risk factors:
Raw water DOC,
Applied chlorine dose,
contact time,
bromide ion mg/L,
pH,
temp

13
Cl2 + NH3 Chloramination
Monochloramine
formation
4-5 mg/L Cl2 per
1 mg/L NH3-N
pH > 8.0 optimal
Mono:Di @ > 2:1
Approximately ½
the Cl2 dosage of
breakpoint, but
dose higher rate
Total
Ammonia
1 mg/L
Chlorine Dosage (5 mg/L 10 mg/L)
Breakpoint
Chlo
rine R
esid
ual
Trichloramine / THM’s
Free
Ammonia
1— 0.1 mg/L
Breakpoint Chlorination-Chloramination Curve
Total Organic Carbon (TOC) 3 mg/L
NH2Cl = t-DPD NH2Cl < t-DPD
NH2Cl = 0
14
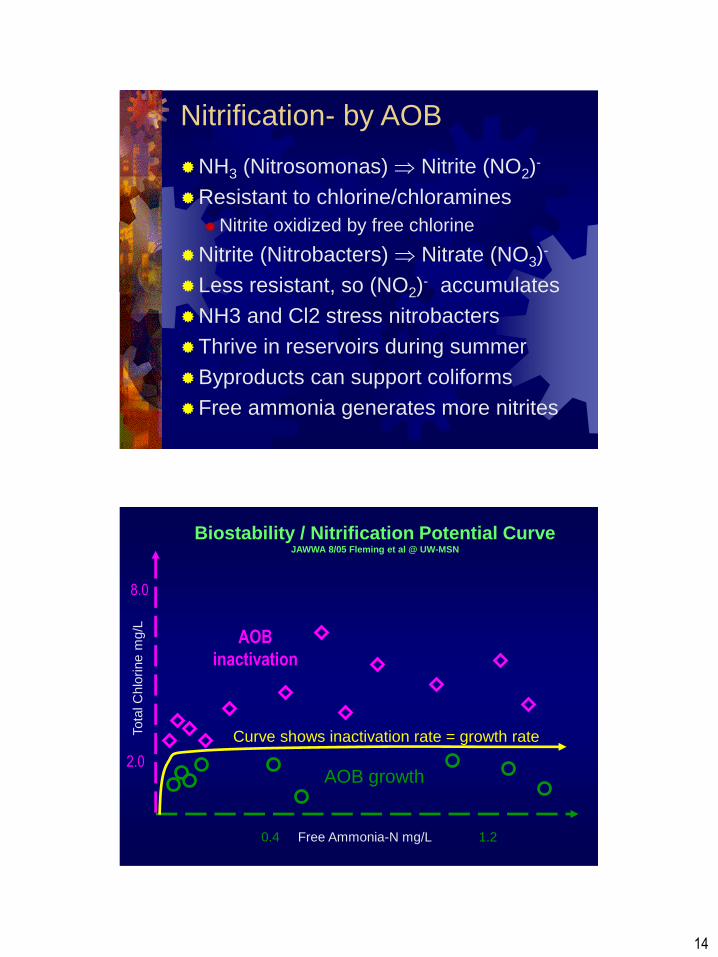
Nitrification- by AOB
NH3 (Nitrosomonas) Nitrite (NO2)-
Resistant to chlorine/chloramines
Nitrite oxidized by free chlorine
Nitrite (Nitrobacters) Nitrate (NO3)-
Less resistant, so (NO2)- accumulates
NH3 and Cl2 stress nitrobacters
Thrive in reservoirs during summer
Byproducts can support coliforms
Free ammonia generates more nitrites
0.4 Free Ammonia-N mg/L 1.2
Tota
l C
hlo
rine m
g/L
Biostability / Nitrification Potential Curve JAWWA 8/05 Fleming et al @ UW-MSN
AOB growth
AOB
inactivation
Curve shows inactivation rate = growth rate
2.0
8.0
15
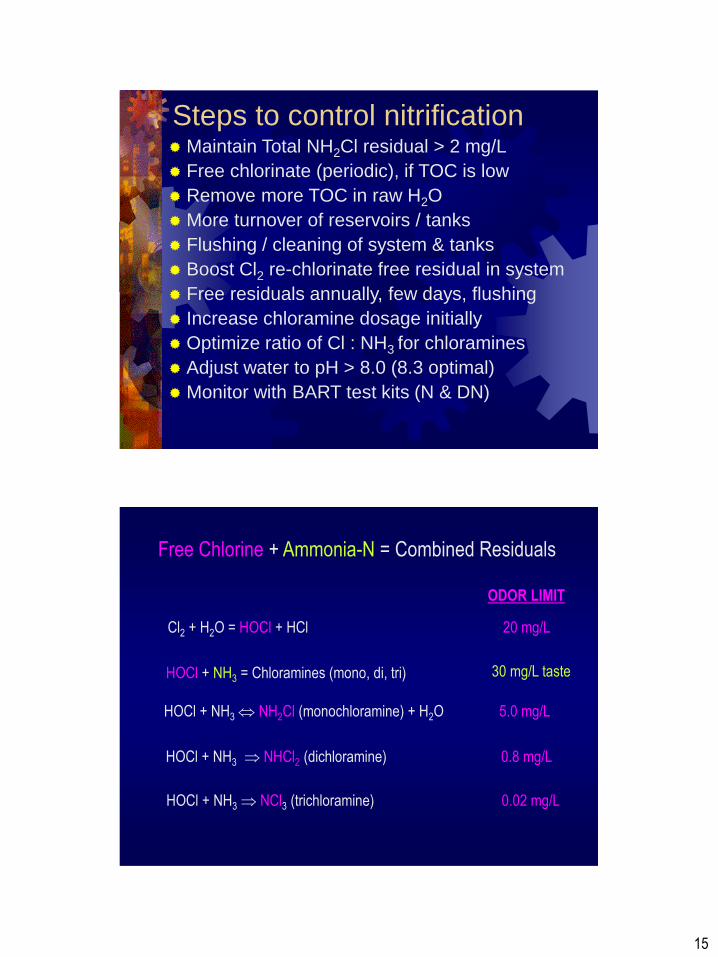
Steps to control nitrification Maintain Total NH2Cl residual > 2 mg/L
Free chlorinate (periodic), if TOC is low
Remove more TOC in raw H2O
More turnover of reservoirs / tanks
Flushing / cleaning of system & tanks
Boost Cl2 re-chlorinate free residual in system
Free residuals annually, few days, flushing
Increase chloramine dosage initially
Optimize ratio of Cl : NH3 for chloramines
Adjust water to pH > 8.0 (8.3 optimal)
Monitor with BART test kits (N & DN)
Free Chlorine + Ammonia-N = Combined Residuals
HOCl + NH3 = Chloramines (mono, di, tri)
Cl2 + H2O = HOCl + HCl 20 mg/L
HOCl + NH3 NH2Cl (monochloramine) + H2O 5.0 mg/L
HOCl + NH3 NHCl2 (dichloramine) 0.8 mg/L
HOCl + NH3 NCl3 (trichloramine) 0.02 mg/L
30 mg/L taste
ODOR LIMIT

16
Total
Ammonia
mg/L
Free
Chlorine
Residual
(85% of
total)
(5:1 Cl2 : NH3
Ratio)
Chlorine Dosage
(10:1 Cl2 : NH3-N
Ratio)
Breakpoint
Chlo
rine R
esid
ual
Trichloramine / THM’s
Free
Ammonia Combined
Chlorine
Breakpoint Chlorination-Chloramination Curve
Total Organic Carbon (TOC)
What are phantom residuals?
False positive results- NOT VALID
Observed in DPD free chorine analysis
Interference from chloramine residuals in the
water sample, while free not really present
“3 mg/L monochloramine will cause increase
of < 0.1 mg/L free chlorine reading” (per DPD
low range method 0-2 mg/L -Handbook)
Contradicted by the DPD high range 0-5 mg/L

17
Why do phantoms exist?
Natural ammonia in raw water is primary problem, often unrecognized
Monochloramine residuals ‘bleed over’ into the DPD free test results
As the water sample ages, the free chlorine DPD results drifts higher indicating nearly the same result as the total chlorine test
Monochloramine interference
during DPD free chlorine test

18
When do phantoms exist?
Chloramine interferes with the DPD free chlorine
reagents
Sample may turn faint pink to dark magenta
color (0.1-1.0+ mg/L) free chlorine.
Sample turns pink over time indicating a
phantom residual (seconds - minutes)
Free DPD analysis should be rejected if the
color drifts higher over time
Phantom 0-0.2 mg/L < 1 min.
Total DPD Phantom Free
19
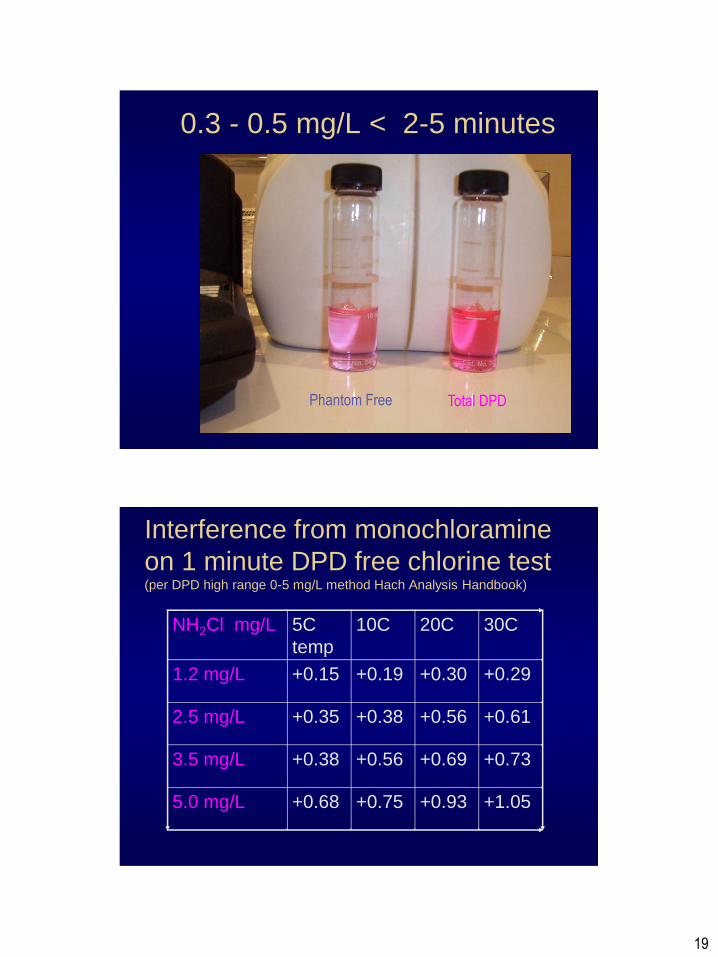
0.3 - 0.5 mg/L < 2-5 minutes
Total DPD Phantom Free
Interference from monochloramine
on 1 minute DPD free chlorine test (per DPD high range 0-5 mg/L method Hach Analysis Handbook)
NH2Cl mg/L 5C
temp
10C 20C 30C
1.2 mg/L +0.15 +0.19 +0.30 +0.29
2.5 mg/L +0.35 +0.38 +0.56 +0.61
3.5 mg/L +0.38 +0.56 +0.69 +0.73
5.0 mg/L +0.68 +0.75 +0.93 +1.05
20
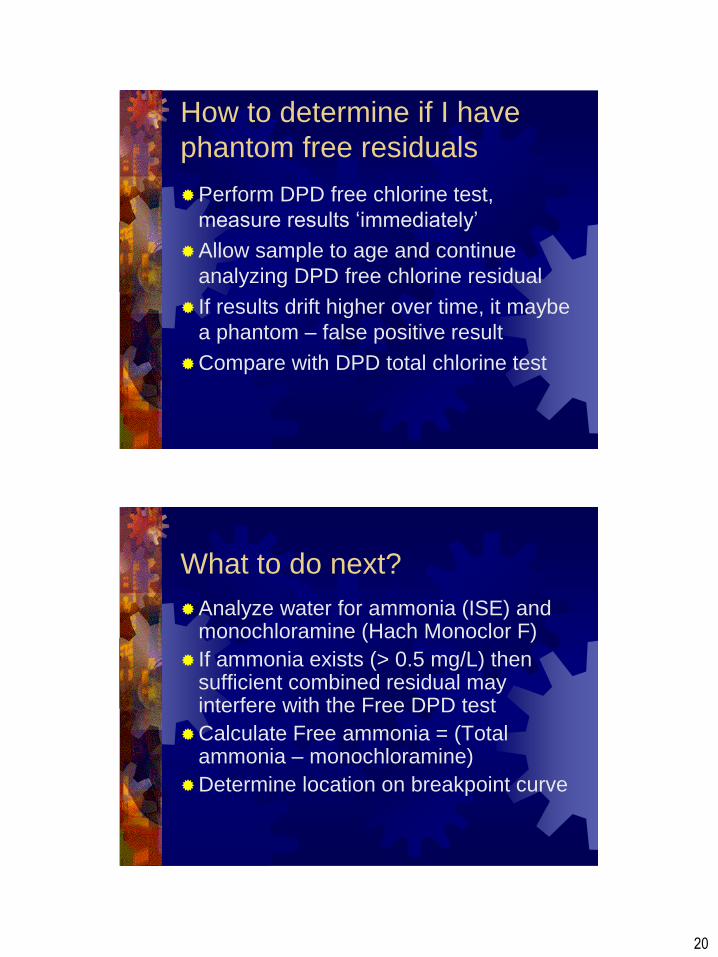
How to determine if I have
phantom free residuals
Perform DPD free chlorine test,
measure results ‘immediately’
Allow sample to age and continue
analyzing DPD free chlorine residual
If results drift higher over time, it maybe
a phantom – false positive result
Compare with DPD total chlorine test
What to do next?
Analyze water for ammonia (ISE) and monochloramine (Hach Monoclor F)
If ammonia exists (> 0.5 mg/L) then sufficient combined residual may interfere with the Free DPD test
Calculate Free ammonia = (Total ammonia – monochloramine)
Determine location on breakpoint curve
21
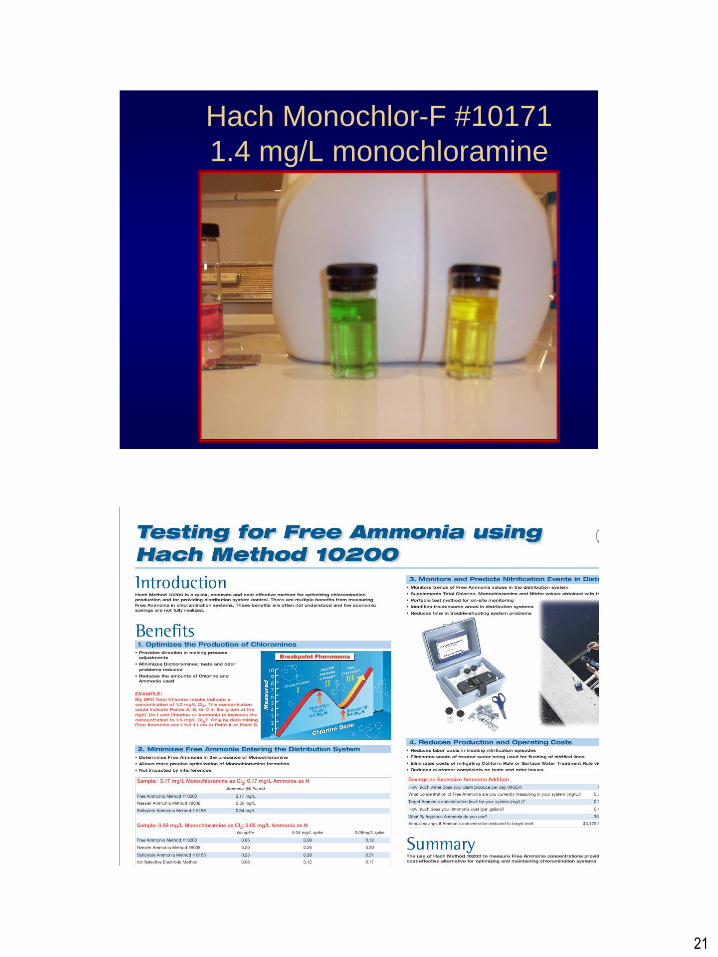
Hach Monochlor-F #10171
1.4 mg/L monochloramine

22
http://www.hach.com/DisinfectionSeries Chlorine Applications in Drinking Water Treatment
Discusses some common chlorine applications and monitoring points in drinking water
treatment that are often used for field testing and validating process instrumentation.
Chlorine Chemistry
Explains the chemistries of free and total chlorine and their relationships with pH.
Free vs. Total Chlorine
Defines free and total chlorine with an explanation of the differences in their use.
Introduction to Chloramination
Defines chloramines, discusses how they are produced and introduces test methods to
measure them.
Optimizing Monochloramine Production
Steps through the chlorine breakpoint curve. Understanding this theory will help you use test
results to optimize your process.
Dealing with Special Situations when Chloraminating
Explores special situations that often occur when chlorminating and suggests analytical
methods to help control these situations.
Measuring Free Chlorine in the presence of Manganese and Chloramines
Introduces the Hach exclusive FreeChlor F reagent and discusses how it can help facilities
to optimize and control their disinfection process.
Determining an Ammonium Feed Rate for Chloramination
How to determine the LAS feed rate based on chlorine feed rate and the measurement of
ammonia levels.
UV Methods for DBP Control and UV Disinfection
Discusses the difference between the UV/254 Transmission Method (UVT), commonly used
for UV disinfection control, and the UV/254 Absorbance Method (A254), which is a great tool
for control of disinfection by-products.
Hach Freechlor F reagent The indophenol method for free chlorine uses
Freechlor F Reagent Solution to rapidly convert the
free chlorine present into monochloramine. The
monochloramine formed is determined with
Monochlor F Reagent, which is specific for
monochloramine. The monochloramine reacts
directly with a substituted phenol contained in the
Monochlor F Reagent to form an intermediate
monoimine compound. This intermediate then
couples with additional excess substituted phenol to
form the green-colored indophenol. Manganese and
chlorinated organic amines do not react with the
substituted phenol and do not interfere in the free
chlorine determination. A Monochlor F sample blank
is used to compensate for any monochloramine
present in the original sample.
23
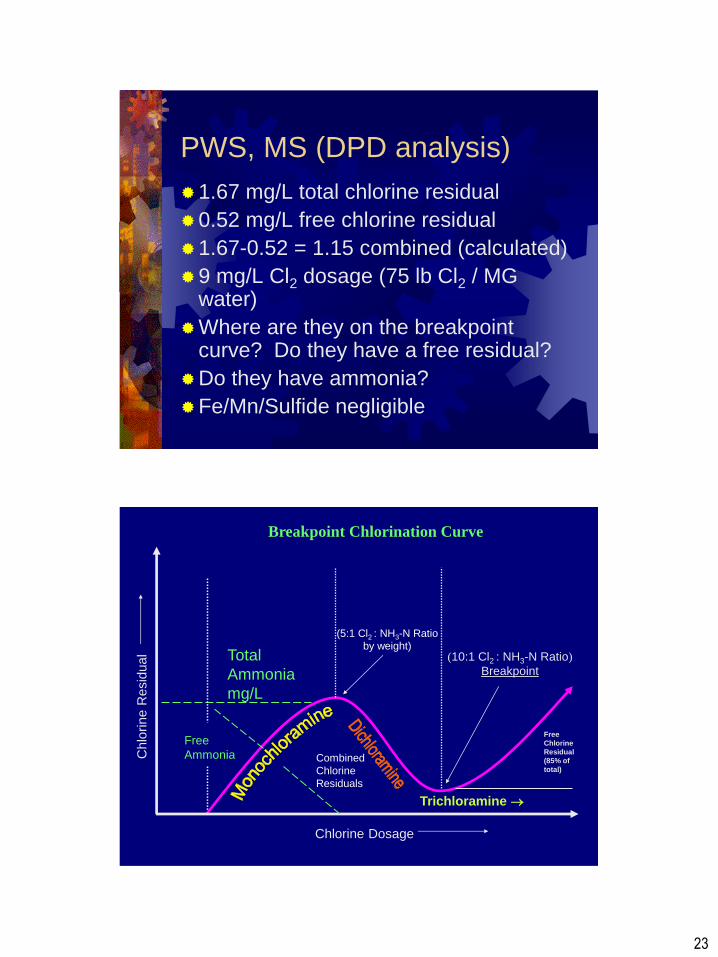
PWS, MS (DPD analysis)
1.67 mg/L total chlorine residual
0.52 mg/L free chlorine residual
1.67-0.52 = 1.15 combined (calculated)
9 mg/L Cl2 dosage (75 lb Cl2 / MG water)
Where are they on the breakpoint curve? Do they have a free residual?
Do they have ammonia?
Fe/Mn/Sulfide negligible
Total
Ammonia
mg/L
Free
Chlorine
Residual
(85% of
total)
(5:1 Cl2 : NH3-N Ratio
by weight)
Chlorine Dosage
(10:1 Cl2 : NH3-N Ratio)
Breakpoint
Chlo
rine R
esid
ual
Trichloramine
Free
Ammonia Combined
Chlorine
Residuals
Breakpoint Chlorination Curve
24
Sampling suggestions
Perform free chlorine test immediately
after adding DPD reagents
Minimize sample storage time
Use separate sample cells (free/total)
Do both tests (free/total) per quality
Record and plot results to isolate decay
rates and location of decomposition
Treatment steps to improve
system chlorine residuals
Remove Fe/Mn, organics, precursors
Sequester Fe/Mn with polyphosphate
Corrosion control keeps pipes cleaner and free of biofilm, byproducts, organics
Pre-oxidize with permanganate / ozone to destroy DBP precursors and demand
Pre-aerate to release hydrogen sulfide
Consider Chloramination (Cl2 + NH3-N)

25
Contact Information:
Phone: 815.389.0126
www.SponWater.com
Spon Water Consulting, LLC
PO Box 222
Roscoe, IL 61073