doctor of philosophy. - mcgill universitydigitool.library.mcgill.ca/thesisfile110494.pdf ·...
TRANSCRIPT

The role of pontomesencephalic cholinergic neurons and their
neighboring GABAergic and putative glutamatergic neurons in
modulating cortical activity and sleep-wake states
Soufiane Boucetta
Department of Neurology and Neurosurgery
Montreal Neurological Institute
McGill University
Montreal, February 2012
Supervisor
Barbara E. Jones, Ph.D.
A thesis submitted to the Faculty of Graduate and Postdoctoral Studies,
McGill University in partial fulfillment of the requirements of the degree of
Doctor of Philosophy.
© Soufiane Boucetta, 2012

TO:
- My sweet and lovely son Charafeddine and my faithful wife, who
inspire me with the passion of love and life,
- My mother, the best mom in the world, who inspires me with her
eternal kindness, love and moral support,
- My father and all members of my family,
- All my teachers, from my elementary school to my graduate studies,
- All my friends,
- The two best countries in the world, Algeria & Canada.
II
Abstract
Neurons within the brainstem pontomescencephalic tegmentum (PMT) are
suggested to play a critical role in influencing cortical activity and behavior across sleep-
wake states. Cholinergic neurons in the PMT form part of the ascending activating
system and are thought to participate in stimulating cortical activation during both waking
(W) and paradoxical sleep (PS). They are also suggested to trigger PS with muscle atonia
through their descending projections into the brainstem reticular formation. Yet in the
laterodorsal tegmental and pedunculopontine tegmental nuclei (LDT and PPT), they lie
intermingled with GABAergic and glutamatergic neurons, which could also modulate
cortical activity and sleep–wake states.
In the present work, by immunohistochemical identification of recorded and
labeled single cells in urethane-anesthetized and natural sleeping/waking rats, I described
the activity profiles of LDT and PPT cholinergic neurons, in addition to GABAergic and
putative glutamatergic neurons, first, under anesthesia in relation to cortical activity, and
second, during natural sleep-wake states in relation to state, cortical activity and muscle
tone.
In anesthetized rats, I found that all LDT/PPT cholinergic neurons increased their
discharge in association with cortical activation evoked by somatic stimulation. They
could thus function to stimulate this cortical activation. In contrast, LDT/PPT GABAergic
and putative glutamatergic neurons were heterogeneous: they could either increase or
decrease their discharge in relation to cortical activation. They could thus work
differently to stimulate cortical activation or to dampen behavioral arousal.
III
In natural sleeping/waking rats, I found that a cholinergic neuron was active
during both W and PS, as a W/PS-max active neuron. LDT/PPT Cholinergic neurons
could thus function to stimulate cortical activation during W and during PS, and trigger
motor inhibition and muscle atonia associated with PS. In contrast, LDT/PPT
GABAergic and putative glutamatergic neurons were heterogeneous in their sleep-wake
discharge profiles. Some were active during both W and PS and were considered as
W/PS-max active neurons. They could thus participate in stimulating cortical activation
during both W and PS. Others were maximally active during PS, as PS-max active
neurons, and could thus participate in dampening behavioral arousal and muscle tone
during PS. Some putative glutamatergic neurons were maximally active during W, as W-
max active neurons, and could thus participate in stimulating behavioral arousal with
muscle tone during wakefulness.
Together, these findings indicate that different LDT/PPT neurons are working in
coordination to either mediate cortical activation during W and PS, to dampen behavioral
arousal and muscle tone during PS or to stimulate behavioral arousal and muscle tone
during wakefulness.
IV

Résumé Les neurones situés dans le tronc cérébral au niveau du pontomescencephalic
tegmentum (PMT) ont été suggérés de jouer un role critique pour influencer l’activité
corticale et comportementale durant les états de veille et de sommeil ou états, dits, de
vigilance. Les neurones cholinergiques dans le PMT font partie du système d'activation
ascendant qui contribue à la genèse de l'activation corticale durant l’éveil (E) et le
sommeil paradoxal (SP). Ils sont aussi suggérés promouvoir l’état de SP accompagné
d’atonie musculaire via leurs projections descendantes vers la formation réticulaire du
tronc cérébral. Dans les noyaux laterodorsal tegmentale et pédonculopontin tegmentale
(LDT et PPT), ces neurones cholinergiques sont entremêlés avec d’autres neurones
GABAergiques et glutamatergiques, qui peuvent à leur tour contribuer à la modulation de
l'activité corticale et donc aux états de vigilance.
Dans le présent travail, des cellules ont été enregistrées, marquées et identifiées
immunohistochimiquement comme des neurones cholinergiques, GABAergiques ou
présumés glutamatergiques dans le LDT et le PPT chez des rats anesthésiés à l’uréthane
et chez des rats qui dorment et se réveillent naturellement. Premièrement, sous
anesthésie, nous avons déterminé l’activité de ces neurones en relation avec l’activation
corticale. Deuxièmement, à travers les différents états de veille et de sommeil, nous
avons déterminé l’activité de ces neurones en relation avec ces états de veille et de
sommeil, les activités corticales pertinentes caractérisant ces états et le tonus musculaire.
Chez les rats anesthésiés, j’ai constaté que tous les neurones cholinergiques du
LDT / PPT augmentaient leur décharge en association avec l'activation corticale évoquée
par une stimulation somatique. Ils pourraient donc participer à cette activation corticale.
V
Les neurones GABAergiques et les neurons présumés glutamatergiques, quant a eux,
étaient hétérogènes. Soit, ils augmentaient ou ils diminuaient leur décharge en relation
avec l'activation corticale. Ils pourraient ainsi contribuer différemment soit pour stimuler
l'activation corticale ou au contraire freiner l’éveil comportemental.
Chez des rats qui dorment et se réveillent naturellement, j’ai constaté qu’un
neurone cholinergique est actif au cours des deux états de vigilance l’éveil et SP, il est
considéré comme étant un neurone E/SP-max. Les neurones cholinergiques de LDT/PPT
pourraient ainsi stimuler l'activation corticale lors de l’éveil et du SP, comme ils
pourraient également promouvoir l'inhibition motrice et l’induction de l’atonie
musculaire associée au SP. En revanche, les neurons GABAergiques et les neurones
présumés glutamatergiques du LDT/PPT sont hétérogènes dans leurs profils de décharge.
Certains, sont actifs pendant l’éveil et le SP, comme étant des neurones E/SP-max.
Comme pour les neurones cholinergiques, ils pourraient également stimuler l'activation
corticale au cours de l’éveil et du SP. D'autres, sont actifs au maximum pendant le SP,
comme étant des neurones SP-max. Ils pourraient éventuellement participer à freiner
l’éveil comportemental ainsi que le tonus musculaire au cours du SP. Quelques neurones
présumés glutamatergiques sont actifs au maximum pendant l’éveil. Ils pourraient
participer à stimuler l’éveil comportemental ainsi que le tonus musculaire au cours de
l’éveil.
L’ensemble de ces travaux montre que les différents neurones du LDT/PPT
travaillent en coordination pour soit influencer l'activation corticale pendant l’éveil et le
SP, soit freiner l’éveil comportemental et le tonus musculaire au cours du SP ou au
contraire stimuler l’éveil comportemental et le tonus musculaire au cours de l’éveil.
VI
Acknowledgments
Throughout my graduate studies at McGill University, I have had the privilege of
the company, support and friendship of a number of individuals.
I would first like to express my deepest gratitude to my exceptional supervisor,
Dr. Barbara Jones, for her kind, coherent, patient, continuous and fruitful guidance over
the years I spent in her laboratory. I must also commend her professionalism, attention to
detail and pedagogical acumen. I would like to thank her for being such an exceptional
example of modesty and scientific integrity. I am indeed proud to work with her and be a
part of her team.
I must also convey my gratitude to all my colleagues in the lab and the university
with whom I worked in harmony and respect all these years. First, to Lynda Mainville for
her great immunohistochemical work, patience, help and advice. To Naomi Takeda. She
was so helpful for me in so many professional and personal ways that are difficult to
enumerate. To Oum Kaltoum Hassani, I must thank her for her best teaching, insights,
assistance, advice and correcting my scientific writing. To Chris Cordova, for his great
help in data analysis and his editorial help. To Frederic Brischoux for his consultation in
neuroanatomy. To Denise Slavinski for her editorial assistance and help. To all other
colleagues: Youssouf Cissé, Pablo Henny, Mandana Modirrousta, Ester Del Cid Pellitero,
Thomas Stroh, Hani Amin, Amar Bahindi and Mann Gee Lee.
I would like to thank Dr. Edward Ruthazer and Dr. Christopher Pack for agreeing
to be on my thesis advisory committee.
VII

Note to reviewers
The present thesis is a chapter-based thesis. The work contained in this thesis is
comprised of two experimental projects. The first one, "Characterization of the activity
profiles of LDT/PPT neurons in anesthetized rats" has already been published as the
following citation: "Boucetta S, Jones BE (2009) Activity profiles of cholinergic and
intermingle GABAergic and putative glutamatergic neurons in the pontomesencephalic
tegmentum of urethane-anesthetized rats. J Neurosci 29: 4664-4674". The second one,
"Characterization of the activity profiles of LDT/PPT neurons during natural sleep-wake
states" is still an ongoing project that will be published in the near future.
As a first author in the published manuscript, I obtained authorization to include
part of its original text in the present thesis.
VIII
Contribution of authors
As a principal investigator of the two projects presented in this thesis, I performed
all the electrophysiological experiments and analysis including the surgery, the
implantation and the habituation of rats, recording and labeling of cells and fixation of the
brains, as well as data and statistical analysis and the production of the figures and the
tables. Experimental and analytical design was planned with the guidance of Dr. Barbara
E. Jones.
Lynda Mainville, the laboratory technician, performed the immunohistochemical
staining of the brain tissue with the labeled cells. I performed the microscopic
examination with image acquisition and analysis for data collection and neuroanatomical
mapping.
I wrote the published manuscript that was later edited by Dr. Jones to be adequate
for publication.
IX
Table of contents
Abstract………………………………………………………………………………… III
Résumé……………………………………………………………………………......... V
Acknowledgements…………………………………………………………………….. VII
Note to reviewers…………………………………………………………………......... VIII
Contribution of authors……………………………………………………………….. IX
Table of Contents……………………………………………………………………… X
List of Abbreviations………………………………………………………………….. XIV
1. Chapter One: Introduction………………………………………………………… 1
1.1 Background information……………………………………………………...... 2
1.1.1 Sleep-wake states………………………………………………………...... 2
1.1.2 The reticular activating system………………………………………....... 3
1.1.3 Neuronal components of the reticular activating system……………….. 6
1.1.4 Anatomy and physiology of the LDT/PPT nuclei……………………….. 10
1.1.4.1 LDT/PPT cholinergic neurons……………………………………. 10
1.1.4.2 LDT/PPT GABAergic neurons…………………………………… 18
1.1.4.3 LDT/PPT glutamatergic neurons………………………………… 20
1.2 Figure 1.1……………………………………………………………………........ 22
1.3 Considerations and Objectives…………………………………………………. 25
2. Chapter Two: Materials and Methods…………………………………………….. 28
2.1 The activity profiles of LDT/PPT neurons in anesthetized rats……..….......... 29
X
2.1.1 Animals and surgery…………………………………………………..... 29
2.1.2 Unit recording and labeling…………………………………………..... 29
2.1.3 Histochemistry………………………………………………………….. 30
2.1.4 Data analysis…………………………………………………………….. 31
2.2 The activity profiles of LDT/PPT neurons during natural sleep-wake
states……………………………………………………………………………......... 33
2.2.1 Surgery and habituation to head-fixation…………………………….. 33
2.2.2 Unit recording and labeling……………………………………………. 34
2.2.3 Histochemistry………………………………………………………….. 35
2.2.4 Data analysis…………………………………………………………….. 37
3. Chapter Three: The activity profiles of LDT/PPT neurons in anesthetized
rats…………………………………………………………………………………… 40
3.1 Preface ………………………………………………………………………… 41
3.2 Results…………………………………………………………………………. 42
3.2.1 Cholinergic (Nb+/VAChT+) neurons………………………………….. 44
3.2.2 GABAergic (Nb+/GAD+) neurons ……………………………………. 46
3.2.2.1 GABAergic On neurons ……………………………………….. 46
3.2.2.2 GABAergic Off neurons ……………………………………….. 47
3.2.3 Non-cholinergic/non-GABAergic (Nb+/VAChT-/GAD-) neurons…... 48
3.2.3.1 Non-cholinergic/non-GABAergic On neurons………………... 48
3.2.3.2 Non-cholinergic/non-GABAergic Off neurons………………... 49
XI

3.3 Tables and Figures……………………………………………………………. 51
4. Chapter Four: The activity profiles of LDT/PPT neurons during natural
sleep-wake states……………………………………………………………………. 81
4.1 Preface ………………………………………………………………………... 82
4.2 Results…………………………………………………………………………. 83
4.2.1 Identification, localization and classification of cell groups…………. 83
4.2.2 W/PS-max active neurons……………………………………………… 84
4.2.2.1 Nb+/VAChT+ neuron…………………………………………... 85
4.2.2.2 Nb+/GAD+ neurons…………………………………………….. 85
4.2.2.3 Nb+/VAChT-/GAD- neurons…………………………………... 86
4.2.3 PS-max active neurons…………………………………………………. 87
4.2.3.1 Nb+/GAD+ neurons…………………………………………….. 87
4.2.3.2 Nb+/VAChT-/GAD- neurons…………………………………... 88
4.2.4 W-max active neurons………………………………………………….. 88
4.3 Tables and Figures……………………………………………………………. 90
5. Chapter Five: Discussion………………………………………………………... 111
5.1 The activity profiles of LDT/PPT neurons in anesthetized rats…………… 112
5.1.1 Cholinergic neurons…………………………………………………….. 113
5.1.2 GABAergic neurons………………………………………….................. 115
5.1.3 Putative glutamatergic neurons………………………………………... 116
XII

5.2 The activity profiles of LDT/PPT neurons during natural sleep-wake
States………………………………………………………………………………… 119
5.2.1 Cholinergic neurons…………………………………………………….. 122
5.2.2 GABAergic neurons………………………………………….................. 127
5.2.2.1. GABAergic W/PS-max neurons………………………………. 127
5.2.2.2. GABAergic PS-max neurons …………………......................... 128
5.2.3 Putative glutamatergic neurons………………………………………... 129
5.2.3.1. Putative glutamatergic W/PS-max neurons………………….. 130
5.2.3.2. Putative glutamatergic PS-max neurons …………………….. 130
5.2.3.3. Putative glutamatergic W-max neurons ………………........... 131
5.3 Figure 5.1……………………………………………………………………… 133
5.4 General Conclusion…………………………………………………………... 136
6. References………………………………………………………………………… 138
XIII

List of Abbreviations ACh Acetylcholine
CAs Catecholamines
CG Central gray
CNS Central nervous system
DA Dopamine
DMT Dorsomedial tegmental nucleus
DpMe Deep mesencephalic reticular nucleus
DR Dorsal raphe nucleus
EEG Electroencephalogram
EMG Electromyogram
GABA Gamma-aminobutyric acid
GAD Glutamic acid decarboxylase
GiA Gigantocellular reticular nucleus, pars alpha
GiRF Gigantocellular reticular formation nucleus
GiV Gigantocellular reticular nucleus, pars ventralis
LC Locus coeruleus
LDT Laterodorsal tegmental nucleus
MAs Monoamines
NA Noradrenaline
Orx Orexin
XIV
PMT Pontomescencephalic tegmentum
PnC Pontine reticular nucleus, caudal part
PnO Pontine reticular nucleus, oral part
PPT Pedunculopontine tegmental nucleus
lPPT Lateral pedunculopontine tegmental nucleus
mPPT Medial pedunculopontine tegmental nucleus
PS Paradoxical sleep
RF Reticular formation
SN Substantia Nigra
5-HT Serotonin
SubC Subcoeruleus
SubLDT Sublaterodorsal tegmental nucleus
SWS Slow wave sleep
VAChT Vesicular transporter protein for acetylcholine
VGluT2 Vesicular glutamate transporter 2
VTA Ventral tegmental area
W Wakefulness, waking
XV

“Allah takes the souls at the time of their death, and those that do not
die [He takes] during their sleep. Then He keeps those for which He has
decreed death and releases the others for a specified term. Indeed in
that are signs for a people who give thought’’.
(The Holy Quran, Surat Az-Zumar, quran.com/39:42)
XVI
The role of pontomesencephalic cholinergic neurons and their
neighboring GABAergic and putative glutamatergic neurons in
modulating cortical activity and sleep-wake states
1
1. Chapter One
Introduction
2
1.1 Background information
1.1.1 Sleep-wake states
Since the discovery of the electroencephalogram (EEG) in the early twentieth
century, neurophysiologists such as Berger and Loomis remarked that recorded EEG
signals from the brain showed specific patterns across different behavioral states (Loomis
et al., 1935a; Haas, 2003). Wakefulness (waking; W) was marked by low voltage and
fast EEG activity, whereas sleep was marked by high voltage spindles and slow EEG
activity (Loomis et al., 1935b). In the 1950s, researchers had found that sleep is, in fact,
composed by two distinct states: slow-wave sleep (SWS) and paradoxical sleep (PS)
(Aserinsky and Kleitman, 1953; Jouvet et al., 1959). There are thus, in most mammals,
three distinctive and unique behavioral states: W, SWS and PS. W is characterized by a
relatively low sensory threshold, high muscle tone and an activated EEG. SWS (also
known as non-rapid eye movement (NREM) sleep) is distinguished by behavioral
inactivity, higher sensory threshold, lower muscle tone and an irregular slow EEG
activity. Finally, PS (also called rapid eye movement sleep, REM) is characterized by an
even higher sensory threshold, rapid eye movements, a minimal muscle tone (or atonia)
and an activated EEG, "paradoxically" similar to W. It is during this state that dreaming
is considered to occur (Dement and Kleitman, 1957). These states alternate in an
ultradian rhythm (more than one per day) to form the sleep-wake cycle. Many neuronal
systems in the brain work together to orchestrate this cycle (Fig. 1.1; for review see
(Jones, 2005)).
Over the years, immense research work has been realized to understand how can
the brain generat these different behavioral states. Initial studies, which used lesion and
3
electrical stimulation techniques, made eveident the importance of the brainstem for the
generation of cortical activation and wakefulness (Lindsley et al., 1949; Moruzzi and
Magoun, 1949; Lindsley et al., 1950). Later, with the development of techniques in
neurochemistry and immunohistochemistry, researchers further explored the chemical
identity of the neural systems involved in regulating sleep-wake states. Thus, different
neurotransmitters and neurochemical pathways were suggested to be differentially
involved in the generation of the sleep-wake states (Jones, 1989). Recording from a
single cell across the sleep-wake cycle is another used technique to demonstrate that
certain cells in certain brain areas exibite specific firing patterns across the sleep-wake
cycle (McGinty et al., 1974; Steriade and Hobson, 1976; Steriade et al., 1982; Steriade et
al., 1990a; Datta, 1995; McCarley et al., 1995; Koyama et al., 2003; Lee et al., 2005b;
Lee et al., 2005a). Furthermore, diffrents neuronal populations are interconnected and
receive input from specific neurotransmitter systems that could thus neurochemically
modulate their firing characteristics across the sleep-wake cycle (Jones, 2008).
1.1.2 The reticular activating system
In the 1930s, by transections of the brainstem, Bremer showed that separation of
the cerebrum (cerveau isolé) from the brainstem and spinal cord resulted in SWS-like
patterns in the EEG, whereas separation of the encephalon (encéphale isolé) from the
spinal cord did not affect the activity of the waking state (Steriade, 2003). Bremer
suggested then that an important cortical activating mechanism might be located in the
brainstem between the medulla and midbrain (Steriade, 2003). Later on, Moruzzi and
Magoun showed that electrical stimulation of the brainstem reticular formation (a large
network of neurons and fibers located in the brainstem), evoked diffuse and long lasting

4
cortical activation in sleeping and anesthetized cats (Moruzzi and Magoun, 1949). They
then hypothesized that the reticular formation is the key structure to activate the cortex.
Moreover, lesions of the reticular formation induced cortical slow-wave activity in
association with motor immobility in cats (Lindsley et al., 1949; Lindsley et al., 1950),
which supports the hypothesis of Moruzzi and Magoun that the reticular formation is
critical for cortical activation.
The reticular formation influences the sleep-wake states by modulating both
ascending and descending neuronal systems (Fig. 1.1).
Reticular neurons receive input from sensory systems and passing fibers in the
brainstem; they send in turn both long ascending and descending fibers (Jones, 1995).
They send their ascending fibers into the forebrain via two pathways, the dorsal pathway
(also called thalamic) that terminates in the non-specific nuclei of the thalamus and the
ventral pathway (also called extra-thalamic) that terminates in the hypothalamus,
subthalamus and basal forebrain (Nauta and Kuypers, 1958; Scheibel and Scheibel, 1958;
Jones and Yang, 1985). Electrical stimulation of the brainstem reticular formation
evoked desynchronization of EEG and cortical activation in sleeping and anesthetized
animals (Moruzzi and Magoun, 1949). Therefore, the brainstem reticular formation is
suggested to be the elemental generator of cortical activation and as a potential generator
of waking, which established the concept of the "ascending reticular activating system"
(Jones, 1990a). Some of reticular neurons, particularly those located in the caudal
pontine and the medullary reticular formations could also, via their descending
projections to lower brainstem and the spinal cord (Jones and Yang, 1985), stimulate
muscle tone and movement during waking (Siegel and McGinty, 1977; Siegel, 1979).
5
Much evidence suggested that reticular neurons were the most critical for the
generation of PS and its two most prominent characteristics, the EEG characteristic of
cortical activation and the behavioral characteristic of immobility with postural muscle
atonia (Steriade and Hobson, 1976; Jones, 1991c). Via their ascending projections
through the dorsal, thalamic as well as the ventral, extrathalamic relay systems to the
cerebral cortex, rostral (oral pontine and mesencephalic) reticular neurons could stimulate
cortical activation that is associated with PS (Fig. 1.1). Indeed transections rostral to the
pons eliminated tonic cortical activation as well as phasic manifestations of PS but not
muscle atonia (Jouvet, 1962). Via their descending projections, pontomedullary reticular
neurons are considered to be critical in the generation of muscle atonia that is associated
with PS (Jones, 1991c). Stimulation of the brainstem reticular formation produced a
generalized motor inhibition (Magoun and Rhines, 1946; Chase et al., 1986).
Transections caudal to the pons eliminated muscle atonia associated with PS (Jouvet,
1962; Webster et al., 1986), suggesting the presence of neurons in the pons, which are
critical for muscle atonia. Indeed, early lesion studies in cats indicated the importance of
the oral pontine reticular formation (PnO) for the generation of PS and muscle atonia
(Carli and Zanchetti, 1965). Subsequent lesion studies also indicated the importance of
the tegmentum lateral to the PnO and ventral to the locus coeruleus nucleus (LC), referred
to by Sakai and colleagues as the peri- LC-alpha in the cat (Sakai et al., 1979) and here as
the Subcoeruleus area (SubC). More recently in rats this region was termed the
sublaterodorsal nucleus (Boissard et al., 2002; Lu et al., 2006), though referring to an area
in the rat located caudal to the subLDT, where cholinergic neurons are located in
continuity with those in the LDT. From lesion studies in both cat and rat, it appears thus
that the PnO and SubC regions collectively represent a PS effector zone (Jones, 2004).
6
Indeed, injection of the cholinergic agonist, carbachol into this zone produces a state
closely resembling PS, as marked by muscle atonia in association with cortical activation
and theta activity in the hippocampus (George et al., 1964; Baxter, 1969; Mitler and
Dement, 1974; Amatruda et al., 1975; Vertes and Kocsis, 1997). Moreover, neurons
located in the SubC were found to discharge in relation to muscle atonia (Sakai et al.,
1981). These putative glutamatergic neurons project to the ventral medullary
gigantocellular reticular nucleus (GiV) (Sakai et al., 1979). Furthermore, neurons in GiV
were found to discharge with muscle atonia (Kanamori et al., 1980; Siegel et al., 1991)
and to project to the spinal cord (Holmes and Jones, 1994). In the same region, c-Fos
studies showed that GABAergic/glycinergic neurons are active during PS (Maloney et al.,
2000; Sapin et al., 2009). Therefore, it is probable that the PS-active neurons of the PS
effector zone stimulate the GiV GABAergic/glycinergic neurons, which in turn provide a
descending inhibitory influence to the spinal motoneurons that result in the induction of
the behavioral characteristic of PS, muscle atonia (Fig. 1.1). Based upon results from
lesion studies, it is also likely that some glutamatergic neurons in the pontine RF project
directly to the spinal cord to excite GABA/glycinergic neurons located there (Holmes and
Jones, 1994; Krenzer et al., 2011).
1.1.3 Neuronal components of the reticular activating system
Pontomesencephalic cholinergic neurons
Many studies of vigilance and behavioral state control were directed toward
identifying and characterizing the neurons of the ascending reticular activating system,
particularly those that should be responsible for cortical activation during both waking
and PS on one hand and triggering PS on the other hand (Jones, 1990a). Although many

7
candidates have been suggested over the years, attention focused early upon cholinergic
neurons which were later identified immunohistochemically and localized to the
laterodorsal and pedunculopontine tegmental (LDT and PPT) nuclei (Steriade et al.,
1990a; Jones, 1993; Steriade, 2004). Since pontomesencephalic cholinergic neurons are
one of the principal candidates to be investigated in the present thesis, I will detail them
in subsequent sections of this chapter.
Monoaminergic neurons
Monoaminergic neurons include noradrenergic, dopaminergic and serotonergic
neurons. They are considered to be part of the arousal system (Jones, 2003). The
reduction of Catecholamines (CAs; noradrenaline and dopamine) by Alpha-methyl-para-
tyrosine (AMPT) or Reserpine decreases cortical activation and behavioral arousal and
has a tranquilizing effect (Keane et al., 1976). Whereas, the enhacement of CAs by the
dopamine precursor L-DOPA or Cocaine results in an increase of cortical activation along
with behavioral arousal, insomnia and a decrease in PS (Jones, 1972; Keane et al., 1976;
Hernandez-Lopez et al., 1996; Johanson et al., 1999). Electrophysiological study showed
that noradrenergic neurons, which are located in the LC, discharged maximally during
waking and ceased firing during PS (Aston-Jones and Bloom, 1981). Moreover,
pharmacological administration of noradrenaline (NA) in the basal forebrain cholinergic
cell area increased high frequency, gamma EEG activity and prolonged the waking period
(Cape and Jones, 1998). The serotonergic neurons, located in the dorsal raphe nucleus
(DR), were also found to be active during waking and silent during sleep (McGinty and
Harper, 1976b; Trulson and Jacobs, 1979). Moreover, the release of serotonin (5-HT)
was found to be high during waking compared to SWS and PS (Wilkinson et al., 1991;
8
Portas et al., 1998). The dopaminergic neurons, located in the ventral tegmental area
(VTA) and the substansia nigra (SN), were found to discharge in bursts during waking in
association with reward (Mirenowicz and Schultz, 1996). Moreover, the release of
dopamine (DA) was found to be high during waking in rewarding conditions (Di Chiara
and Imperato, 1988; Richardson and Gratton, 1996). Lesions of the dopaminergic cell
area, the ventral mesencephalic tegmentum, resulted in the diminution of fast EEG
activity and attentive behavior (Montaron et al., 1982), as well as "akinesia" and
"aphagia" (Ungerstedt, 1971; Jones et al., 1973).
Monoaminergic neurons are also suggested to be "permissive" for PS. (Hobson et
al., 1975). Monoaminergic neurons are suggested to block cholinergic transmission to
prevent PS (Hobson et al., 1975). Indeed, the injection of the acetylcholinesterase
inhibitor physostigmine (eserine) elicited a PS-like state only after depletion of MAs with
reserpine (Karczmar et al., 1970). Moreover, the increase of monoamines (MAs) levels
by monoamine oxidase inhibitors eliminated PS and its phasic characteristic, ponto-
geniculo-occipital (PGO) spikes for long periods (Jones, 1972; Jouvet, 1972).
Hence, monoaminergic neurons appear to contribute to the mechanisms associated
with behavioral arousal and cortical activation and appear to antagonize mechanisms
associated with sleep induction including PS with muscle atonia (Jones, 1991b, 2003).
Reticular formation neurons
The reticular formation, which is formed by a large network of neurons and fibers,
is located through the central core of the brainstem (from the medulla to the midbrain).
The neurons of the reticular formation receive afferents from different sources passing
through the brainstem, including ascending somatosensory, visual, auditory and vestibular
9
input, and cortical descending output (Jones, 2003). In turn, reticular neurons form a
large contingent of the ascending reticular activating system that send ascending fibers to
the forebrain (Jones, 1990a). They also send descending projections down to the spinal
cord (Jones, 1995). Although the reticular formation forms a large network of neurons
and fibers through the entire core of the brainstem, there is a degree of differentiation.
The major population of neurons which form the ascending pathways to the forebrain and
are responsible for cortical activation are concentrated in the mesencephalic and oral
pontine reticular fields (Jones, 1990a). The major population of neurons which form the
descending pathways to lower brainstem and spinal cord are concentrated in the caudal
pontine and the medullary reticular formation (Jones and Yang, 1985). These reticulo-
spinal neurons are suggested to stimulate muscle tone and behavioral arousal during
waking (Fig. 1.1; Siegel and McGinty, 1977; Siegel, 1979) or to dampen behavioral
arousal during sleep and induce muscle atonia during PS (Magoun and Rhines, 1946;
Kanamori et al., 1980; Siegel et al., 1991).
As discovered recently, the majority of reticular neurons utilize glutamate as a
neurotransmitter (Kaneko et al., 1989; Jones, 1995). A small portion of the reticular
neurons use GABA as neurotransmitter and are mainly considered to be locally projecting
neurons (Holmes et al., 1994; Ford et al., 1995; Jones, 1995). However, some of these
GABAergic neurons are found to be long projecting neurons, particularly the
pontomesencephalic GABAergic neurons that send long ascending projections to the
forebrain (Ford et al., 1995) or medullary GABAergic neurons that send long descending
projections to the spinal cord (Jones et al., 1991; Holmes et al., 1994). Thus, as locally
projecting or long projecting, the GABAergic neurons could serve to inhibit
glutamatergic or other neurons of the activating and arousing systems. Many anesthetic
10
agents work either by blocking glutamatergic transmission or by enhancing GABAergic
transmission (Schulz and Macdonald, 1981; Yamamura et al., 1990; Maclver et al., 1996).
Reticular glutamatergic and GABAergic systems could thus respectively work to
stimulate or to dampen cortical activation and behavioral arousal.
1.1.4 Anatomy and physiology of the LDT/PPT nuclei
LDT and PPT nuclei are located at the level of the oral pons and caudal
mesencephalon in the region called the pontomesencephalic tegmentum. These nuclei
were found to contain the major group of brainstem cholinergic neurons which were
suspected to be involved in controlling sleep-wake states (Jones, 1993). However, the
cholinergic neurons are not alone in these nuclei; they lie intermingled with other
GABAergic and glutamatergic neurons which are actually more numerous than
cholinergic neurons (Ford et al., 1995; Wang and Morales, 2009).
1.1.4.1 LDT/PPT cholinergic neurons
Anatomy
In the early 1940s, it was suggested that acetylcholine (ACh) is synthesized within
distinct neurons in the brain (MacIntosh, 1941; Feldberg and Vogt, 1948). In the 1950s,
with the development of the histochemical technique to detect acetylcholinesterase
(AChE), the catabolic enzyme for ACh, distinct populations of neurons were found to
contain AChE and thus thought likely to be cholinergic (Koelle, 1951). A considerable
number of neurons located in the brainstem reticular formation were subsequently found
to contain AChE (Shute and Lewis, 1963). Surprisingly, the origin and the projections of
these neurons corresponded closely to the ascending reticular activating system that had

11
been previously described by Moruzzi, Magoun and their collegues (Moruzzi and
Magoun, 1949; Starzl et al., 1951). Nevertheless, the presence of AChE in these neurons
did not with any certainty indicate that they synthesized and released ACh (Fibiger, 1982;
Butcher and Woolf, 1984). Later in the 1980s, with the development of
immunohistochemistry for the synthetic enzyme of ACh, choline acetyl transferase
(ChAT), the indisputable evidence for the identity and location of cholinergic neurons in
the brain was brought forward (Sofroniew et al., 1985; Woolf and Butcher, 1986;
Hallanger et al., 1987; Jones and Beaudet, 1987; Jones and Webster, 1988; Pare et al.,
1988; Steriade et al., 1988). In the brainstem, the largest group of cholinergic neurons
that project rostrally was found in the pontomesencephalic tegmentum within the LDT
and PPT nuclei (Armstrong et al., 1983; Houser et al., 1983; Mesulam et al., 1983; Satoh
et al., 1983; Mesulam et al., 1984; Jones and Beaudet, 1987). Recently, proof of the
uptake, storage and release of specific neurotransmitters from nerve terminals has also
become possible by immunohistochemical staining for specific vesicular transporter
proteins, including notably that for ACh (VAChT; (Gilmor et al., 1996)). VAChT can be
revealed in the soma as well as the terminals of cholinergic neurons in the LDT and PPT
(Garzon and Pickel, 2000).
LDT/PPT cholinergic neurons receive input from neurons of the brainstem
reticular formation and from the noradrenergic LC neurons (Jones, 1990b). In turn,
cholinergic neurons send ascending and descending projections, as well as local
ramifications to target some surrounding neurons particularly those of the reticular
formation. For the ascending projections, cholinergic neurons project rostrally, in parallel
with other reticular neurons, through two pathways, the dorsal or thalamic pathway and
the ventral or extra-thalamic pathway. Via the dorsal pathway, of which they represent an
12
important contingent, they provide a rich innervation to the nuclei of the non-specific
thalamo-cortical projection system (Sofroniew et al., 1985; Woolf and Butcher, 1986;
Hallanger et al., 1987; Jones and Webster, 1988; Pare et al., 1988; Steriade et al., 1988).
Via the ventral pathway, which is less dense than the dorsal pathway, they send fibers up
to and through the lateral hypothalamus and into the basal forebrain (Woolf and Butcher,
1986). They would also influence other reticular neurons that send ascending projections
via the dorsal, thalamic as well as the ventral, extrathalamic relay systems to the cerebral
cortex (Jones and Webster, 1988; Jones, 1990b). For the descending projections,
cholinergic neurons send projections to the PnO and SubC (Mitani et al., 1988; Jones,
1990b; Semba et al., 1990). Cholinergic neurons project also to reticulospinal neurons in
the medulla (Jones, 1990b) as well as to motor neurons in the brainstem (Rukhadze and
Kubin, 2007).
Physiology
Increasing evidence suggests the involvement of LDT/PPT cholinergic neurons in
modulating sleep-wake states particularly by driving cortical activation and triggering PS.
A first functional role postulated for LDT/PPT cholinergic neurons is driving
cortical activation during both waking and PS (Fig. 1.1). Moruzzi and Magoun had found
that electrical stimulation of the pontomesencephalic tegmental region elicits EEG
desynchronization (Moruzzi and Magoun, 1949). Given their location, the LDT/PPT
cholinergic neurons were suspected to drive cortical activation and EEG
desynchronization (Shute and Lewis, 1967; Jones and Beaudet, 1987; Vincent and Reiner,
1987). electrical stimulation of the LDT/PPT elicits cortical activation, while exciting
thalamic neurons (Steriade et al., 1991). In vivo recordings of neurons with broad spikes

13
and presumed (but not identified) LDT/PPT cholinergic neurons have shown that these
cells fire tonically at low to moderate rates during wakefulness and PS, as W/PS-active
cells (Sakai, 1985; El Mansari et al., 1989; Steriade et al., 1990a; Kayama et al., 1992).
The increased firing of these neurons was positively correlated with cortical activation on
the EEG (Steriade et al., 1990a). Cholinergic neurons could depolarize thalamo-cortical
relay neurons, to which they project and thus mediate the cortical activation (McCormick
and Prince, 1986, 1987; Steriade et al., 1990a; Steriade et al., 1990b). Indeed, the release
of ACh is high in the thalamus in positive correlation with cortical activation during
waking and PS (Williams et al., 1994). Thus, the important role of ACh in thalamo-
cortical processes of activation would come into play during both wakefulness and PS.
Webster and Jones in 1988 showed that neurotoxic lesions of LDT/PPT cholinergic
neurons had minimal effects on the maintenance of cortical activation during waking
(Webster and Jones, 1988). They nonetheless did not exclude the importance of
cholinergic neurons in driving cortical activation; rather, they hypothesized that other
non-cholinergic neurons, which are part of the reticular activating system, are sufficient to
drive this cortical activation (Webster and Jones, 1988). On the other hand, they claimed
that their neurochemical lesion resulted in only 60-70 % loss of cholinergic neurons
(Webster and Jones, 1988).
Although the EEG, EMG and state related discharge of LDT/PPT cholinergic
neurons remains to be established, it is suggested that these cholinergic neurons could
stimulate cortical activation and EEG desynchronization during active waking, which is
associated with high muscle tone, as well as during PS, which is associated with complete
immobility and muscle atonia (Fig. 1.1; Jones, 2005). As Barbara Jones suggests,
14
''cholinergic neurons can stimulate cortical activation irrespective of behavioral arousal or
motor activity and muscle tone'' (Jones, 2008).
A second functional role postulated for LDT/PPT cholinergic neurons is the
triggering of PS. Neurotoxic lesions of LDT/PPT cholinergic neurons resulted in the
immediate loss followed by a partial recovery of PS, which however, was characterized
by diminished phasic activity and incomplete muscle atonia (Webster and Jones, 1988).
In addition to the W/PS-active group found in LDT/PPT (see above), some single-unit
recordings studies suggested the presence of another group of presumed cholinergic
neurons that discharge maximally during PS, as PS-active (El Mansari et al., 1989;
Steriade et al., 1990b; Kayama et al., 1992). Furthermore, expression of c-Fos, which
reflects neural activity, occurs in immunohistochemically identified LDT/PPT cholinergic
neurons following PS rebound after deprivation in rats (Maloney et al., 1999). But we
could ask how do cholinergic neurons trigger PS and elicit many of its components?
They could do so that through their influence upon the forebrain and brainstem targets.
Through ascending pathways, cholinergic neurons may participate in parallel with
other neurons of the reticular activating system to elicit an activated EEG paradoxically
similar to the EEG of the waking state. Indeed, as stated above, ACh release was found
to be as high in the thalamus during PS as it was during waking, in association with EEG
fast activity (Williams et al., 1994). ACh evoked a single spike mode firing by
thalamocortical neurons, which is associated with desynchronization of the thalamo-
cortical system and fast EEG activity (Steriade and Deschenes, 1984; Steriade and Llinas,
1988). Furthermore, ACh release was found to be as high in the cerebral cortex during
PS as it was during waking (Jasper and Tessier, 1971). The increase in the release of
ACh in the cerebral cortex is particularly derived from the cholinergic neurons in the
15
basal forebrain that project directly to the cortex (Manns et al., 2001; Henny and Jones,
2008) and were shown to be as active during PS as during waking (Fig. 1.1; Lee et al.,
2005b). The cholinergic neurons of the pontomesencephalic tegmentum could also
indirectly evoke the increase of the ACh release in the cortex by stimulating basal
forebrain cholinergic neurons via the ventral pathway (Fig. 1.1). Yet, in this same region,
cholinergic neurons are intermingled with other non-cholinergic neurons such as
GABAergic and glutamatergic neurons that are shown to influence differently the sleep-
wake cycle (Fig. 1.1; Hassani et al., 2009). LDT/PPT cholinergic neurons could thus
evoke cortical activation during PS by exciting the thalamo-cortical and basalo-cortical
relays along their ascending systems (Fig 1.1).
LDT/PPT cholinergic neurons could also participate in the cognitive correlate of
PS, dreaming (Hobson, 1992), via the ascending system through either direct stimulation
of the limbic and cortical structures to which they project (Satoh and Fibiger, 1986) or
indirect stimulation by exiting the VTA dopaminergic neurons (Forster and Blaha, 2000)
that were found to burst during PS (Dahan et al., 2007) and to project to limbic and
cortical structures (Loughlin and Fallon, 1983; Sobel and Corbett, 1984; Gasbarri et al.,
1991; Narita et al., 2010). Given the implication of these terminal structures in emotions,
memory, and even hallucinations (Portavella and Vargas, 2005; Behrendt, 2010), which
are often associated with PS and dreaming (Paiva et al., 2011), cholinergic neurons may
be implicated in the dreaming process.
Through their projections into the brainstem reticular formation, LDT/PPT
cholinergic neurons would have the capacity to trigger PS (Jones, 2004). It has been
shown that injection of the cholinergic agonist, carbachol into the PS effector zone
(PnO/SubC) produces a state closely resembling PS, as marked by muscle atonia in

16
association with cortical activation and theta activity in the hippocampus (George et al.,
1964; Baxter, 1969; Mitler and Dement, 1974; Amatruda et al., 1975; Vertes and Kocsis,
1997). In this same region, endogenous ACh is released in higher concentrations during
natural PS than during waking and SWS (Kodama et al., 1990). The generation of the
EEG components of PS, cortical activation, could be mediated by excitation of W/PS-
active neurons in the PnO and SubC through muscarinic type 1 ACh receptors (M1
AChRs) (Greene and Carpenter, 1985; Greene et al., 1989). As ascending projections to
the forebrain in parallel to the reticular activating system, these reticular neurons could
participate in inducing cortical activation (Fig 1.1; Jones, 1990a). Yet, elicitation of the
EMG component of PS, muscle atonia, in this region was found to be predominantly
mediated by the muscarinic type 2 (M2) ACh receptors (M2 AChRs), which mediate
hyperpolarization and inhibition (Velazquez-Moctezuma et al., 1989; Velazquez-
Moctezuma et al., 1991; Imeri et al., 1994; Baghdoyan and Lydic, 1999). Indeed, a large
number of presumed reticulo-spinal neurons in the PnO and caudal pontine reticular
formation (PnC) were found to bear M2 AChRs (Brischoux et al., 2008), suggesting that
LDT/PPT cholinergic neurons could inhibit reticulospinal neurons which normally
promote behavioral arousal with muscle tone (Brischoux et al., 2008). Motor neurons in
the brainstem and spinal cord could thus be indirectly disfacilitated during PS.
Cholinergic neurons could also directly inhibit brainstem motor neurons (Rukhadze and
Kubin, 2007).
According to what is cited above, the LDT/PPT cholinergic neurons could
normally stimulate cortical activation, via their influence upon reticular and forebrain
structures, during waking and during PS. They also could elicit tonic motor inhibition and

17
muscle atonia through influence upon brainstem and reticulo-spinal systems to promote
PS (Fig. 1.1).
Electrophysiological evidence has suggested the existence of more than one
functional type of cholinergic neuron in the LDT/PPT. Neurons in the LDT/PPT that had
broad spikes were considered ‘possibly’ cholinergic and found to be active during both
waking and PS (W/PS-active) or during PS (PS-active) in cat (El Mansari et al., 1989;
Steriade et al., 1990a; Koyama and Sakai, 2000) and in rat (Kayama et al., 1992).
Moreover, an electrophysiological study claimed also the presence of two sub-groups of
putative cholinergic neurons in LDT/PPT, one was inhibited by 5-HT and considered as
PS-active, and another was not affected by 5-HT and considered as W/PS-active (Thakkar
et al., 1998). Furthermore, a c-Fos study demonstrated that cholinergic neurons were
active, whereas monoaminergic neurons were reciprocally inactive during PS (Maloney et
al., 1999). This electrophysiological evidence received support from
immunohistochemical studies showing that some cholinergic neurons in LDT/PPT bear
excitatory α1 adrenergic receptors (α1-ARs) and were thus proposed to be W/PS-active,
and others bear inhibitory α2 adrenergic receptors (α2-ARs) and were thus proposed to be
PS-active neurons (Hou et al., 2001). The latter group would conform to the conceptual
model of reciprocal roles between cholinergic and monoaminergic systems in eliciting PS
and waking respectively (Hobson et al., 1975). In a "prey-predator" like model
(McCarley and Hobson, 1975), cholinergic neurons are proposed as PS-active while
monoaminergic neurons are W-active (McCarley and Hobson, 1975; Maloney et al.,
1999; Hou et al., 2001). Thus, these different studies and theories would allow for the
possibility that cholinergic LDT/PPT neurons are W/PS-active and/or PS-active subtypes.

18
1.1.4.2 LDT/PPT GABAergic neurons
Anatomy
Gamma-aminobutyric acid (GABA) is derived from glutamate by the enzyme
glutamic acid decarboxylase (GAD). Following the development of
immunohistochemical staining for GAD, GABA was found to be mostly synthesized by
local interneurons located in almost all the areas of the central nervous system (CNS)
(Mugnaini and Oertel, 1985; Watanabe et al., 2002). Many nuclei in the brainstem such
as LDT, PPT, DR, VTA and SN were found to include GABAergic neurons in addition to
the main type of neurons that characterize these nuclei (Fonnum et al., 1978; Jones,
1991c; Jones, 1991a; Holmes et al., 1994; Ford et al., 1995; Jones, 1995; Tepper et al.,
1995; Maloney et al., 2002; Wang and Morales, 2009). In the LDT and PPT nuclei,
GABAergic neurons were found to be intermingled with cholinergic neurons (Ford et al.,
1995; Wang and Morales, 2009). Surprisingly, these GABAergic neurons were found to
be more numerous than the cholinergic neurons (Ford et al., 1995; Wang and Morales,
2009). They were small (10-15 µm) to medium (up to 20 µm) GAD-immunoreactive
neurons and intermingled with medium sized ChAT+ cells through the LDT, SubLDT,
and medial and lateral (m and l) PPT (Ford et al., 1995). Although many GABAergic
neurons give rise to a dense local innervation of neighboring cells, including cholinergic
cells (Mugnaini and Oertel, 1985; Ford et al., 1995), a minority of the GABAergic cells
contribute to long ascending projections from the tegmentum into the region of cortically
projecting neurons in the posterior lateral hypothalamus (Ford et al., 1995) and into the
subthalamic nucleus (Bevan and Bolam, 1995). GAD-positive terminals are also present
near and around GAD-positive cell bodies in LDT/PPT (Ford et al., 1995), suggesting
19
that as in many other areas of the CNS, GABA-GABA interactions may occur and
underlie processes of disinhibition (Oertel et al., 1984; Mugnaini and Oertel, 1985).
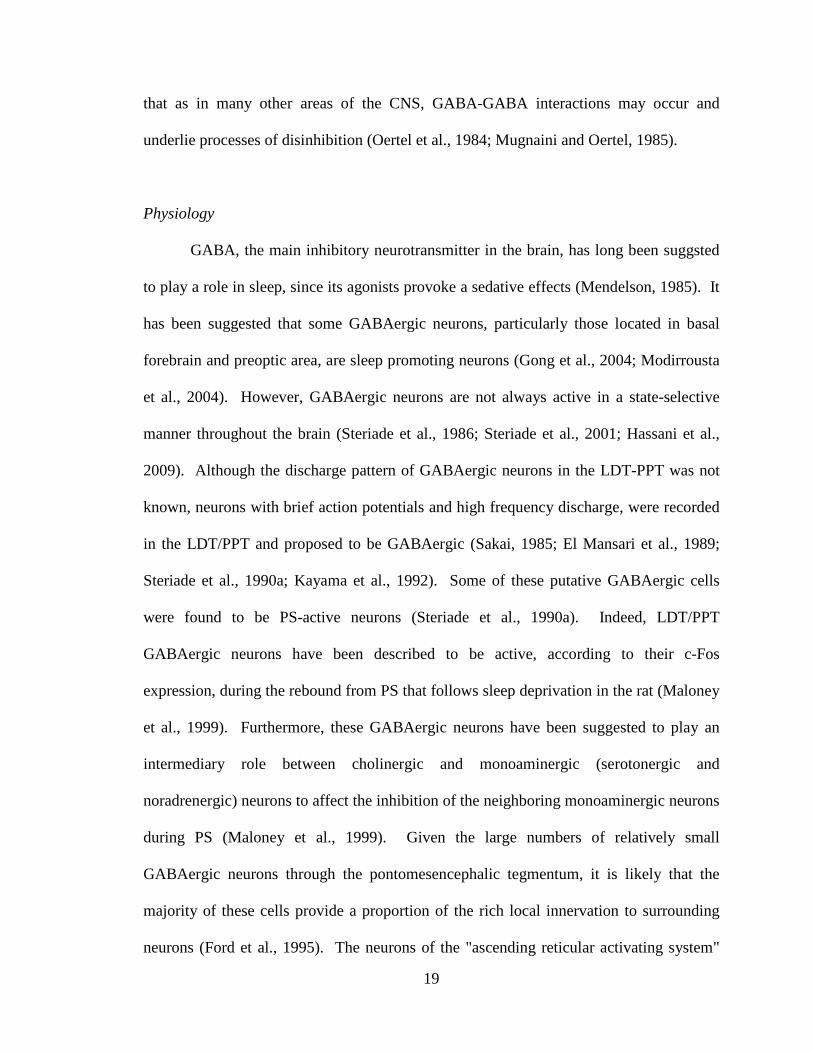
Physiology
GABA, the main inhibitory neurotransmitter in the brain, has long been suggsted
to play a role in sleep, since its agonists provoke a sedative effects (Mendelson, 1985). It
has been suggested that some GABAergic neurons, particularly those located in basal
forebrain and preoptic area, are sleep promoting neurons (Gong et al., 2004; Modirrousta
et al., 2004). However, GABAergic neurons are not always active in a state-selective
manner throughout the brain (Steriade et al., 1986; Steriade et al., 2001; Hassani et al.,
2009). Although the discharge pattern of GABAergic neurons in the LDT-PPT was not
known, neurons with brief action potentials and high frequency discharge, were recorded
in the LDT/PPT and proposed to be GABAergic (Sakai, 1985; El Mansari et al., 1989;
Steriade et al., 1990a; Kayama et al., 1992). Some of these putative GABAergic cells
were found to be PS-active neurons (Steriade et al., 1990a). Indeed, LDT/PPT
GABAergic neurons have been described to be active, according to their c-Fos
expression, during the rebound from PS that follows sleep deprivation in the rat (Maloney
et al., 1999). Furthermore, these GABAergic neurons have been suggested to play an
intermediary role between cholinergic and monoaminergic (serotonergic and
noradrenergic) neurons to affect the inhibition of the neighboring monoaminergic neurons
during PS (Maloney et al., 1999). Given the large numbers of relatively small
GABAergic neurons through the pontomesencephalic tegmentum, it is likely that the
majority of these cells provide a proportion of the rich local innervation to surrounding
neurons (Ford et al., 1995). The neurons of the "ascending reticular activating system"

20
may accordingly be regulated by important inhibitory influences through local
GABAergic neurons (Maloney et al., 1999). LDT/PPT GABAergic neurons contribute
also, although in a minor proportion, to the major ascending projections from the
brainstem reticular activating system (Ford et al., 1995). In such parallel projections, the
GABAergic neurons could potentially oppose, support or modulate the action of the
major excitatory transmitter line depending upon their target neurons (Freund and
Meskenaite, 1992; Somogyi and Klausberger, 2005). Acting as local neurons and/or
projection neurons, the LDT/PPT GABAergic cells would be expected to play a very
important role in regulating the influence of the ascending reticular activating system
upon cortical activation (Fig. 1.1).
1.1.4.3 LDT/PPT glutamatergic neurons
Anatomy
Glutamate is the main excitatory neurotransmitter in the brain and is present in
neurons throughout the CNS. Some previous studies showed the presence of glutamate in
LDT and PPT neurons (Clements and Grant, 1990; Jones, 1995). But since glutamate
serves as a precursor for GABA as well, it could also be present in GABAergic neurons;
therefore, the presence of glutamate in neurons does not serve to identify these neurons as
glutamatergic. With the discovery of vesicular glutamate transporters (VGluTs),
VGluT1, VGluT2 and VGluT3 as specific markers for the uptake and the release of
glutamate (Bellocchio et al., 2000; Fremeau et al., 2001; Fremeau et al., 2002), it became
possible to identify glutamatergic neurons in the brain (Fujiyama et al., 2001; Fremeau et
al., 2004; Herzog et al., 2004; Nickerson Poulin et al., 2006). Unlike VAChT, VGluTs
protein is present and visible only in terminals and not in cell bodies (Fujiyama et al.,
21
2001). However, using in situ hybridization technique for VGluTs mRNA, which is
present in cell bodies, could confirm the glutamatergic identity of these cells (Fremeau et
al., 2004). Indeed, a recent study using in situ hybridization for VGluT2 mRNA, has
indicated the presence of glutamatergic cells in the LDT/PPT where they are intermingled
with cholinergic and GABAergic cells and represent an important contingent of these
nuclei (Wang and Morales, 2009). Although there is no information about the specific
projections of LDT/PPT glutamatergic neurons, evidence has suggested that they form an
important contingent of long ascending projections from LDT/PPT into the forebrain in
parallel with the cholinergic neurons (Pare et al., 1988; Jones and Cuello, 1989;
Rasmusson et al., 1994; Ford et al., 1995) and GABAergic neurons (Ford et al., 1995). It
is also the case that a major proportion of neurons in the LDT/PPT which project to the
pontine and medullary reticular formation are noncholinergic and could be thus
glutamatergic neurons (Jones, 1990b).
Physiology
To date, there is a complete ignorance concerning the physiological role of
LDT/PPT glutamatergic neurons in sleep-wake cycle, since their activity across sleep-
wake states was relatively unknown and interest was focused on the cholinergic neurons
in this region. Therefore, the activity of LDT/PPT glutamatergic neurons across sleep-
wake states and their relation with their neighboring cholinergic and GABAergic neurons
remains to be explored.

22
1.2 Figure 1.1
23
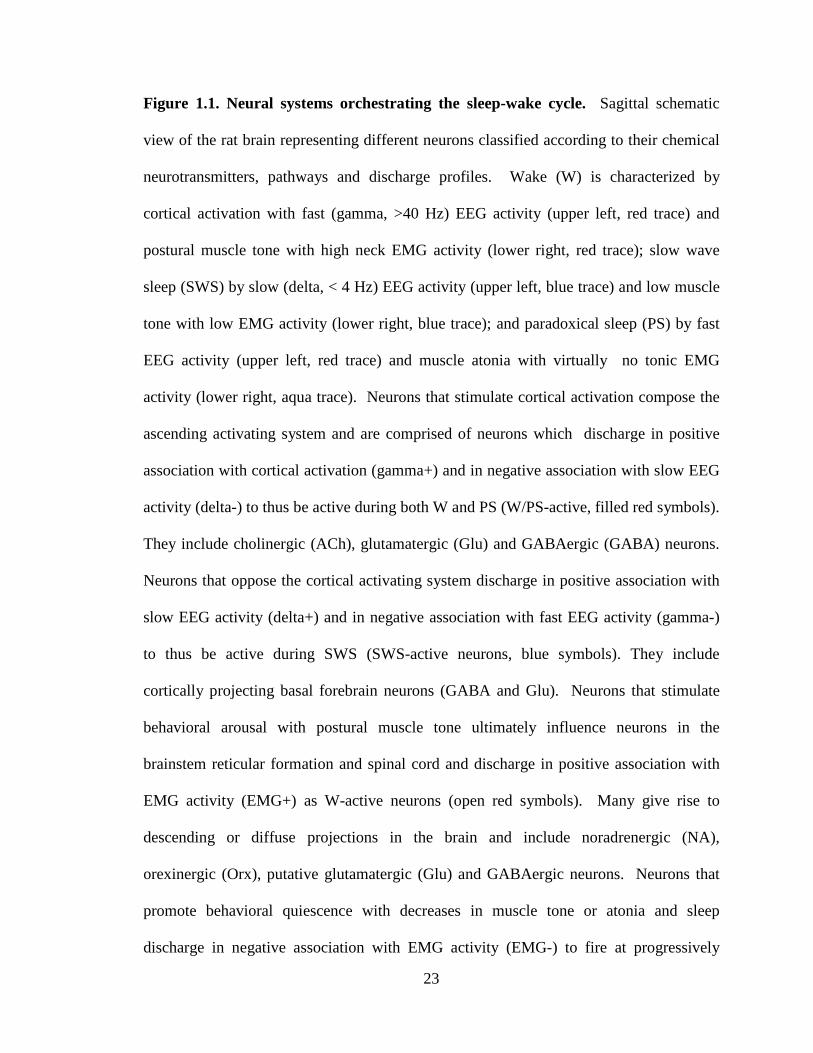
Figure 1.1. Neural systems orchestrating the sleep-wake cycle. Sagittal schematic
view of the rat brain representing different neurons classified according to their chemical
neurotransmitters, pathways and discharge profiles. Wake (W) is characterized by
cortical activation with fast (gamma, >40 Hz) EEG activity (upper left, red trace) and
postural muscle tone with high neck EMG activity (lower right, red trace); slow wave
sleep (SWS) by slow (delta, < 4 Hz) EEG activity (upper left, blue trace) and low muscle
tone with low EMG activity (lower right, blue trace); and paradoxical sleep (PS) by fast
EEG activity (upper left, red trace) and muscle atonia with virtually no tonic EMG
activity (lower right, aqua trace). Neurons that stimulate cortical activation compose the
ascending activating system and are comprised of neurons which discharge in positive
association with cortical activation (gamma+) and in negative association with slow EEG
activity (delta-) to thus be active during both W and PS (W/PS-active, filled red symbols).
They include cholinergic (ACh), glutamatergic (Glu) and GABAergic (GABA) neurons.
Neurons that oppose the cortical activating system discharge in positive association with
slow EEG activity (delta+) and in negative association with fast EEG activity (gamma-)
to thus be active during SWS (SWS-active neurons, blue symbols). They include
cortically projecting basal forebrain neurons (GABA and Glu). Neurons that stimulate
behavioral arousal with postural muscle tone ultimately influence neurons in the
brainstem reticular formation and spinal cord and discharge in positive association with
EMG activity (EMG+) as W-active neurons (open red symbols). Many give rise to
descending or diffuse projections in the brain and include noradrenergic (NA),
orexinergic (Orx), putative glutamatergic (Glu) and GABAergic neurons. Neurons that
promote behavioral quiescence with decreases in muscle tone or atonia and sleep
discharge in negative association with EMG activity (EMG-) to fire at progressively

24
higher rates during SWS and PS as SWS-PS-active neurons (aqua symbols). They
include GABAergic and putative glutamatergic neurons in the forebrain and brainstem
and MCH neurons in the hypothalamus. The EEG, EMG and state related discharge of
the cholinergic, GABAergic and glutamatergic neurons in the pontomesencephalic
tegmentum remains to be established (‘?’). Abbreviations: 7g, genu 7th nerve; ac, anterior
commissure; CPu, caudate putamen; Cx, cortex; EEG, electroencephalogram; EMG,
electromyogram; Gi RF, gigantocellular RF; GiA, gigantocellular, alpha part RF; GiV,
gigantocellular, ventral part RF; GP, globus pallidus; Hi, hippocampus; ic, internal
capsule; LC, locus coeruleus nucleus; LDT, laterodorsal tegmental nucleus; MCH,
melanin concentrating hormone; Mes RF, mesencephalic RF; NA, noradrenaline; opt,
optic tract; Orx, orexin; PH, posterior hypothalamus; PnC, pontine, caudal part RF; PnO,
pontine, oral part RF; POA, preoptic area; PPT, pedunculopontine tegmental nucleus; RF,
reticular formation; Rt, reticularis nucleus of the thalamus; s, solitary tract; scp, superior
cerebellar peduncle; SN, substantia nigra; Sol, solitary tract nucleus; Th, thalamus; TM,
tuberomammillary nuclei; VTA, ventral tegmental area. (Modified with permission from
(Jones, 2005)).
25
1.3 Considerations and Objectives:
In the preceding sections, I have discussed compelling data that suggests an
involvement of LDT/PPT neurons in the control of cortical activation and sleep-wake
states. The different types of neurons that exist in the region most probably carry out this
control by means of their anatomical projections either through the ascending pathways to
the forebrain, or through the descending pathways to the brainstem and spinal cord,
and/or through local projections influencing these systems.
With the help of extracellular recording techniques, distinct cell types have been
electrophysiologically identified in vivo in the area of LDT and PPT, where slow firing
cells with broad spikes were presumed to be cholinergic neurons, and fast firing cells with
narrow spikes were presumed to be GABAergic neurons (Sakai, 1985; El Mansari et al.,
1989; Steriade et al., 1990a; Kayama et al., 1992). However, since these conventional
techniques for extracellular recording in vivo do not allow the subsequent neurochemical
identification of the recorded units, they are likely to confuse different cell populations in
the LDT/PPT where three chemically distinct cell types have been identified (Wang and
Morales, 2009). Thus, the behavior of neurochemically identified LDT/PPT cell groups
in relation to the changes in cortical activity and thereby in relation to sleep-wake states
has not yet been possible to study. It is therefore necessary to identify the chemical
phenotype of recorded units to unequivocally identify different neuronal populations.
Fortunately, the development of the juxtacellular technique (Pinault, 1996) allowed the
labeling of single units recorded extacellularly and thereby a subsequent study of
neurochemical identity, shape, location and, possibly, axonal projections. To overcome
the limitations of previous electrophysiological studies, we used the juxtacellular

26
recording and labeling technique to record different LDT/PPT cells in anesthetized and
naturally sleeping/waking rats and subsequently to identify these cells
immunohistochemically.
Previous studies from our laboratory showed the benefit of using juxtacellular
recording and labeling to identify chemically distinct neurons in the basal forebrain in
urethane-anaesthetized animals in relation to cortical activation and slow irregular EEG
activity (Manns et al., 2000a, b; Manns et al., 2003). As it was in the case of basal
forebrain, the characterization of activity profiles that LDT/PPT neurons should present in
relation to cortical activation in anaesthetized animals can give answers to some
important questions: What is the reaction of the neurochemically distinguished cell
populations in relation the changes in cortical activity evoked by sensory stimulation?
Are the properties and discharge characteristics consistent within the cell populations?
Are these different cell populations distinct based on their electrophysiological
properties? To answer such questions, we developed in an acute preparation, in urethane-
anaesthetized rats, the first study of my thesis project: "Characterization of activity
profiles of LDT/PPT neurons in relation to cortical activation and slow irregular activity
in urethane-anaesthetized rats".
Although the acute study could suggest the way these neurons might behave during
natural sleep-wake states, many questions remain open: What are the activity profiles of
cholinergic, GABAergic and glutamatergic neurons during W, SWS and PS across
natural sleep-wake states? Do LDT/PPT neurons behave in the same way during cortical
activation in W and PS as they do in the anaesthetized preparation? Do the LDT/PPT
cholinergic neurons represent a physiologically homogeneous sleep-wake sub-group as
some previous studies suggested (Domino et al., 1968; El Mansari et al., 1989; Steriade et
27
al., 1990b; Williams et al., 1994)? Or do they, as other studies suggested (Kayama et al.,
1992; Sakai and Koyama, 1996), form different subgroups? Some could be active during
both waking and PS, as "W/PS-max active cells"; others however, could be specifically
active during PS, as "PS-max active cells". Do their activities relate to EEG activity,
muscle tone or other related phenomena during W, SWS or PS? Are these different cell
populations different in their electrophysiological properties? To answer such questions,
we developed in a chronic preparation of naturally sleeping-waking head-fixed rats, the
second study of my thesis project: "Characterization of the discharge profiles of
LDT/PPT neurons during natural sleep-wake states".
The subsequent parts of the thesis will be divided into different chapters. In chapter
2, Material and Methods, I will present the appropriate experimental context that allows
us to realize both projects. Next, in chapters 3 and 4, I will present the results of the acute
study and the chronic study respectively. Finally, the results of both studies will be
discussed in chapter 5, Discussion, in light of their significance for LDT/PPT neuronal
function, and will be followed by a general conclusion.

28
2. Chapter Two
Materials and Methods
A portion of this chapter was published in Journal of Neuroscience, Vol 29(14): 4664-4674, 2009
29
2.1 The activity profiles of LDT/PPT neurons in anesthetized rats
2.1.1 Animals and surgery
Experiments were performed on 66 adult male Long–Evans rats (200 – 250 gm;
Charles River, St. Constant, Canada). All procedures were approved by the McGill
University Animal Care Committee and the Canadian Council on Animal Care. The
animals were anesthetized with urethane (ethyl carbamate, Sigma, St. Louis, MO) using
an initial dose 1.4 gm/kg, intraperitoneally (i.p.) and supplementary doses if necessary of
0.1 – 0.15 gm/kg, i.p. to insure an adequate level of anesthesia, as determined by the lack
of response to pinching of the hind limb. Body temperature was maintained at 36 – 37°C
by a thermostatically controlled heating pad. The anesthetized animals were positioned in
a stereotaxic apparatus (David Kopf Instruments, Tujunga, CA) for both the surgery and
subsequent recording. For EEG recording, stainless steel screws were placed over the
retrosplenial cortex (antero-posterior, AP -4.0 mm, lateral ±0.5 mm relative to bregma)
and in the frontal bone as a reference.
2.1.2 Unit recording and labeling
As described previously (Manns et al., 2000a), juxtacellular recording and
labeling was performed using an intracellular amplifier (IR-283, Neurodata Instruments,
New York, NY). Unit recordings were performed with glass microelectrodes (~0.5 - 1.5
μm tip and ~25 - 40 MΩ) filled with 0.5 M NaCl and 5.0% Neurobiotin (Nb, Vector
Laboratories, Burlingame, CA). To reach the pontomesencephalic tegmentum, holes
were drilled in the skull (AP -5.0 mm from bregma, L ±0.9 mm) and after opening the
dura, the electrode descended from anterior to posterior at an angle of 30o from the
30
vertical, so as to avoid the tentorium. Single units were then isolated as the electrode was
descended through the pontomesencephalic tegmentum into the region of the LDT. Once
isolated, the unit was characterized during spontaneous irregular slow EEG activity and
during somatosensory stimulation. The somatic stimulation consisted of a continuous
pinch of the tail applied by large, blunt forceps such as to apply pressure but not to evoke
pain. The stimulation was repeated several times to confirm that the response was
constant. After the recording and characterization of isolated neurons, they were labeled
by applying the juxtacellular method, as originally developed and described by Pinault
(Pinault, 1996). Labeling was accomplished by modulating the firing of the cell through
positive current pulses (1 – 10 nA) for a period of 2 - 10 min. In this study, for a total of
149 units submitted to this juxtacellular labeling protocol in 66 rats, 118 units were
successfully labeled with Nb (~80%).
Within a few hours after the juxtacellular labeling, the animals were administered
an overdose of urethane and perfused transcardially with physiological saline (0.9%
NaCl), followed by 500 ml of a fixative containing 3% paraformaldehyde in 0.1 M
phosphate buffer, pH 7.4. The brains were removed, post-fixed overnight in the fixative
solution and immersed for 2 days in 30% sucrose in phosphate buffer for cryoprotection.
They were frozen at 50°C and stored at 80°C.
2.1.3 Histochemistry
Serial sections were cut at 25 µm thickness in the coronal plane on a freezing
microtome and collected for histochemical processing. For revelation of Nb, sections
were incubated for 2.5 h in Cy2-conjugated streptavidin (1:1000, Jackson
ImmunoResearch Laboratories, West Grove, PA). Following location of an Nb-labeled

31
cell, the relevant section was dual-immunostained for vesicular transporter protein for
acetylcholine (VAChT, with a goat, Gt, polyclonal antibody, AB1578 from Chemicon
International, Temecula, CA and a Cy5-conjugated Donkey, Dky-anti-Gt antibody from
Jackson) and glutamic acid decarboxylase (GAD, with a Mouse, Ms, monoclonal anti-
GAD67 antibody, MAB5406 from Chemicon and a Cy3-conjugated Dky-anti-Ms
antibody from Jackson) for identification of cells as cholinergic, GABAergic or
noncholinergic-nonGABAergic. Sections were viewed and images acquired by epi-
fluorescence using a Nikon Eclipse E800 (Nikon Instruments Inc., Melville, NY)
equipped with a digital camera (Microfire S99808, Optronics, Goleta, CA). The labeled
cells were mapped onto a computer resident atlas with the aid of Neurolucida (v7,
MicroBrightField, Williston, VT). Cell size was measured by the long axis of the cell and
cells classified as small (≤15 µm) or medium-to-large (16 – 35 µm). Of 118 Nb-labeled
cells, 73 were judged unequivocally positively (by bright fluorescence in soma, “+”)
immunostained or negatively (by no fluorescence in soma, “-“) immunostained for
VAChT and GAD and were located within the confines of the LDT, subLDT or adjacent
MPPT, so as to be included and reported in the Results.
2.1.4 Data analysis
Analysis of physiological data was performed on 40 sec periods corresponding to
Pre-Stimulation, Stimulation and Post-Stimulation conditions. For the EEG, spectral
analysis was performed to determine the dominant peak frequency and integrated power
of the spectra in the slow, delta (0.5 – 4.5 Hz) and fast high beta–gamma (20 – 60 Hz)
frequencies. As established previously (Manns et al., 2000a), Somatic Stimulation
resulted in a change in the EEG from a predominantly slow, irregular delta-like pattern to

32
a faster rhythmic theta-like pattern and increased fast high beta-gamma activity, typical of
a degree of cortical activation despite a lack of behavioral response in the urethane
anesthetized animal (see Fig.3.7).
Spike duration was determined from all spikes averaged across the Pre-
Stimulation period for each unit. The duration was measured at the first and second zero
crossings and thus from the initial positive to the negative deflection and to the
subsequent return to resting level (measured with an offset from resting corresponding to
10% of the positive peak amplitude so as to avoid variations in baseline zero) (see
Fig.3.8A). For unit discharge, average discharge rate (ADR) was calculated as spikes/sec
per condition, and instantaneous firing frequency (IFF) as the corresponding frequency of
the primary mode of the interspike interval (ISI) histogram per condition (see Fig. 3.8B,
C). Using the condition during which a unit discharged maximally, each unit was
classified according to several characteristics of its discharge. First, it was classified
according to the IFF as “fast” (>14.5 Hz), “slow” (0.25 - 14 Hz), “very slow” (< 0.25 Hz)
or “silent” (0 Hz). Second, each unit was classified as “tonic” or “phasic” by comparing
the IFF to the ADR, or specifically the corresponding interval of the ADR to the ISI
distribution. If the ADR interval fell within 95% of the ISI distribution, the unit was
classified as “tonic”, if outside 95%, as “phasic”. Among the tonically firing units, their
discharge was further distinguished as “tonic regular” if their ADR interval fell within
82% of the ISI distribution or as “tonic irregular” if outside 82%. Among phasically
firing units, their discharge was further distinguished according to the IFF as comprised
by high-frequency spike bursts, as >80 Hz, or lower frequency spike clusters, as <80 Hz.
Finally, cells were classified according to their response to Somatic Stimulation as “On”,
if their ADR increased, “Off” if it decreased or “No” if it showed no change (< 1 Hz).
33
The discharge of units was further examined by autocorrelation histogram (ACH) to
determine if it was rhythmic or not and by spike triggered averaging (STA) with EEG
activity to determine if it was cross-correlated with cortical activity (see Fig. 3.9).
All analyses of raw data were done using Matlab R2007a (MathWorks, Natick,
MA) and statistical analysis using Systat 11 (SPSS, Chicago, IL). Comparisons were
made across cell types using Chi square, ANOVA with Bonferroni adjustment for post-
hoc paired comparisons, student t tests and Kruskal-Wallis, Mann-Whitney or Wilcoxon
non-parametric tests (for variables which contained zeros or were irregularly distributed).
Figures were made using Adobe Photoshop CS (Adobe Systems, San Jose, CA) for
photomicrographs and Adobe Illustrator Creative Suite (CS2, Adobe Systems) for
electrophysiological data.
2.2 The activity profiles of LDT/PPT neurons during natural sleep-wake
states
2.2.1 Surgery and habituation to head-fixation
All experiments were performed on 40 adult male Long-Evans rats (200-250 g,
Charles River, St. Constant, Quebec, Canada). All procedures were approved by the
McGill University Animal Care Committee and the Canadian Council on Animal Care.
The Animals were hosted under a 12:12 hour light-dark schedule with lights on from 7:00
am to 7:00 pm and they had free access to food and water. The surgery was performed
under deep anesthesia (ketamine, xylazine and acepromazine: 65/5/1 mg/kg in a cocktail
of 2 ml/kg initial dose and 1 ml/kg booster if needed, i.p.). Anesthesia levels were
assessed throughout the procedure by testing the reaction of the tail or hind limbs to

34
pinching. Using a stereotaxic frame (David Kopf Instruments, Tujunga, CA, USA), the
rats were first implanted with EEG (epi-dural stainless screws over olfactory bulb (OB),
anterior medial prefrontal (PF) and retrosplenial (RS) cortices) and two EMG (Teflon-
coated silver wire loops in neck muscles) electrodes. Then, a metal U-shaped frame was
attached to the head skull with acrylic dental cement, leaving a space accessible to the
skull over the retrosplenial region and Lambda, which was sealed temporarily with sterile
gauze. Eventually, the U-shaped frame was screwed to a carriage adapter that in turn was
fixed to the main stereotaxic frame. These settings restrained the animal’s head with
minimum discomfort since neither ear nor tooth bars are required. Rats were allowed to
recover from surgery (~2 days) and were gradually introduced to the head fixation in the
carriage adapter while lying within a small Plexiglas box, which prevented twisting but
not moving their bodies and limbs. Animals were habituated to head fixation by
repetitive sessions of increasing time duration, until they were able to sleep and be awake
comfortably for up to 6 hours. The adaptation period takes 7 to 10 days or even more in
some rats.
2.2.2 Unit recording and labeling
One day previous to the experiment, rats were anesthetized again (as described
above) and a craniotomy was drilled over the retrosplenial region to allow the electrode to
reach the pontomesencephalic tegmentum via a rostrocaudally angled orientation. This
rostrocaudally angled orientation of the electrode was made to avoid interference with the
tentorium or the cerebellum. The skull was cleaned and covered with sterile gauze.
35
The day of the experiment, the dura mater was cut following application of one drop
of lidocaine, and a glass micropipette (~1 μm tip and ~40 MΩ) filled with ~5%
Neurobiotin (Nb, Vector Laboratories, Burlingame, CA) in 0.5 M NaCl solution was
lowered with an angle of 30o to reach the pontomesencephalic tegmentum region by using
a David Kopf micropositioner (David Kopf Instruments). Single units were recorded and
labeled using an intracellular amplifier (Neurodata IR-283A, Cygnus Technology, Inc.,
Delaware Water Gap, PA). The unit signal was amplified (2000x), digitized at sampling
rate of 8 kHz and filtered (bandpass-filters: 0.3 – 3 kHz) using a CyberAmp (380, Axon
Instruments, Union City, CA) and acquired for online viewing with the Axoscope
software (v10.1, Axon Instruments). The unit was simultaneously recorded with EEG
(digitized at sampling rate of 250 Hz, amplified 5000x and filtered 0.5-60 Hz), EMG
(digitized at sampling rate of 250 Hz, amplified 5000x and filtered 10-100 Hz) signals
and video recordings of the animal behavior by using Harmonie software (v5.2, Stellate
Co, Montreal, Canada). A single unit was isolated and recorded for a minimum of 5
minutes and during at least one full sleep-wake cycle including one episode of each of the
three major states, active wake (aW), slow wave sleep (SWS) and paradoxical sleep (PS).
After the recording of the isolated unit, labeling was started by applying the juxtacellular
technique (Pinault, 1996; Manns et al., 2000b). In short, positive currents (~10 nA) were
applied in 200 ms pulses in order to modulate the activity of the cell, a procedure needed
for the marker (Nb) to be taken by the cell.
2.2.3 Histochemistry
After recording and labelling of one unit on each side of the brain, the animals were
perfused under anesthesia (Euthanyl, ~100 ml/kg, i.p.) with ~400 ml of 3%
36
paraformaldehyde fixative solution. The brains were removed and immersed in a 30%
sucrose solution for 2 to 3 days or until they sank, then they were frozen at -50° C and
stored at -80° C. The brains were cut in a freezing microtome and adjacent sections (25
μm) were collected. Sections containing the pontomesencephalic tegmentum region were
washed for 30 min, incubated for ~3 hours in a Cy2-conjugated streptavidin solution (SA-
Cy2, 1:1000, Jackson Immunoresearch Laboratories) and mounted in non-coated sections
under glycerol 70%. Visualization and localization of the Nb-labeled neuron was done
under a Leica DMLB microscope with epi-fluorescence. Subsequently, the section
containing the neuron was re-incubated and processed immunohistochemically for
vesicular transporter protein for acetylcholine (VAChT, with a goat, Gt anti-VAChT,
Chemicon, and Cy5-conjugated Donkey, Dky-anti-Gt) and glutamic acid decarboxylase
(GAD with a mouse, Ms anti-GAD67, Chemicon and Cy3-conjugated Dky-anti-Ms). The
location of Nb-labeled cells was determined by epi-fluorescence using a Leica DMLB
microscope and photographed using a Nikon Eclipse E800 (Nikon Instruments Inc.,
Melville, NY, USA) equipped with a digital camera (Optronics, Microfire S99808). The
labeled cells were mapped onto a computer resident atlas using Neurolucida (v9,
MicroBrightField, Williston, VT). Cell size was measured by the long axis of the cell and
cells classified as small (≤15 µm) or medium-to-large (16 – 35 µm). The Nb-labeled cells
(Nb+) were judged unequivocally positively (by bright fluorescence in soma, “+”)
immunostained or negatively (by no fluorescence in soma, “-“) immunostained for
VAChT and GAD and were located within the confines of the LDT, SubLDT or adjacent
MPPT, so as to be included and reported in the Results.
37
2.2.4 Data analysis
Units were considered for analysis only if they recorded for 5 minutes periods or
longer and showed at least one episode of aW, SWS and PS. Manual scoring of different
sleep-wake states was done by analyzing EEG, EMG and video recordings in 10 s epochs.
As defined previously (Maloney et al., 1997; Lee et al., 2004) , six different states were
scored as: active wake (aW), quiet wake (qW), transition to slow wave sleep (tSWS),
slow wave sleep (SWS), transition to paradoxical sleep (tPS) or paradoxical sleep (PS).
aW was identified by the presence of high frequency gamma and theta (4.5-8 Hz) activity
in the EEG, a high and phasic EMG amplitude and limited movement of the animal’s
body; qW was identified by the presence of low voltage and fast cortical EEG activity as
well a relatively low EMG; tSWS was identified by the presence of a slower and medium
voltage of cortical EEG activity with the presence of occasional spindling activity (12-14
Hz) along with a low EMG; SWS was identified by a high voltage slow delta EEG
activity (0.5-4 Hz) together with a low EMG; tPS was identified by the presence of a
continuous spindling in EEG activity slowing down to ~10 Hz and a low EMG; finally,
PS was identified by the presence of a prominent theta EEG activity together with fast
and low voltage cortical activity, a minimal EMG amplitude and phasic activity of the
animal’s whiskers.
Electrophysiological records of EEG and EMG were scored (using Matlab program)
by 10 sec epochs to determine the sleep-wake states (hypnogram). In the meantime, the
unit activity was analyzed to determine various parameters. The average discharge rate
(ADR) was calculated as spikes/sec per state and the instantaneous firing frequency (IFF)
as the corresponding frequency of the primary mode of the interspike interval histogram
per state (ISIH). The rhythmicity of discharge and its frequency was calculated by using
38
using the autocorrelation histogram (ACH) and cross-correlated EEG activity by using
the spike triggered average (STA). To be correlated with unit spike rate, Gamma (30 – 58
Hz), delta (1 – 4.5 Hz) and theta activity (4.5 – 8 Hz) (measured as the ratio of theta/delta
powers), and EMG amplitude (30 – 100 Hz) were measured per epoch. Units were
further classified into sleep-wake sub-groups according to whether their discharge rate
varied significantly across states (p < 0.05 by ANOVA) and if so, according to the state in
which their maximal discharge rate occurred (p < 0.05 by post-hoc paired comparisons)
(Lee et al., 2004). Each unit was further distinguished according to its firing properties
during the maximally active state. First, the unit was classified according to the IFF as
“fast” (>14.5 Hz) or slow firing (<14.5 Hz). Second, each unit was classified as “tonic”
or “phasic” by comparing the IFF to the ADR, or specifically the corresponding interval
of the ADR to the ISI distribution. If the ADR interval fell within 95% of the ISI
distribution, the unit was classified as “tonic”, if outside 95%, as “phasic”. Among the
tonically firing units, their discharge was further distinguished as “tonic regular” if their
ADR interval fell within 82% of the ISI distribution or as “tonic irregular” if outside 82%.
Among phasically firing units, their discharge was further distinguished according to the
IFF as comprised by high-frequency spike bursts, as >80 Hz, or lower frequency spike
clusters, as <80 Hz. For spike duration measurement, to avoid variations in zero on the
return to baseline following the negative deflection, the measurement of the average spike
duration was based upon second zero crossing but calculated with an offset from zero
corresponding to 10% of the positive peak amplitude.
All analyzes of raw data were done using Matlab 5.3 (MathWorks, Natick, MA) and
statistical analysis using Systat 12.0 (SPSS, Chicago, IL). Figures were made using
39
Adobe Photoshop CS (Adobe Systems, San Jose, CA) for photomicrographs and Adobe
Illustrator CS (Adobe Systems, San Jose, CA) for plotting electrophysiological data.

40
3. Chapter Three
The activity profiles of LDT/PPT neurons in anesthetized rats
A portion of this chapter was published in Journal of Neuroscience, Vol 29(14): 4664-4674, 2009
41
3.1 Preface
In this study we applied the technique of juxtacellular labeling of recorded
neurons for subsequent immunohistochemical identification of cholinergic, GABAergic
and putative glutamatergic neurons in the LDT, SubLDT and medial PPT (MPPT). As
previously employed for identification of the cholinergic and other neurons in the basal
forebrain (Manns et al., 2000a, b; Manns et al., 2003), we labeled recorded cells with
Neurobiotin (Nb) following their characterization in relation to cortical activity in
urethane anesthetized rats. As possible with this anesthesia, somatic stimulation was used
to evoke enhanced fast, beta-gamma along with rhythmic slow, theta-like activity, which
resembles cortical activation of natural waking (W) and paradoxical sleep (PS), from a
baseline of irregular slow activity, which resembles slow wave activity of natural slow
wave sleep (SWS) (Maloney et al., 1997; Clement et al., 2008). Similar to comparable
populations of cells in the basal forebrain, the cell groups were found to be heterogeneous
in their properties and their response to stimulation with associated cortical activation.
42
3.2 Results
Of 149 cells, which were recorded, characterized and submitted to juxtacellular
labeling, 73 were successfully labeled with Nb, could be judged unequivocally
immunopositive or negative for VAChT and GAD and were located in the region of the
pontomesencephalic cholinergic cell area, centered upon the LDT. The Nb-labeled cells
were distributed through the caudal to rostral LDT (n = 28) or its ventral extension
beneath the central gray in the SubLDT (n = 25) or in the MPPT (n = 20) (Fig. 3.1). Of
the 73 Nb-labeled cells, 11 were established as immunopositive for VAChT
(Nb+/VAChT+), 29 as immunopositive for GAD (Nb+/GAD+) and 33 as
immunonegative for both VAChT and GAD (Nb+/VAChT-/GAD-) (Table 3.1). The Nb-
labeled cholinergic, GABAergic and noncholinergic/nonGABAergic cells were co-
distributed through the LDT, subLDT and MPPT (Fig. 3.1 and Table 3.1).
Morphologically, the Nb+/VAChT+ cells were in the vast majority polygonal and
multipolar, whereas the Nb+/GAD+ and the Nb+/VAChT-/GAD- cells were in the
majority round, oval or fusiform, accordingly bipolar and only in the minority polygonal
and multipolar, thus differing significantly according to shape (Table 3.1). All the Nb-
labeled cholinergic cells were medium-to-large cells, whereas the GABAergic and
noncholinergic/nonGABAergic cells were in large number small in addition to medium-
to-large, thus differing significantly according to size (Table 3.1). This difference was
reflected by a significant difference in the average (long axis) cell size among the cell
groups, with the cholinergic cells being significantly larger on average than the
GABAergic and noncholinergic/nonGABAergic cells (Table 3.2).

43
Physiologically, the Nb-labeled cells were heterogeneous in their discharge
properties. They responded differentially to somatic stimulation and the evoked changes
in EEG activity, which were characterized by a decrease in slow irregular, delta-like
activity (0.5 – 4 Hz) and an increase in fast, high beta–gamma activity (20 - 60 Hz),
sometimes riding upon rhythmic slow, theta-like activity (Fig. 3.7) (Table 1). The
cholinergic cells had on average longer duration spikes than the GABAergic and
noncholinergic/nonGABAergic cells (Fig. 3.8A) (Table 2). However, given large
variability they could not be distinguished on an individual basis by this feature (Fig.
3.10A). According to their instantaneous firing frequency (calculated from the modal
value of the interspike interval) during somatic stimulation, the majority of all cells were
slow firing (0.25 to 14.5 Hz), irrespective of cell type (Fig. 3.8C) (Table 1). The cell
groups could thus not be clearly distinguished according to average discharge rate or
instantaneous firing frequency during stimulation (Fig. 3.10B, C). Nonetheless, the
GABAergic and noncholinergic/nonGABAergic cells were more heterogeneous than the
cholinergic cells and included a significant number of fast firing (>14.5 Hz) neurons
along with very slow firing (<0.25 Hz) and silent neurons in the stimulation condition.
According to their firing pattern (assessed from the interspike interval histograms) during
stimulation, the vast majority of all cells were tonic and regular or irregular, irrespective
of cell type (Table 3.1). In contrast to cholinergic cells, GABAergic and
noncholinergic/nonGABAergic cells also included neurons which discharged in a phasic
manner, characterized by clusters of spikes (<80 Hz instantaneous firing frequency within
the cluster). No cells discharged in high frequency bursts (>80 Hz instantaneous firing
frequency). No cholinergic and few of the noncholinergic cells showed rhythmic firing
that was cross-correlated with the EEG activity (n = 3) in either pre-stimulation or

44
stimulation conditions (Fig. 3.9). Classified according to their response to somatic
stimulation as “On” if they increased, “Off” if they decreased and “No” if they showed no
change in their rate of discharge, the three cell groups differed significantly (Table 3.1).
Whereas all cholinergic cells were “On”, the GABAergic and
noncholinergic/nonGABAergic cells comprised “On”, “Off” and “No” cells (Table 3.1).
Given the heterogeneity of the noncholinergic cells, their further study was
performed according to the functional subgroups of “On”, “Off” or “No”. The “On” and
“Off” Nb+/GAD+ and Nb+/VAChT-/GAD- cell groups were further examined in detail
and compared to the “On” Nb+/VAChT+ cells (Table 3.3). As will be presented below
for each of these cell types, despite differing degrees of variation in discharge properties,
the GABAergic and noncholinergic/nonGABAergic “On” cells behaved in a similar
manner to the cholinergic cells. Moreover, the overlap in electrophysiological properties
of the three “On” cell groups was such that a single cell could not be distinguished as
cholinergic, GABAergic or noncholinergic/nonGABAergic according to those properties
(Fig. 3.11). “Off” cells behaved in an opposite manner to the cholinergic and other “On”
cells in their response to stimulation and relationship to EEG activity. As for the “On”
cells, the overlap in their electrophysiological properties did not allow any single cell to
be distinguished as GABAergic or nonGABAergic according to those properties (Fig.
3.12).
3.2.1 Cholinergic (Nb+/VAChT+) neurons
Nb-labeled cholinergic cells (n = 11) represented a relatively homogeneous group
according to both morphological and physiological characteristics (Table 3.1). They were
commonly polygonal, multipolar and medium-to-large in size (mean ± SEM: 24.32 ±
45
2.50 µm in long diameter) (Table 3.2, Fig. 3.2A). They had on average a relatively long
spike duration (see Fig. 3.8A and Fig. 3.2C) (0.55 ± 0.04 ms mean duration to first zero
crossing and 1.71 ± 0.17 ms duration to second zero crossing) (Table 3.2), yet comprised
cells with short as well as long duration spikes (Fig. 3.10A). In absence of stimulation,
they fired minimally in association with the irregular slow EEG activity during the pre-
stimulation period (Fig. 3.2B, C). They greatly increased their firing during somatic
stimulation and the associated increase in fast cortical activity. Following cessation of the
stimulation, the cholinergic cells slowed and often subsequently ceased firing (Fig. 3.2B,
C). Across cells, the average discharge rate increased significantly during stimulation
(3.99 ± 1.09 Hz) as compared to the pre-stimulation period (0.48 ± 0.29 Hz) (Table 3.3)
and the post-stimulation period (0.25 ± 0.15 Hz; p < 0.05). During stimulation, the
cholinergic cell discharge was characterized by a regular (Fig. 3.2C) or irregular tonic
firing pattern typified by a slow instantaneous firing frequency (mean 3.19 ± 0.68 Hz)
(Table 3.3) that was similar to the average discharge rate (Fig. 3.8B, C). Neither during
stimulation or pre-stimulation was the discharge of the cells rhythmic or cross-correlated
with slow EEG activity (Fig. 3.9). At the beginning of somatic stimulation, the majority
of cholinergic cells (n = 7) increased their firing before the change in EEG activity (by
~180 ms for the cell shown in Fig. 3.2, up to ~1.6 sec across cells).
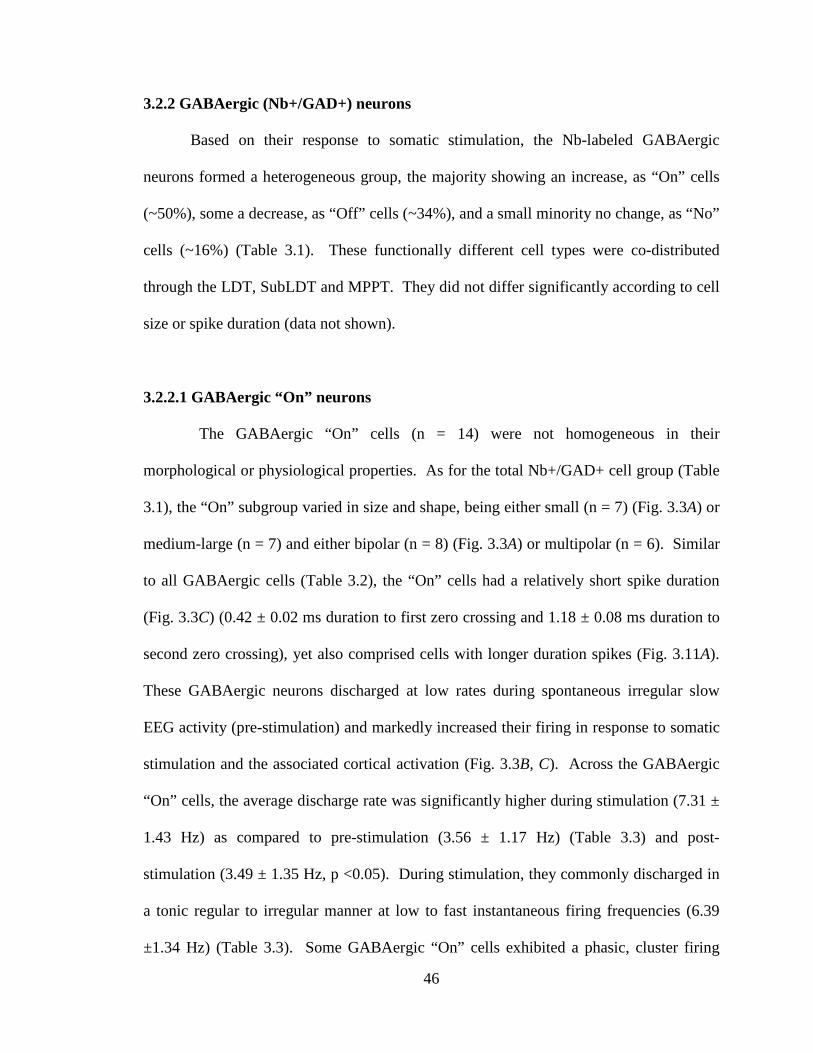
46
3.2.2 GABAergic (Nb+/GAD+) neurons
Based on their response to somatic stimulation, the Nb-labeled GABAergic
neurons formed a heterogeneous group, the majority showing an increase, as “On” cells
(~50%), some a decrease, as “Off” cells (~34%), and a small minority no change, as “No”
cells (~16%) (Table 3.1). These functionally different cell types were co-distributed
through the LDT, SubLDT and MPPT. They did not differ significantly according to cell
size or spike duration (data not shown).
3.2.2.1 GABAergic “On” neurons
The GABAergic “On” cells (n = 14) were not homogeneous in their
morphological or physiological properties. As for the total Nb+/GAD+ cell group (Table
3.1), the “On” subgroup varied in size and shape, being either small (n = 7) (Fig. 3.3A) or
medium-large (n = 7) and either bipolar (n = 8) (Fig. 3.3A) or multipolar (n = 6). Similar
to all GABAergic cells (Table 3.2), the “On” cells had a relatively short spike duration
(Fig. 3.3C) (0.42 ± 0.02 ms duration to first zero crossing and 1.18 ± 0.08 ms duration to
second zero crossing), yet also comprised cells with longer duration spikes (Fig. 3.11A).
These GABAergic neurons discharged at low rates during spontaneous irregular slow
EEG activity (pre-stimulation) and markedly increased their firing in response to somatic
stimulation and the associated cortical activation (Fig. 3.3B, C). Across the GABAergic
“On” cells, the average discharge rate was significantly higher during stimulation (7.31 ±
1.43 Hz) as compared to pre-stimulation (3.56 ± 1.17 Hz) (Table 3.3) and post-
stimulation (3.49 ± 1.35 Hz, p <0.05). During stimulation, they commonly discharged in
a tonic regular to irregular manner at low to fast instantaneous firing frequencies (6.39
±1.34 Hz) (Table 3.3). Some GABAergic “On” cells exhibited a phasic, cluster firing
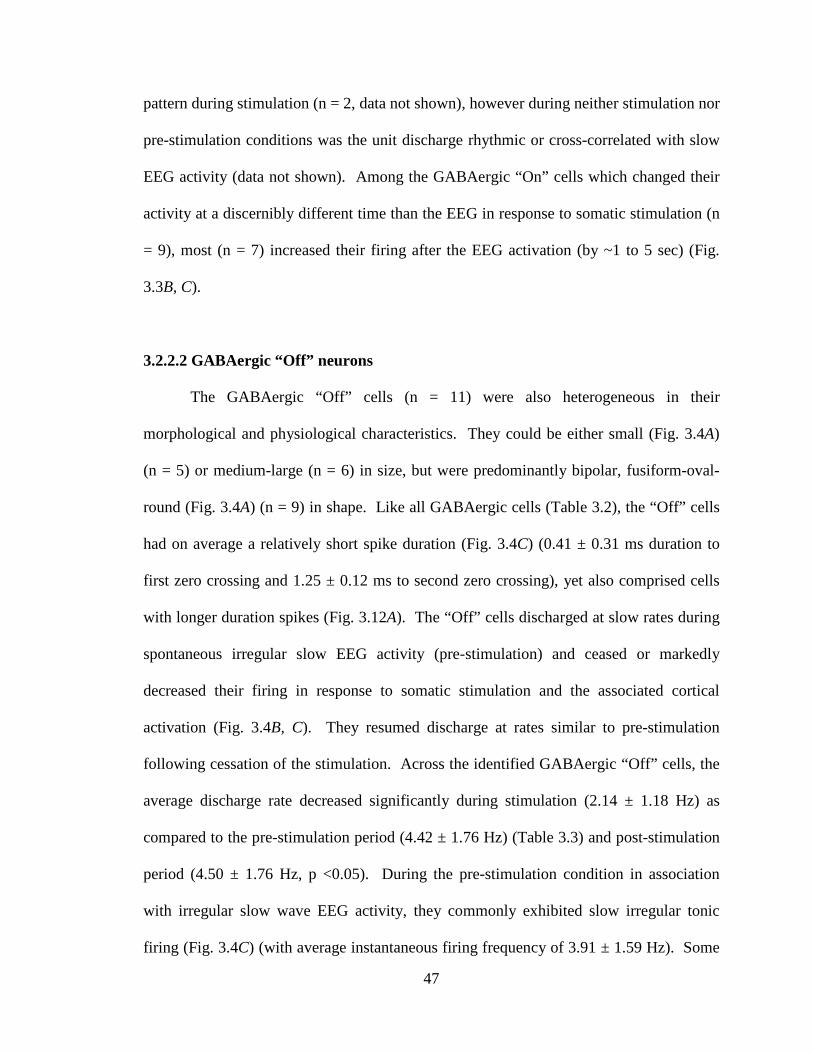
47
pattern during stimulation (n = 2, data not shown), however during neither stimulation nor
pre-stimulation conditions was the unit discharge rhythmic or cross-correlated with slow
EEG activity (data not shown). Among the GABAergic “On” cells which changed their
activity at a discernibly different time than the EEG in response to somatic stimulation (n
= 9), most (n = 7) increased their firing after the EEG activation (by ~1 to 5 sec) (Fig.
3.3B, C).
3.2.2.2 GABAergic “Off” neurons
The GABAergic “Off” cells (n = 11) were also heterogeneous in their
morphological and physiological characteristics. They could be either small (Fig. 3.4A)
(n = 5) or medium-large (n = 6) in size, but were predominantly bipolar, fusiform-oval-
round (Fig. 3.4A) (n = 9) in shape. Like all GABAergic cells (Table 3.2), the “Off” cells
had on average a relatively short spike duration (Fig. 3.4C) (0.41 ± 0.31 ms duration to
first zero crossing and 1.25 ± 0.12 ms to second zero crossing), yet also comprised cells
with longer duration spikes (Fig. 3.12A). The “Off” cells discharged at slow rates during
spontaneous irregular slow EEG activity (pre-stimulation) and ceased or markedly
decreased their firing in response to somatic stimulation and the associated cortical
activation (Fig. 3.4B, C). They resumed discharge at rates similar to pre-stimulation
following cessation of the stimulation. Across the identified GABAergic “Off” cells, the
average discharge rate decreased significantly during stimulation (2.14 ± 1.18 Hz) as
compared to the pre-stimulation period (4.42 ± 1.76 Hz) (Table 3.3) and post-stimulation
period (4.50 ± 1.76 Hz, p <0.05). During the pre-stimulation condition in association
with irregular slow wave EEG activity, they commonly exhibited slow irregular tonic
firing (Fig. 3.4C) (with average instantaneous firing frequency of 3.91 ± 1.59 Hz). Some

48
cells displayed phasic firing in clusters of spikes (n = 4) (data not shown), and one
showed rhythmic firing which was cross-correlated with rhythmic slow theta-like activity
during stimulation (data not shown). Among the GABAergic “Off” cells which changed
their activity at a discernibly different time than the EEG in response to somatic
stimulation (n = 7), most (n = 5) decreased their firing following the EEG activation (with
a delay of ~1 to 8 sec) (Fig. 3.4B, C).
3.2.3 Non-cholinergic/non-GABAergic (Nb+/VAChT-/GAD-) neurons
Nb-labeled noncholinergic/nonGABAergic cells (n = 33) were heterogeneous in
their properties and comprised “On” (~44%), “Off” (~42%) and “No” cells (~14%)
(Table 1), which were co-distributed through the LDT, SubLDT and MPPT. These cell
subgroups did not differ significantly according to cell size or spike duration (data not
shown).
3.2.3.1 Non-cholinergic/non-GABAergic “On” neurons
Most noncholinergic/nonGABAergic “On” cells were medium-large (Fig. 3.5A, n
= 10) and the remaining small (n = 4). For the shape, the majority was bipolar (Fig. 3.5A)
(n = 11) and the remaining multipolar (n = 3). They had on average a relatively short
spike duration (Fig. 3.5C) (0.42 ± 0.02 ms to first zero crossing and 1.20 ± 0.11 ms to
second zero crossing), yet comprised cells with longer duration spikes (Fig. 3.11A).
These neurons discharged at low rates during spontaneous irregular slow EEG activity
(pre-stimulation) and markedly increased their rate in response to somatic stimulation and
the associated cortical activation (Fig. 3.5B, C). They decreased and ceased firing during
the post-stimulation period. Across cells, the average discharge rate increased
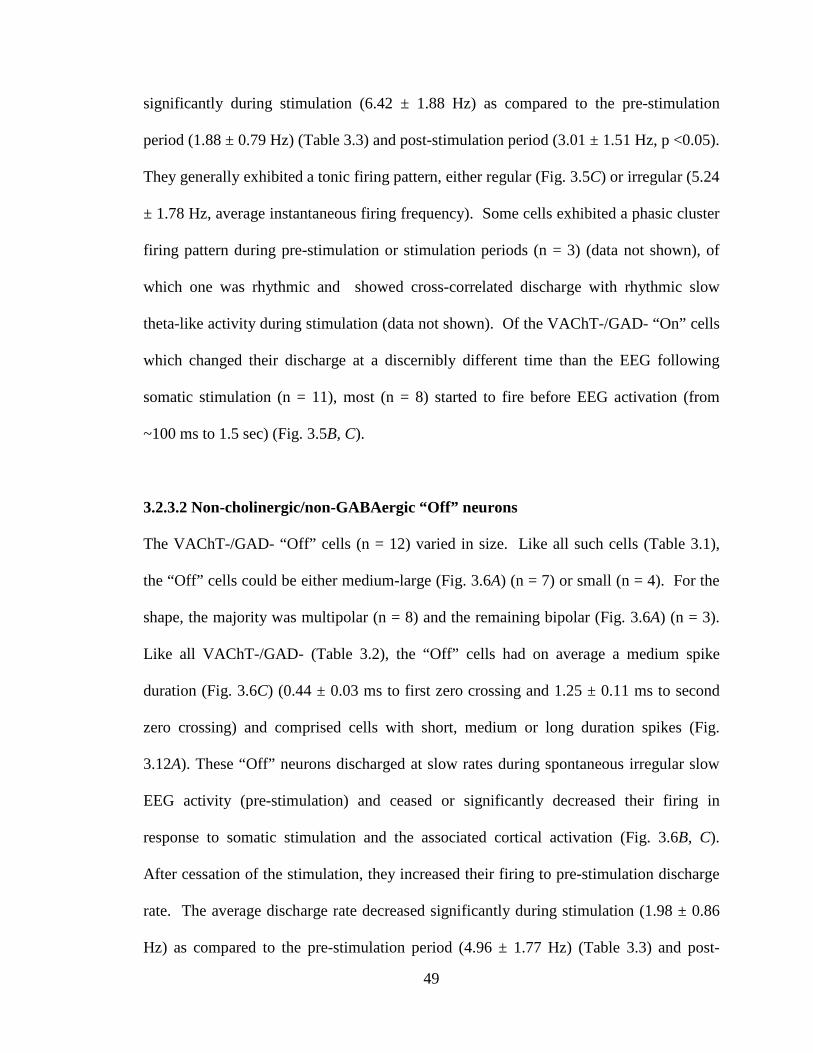
49
significantly during stimulation (6.42 ± 1.88 Hz) as compared to the pre-stimulation
period (1.88 ± 0.79 Hz) (Table 3.3) and post-stimulation period (3.01 ± 1.51 Hz, p <0.05).
They generally exhibited a tonic firing pattern, either regular (Fig. 3.5C) or irregular (5.24
± 1.78 Hz, average instantaneous firing frequency). Some cells exhibited a phasic cluster
firing pattern during pre-stimulation or stimulation periods (n = 3) (data not shown), of
which one was rhythmic and showed cross-correlated discharge with rhythmic slow
theta-like activity during stimulation (data not shown). Of the VAChT-/GAD- “On” cells
which changed their discharge at a discernibly different time than the EEG following
somatic stimulation (n = 11), most (n = 8) started to fire before EEG activation (from
~100 ms to 1.5 sec) (Fig. 3.5B, C).
3.2.3.2 Non-cholinergic/non-GABAergic “Off” neurons
The VAChT-/GAD- “Off” cells (n = 12) varied in size. Like all such cells (Table 3.1),
the “Off” cells could be either medium-large (Fig. 3.6A) (n = 7) or small (n = 4). For the
shape, the majority was multipolar (n = 8) and the remaining bipolar (Fig. 3.6A) (n = 3).
Like all VAChT-/GAD- (Table 3.2), the “Off” cells had on average a medium spike
duration (Fig. 3.6C) (0.44 ± 0.03 ms to first zero crossing and 1.25 ± 0.11 ms to second
zero crossing) and comprised cells with short, medium or long duration spikes (Fig.
3.12A). These “Off” neurons discharged at slow rates during spontaneous irregular slow
EEG activity (pre-stimulation) and ceased or significantly decreased their firing in
response to somatic stimulation and the associated cortical activation (Fig. 3.6B, C).
After cessation of the stimulation, they increased their firing to pre-stimulation discharge
rate. The average discharge rate decreased significantly during stimulation (1.98 ± 0.86
Hz) as compared to the pre-stimulation period (4.96 ± 1.77 Hz) (Table 3.3) and post-

50
stimulation period (4.77 ± 1.64 Hz, p < 0.05). During the pre-stimulation condition in
association with irregular slow wave EEG activity, they commonly exhibited slow
irregular tonic firing (Fig. 3.6C) (with average instantaneous firing frequency of 3.69 ±
1.36 Hz). Some cells exhibited a phasic cluster firing pattern (n = 3) (data not shown),
and one showed rhythmic activity during stimulation, which was cross-correlated with
EEG activity (data not shown). Although only for a minority of VAChT-/GAD- “Off”
cells could their decrease in firing be clearly assessed in relation to the EEG following
somatic stimulation (n = 5), most of these (n = 4) decreased their firing prior to the
change in EEG activity (by ~130 ms to 4.3 sec) (data not shown).

51
3.3 Tables and Figures

52
Table 3.1. Frequency of cholinergic, GABAergic and noncholinergic/nonGABAergic cells with different anatomical and physiological characteristics1
All cells Nb+/VAChT+ Nb+/GAD+ Nb+/VAChT-/GAD- Statistic :
n 73 11 29 33 χ2 (df) Anatomy Area 7.58 (4) LDT 28 7 7 14 SubLDT 25 3 10 12 MPPT 20 1 12 7 Shape2 6.76 (2)* Round-oval-fusiform 36 2 18 16 Polygonal 33 9 10 14 Size2 7.03 (2)* Small (≤15µm) 24 0 12 12 Medium-large (>15µm) 45 11 16 18
Physiology Frequency (Stimulation)3 5.35 (6) Fast (>14.5 Hz) 12 1 6 5 Slow (<14.5 Hz) 50 10 19 21 Very slow (<0.25 Hz) 6 0 3 3 Silent (0 Hz) 5 0 1 4 Firing type (Stimulation)4 3.27 (4) Tonic Regular 29 6 11 12 Tonic Irregular 22 5 9 8 Phasic Cluster 12 0 6 6 Phasic Burst 0 0 0 0 Response to stimulation Increase ("On") 41 11 14 16 10.14 (4)* Decrease ("Off ") 23 0 11 12 No change ("No") 9 0 4 5 1Frequency (n, number of cells) for the three groups are presented and compared, using the likelihood ratio χ2 statistic; *p < 0.05; **p < 0.01; ***p < 0.001. 2 Shape and size (long axis) of whole cell bodies only (n = 69). 3According to instantaneous firing frequency calculated from interspike interval modal value during stimulation. 4 Including cells with discharge rates > 0.25 Hz (n = 63).
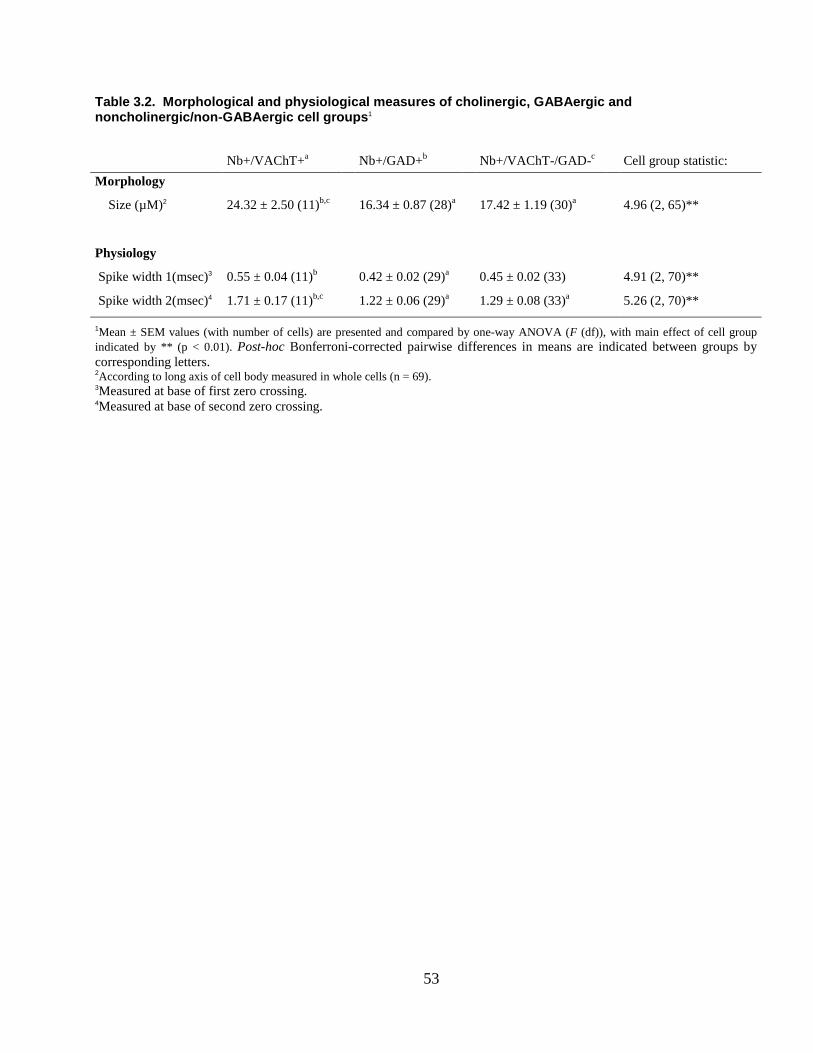
53
Table 3.2. Morphological and physiological measures of cholinergic, GABAergic and noncholinergic/non-GABAergic cell groups1
Nb+/VAChT+a Nb+/GAD+b Nb+/VAChT-/GAD-c Cell group statistic: Morphology
Size (µM)2 24.32 ± 2.50 (11)b,c
16.34 ± 0.87 (28)a
17.42 ± 1.19 (30)a
4.96 (2, 65)**
Physiology
Spike width 1(msec)3 0.55 ± 0.04 (11)b
0.42 ± 0.02 (29)a
0.45 ± 0.02 (33)
4.91 (2, 70)**
Spike width 2(msec)4 1.71 ± 0.17 (11)b,c
1.22 ± 0.06 (29)a
1.29 ± 0.08 (33)a
5.26 (2, 70)** 1Mean ± SEM values (with number of cells) are presented and compared by one-way ANOVA (F (df)), with main effect of cell group indicated by ** (p < 0.01). Post-hoc Bonferroni-corrected pairwise differences in means are indicated between groups by corresponding letters. 2According to long axis of cell body measured in whole cells (n = 69). 3Measured at base of first zero crossing. 4Measured at base of second zero crossing.

54
Table 3.3. Average discharge rate and instantaneous firing frequency during pre-stimulation and stimulation conditions of cholinergic, GABAergic and noncholinergic/nonGABAergic cell groups1
Nb+/VAChT+ cellsa Nb+/GAD+ cellsb Nb+/VAChT-/GAD- cellsc
Average Discharge Rate2 Pre-Stimulation Stimulation Pre-Stimulation Stimulation Pre-Stimulation Stimulation
"On" Subgroup† 0.48 ± 0.29 (11)b 3.99 ± 1.09 (11)** 3.56 ± 1.17 (14)a 7.31 ± 1.43 (14)*** 1.88 ± 0.79 (15) 6.42 ± 1.88 (15)***
"Off " Subgroup 4.42 ± 1.76 (11) 2.14 ± 1.18 (11)** 4.96 ± 1.77 (12) 1.98 ± 0.86 (12)**
Instantaneous Firing frequency3
"On" Subgroup 1.07 ± 0.51 (9) 3.19 ± 0.68 (11)* 2.80 ± 1.06 (14) 6.39 ± 1.34 (14)** 1.47 ± 0.47 (14) 5.24 ± 1.78 (15)**
"Off " Subgroup 3.91 ± 1.59 (11) 2.99 ± 1.22 (10) 3.69 ± 1.36 (12) 1.44 ± 0.72 (6) 1Mean ± SEM values (with number of cells) of average discharge rate and instantaneous firing frequency are presented and compared between the Pre-Stimulation and Stimulation conditions by nonparametric Wilcoxon tests for each cell subgroup (*p < 0.05; **p < 0.01; ***p < 0.001). Rates and frequencies were compared among cell groups for the Pre-Stimulation and Stimulation conditions by nonparametric Kruskal-Wallis tests. A main effect of cell group was significant only for the average discharge rate during Pre-Stimulation among the On subgroups (†, p < 0.05). According to post-hoc Mann-Whitney (p < 0.017, allowing 3 comparisons), pairwise differences in means are indicated between groups by corresponding letters. 2Average discharge rate (Hz) calculated for ~40 sec periods of each condition. 3Instantaneous firing frequency (Hz) calculated from the interspike interval modal value for ~40 sec periods having >2 spikes.

55
Figure 3.1. Distribution of recorded cells in the mesopontine tegmentum.

56
Figure 3.1. Distribution of recorded cells in the mesopontine tegmentum. The
recorded, Nb-labeled cells were immunohistochemically identified as cholinergic, using
VAChT (Nb+/VAChT+, blue circles), GABAergic, using GAD (Nb+/GAD+, red
triangles) or as noncholinergic/nonGABAergic (Nb+/VAChT-/GAD-, green squares).
GABAergic and noncholinergic/nonGABAergic cells were further distinguished
according to their response as “On” (filled symbols), “Off” (open symbols) or “No”
(small filled symbols) response to somatic stimulation. Cells are mapped onto
appropriate levels (Anterior, A0.9, A0.5 or A0.1 mm to interaural zero) through the
LDT/SubLDT/MPPT cholinergic cell area. Recordings and images are presented for
representative cells (largest symbols) of the cholinergic (Fig. 2), GABAergic “On” and
“Off” (Figs. 3 and 4) and noncholinergic/nonGABAergic “On” and “Off” cells (Figs. 5
and 6). Abbreviations: CG, central grey; CnF, cuneiform nucleus; crf, central reticular
fasciculus; DMT, dorsomedail tegmental area; DR, dorsal raphe nucleus; DT, dorsal
tegmental nucleus; IC, inferior colliculus; LC, locus coeruleus; LDT, laterodorsal
tegmental nucleus; LL, lateral lemniscus; LPB, lateral parabrachial nucleus; LPPT, lateral
pedoculopontine tegmental nucleus; Me5, mesencephalic trigeminal nucleus; mlf, medial
longitudinal fasciculus; Mo5, motor trigeminal nucleus; MPB, medial parabrachial
nucleus; MPPT, medial pedoculopontine tegmental nucleus; PnC, pontine reticular
nucleus, caudal part; PnO, pontine reticular nucleus, oral part; Pr5, principal sensory
trigeminal nucleus; R, raphe nuclei; RtT, reticulotegmental nucleus of the thalamus; scp,
superior cerebellar peduncle; SubC, subcoeruleus. SubLDT, sublaterodorsal tegmental
nucleus; VT, ventral tegmental nucleus.
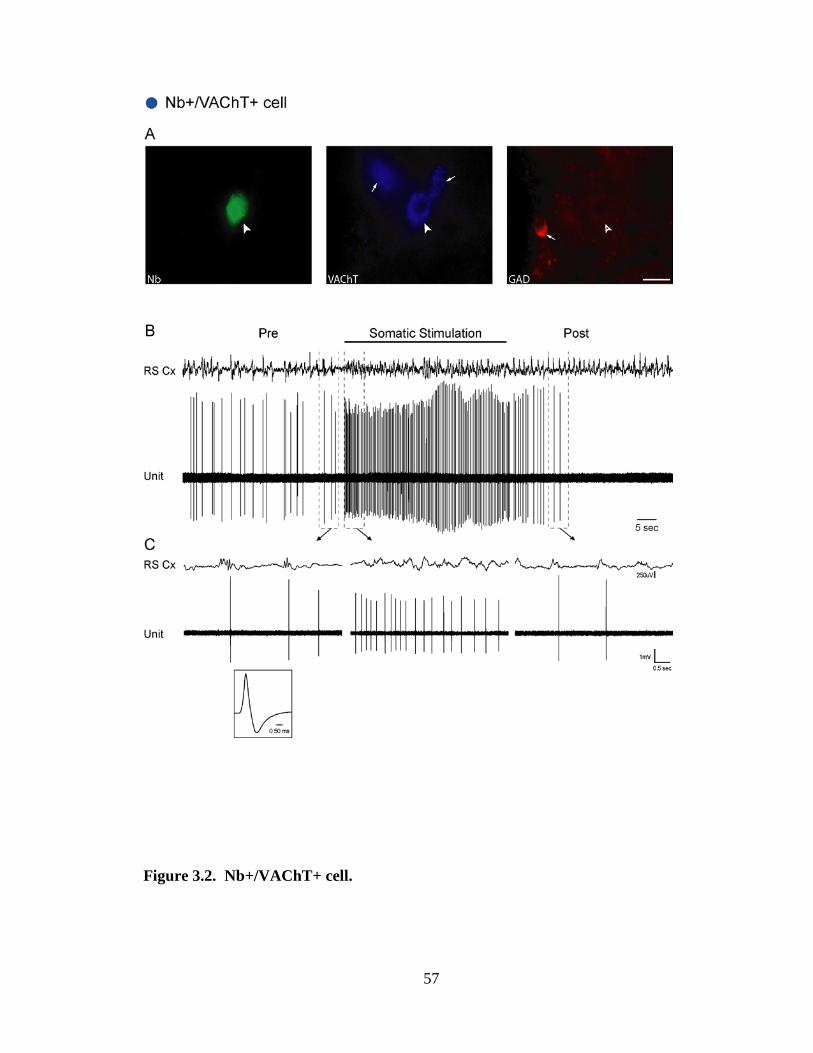
57
Figure 3.2. Nb+/VAChT+ cell.

58
Figure 3.2. Nb+/VAChT+ cell. A, The Nb-labeled cell (filled arrowhead, #ABS80a)
was positively immunostained for VAChT (filled arrowhead) and negatively for GAD
(open arrowhead), while near other VAChT+ and GAD+ cells in the region (small
arrows). Scale bar, 20 µm. The cell was located in the SubLDT (largest blue circle, Fig.
3.1, A0.5). B and C, The unit discharged at an average low rate (0.70 Hz) in association
with spontaneous irregular slow wave activity on the EEG of the retrosplenial cortex (RS
Cx) in the period preceding stimulation (Pre). It increased its rate markedly (to 3.10 Hz)
and fired tonically during somatic stimulation in association with faster activity on the
EEG (See also Figs. 3.8 and 3.9). Note that the increase in unit discharge preceded the
change in EEG activity (by ~180 ms). After stimulation, the unit initially decreased then
ceased firing as the EEG returned to irregular slow wave activity. Traces in B (enclosed
by dashed lines) are expanded in C (arrows). The unit had a relatively long duration
spike (shown in C, 0.76 and 2.55 ms at first and second zero crossings) (Fig. 3.8).
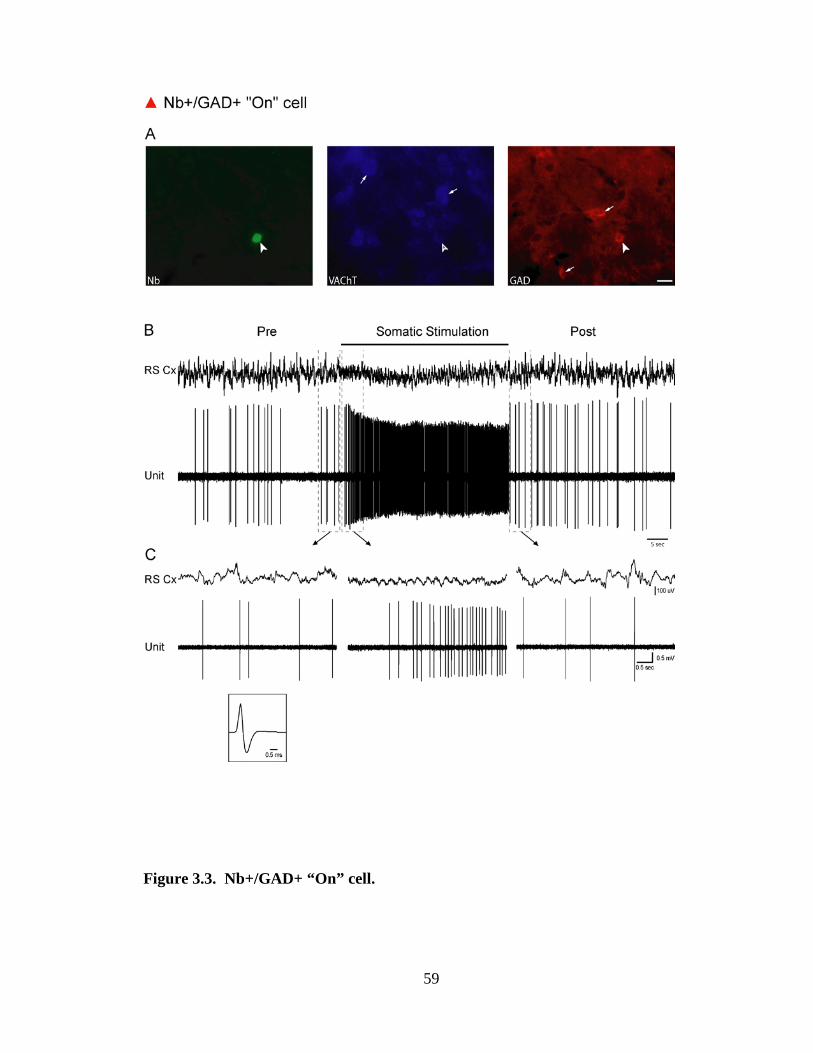
59
Figure 3.3. Nb+/GAD+ “On” cell.
60
Figure 3.3. Nb+/GAD+ “On” cell. A, Nb-labeled cell (filled arrowhead, #ABS78b) was
negatively immunostained for VAChT (open arrowhead) and positively so for GAD
(filled arrowhead), while located near other VAChT+ and GAD+ cells in the region
(small arrows). Scale bar, 20 µm. The cell was situated in the LDT (largest red filled
triangle, Fig. 3.1, A0.1). B and C, The unit discharged at a low average rate (0.46 Hz) in
association with irregular slow wave activity on the EEG of the retrosplenial cortex (RS
Cx) prior to stimulation (Pre). It increased its firing markedly (to 11.49 Hz) and fired
tonically in association with faster cortical activity riding upon rhythmic slow (theta-like)
activity during somatic Stimulation. Note that the increase in unit discharge followed the
change in EEG activity (by ~1.22 sec). After stimulation, the unit decreased its rate of
firing to return to pre-stimulation levels in similar association with irregular slow wave
activity. Traces in B (enclosed by dashed lines) are expanded in C (arrows). The unit
had a relatively short duration spike (shown in C, 0.44 and 1.21 ms at first and second
zero crossings).
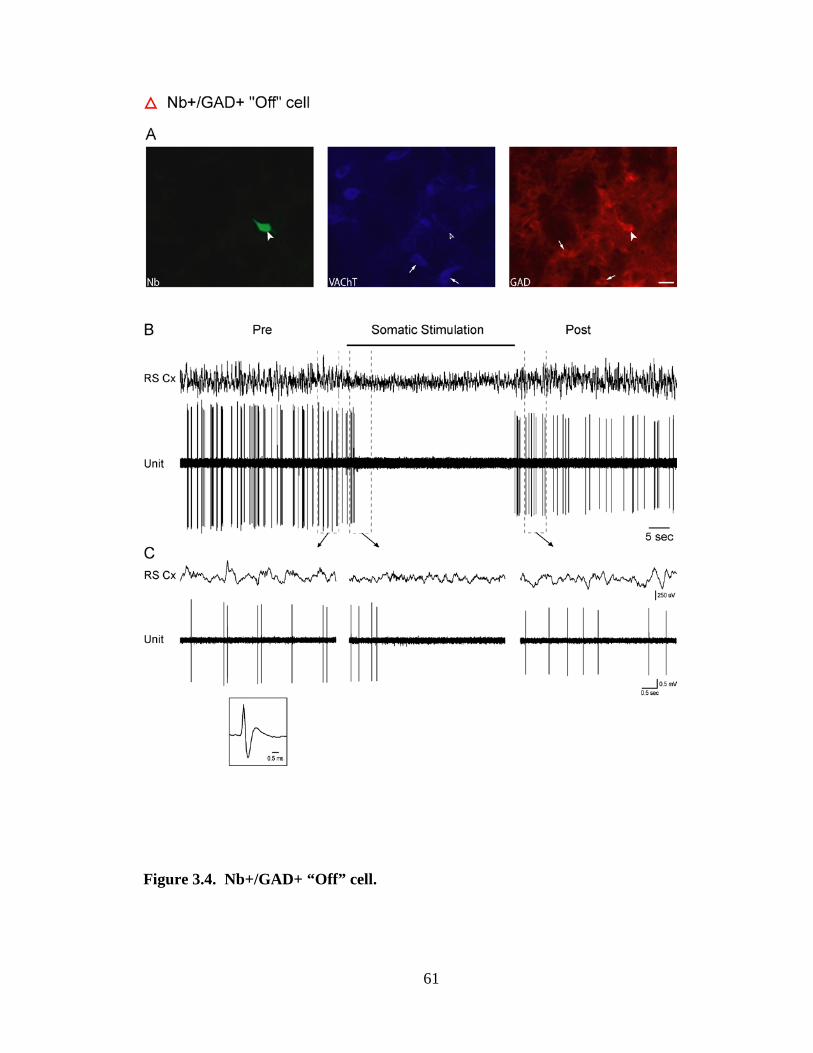
61
Figure 3.4. Nb+/GAD+ “Off” cell.

62
Figure 3.4. Nb+/GAD+ “Off” cell. A, Nb-labeled cell (filled arrowhead, #ABS102a)
was negatively immunostained for VAChT (open arrowhead) and positively so for GAD
(filled arrowhead), while located near other VAChT+ and GAD+ cells in the region
(small arrows). Scale bar, 20 µm. The cell was situated in the SubLDT (largest red open
triangle, Fig. 3.1, A0.1). B and C, The unit discharged phasically at a moderate average
rate (2.07 Hz) in association with irregular slow wave activity on the EEG of the
retrosplenial cortex (RS Cx) prior to stimulation (Pre). It ceased firing in association with
faster cortical activity riding upon rhythmic slow (theta-like) activity during somatic
stimulation. Note that the unit ceased firing following the change in EEG activity (by
~1.31 sec). After stimulation (Veening et al.), the unit recovered its baseline rate of firing
in association with irregular slow wave activity. Traces in B (enclosed by dashed lines)
are expanded in C (arrows). The unit had a relatively short duration spike (shown in C,
0.35 and 0.93 ms at first and second zero crossings).

63
Figure 3.5. Nb+/VAChT-/GAD- “On” cell.
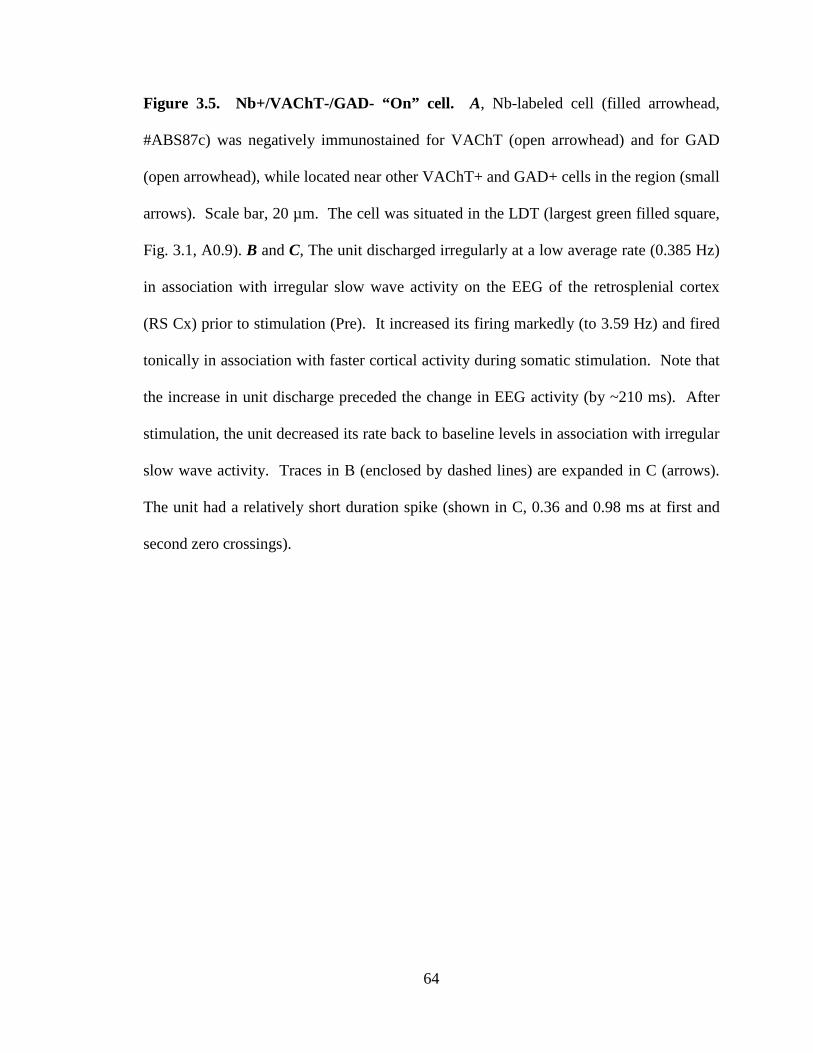
64
Figure 3.5. Nb+/VAChT-/GAD- “On” cell. A, Nb-labeled cell (filled arrowhead,
#ABS87c) was negatively immunostained for VAChT (open arrowhead) and for GAD
(open arrowhead), while located near other VAChT+ and GAD+ cells in the region (small
arrows). Scale bar, 20 µm. The cell was situated in the LDT (largest green filled square,
Fig. 3.1, A0.9). B and C, The unit discharged irregularly at a low average rate (0.385 Hz)
in association with irregular slow wave activity on the EEG of the retrosplenial cortex
(RS Cx) prior to stimulation (Pre). It increased its firing markedly (to 3.59 Hz) and fired
tonically in association with faster cortical activity during somatic stimulation. Note that
the increase in unit discharge preceded the change in EEG activity (by ~210 ms). After
stimulation, the unit decreased its rate back to baseline levels in association with irregular
slow wave activity. Traces in B (enclosed by dashed lines) are expanded in C (arrows).
The unit had a relatively short duration spike (shown in C, 0.36 and 0.98 ms at first and
second zero crossings).

65
Figure 3.6. Nb+/VAChT-/GAD- “Off” cell.

66
Figure 3.6. Nb+/VAChT-/GAD- “Off” cell. A, Nb-labeled cell (filled arrowhead,
#ABS54) was negatively immunostained for VAChT (open arrowhead) and for GAD
(open arrowhead), while located near other VAChT+ and GAD+ cells in the region (small
arrows). Scale bar, 20 µm. The cell was situated in the MPPT (largest green open
square, Fig. 3.1, A0.9). B and C, The unit discharged at a fast average rate (13.28 Hz) in
association with irregular slow wave activity on the EEG of the retrosplenial cortex (RS
Cx) prior to stimulation (Pre). It decreased its average discharge rate (to 4.20 Hz) in
association with faster cortical activity during somatic stimulation. After stimulation, the
unit recovered its baseline rate in association with irregular slow wave activity. Traces in
B (enclosed by dashed lines) are expanded in C (arrows). The unit had a medium
duration spike (shown in C, 0.49 and 1.34 ms at first and second zero crossings).
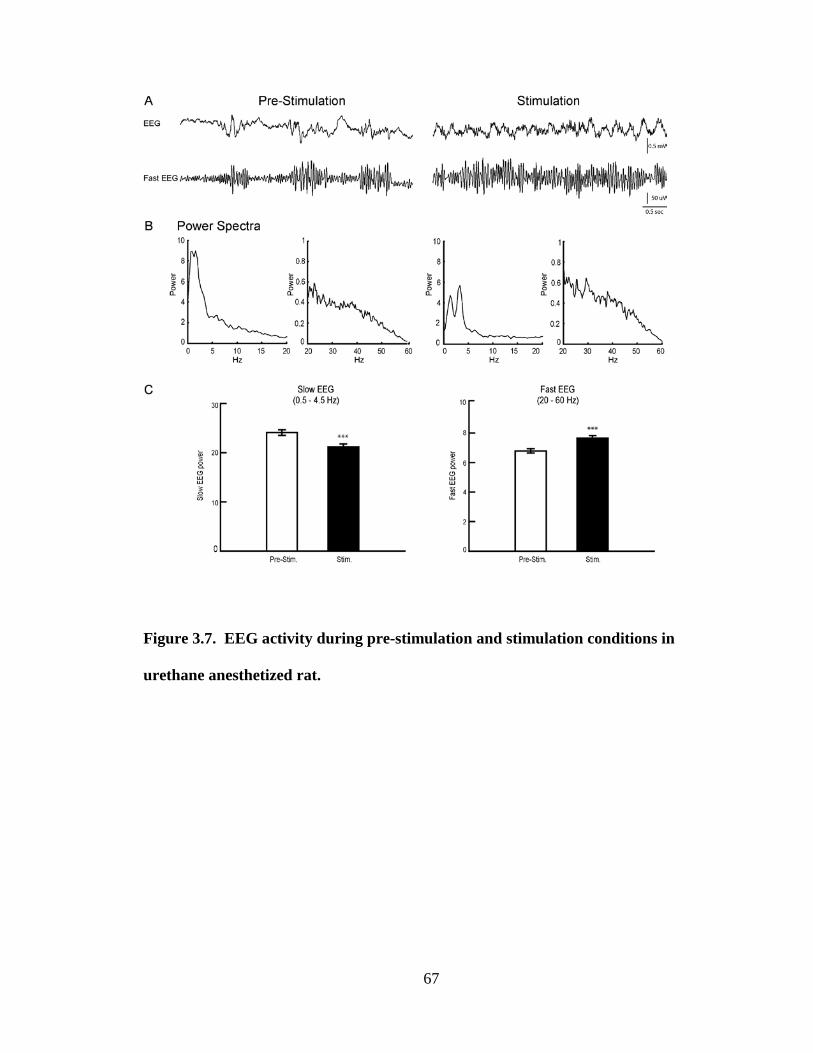
67
Figure 3.7. EEG activity during pre-stimulation and stimulation conditions in
urethane anesthetized rat.
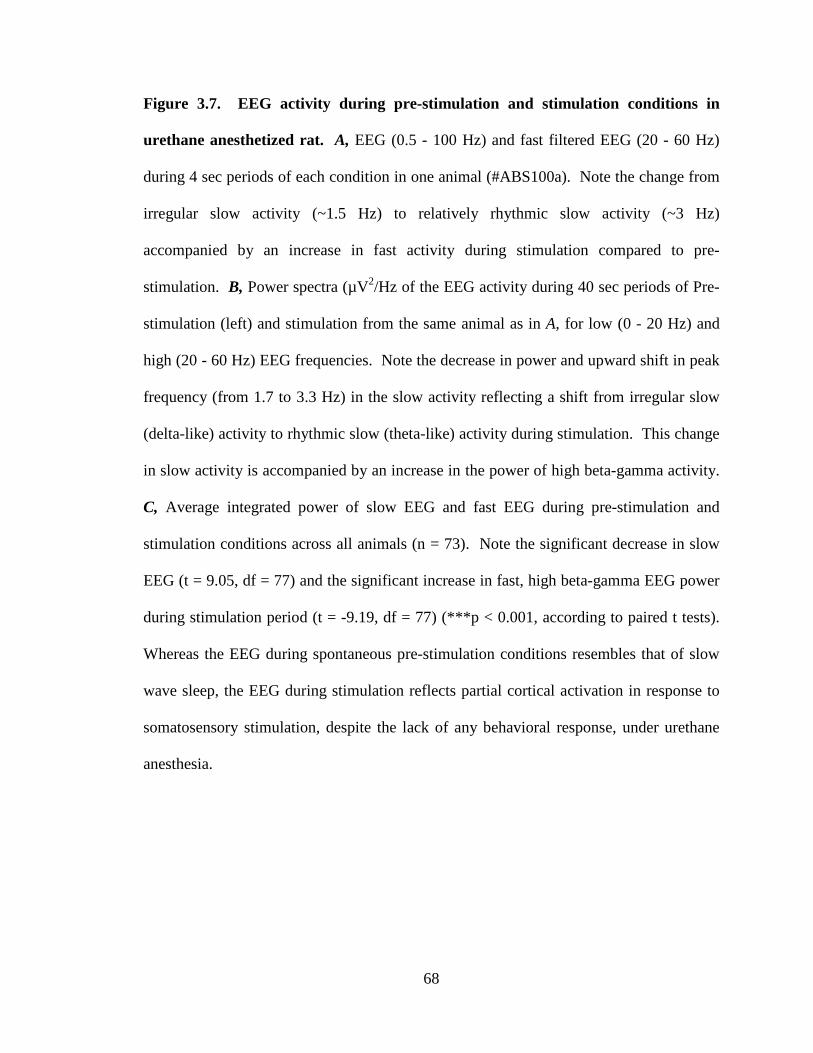
68
Figure 3.7. EEG activity during pre-stimulation and stimulation conditions in
urethane anesthetized rat. A, EEG (0.5 - 100 Hz) and fast filtered EEG (20 - 60 Hz)
during 4 sec periods of each condition in one animal (#ABS100a). Note the change from
irregular slow activity (~1.5 Hz) to relatively rhythmic slow activity (~3 Hz)
accompanied by an increase in fast activity during stimulation compared to pre-
stimulation. B, Power spectra (µV2/Hz of the EEG activity during 40 sec periods of Pre-
stimulation (left) and stimulation from the same animal as in A, for low (0 - 20 Hz) and
high (20 - 60 Hz) EEG frequencies. Note the decrease in power and upward shift in peak
frequency (from 1.7 to 3.3 Hz) in the slow activity reflecting a shift from irregular slow
(delta-like) activity to rhythmic slow (theta-like) activity during stimulation. This change
in slow activity is accompanied by an increase in the power of high beta-gamma activity.
C, Average integrated power of slow EEG and fast EEG during pre-stimulation and
stimulation conditions across all animals (n = 73). Note the significant decrease in slow
EEG (t = 9.05, df = 77) and the significant increase in fast, high beta-gamma EEG power
during stimulation period (t = -9.19, df = 77) (***p < 0.001, according to paired t tests).
Whereas the EEG during spontaneous pre-stimulation conditions resembles that of slow
wave sleep, the EEG during stimulation reflects partial cortical activation in response to
somatosensory stimulation, despite the lack of any behavioral response, under urethane
anesthesia.
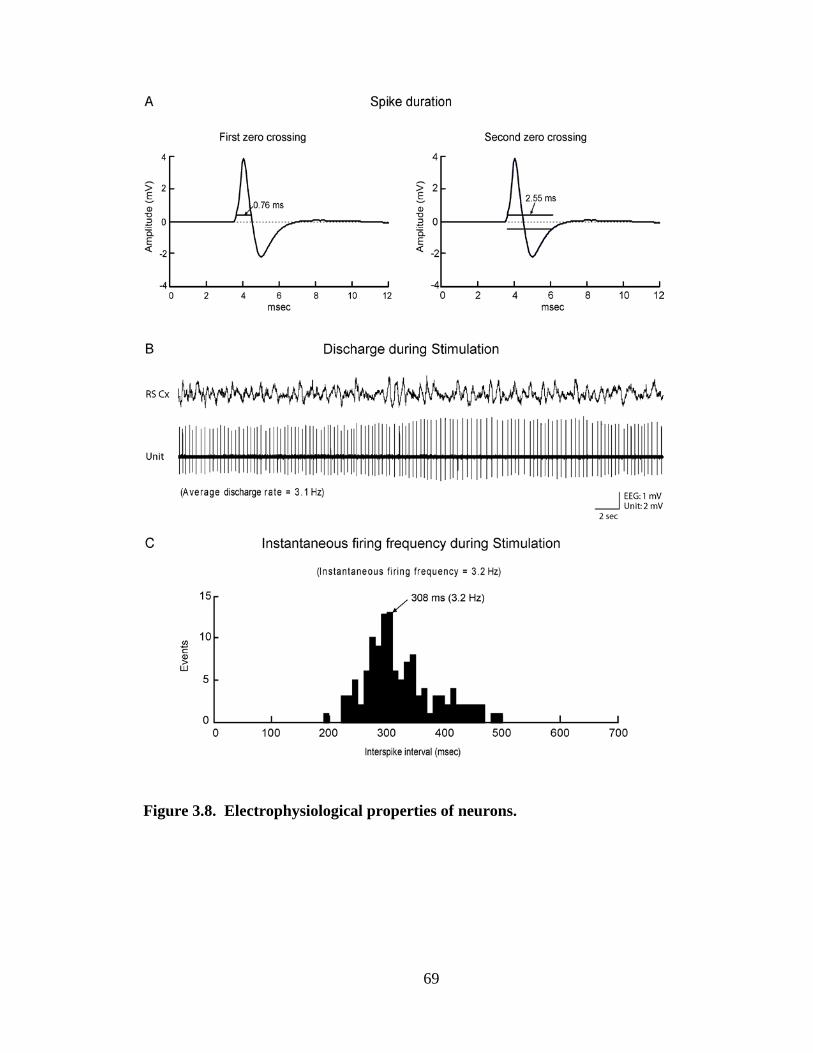
69
Figure 3.8. Electrophysiological properties of neurons.
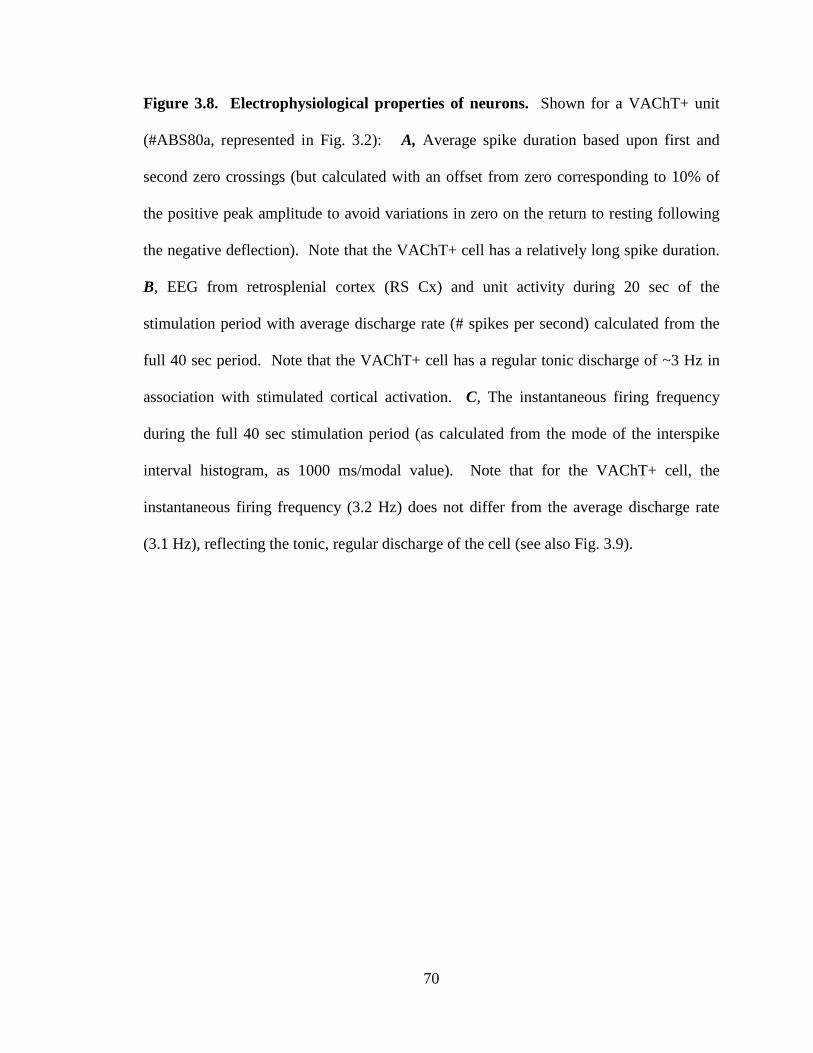
70
Figure 3.8. Electrophysiological properties of neurons. Shown for a VAChT+ unit
(#ABS80a, represented in Fig. 3.2): A, Average spike duration based upon first and
second zero crossings (but calculated with an offset from zero corresponding to 10% of
the positive peak amplitude to avoid variations in zero on the return to resting following
the negative deflection). Note that the VAChT+ cell has a relatively long spike duration.
B, EEG from retrosplenial cortex (RS Cx) and unit activity during 20 sec of the
stimulation period with average discharge rate (# spikes per second) calculated from the
full 40 sec period. Note that the VAChT+ cell has a regular tonic discharge of ~3 Hz in
association with stimulated cortical activation. C, The instantaneous firing frequency
during the full 40 sec stimulation period (as calculated from the mode of the interspike
interval histogram, as 1000 ms/modal value). Note that for the VAChT+ cell, the
instantaneous firing frequency (3.2 Hz) does not differ from the average discharge rate
(3.1 Hz), reflecting the tonic, regular discharge of the cell (see also Fig. 3.9).

71
Figure 3.9. Auto-correlation and cross-correlation with EEG of unit discharge.

72
Figure 3.9. Auto-correlation and cross-correlation with EEG of unit discharge. As
shown for a VAChT+ unit (#ABS80a, shown in Fig. 3.2 and Fig. 3.8): A, EEG (0 – 100
Hz) and Fast filtered EEG (20 – 60 Hz) together with unit activity during 10 sec periods
of pre-stimulation and stimulation conditions. Note for this VAChT+ cell, the unit
discharges minimally and irregularly in single spikes during pre-stimulation, and it
discharges moderately and regularly (~3 Hz) in single spikes during stimulation. In
neither condition is there any apparent relationship to EEG oscillations. B,
Autocorrelation histograms (ACH) of unit activity (with arbitrary voltage units for spikes
on vertical axes) for the full 40 sec recording periods of pre-stimulation (left) and
stimulation (Cannon et al.). Note for the VAChT+ cell, there is minimal activity with no
evidence of rhythmicity in spiking during the pre-stimulation period, whereas there is
moderate activity with evidence of regularity in the tonic spiking (around 300 ms
intervals as also seen in the ISI, Figure 3.8C) during stimulation. C, Spike-triggered
average (STA) of unit-to-EEG (with mV EEG on vertical axes) for the 40 sec periods of
pre-stimulation (left) and stimulation conditions for the actual unit spike train (solid black
line) and randomized spike train (dotted gray line). Note for this VAChT+ cell, there was
no cross-correlation between the unit discharge and EEG activity (as reflected by the
relatively flat lines for the unit spike train and lack of difference from the shuffled spike
train) in either pre-stimulation or stimulation period.
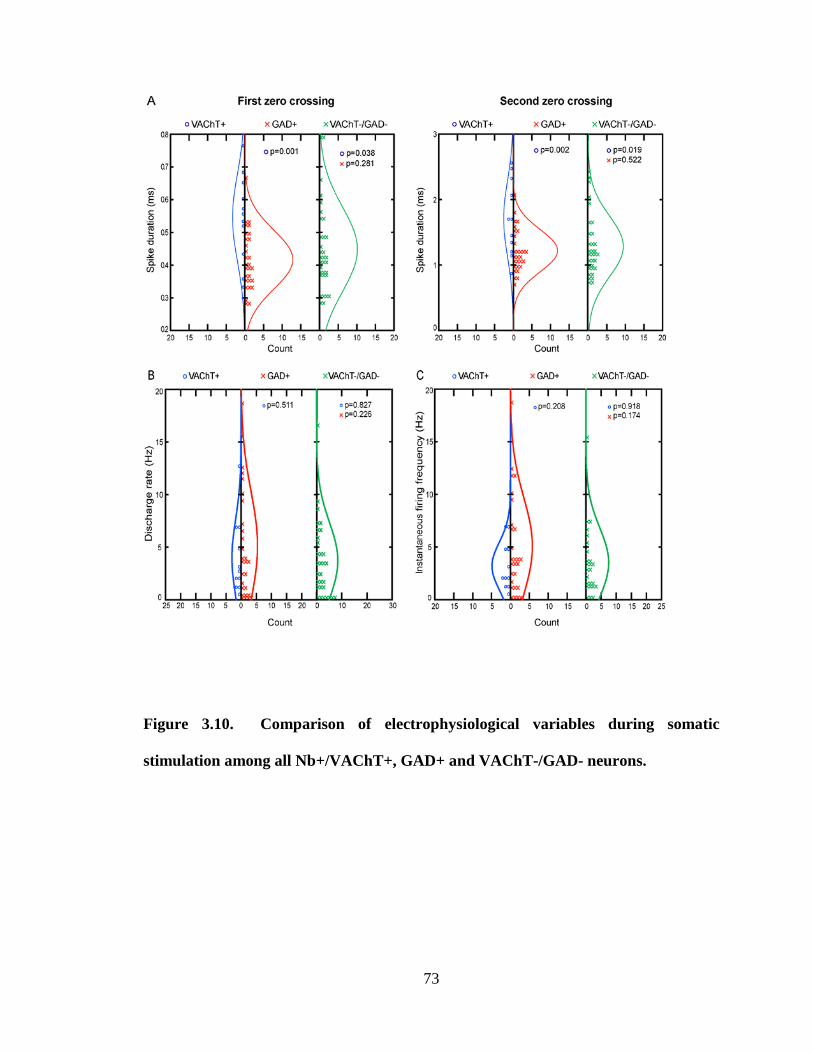
73
Figure 3.10. Comparison of electrophysiological variables during somatic
stimulation among all Nb+/VAChT+, GAD+ and VAChT-/GAD- neurons.

74
Figure 3.10. Comparison of electrophysiological variables during somatic
stimulation among all Nb+/VAChT+, GAD+ and VAChT-/GAD- neurons. A, Left
graph, Average spike duration based upon first zero crossing for VAChT+ (0.55 ± 0.04
ms, mean ± SEM, n = 11; median = 0.55 ms), GAD+ (0.42 ± 0.02 ms, n= 29; median =
0.40 ms) and VAChT-/GAD- cells (0.45 ± 0.02 ms, n = 33; median = 0.41 ms). Right
graph, Average spike duration based upon second zero crossing for VAChT+ (1.80 ±
0.19 ms, mean ± SEM, n = 11; median = 1.69 ms), GAD+ (1.22 ± 0.05 ms, n= 29; median
= 1.14 ms) and VAChT-/GAD- cells (1.28 ± 0.08 ms, n = 33; median = 1.18 ms). Note
that despite a significant difference in means across the three cell groups and between the
cholinergic and noncholinergic cell groups in spike duration (see Table 2 and figure), the
values for each cell group are highly variable and overlap extensively. B, Average
discharge rate (Hz) during stimulation for VAChT+ (3.99 ± 1.09 Hz, n = 11), GAD+
(6.25 ± 1.47 Hz, n = 29) and VAChT-/GAD- cells (4.48 ± 0.97 Hz, n = 33). Note that
there was no significant difference in mean average spike rates across cell types and
extensive overlap in values across the three groups (see Table 3.3 and figure). C,
Average instantaneous firing frequency for VAChT+ (3.19 ± 0.68 Hz, n = 11), GAD+
(6.25 ± 1.46 Hz, n = 28) and VAChT-/GAD- cells (4.27 ± 1.04 Hz, n = 27). Note that
there was no significant difference in mean firing frequencies across the three groups and
extensive overlap (see Table 3.3 and figure).
In attempting to select units according to the range of values of any one or all
three of the electrophysiological variables, the probability of selecting a cholinergic cell
from all recorded cells was only minimally increased from 15% to 26% and that of
selecting a GABAergic cell from all cells was increased from 40% to 48%. Only a small

75
subset of GABAergic and noncholinergic/nonGABAergic cells could be distinguished as
noncholinergic cells according to their high average spike rate (>13 Hz) and firing
frequency (>7 Hz). On the other hand, GABAergic cells could not be distinguished from
noncholinergic/nonGABAergic cells.

76
Figure 3.11. Comparison of electrophysiological variables during somatic
stimulation among Nb+/VAChT+, GAD+ “On” and VAChT-/GAD- “On” cells
which commonly increased their discharge during stimulation.

77
Figure 3.11. Comparison of electrophysiological variables during somatic
stimulation among Nb+/VAChT+, GAD+ “On” and VAChT-/GAD- “On” cells
which commonly increased their discharge during stimulation. A, Left graph,
Average spike duration. based upon first zero crossing for VAChT+ (0.55 ± 0.04 ms,
mean ± SEM, n = 11; median = 0.55 ms), GAD+ “On” (0.42 ± 0.02 ms, , n= 14; median =
0.43 ms) and VAChT-/GAD- “On” cells (0.42 ± 0.02 ms, n = 16; median = 0.41 ms).
Note that despite a significant difference in means across the three groups (F = 6.08, df =
2, 38, p < 0.01), the values for each cell group are highly variable and overlap
extensively. Right graph, based upon second zero crossing for VAChT+ (1.71 ± 0.17 ms,
mean ± SEM, n = 11; median = 1.69 ms), GAD+ “On” (1.18 ± 0.08 ms, n = 14; median =
1.19 ms) and VAChT-/GAD- “On” cells (1.20 ± 0.11 ms, n = 16; median = 1.14 ms).
Note that despite a significant difference in means across the three groups (F = 5.57, df =
2, 38, p < 0.01), the values for each cell group are highly variable and overlap
extensively. B, Average discharge rate during stimulation for VAChT+ (3.99 ± 1.09 Hz,
n = 11), GAD+ “On” (7.31 ± 1.43 Hz, n = 14) and VAChT-/GAD- “On” cells (6.42 ±
1.88 Hz, n = 15). Note that there was no significant difference in mean average spike
rates across cell types (F = 1.06, df = 2, 38, p > 0.05) and extensive overlap in values
across the three groups. C, Average instantaneous firing frequency for VAChT+ (3.19 ±
0.68 Hz, n = 11), GAD+ (6.39 ± 1.34 Hz, n = 14) and VAChT-/GAD- cells (5.24 ± 1.78
Hz, n = 15). Note that there was no significant difference in mean firing frequencies
across the three groups (F = 1.16, df = 2, 38, p > 0.05) and extensive overlap.
In attempting to select units according to the range of values of any one or
all three of the electrophysiological variables, the probability of selecting a cholinergic
78
cell from all “On” cells was only minimally increased from 28% to 41% and that of
selecting a GABAergic cell from all “On” cells was increased from 34% to 47%.
Approximately half the cholinergic cells could be distinguished from other “On” cells by
broad spikes (>1.8 ms). A small subset of GABAergic and
noncholinergic/nonGABAergic “On” cells could be distinguished as noncholinergic cells
according to their high average spike rate (>13 Hz) and firing frequency (>7 Hz).
GABAergic cells could not be distinguished from noncholinergic/nonGABAergic cells.
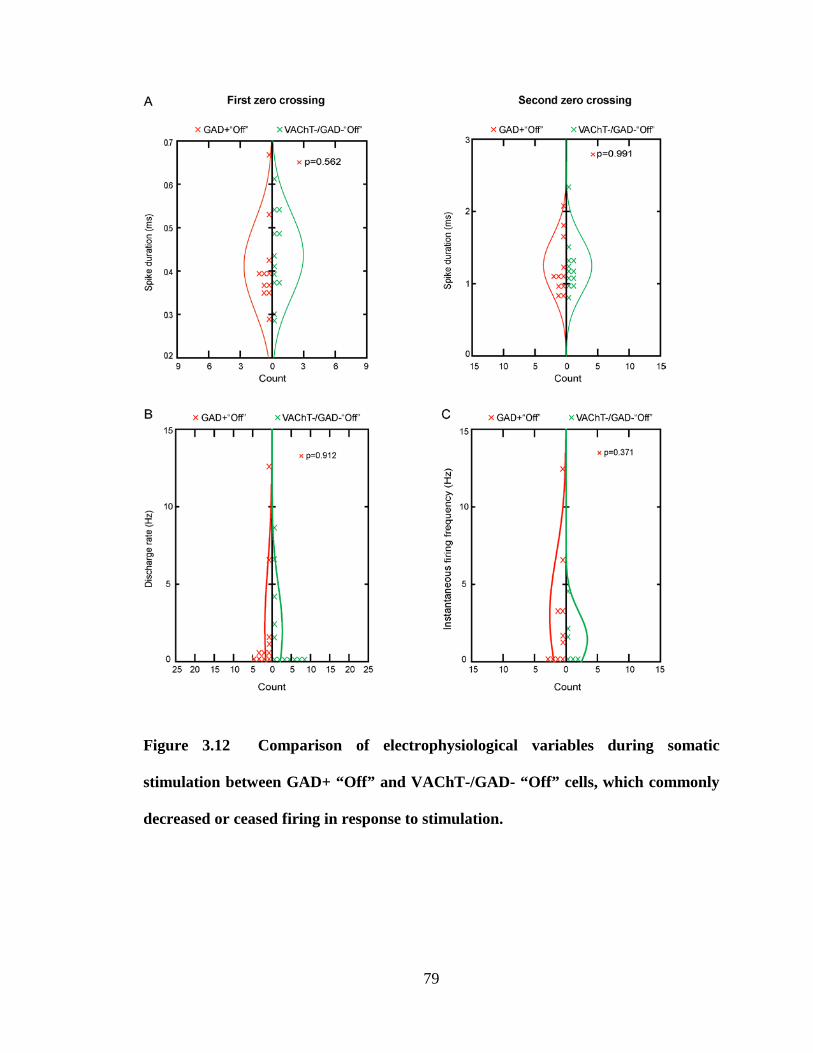
79
Figure 3.12 Comparison of electrophysiological variables during somatic
stimulation between GAD+ “Off” and VAChT-/GAD- “Off” cells, which commonly
decreased or ceased firing in response to stimulation.
80
Figure 3.12 Comparison of electrophysiological variables during somatic
stimulation between GAD+ “Off” and VAChT-/GAD- “Off” cells, which commonly
decreased or ceased firing in response to stimulation. A, Left graph, Average spike
duration based upon first zero crossing for GAD+ “Off” (0.41 ± 0.03 ms, mean ± SEM, n
= 11; median = 0.39 ms) and VAChT-/GAD- “Off” cells (0.44 ± 0.03 ms, s, n = 12;
median = 0.42 ms). Note that there was no significant difference between the means of
the cell groups (t = -0.59, df = 21, p >0.05), and the values for the two groups overlap
extensively. Right graph, average spike duration based upon second zero crossing for
GAD+ “Off” (1.25 ± 0.12 ms, mean ± SEM, n = 11; median = 1.09 ms) and VAChT-
/GAD- “Off” cells (1.25 ± 0.11 ms, n = 12; median = 1.18 ms). Note that there was no
significant difference between the means of the cell groups (t = -0.46, df = 21, p >0.05),
and the values for the two groups overlap extensively. B, Average discharge rate (Hz)
during stimulation for GAD+ “Off” (2.14 ± 1.18 Hz, n = 11) and VAChT-/GAD- “Off”
cells (1.98 ± 0.86 Hz, n = 12). Note that there was no significant difference in mean
average spike rate between cell types (t = 0.11, df = 21, p > 0.05) and extensive overlap in
values between the groups. C, Average instantaneous firing frequency for GAD+ “Off”
(2.99 ± 1.22, Hz, n = 10) and VAChT-/GAD- “Off” cells (1.44 ± 0.72 Hz, n = 6). Note
that there was no significant difference in mean firing frequencies between the groups (t =
0.92, df = 14, p > 0.05) and extensive overlap.
Given a virtually complete overlap in the distributions of the three variables for
the GABAergic and noncholinergic/nonGABAergic “Off” cells, no selection criteria
could be employed to distinguish individual cells.
81
4. Chapter Four
The activity profiles of LDT/PPT neurons during natural sleep-
wake states
82
4.1 Preface
In the last chapter the activity profiles of LDT and PPT cholinergic neurons, in
addition to GABAergic and putative glutamatergic neurons under anesthesia in relation to
cortical activity were described. All LDT/PPT cholinergic neurons were found to
increase their discharge in association with cortical activation evoked by somatic
stimulation, whereas GABAergic and putative glutamatergic neurons were
heterogeneous: they increased or decreased their discharge in relation to cortical
activation.
Although this acute study could suggest the way these neurons might behave
during natural sleep-wake states, where evoked cortical activation could resemble cortical
activation of natural waking (W) and paradoxical sleep (PS) and irregular slow activity
could resemble slow wave activity of natural slow wave sleep (SWS), the activity profiles
of LDT and PPT cholinergic, GABAergic and putative glutamatergic neurons across
natural sleep-wake states remain unknown.
In the present study, by immunohistochemical identification of recorded and
labeled single cells in natural sleeping/waking rats, the activity profiles of LDT and PPT
cholinergic, GABAergic and putative glutamatergic neurons across natural sleep-wake
states in terms of state dependency and the relationship with cortical and behavioral
activities relevant to sleep-wake states are described.
83
4.2 Results
4.2.1 Identification, localization and classification of cell groups
A total of 70 units were recorded in the pontomesencephalic tegmentum across a
full sleep-waking cycle including the three major states, active wake (aW), SWS and PS
and three transitional states, quite wake (qW), transition to SWS (tSWS) and transition to
PS (tPS). According to their sleep-wake discharge profile, neurons comprised different
functional sub-groups: (1) those that discharge maximally during both W and PS as
W/PS-max active cells (n = 32), (2) those that discharge minimally during waking and
progressively raised their discharge during sleep to reach their maximal discharge during
PS as PS-max active cells (n = 21), (3) those that discharged maximally during waking as
W-max active cells (n = 13), (4) those that did not show significant variation in their
discharge across sleep-wake states as wsp-equivalent cells (n = 3), and (5) one that
discharged maximally during SWS as SWS-max active cell (n = 1). Of all units recorded,
60 could be submitted to juxtacellular labelling protocol at the end of the sleep-wake
cycle, and 47 of these (~78%) were successfully labelled with Nb (Nb+). Of these 47
Nb+ cells, 32 Nb+ cells were located within the pontomesencephalic cholinergic cell
area, whereas 15 were located in the surrounding central gray (CG, n = 6), pontine
reticular nucleus, oral part (PnO, n = 3), deep mesencephalic reticular nucleus (DpMe, n
= 2), dorsomedial tegmental nucleus (DMT, n = 1) or subcoeruleus (SubC, n = 1).
Within the cholinergic cell area, the Nb+ cells were distributed across the rostrocaudal
extent of the LDT (n = 17), its ventral extension beneath the central grey (SubLDT) (n =
11) or the medial part of the PPT (mPPT) (n = 4) (Fig 4.1). Of the 32 Nb+ cells, one was
immuno-positive for VAChT (Nb+/VAChT+), 7 were immuno-positive for GAD
84
(Nb+/GAD+) and 24 were immuno-negative for both VAChT and GAD (Nb+/VAChT-
/GAD-) (Table 4.1). Morphologically, the majority of cells were medium-to-large in
size, including the Nb+/VAChT+ cell, but both Nb+/GAD+ and Nb+/VAChT-/GAD-
cells included a minority of small sized cells (Table 4.1). Physiologically, according to
instantaneous firing frequency, the majority of cells were fast spiking (>14.5 Hz), yet a
minority, including the Nb+/VAChT+ cell was slow (<14.5 Hz) (Table 4.1). The cells
were very heterogeneous in their firing pattern including tonic and phasic patterns. The
Nb+/VAChT+ cell and many Nb+/VAChT-/GAD- cells fired in a tonic regular manner,
whereas the Nb+/GAD+ cells fired tonically in an irregular manner or phasically. Phasic
firing occurred in either a cluster (<80 Hz) or burst (>80 Hz) mode among these cells
(Table 4.1). According to their sleep-wake discharge profile, half of the Nb+ cells in the
LDT/PPT were W/PS-max active cells (n = 16), 37.5% PS-max active cells (n = 12) and
12.5% W-max active cells (n = 4) (Table 4.1). Neither wsp-equivalent nor SWS-max
active cells were found labelled in the LDT/PPT area. Based on their anatomical and
physiological features, the Nb+/VAChT+, Nb+/GAD+ and Nb+/VAChT-/GAD- cells
could not be clearly distinguished (Table 4.1).
4.2.2 W/PS-max active neurons
The W/PS-max active neurons represent the largest sub-group found in the
LDT/PPT area (n = 16). They discharged maximally during aW and PS than during
SWS. This discharge profile was the most common profile for all three, Nb+/VAChT+,
Nb+/GAD+ and Nb+/VAChT-/GAD- cell groups.
85
4.2.2.1 The Nb+/VAChT+ neuron
The Nb+/VAChT+ neuron (n = 1), represented ~6 % of the W/PS-max sub-group
(n = 16). As typical of this sub-group, the cell discharged maximmally during aW and PS
than during SWS and it reached its highest rate during PS. Across sleep-wake states, its
discharge was positively correlated with gamma EEG amplitude (r = 0.37, p < 0.05, n =
1) (Fig. 4.3A) and with theta activity (r = 0.92, p < 0.005, n = 1). Across sleep-wake
states, its firing rate was strongly changed. As shown for CBS28u03 in Fig. 4.4, the unit
discharged at slow rates during aW (1.90 Hz), progressively decreased rates in qW to
discharge minimally during the tSWS and to be virtually silent during SWS (0.06 Hz),
increased back significantly its firing during the tPS to reach maximal rates during PS
(9.70 Hz). The cholinergic cell was a slow firing neuron with a typical tonic regular
pattern since its instantaneous firing frequency (10.1 Hz) was almost equivalent to its
mean discharge rate (9.7 Hz) (Table 4.2). It had a relatively long duration spike (1.9 ms).
4.2.2.2 Nb+/GAD+ neurons
Nb+/GAD+ neurons (n = 4) represented 25% of the W/PS-max sub-group (n =
16). They discharged at higher rates during aW and PS compared to SWS. The majority
(n = 3) reached their maximal discharge during PS (as was the case for the cell CBS37u02
shown in Fig. 4.5). One, however, discharged during aW. They showed a strong
modulation of their discharge rate across sleep-wake states. Their average discharge rate
was relatively high during aW (4.67 ± 3.16 Hz); it markedly decreased to be minimal
during tSWS and SWS (0.22 ± 0.17 Hz) and then increased progressively during tPS to
be maximal during PS (9.93 ± 5.18 Hz) (Fig. 4.3A). Across sleep-wake states, their
average discharge rate was positively correlated with gamma EEG activity in 3/4 cells (r

86
= 0.75 ± 0.07, p < 0.005) (Fig. 4.3A) and with theta activity in 3/4 cells (r = 0.74 ± 0.11,
p < 0.005, n = 3). Most of them were fast firing neurons (n = 3). Their mean
instantaneous firing frequency (52.93 ± 21.21 Hz) was much higher than the average
discharge rate (12.99 ± 4.46 Hz) (Table 4.2), which reflected a tonic irregular firing
pattern (n = 1) or phasic firing pattern which could be either a cluster pattern (n = 1) or a
bursting pattern (n = 2). They had, on average, a relatively narrow spike duration (1.03 ±
0.08 ms) which significantly differed from the Nb+/VAChT-/GAD- W/PS-max neurons
(1.51 ± 0.11 ms) (Table 4.2). However, spike duration measurements were found to
overlap extensive among these two sub-groups (Fig. 4.9B).
4.2.2.3 Nb+/VAChT-/GAD- neurons
Nb+/VAChT-/GAD- neurons (n = 11) represented 69% of the W/PS-max sub-
group (n = 16). They discharged at their highest rates during aW and PS in association
with cortical activation. Most cells (n = 7) reached their maximal discharge during PS (as
was the case for the cell CBS22u01 shown in Fig. 3.6). Some others (n = 4), however,
reached their maximal discharge during aW. They showed a strong modulation of their
discharge rate across sleep-wake states. Their mean average discharge rate was relatively
high during aW (4.99 ± 1.33 Hz) and progressively decreased during tSWS to be
minimum during SWS (0.34 ± 0.17 Hz), and then progressively increased during tPS to
be maximal during PS (8.77 ± 2.13 Hz) (Fig. 4.3A). Across sleep-wake states, their
average discharge rate was significantly and positively correlated with gamma EEG
activity in all cells (r = 0.40 ± 0.03, p < 0.05, n = 11) (Fig. 3.3A) and with theta activity
in 9/11 cells (r = 0.69 ± 0.07, p < 0.005, n = 9). Some VAChT-/GAD- W/PS- max cells
were fast firing (n = 6), but others were slow firing (n = 5). They included cells with
87
different firing patterns, from tonic regular (n = 5) to tonic irregular (n = 2) to phasic
cluster (n = 4). Their mean instantaneous firing frequency was moderately high (25.47 ±
6.66 Hz) and higher than the average discharge rate (9.87 ± 2.11 Hz) (Table 4.2). They
had, on average, a relatively medium spike duration (1.51 ± 0.11 ms), which significantly
differed from the Nb+/GAD+ W/PS-max sub-group (1.03 ± 0.08 ms) (Table 4.2).
4.2.3 PS-max active neurons
The PS-max active neurons represent the second most numerous sub-group found
in the LDT/PPT area (n = 12). They discharged at their highest rates during PS in
association with muscle atonia. They included Nb+/GAD+ and Nb+/VAChT-/GAD- cell
groups.
4.2.3.1 Nb+/GAD+ neurons
Nb+/GAD+ neurons (n = 3) represented 25% of the PS-max sub-group (n = 12).
Across the sleep-wake cycle, they discharged at their lowest rate during aW (3.94 ± 0.08
Hz), they increased slightly their discharge during SWS (4.70 ± 0.79 Hz) and then further
increased their discharge during tPS to reach their maximal rates during PS (18.99 ± 1.08
Hz) (Fig. 4.3B). Their average discharge rate was negatively correlated with EMG
amplitude across sleep-wake states (r = -0.54 ± 0.12, p < 0.01, n = 3) (Fig. 4.3B). They
were all fast firing cells, and their mean instantaneous firing frequency (46.50 ± 15.21
Hz) was largely greater than their average discharge rate (18.99 ± 1.08 Hz) (Table 4.2),
reflecting a tonic irregular firing pattern (n = 2) or a phasic cluster firing pattern (n = 1,
cell CBS28u04 shown in Fig. 4.7C with rhythmic firing in association with theta activity
during PS). They had, on average, a relatively narrow spike width (0.92 ± 0.11 ms),
88
which did not differ significantly from the other PS-max sub-group (1.23 ± 0.11 ms)
(Table 4.2, Fig. 4.9C).
4.2.3.2 Nb+/VAChT-/GAD- neurons
Nb+/VAChT-/GAD- neurons (n = 9) represented 75% of the PS-max sub-group (n
= 12). As typical of PS-max cells (as shown for the cell CBS27u01 in Fig. 4.8), they
discharged at their lowest rate during aW (2.42 ± 0.84 Hz), progressively increased their
discharge during qW and tSWS to be higher during SWS (4.98 ± 1.18 Hz) and then
increased further their discharge during tPS to reach their maximal rates during PS (17.03
± 4.13 Hz) (Fig. 4.3B). Their average discharge rate was significantly, negatively
correlated with EMG amplitude across sleep-wake states in 6/9 cells (r = -0.49 ± 0.05, p <
0.01, n = 6) (Fig. 4.3B). They were all fast firing cells and included cells with different
firing patterns, from tonic regular (n = 2) to phasic cluster (n = 4) to phasic burst (n = 3).
Their mean instantaneous firing frequency was faster (77.69 ± 20.53 Hz) than the average
discharge rate (17.08 ± 4.13 Hz) (Table 4.2). They had, on average, a relatively medium
spike duration (1.23 ± 0.11 ms), which did not differ significantly from the other PS-max
sub-group (0.92 ± 0.11 ms) (Table 4.2, Fig. 4.9C).
4.2.4 W-max active neurons
W-max active neurons represented the smallest sub-group in the LDT/PPT area (n
= 4). This sub-group comprised only VAChT-/GAD- cells. They discharged at their
highest rates during aW (1.27 ± 0.68 Hz), then decreased their discharge rate
progressively through SWS (0.22 ± 0.04 Hz) to reach minimum rates during PS (0.17 ±
0.14 Hz) (Fig. 4.3C). Their average discharge rate was significantly, positively
89
correlated with EMG amplitude across sleep-wake states in 2/4 cells (r = 0.45 ± 0.12, p <
0.01, n = 2) (Fig. 4.3C). They were all slow firing cells. They included cells with either
tonic regular (n = 1) or phasic cluster (n = 2) firing pattern (representative cell not
showed). Their mean instantaneous firing frequency (7.01 ± 3.36 Hz) and their average
discharge rate (1.27 ± 0.68 Hz) were slow (Table 4.2). They had, on average, a relatively
large spike duration (1.78 ± 0.15 ms) (Table 4.2).

90
4.3 Tables and Figures
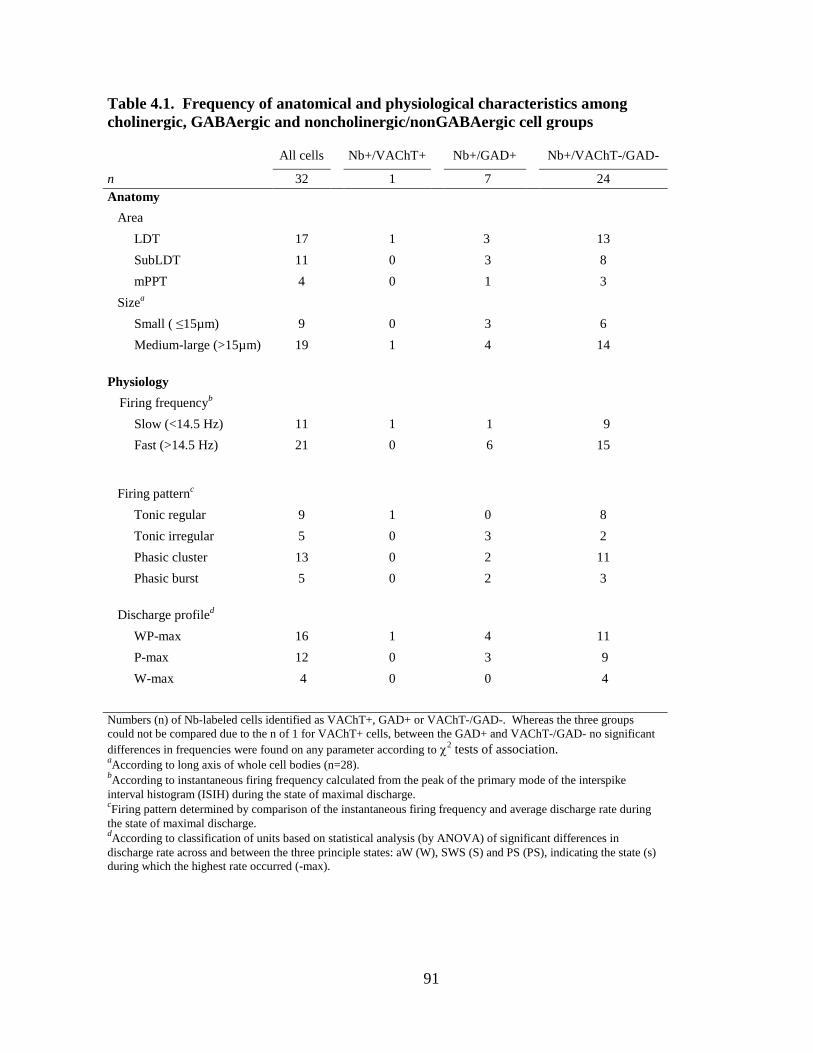
91
Table 4.1. Frequency of anatomical and physiological characteristics among cholinergic, GABAergic and noncholinergic/nonGABAergic cell groups
All cells Nb+/VAChT+ Nb+/GAD+ Nb+/VAChT-/GAD-
n 32 1 7 24 Anatomy Area LDT 17 1 3 13 SubLDT 11 0 3 8 mPPT 4 0 1 3 Sizea Small ( ≤15µm) 9 0 3 6 Medium-large (>15µm) 19 1 4 14 Physiology
Firing frequencyb Slow (<14.5 Hz) 11 1 1 9 Fast (>14.5 Hz) 21 0 6 15
Firing patternc Tonic regular 9 1 0 8 Tonic irregular 5 0 3 2 Phasic cluster 13 0 2 11 Phasic burst 5 0 2 3 Discharge profiled WP-max 16 1 4 11 P-max 12 0 3 9 W-max 4 0 0 4 Numbers (n) of Nb-labeled cells identified as VAChT+, GAD+ or VAChT-/GAD-. Whereas the three groups could not be compared due to the n of 1 for VAChT+ cells, between the GAD+ and VAChT-/GAD- no significant differences in frequencies were found on any parameter according to χ2 tests of association. aAccording to long axis of whole cell bodies (n=28). bAccording to instantaneous firing frequency calculated from the peak of the primary mode of the interspike interval histogram (ISIH) during the state of maximal discharge. cFiring pattern determined by comparison of the instantaneous firing frequency and average discharge rate during the state of maximal discharge. dAccording to classification of units based on statistical analysis (by ANOVA) of significant differences in discharge rate across and between the three principle states: aW (W), SWS (S) and PS (PS), indicating the state (s) during which the highest rate occurred (-max).
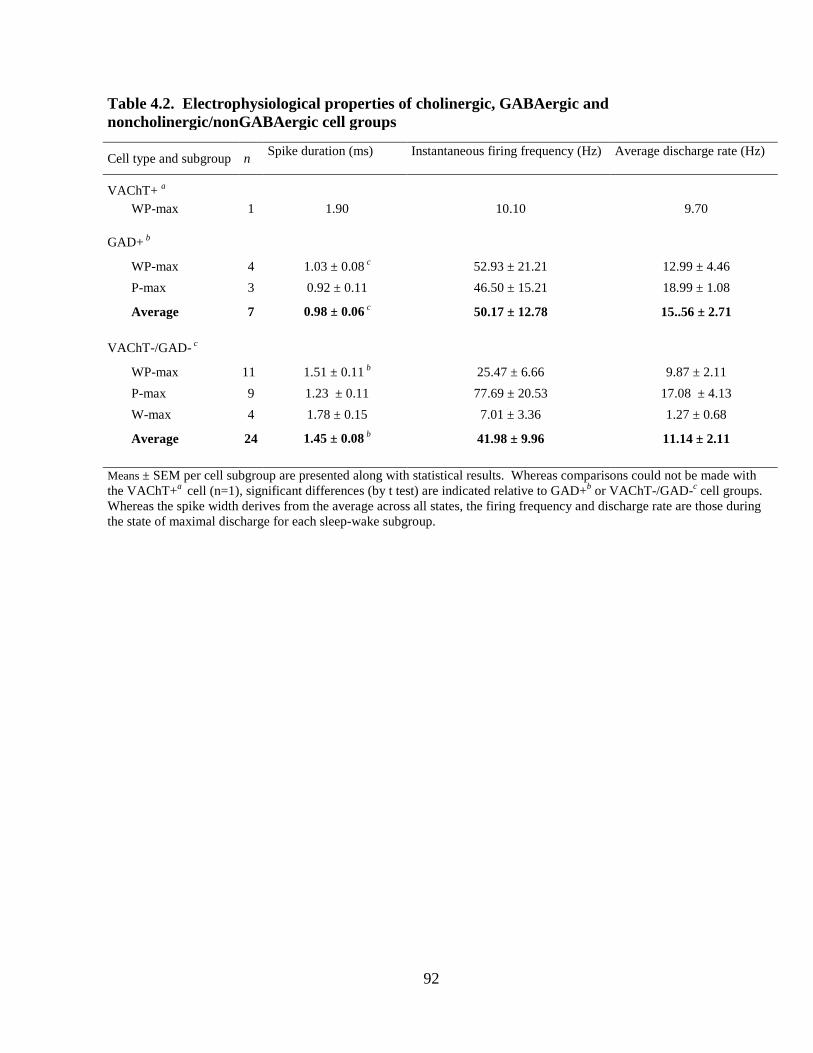
92
Table 4.2. Electrophysiological properties of cholinergic, GABAergic and noncholinergic/nonGABAergic cell groups
Cell type and subgroup n Spike duration (ms)
Instantaneous firing frequency (Hz)
Average discharge rate (Hz)
VAChT+ a WP-max 1 1.90 10.10 9.70
GAD+ b WP-max 4 1.03 ± 0.08 c 52.93 ± 21.21 12.99 ± 4.46 P-max 3 0.92 ± 0.11 46.50 ± 15.21 18.99 ± 1.08
Average 7 0.98 ± 0.06 c 50.17 ± 12.78 15..56 ± 2.71
VAChT-/GAD- c WP-max 11 1.51 ± 0.11 b 25.47 ± 6.66 9.87 ± 2.11 P-max 9 1.23 ± 0.11 77.69 ± 20.53 17.08 ± 4.13 W-max 4 1.78 ± 0.15 7.01 ± 3.36 1.27 ± 0.68
Average 24 1.45 ± 0.08 b 41.98 ± 9.96 11.14 ± 2.11 Means ± SEM per cell subgroup are presented along with statistical results. Whereas comparisons could not be made with the VAChT+a cell (n=1), significant differences (by t test) are indicated relative to GAD+b or VAChT-/GAD-c cell groups. Whereas the spike width derives from the average across all states, the firing frequency and discharge rate are those during the state of maximal discharge for each sleep-wake subgroup.
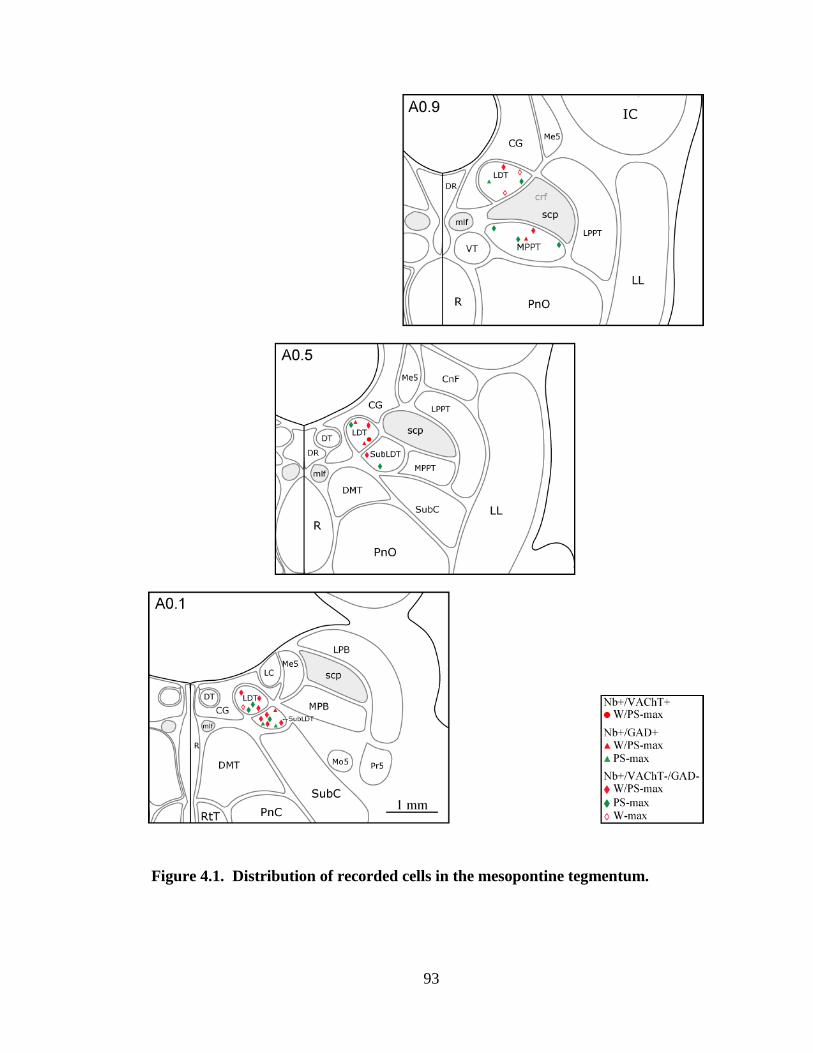
93
Figure 4.1. Distribution of recorded cells in the mesopontine tegmentum.
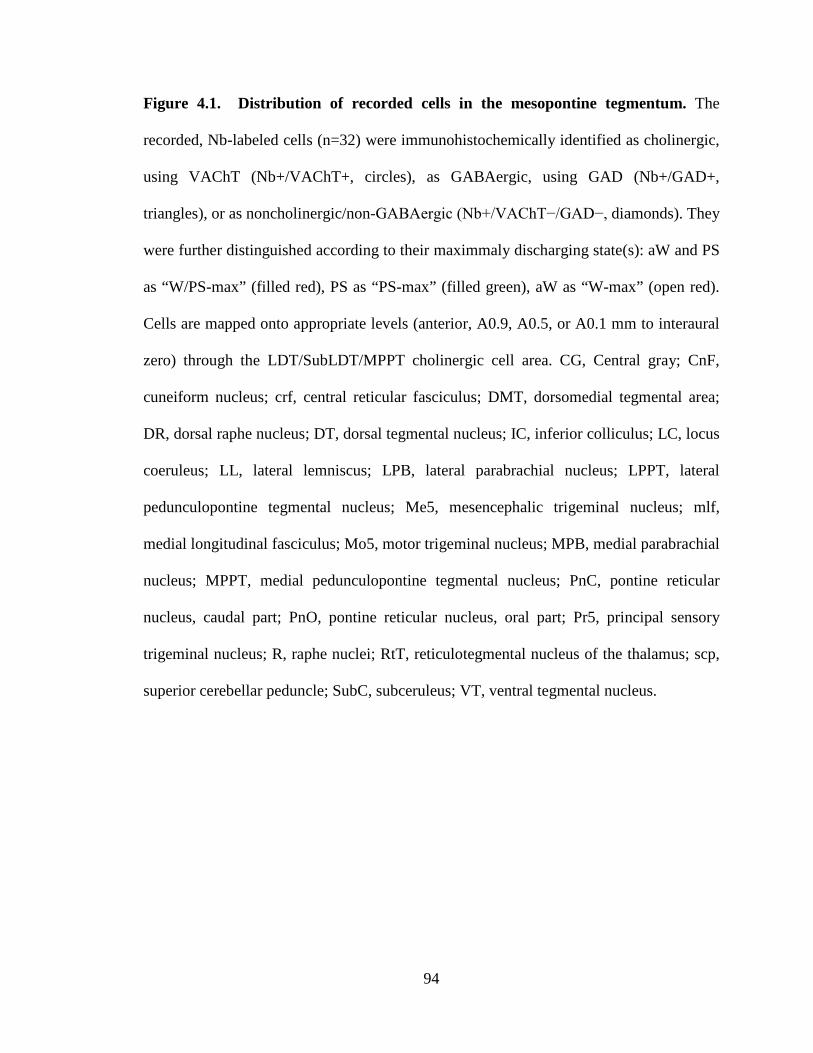
94
Figure 4.1. Distribution of recorded cells in the mesopontine tegmentum. The
recorded, Nb-labeled cells (n=32) were immunohistochemically identified as cholinergic,
using VAChT (Nb+/VAChT+, circles), as GABAergic, using GAD (Nb+/GAD+,
triangles), or as noncholinergic/non-GABAergic (Nb+/VAChT−/GAD−, diamonds). They
were further distinguished according to their maximmaly discharging state(s): aW and PS
as “W/PS-max” (filled red), PS as “PS-max” (filled green), aW as “W-max” (open red).
Cells are mapped onto appropriate levels (anterior, A0.9, A0.5, or A0.1 mm to interaural
zero) through the LDT/SubLDT/MPPT cholinergic cell area. CG, Central gray; CnF,
cuneiform nucleus; crf, central reticular fasciculus; DMT, dorsomedial tegmental area;
DR, dorsal raphe nucleus; DT, dorsal tegmental nucleus; IC, inferior colliculus; LC, locus
coeruleus; LL, lateral lemniscus; LPB, lateral parabrachial nucleus; LPPT, lateral
pedunculopontine tegmental nucleus; Me5, mesencephalic trigeminal nucleus; mlf,
medial longitudinal fasciculus; Mo5, motor trigeminal nucleus; MPB, medial parabrachial
nucleus; MPPT, medial pedunculopontine tegmental nucleus; PnC, pontine reticular
nucleus, caudal part; PnO, pontine reticular nucleus, oral part; Pr5, principal sensory
trigeminal nucleus; R, raphe nuclei; RtT, reticulotegmental nucleus of the thalamus; scp,
superior cerebellar peduncle; SubC, subceruleus; VT, ventral tegmental nucleus.
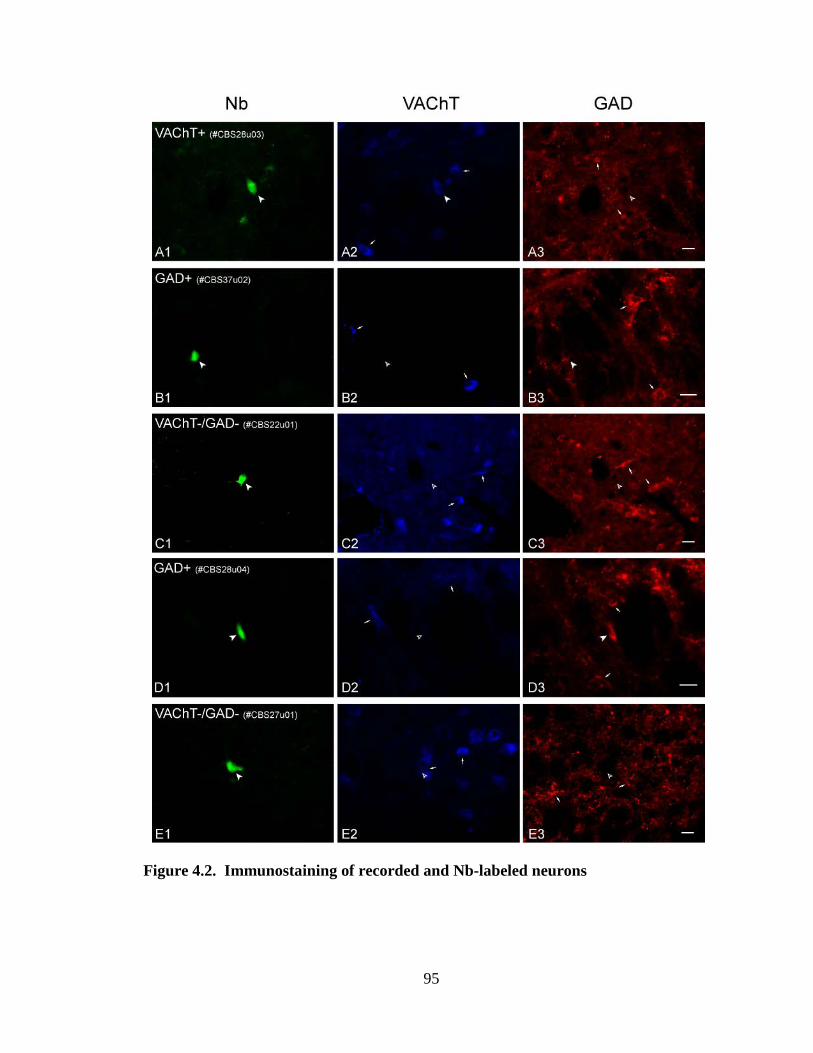
95
Figure 4.2. Immunostaining of recorded and Nb-labeled neurons
96
Figure 4.2. Immunostaining of recorded and Nb-labeled neurons. Five Nb+ cells
(green, filled arrowheads are shownA-E in plates A1 to E1 and correspond to recorded
units representative of the five major subgroups and presented in Figs. 4.4 – 4.8,
respectively. A1 Unit (#CBS28u03) classified as “W/PS-max” was immunopositive for
VAChT (A2, blue, filled arrowhead), immunonegative for GAD (A3, red, open
arrowhead), and located among other VAChT+ and GAD+ cells (small arrows) in the
LDT. B1 Unit (#CBS37u02), “W/PS-max”, was negative for VAChT (B2, blue, open
arrowhead), positive for GAD (B3, red, filled arrowhead), and located among other
VAChT+ and GAD+ cells (small arrows) in the SubLDT. C1 Unit (#CBS22u01),
“W/PS-max”, was negative for VAChT (C2, blue, open arrowhead) and GAD (C3, red,
open arrowhead) and located among other VAChT+ and GAD+ cells (small arrows)in the
LDT. D1 Unit (#CBS28u04), “PS-max”, was negative for VAChT (D2, blue, open
arrowhead),positive for GAD (D3, red, filled arrowhead) and located near other VAChT+
and GAD+ cells (small arrows) in the SubLDT. E1 Unit (#CBS27u01), “PS-max”, was
negative for VAChT (E2, blue, open arrowhead) and GAD (E3, red, open arrowhead) and
located near other VAChT+ and GAD+ cells (small arrows) in the LDT. Scale bars, 20
µm.

97
Figure 4.3. Mean discharge rates of different cell types and subgroups across sleep-
wake stages in association with EEG and EMG activity.
98
Figure 4.3. Mean discharge rates of different cell types and subgroups across sleep-
wake stages in association with EEG and EMG activity. A, Discharge rates of
cholinergic (Nb+/VAChT+) (n=1), GABAergic (Nb+/GAD+) (n=4) and putative
glutamatergic (Nb+/VAChT-/GAD-) (n=11) neurons (mean of average rates per stage per
cell) that discharged maximally during aW and PS in positive correlation with gamma
EEG activity (normalized average amplitude from 9 W/PS-max units) across sleep-wake
stages. B, Discharge rates of GABAergic (n=3) and putative glutamatergic (n=9) neurons
that discharged maximally during PS in negative correlation with EMG amplitude
(normalized average amplitudes from 7 PS-max units) across sleep-wake stages. C,
Discharge rates of putative glutamatergic neurons (n=4) that discharged maximally during
aW in positive correlation with EMG amplitude (normalized average amplitudes from 3
W/PS-max units) across sleep-wake stages.

99
W/PS-max: Nb+/VAChT+ neuron (#CBS28u03)
Figure 4.4. Discharge of cholinergic W/PS-max active unit across sleep-wake states.

100
Figure 4.4. Discharge of cholinergic W/PS-max active unit across sleep-wake states.
Data from Nb-labeled cell (#CBS28u03) that was immunopositive for VAChT (Fig.
4.2A). A, Sleep-wake recording, scored (per 10 sec epoch) for sleep-wake stages, is
shown with simultaneous unit spike rate (Hz), EEG frequency and amplitude (µV/Hz
with frequency on y axis and amplitude scaled according to color from blue to red) and
EMG amplitude (arbitrary units) over the recording session. Representative epochs
indicated by dashed vertical lines of aW (red), SWS and PS (green) are shown in B. B,
Polygraphic records from 10 sec epochs (indicated by horizontal lines in A) of the unit
together with EEG and EMG activity during aW (1), SWS (2) and PS (3). C, Bar graph
showing mean spike rate (Hz) of the unit across sleep-wake stages. Note that during aW,
the unit discharged tonically at moderate rate with prominence of fast EEG activity,
ceased firing during SWS in association with slow EEG activity (~1 – 4 Hz), and
discharged maximally and tonically to reach its highest rates during PS in association
with prominent theta along with fast EEG activity. Abbreviations: OB, olfactory bulb;
PF, prefrontal cortex; RS, retrosplenial cortex; aW, active wake; qW, quiet wake; tSWS,
transition to slow wave sleep; SWS, slow wave sleep; tPS, transition to paradoxical sleep;
PS, paradoxical sleep.
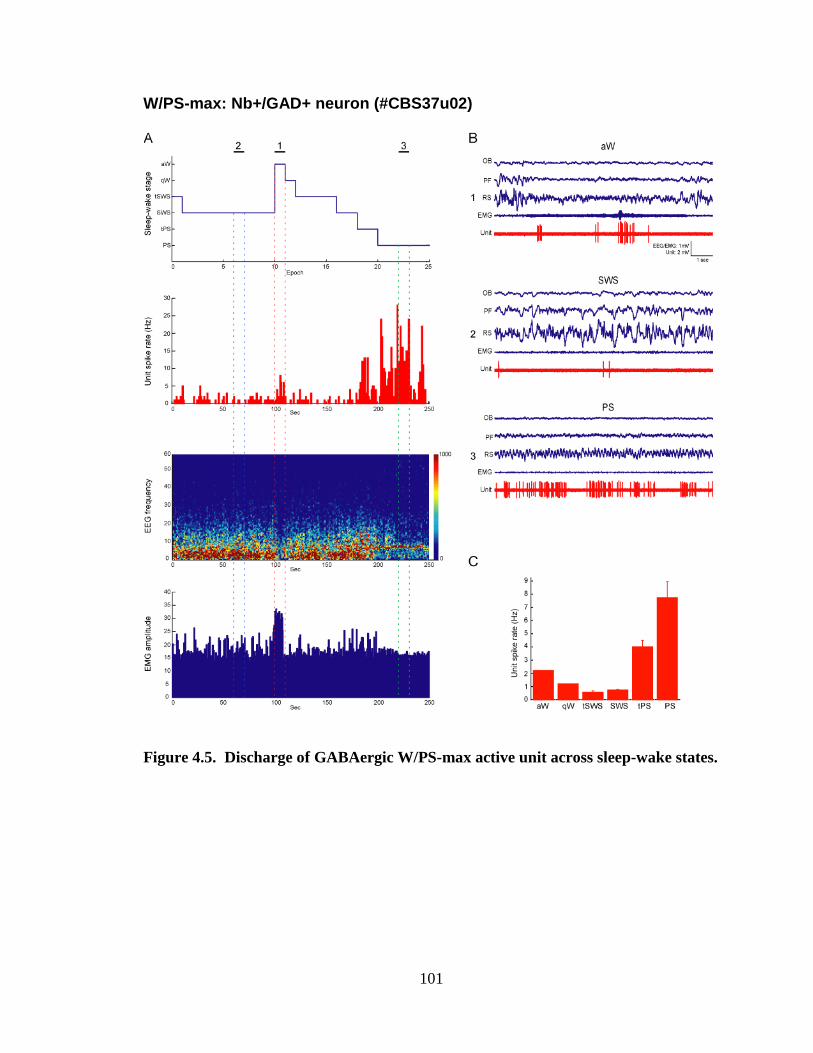
101
W/PS-max: Nb+/GAD+ neuron (#CBS37u02)
Figure 4.5. Discharge of GABAergic W/PS-max active unit across sleep-wake states.
102
Figure 4.5. Discharge of GABAergic W/PS-max active unit across sleep-wake states.
Data from Nb-labeled cell (#CBS37u02) that was immunoreactive for GAD (Fig. 4.2B).
Note that the unit discharged moderately and phasically during aW, minimally during
SWS and maximally during PS in an irregular phasic manner of clustered spikes when the
EEG showed theta activity (~4.5 - 8 Hz) along with fast activity. For details and
abbreviations, see Fig. 4.4.

103
W/PS-max: Nb+/VAChT-/GAD- neuron (#CBS22u01)
Figure 4.6. Discharge of putative glutamatergic W/PS-max active unit across sleep-
wake states.

104
Figure 4.6. Discharge of putative glutamatergic W/PS-max active unit across sleep-
wake states. Data from Nb-labeled cell (#CBS22u01) that was immunonegative for both
VAChT and GAD (Fig. 4.2C). Note that the unit discharged moderately during epochs of
aW when the EEG showed theta (~4.5 - 8 Hz) along with fast activity, was relatively
quiescent during SWS associated with slow EEG activity and discharged maximally and
tonically to reach its highest rates during PS in association with prominent theta along
with fast EEG activity. For details and abbreviations, see Fig. 4.4.
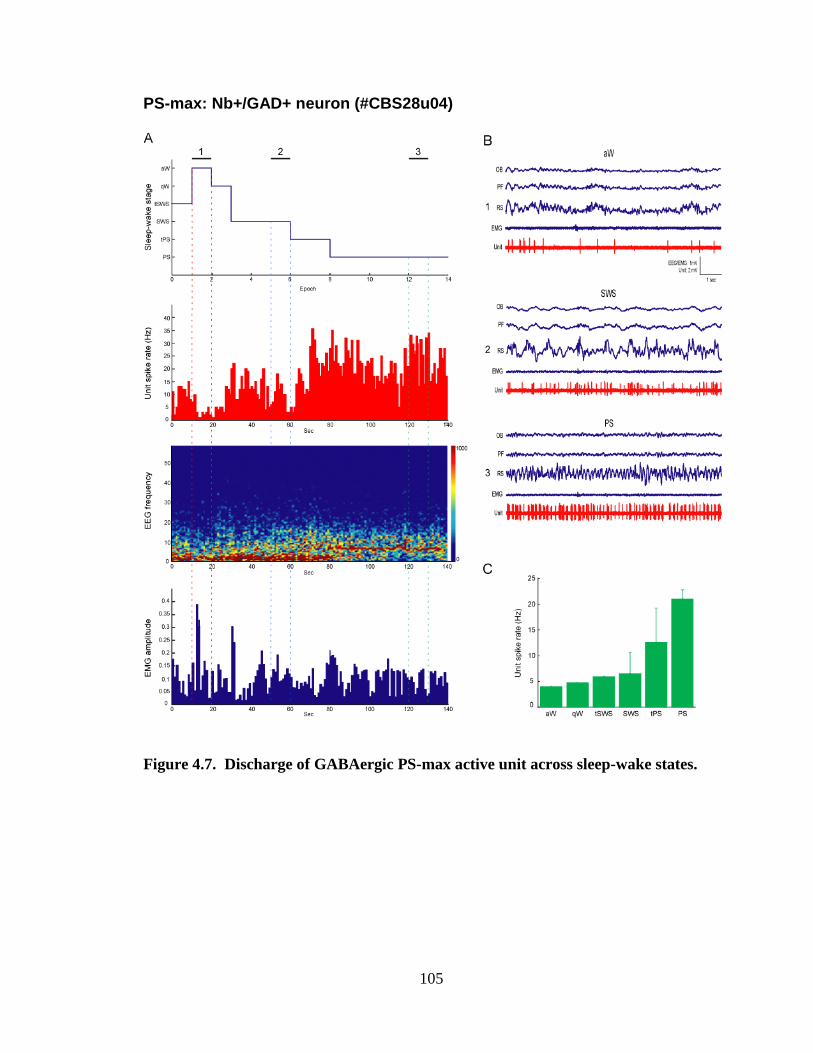
105
PS-max: Nb+/GAD+ neuron (#CBS28u04)
Figure 4.7. Discharge of GABAergic PS-max active unit across sleep-wake states.
106
Figure 4.7. Discharge of GABAergic PS-max active unit across sleep-wake states.
Data from Nb-labeled cell (#CBS28u04) that was immunostained for GAD (Fig. 4.2D).
Note that the unit discharged at relatively low rates during aW with fast EEG activity and
high EMG amplitude, increased firing during SWS in association with slow delta EEG
activity and low muscle EMG and discharged maximally during PS in a phasic cluster
pattern when theta and fast EEG activity was accompanied by muscle atonia. For details
and abbreviations, see Fig. 4.4.

107
PS-max: Nb+/VAChT-/GAD- neuron (#CBS27u01)
Figure 4.8 Discharge of putative glutamatergic PS-max active unit across sleep-wake
states.
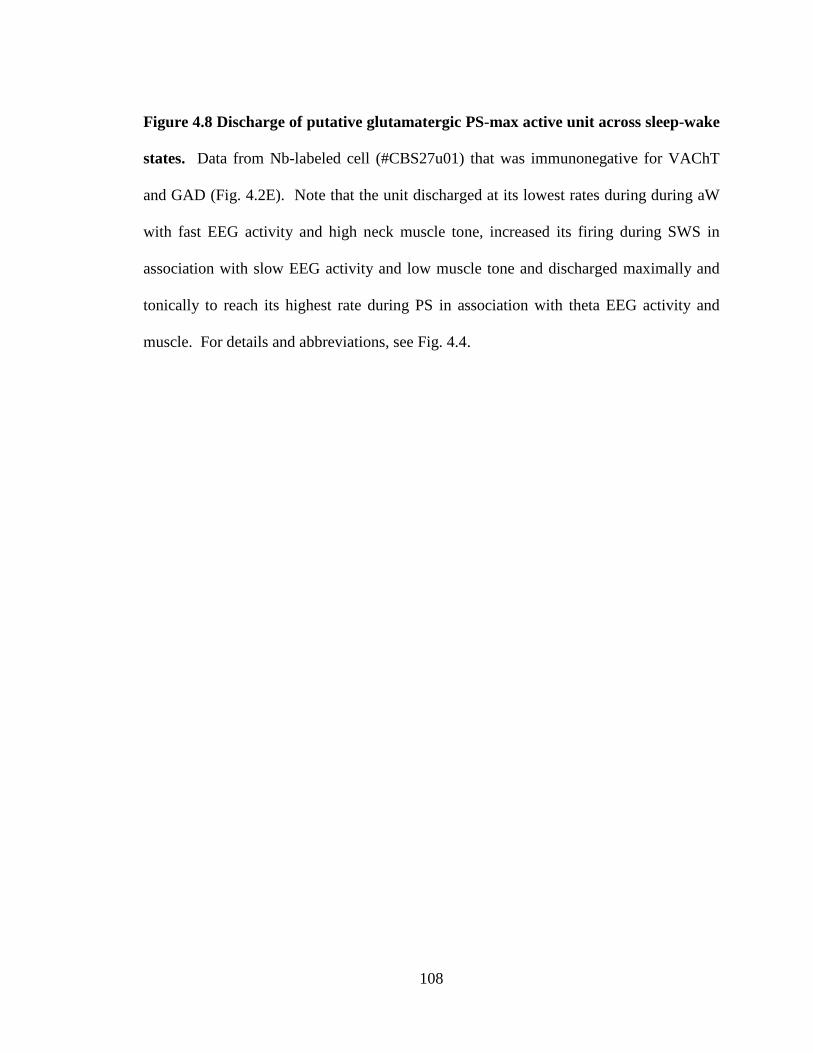
108
Figure 4.8 Discharge of putative glutamatergic PS-max active unit across sleep-wake
states. Data from Nb-labeled cell (#CBS27u01) that was immunonegative for VAChT
and GAD (Fig. 4.2E). Note that the unit discharged at its lowest rates during during aW
with fast EEG activity and high neck muscle tone, increased its firing during SWS in
association with slow EEG activity and low muscle tone and discharged maximally and
tonically to reach its highest rate during PS in association with theta EEG activity and
muscle. For details and abbreviations, see Fig. 4.4.

109
Figure 4.9. Comparison of spike duration among Nb+/VAChT+, Nb+/GAD+ and
Nb+/ VAChT-/GAD- neurons.
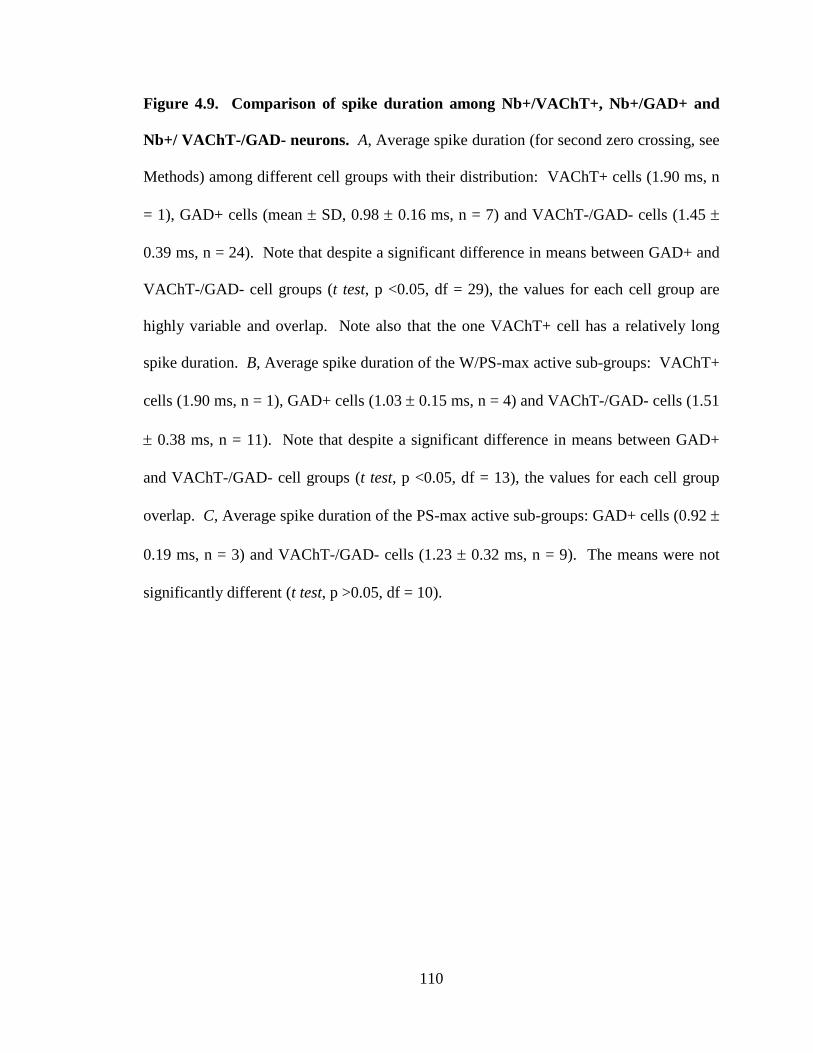
110
Figure 4.9. Comparison of spike duration among Nb+/VAChT+, Nb+/GAD+ and
Nb+/ VAChT-/GAD- neurons. A, Average spike duration (for second zero crossing, see
Methods) among different cell groups with their distribution: VAChT+ cells (1.90 ms, n
= 1), GAD+ cells (mean ± SD, 0.98 ± 0.16 ms, n = 7) and VAChT-/GAD- cells (1.45 ±
0.39 ms, n = 24). Note that despite a significant difference in means between GAD+ and
VAChT-/GAD- cell groups (t test, p <0.05, df = 29), the values for each cell group are
highly variable and overlap. Note also that the one VAChT+ cell has a relatively long
spike duration. B, Average spike duration of the W/PS-max active sub-groups: VAChT+
cells (1.90 ms, n = 1), GAD+ cells (1.03 ± 0.15 ms, n = 4) and VAChT-/GAD- cells (1.51
± 0.38 ms, n = 11). Note that despite a significant difference in means between GAD+
and VAChT-/GAD- cell groups (t test, p <0.05, df = 13), the values for each cell group
overlap. C, Average spike duration of the PS-max active sub-groups: GAD+ cells (0.92 ±
0.19 ms, n = 3) and VAChT-/GAD- cells (1.23 ± 0.32 ms, n = 9). The means were not
significantly different (t test, p >0.05, df = 10).

111
5. Chapter Five
Discussion
A portion of this chapter was published in Journal of Neuroscience, Vol 29(14): 4664-4674, 2009
112
5.1 The activity profiles of LDT/PPT neurons in anesthetized rats
This study shows that in rats under urethane anesthesia, identified cholinergic
pontomesencephalic neurons discharge in association with evoked cortical activation,
whereas intermingled GABAergic and noncholinergic/nonGABAergic cells discharge
maximally either in association with cortical activation in a parallel manner or with
cortical slow wave activity in a reciprocal manner to the cholinergic cells. Thus while
revealing the heterogeneity of co-distributed cholinergic, GABAergic and putative
glutamatergic pontomesencephalic neurons, these results provide a basis for
understanding the way in which these different cell groups might act in a coordinated
manner to stimulate cortical activation and modulate sleep-wake states.
The electrophysiological properties of the three cell groups overlapped extensively
and as such confirmed the importance of juxtacellular labeling and immunohistochemical
staining of recorded cells for their unequivocal identification according to
neurotransmitter phenotype. Based upon evidence in one study in anesthetized rats that
neurons with long duration spikes (0.95 ± 0.14, mean ± SD, for first zero crossing
measured at zero line) were stained for nicotinamide adenine dinucleotide phosphate-
diaphorase (Koyama et al., 1998), such cells were selected in studies of unanesthetized
rats and cats as ‘presumptive’ or ‘possibly’ cholinergic cells (Kayama and Ogawa, 1987;
El Mansari et al., 1989; Kayama et al., 1992). Yet, only in the present study have cells in
the LDT/PPT been randomly sampled and identified as ChAT+, GAD+ or ChAT-/GAD-
to examine the full range of spike durations for each cell type. The measurements were
found to overlap extensively among cell groups here, as also previously found with
intracellular recording and labeling (Takakusaki et al., 1997), such that spike duration
113
could not be used to distinguish an individual cell as cholinergic or noncholinergic.
Given a comparable overlap in average discharge rate and instantaneous firing frequency,
these characteristics could also not be used alone or together with spike duration to
identify individual cells as ‘presumptive’ cholinergic, GABAergic or
noncholinergic/nonGABAergic.
Out of 73 Nb-labeled cells in the LDT/SubLDT/MPPT area, 15% were
cholinergic, 40% were GABAergic and 45% were noncholinergic/nonGABAergic,
proportions which correspond approximately to the relative frequency of these cell types
in the LDT/PPT region (Ford et al., 1995; Wang and Morales, 2009). Based upon in situ
hybridization for the vesicular glutamate transporter, VGluT2, the
noncholinergic/nonGABAergic neurons would appear to be glutamatergic (Wang and
Morales, 2009). Immunohistochemical staining for VGluT2 has also proven a
glutamatergic identity of noncholinergic/nonGABAergic neurons in the basal forebrain
(Henny and Jones, 2008). We thus propose that the VAChT-/GAD- Nb-labeled neurons
recorded here in the LDT correspond to putative glutamatergic neurons.
5.1.1 Cholinergic neurons
The cholinergic LDT/SubLDT/MPPT neurons formed a homogeneous group that
discharged minimally in an irregular manner (~0.5 Hz) during irregular slow EEG
activity and then in a tonic sustained manner at a moderate rate (~4 Hz) in response to
somatic stimulation in association with increased high beta-gamma and theta-like EEG
activity. In contrast to a recent study reporting phasic modulation of cholinergic PPT
neurons in association with nested gamma oscillations during slow oscillations in
urethane/xylazine/ketamine anesthetized rats (Mena-Segovia et al., 2008), the present
114
study did not find any phasic modulation or cross correlation with slow EEG activity of
the cholinergic cell discharge during spontaneous, pre-stimulation conditions in the
urethane anesthetized rats. The presence of such phasic activity in association with
gamma during slow oscillations could well be due to xylazine/ketamine anesthesia which
is associated with highly synchronous slow wave activity that often develops into spike-
wave seizure activity in the cortex and transmission through corticofugal projections to
thalamic and subcortical networks (Timofeev et al., 1998). Moreover, ketamine is
associated with anomalous high amplitude and coherent gamma activity in the cortex
(Pinault, 2008), whereas urethane is associated with decreased gamma activity, similarly
to natural SWS (Maloney et al., 1997; Clement et al., 2008), which can moreover be
augmented as in the present study by somatic sensory stimulation. Indeed, as for the
basal forebrain cholinergic neurons which have been studied both under urethane
anesthesia and during natural sleep (Manns et al., 2000a; Lee et al., 2005b), the LDT/PPT
cholinergic neurons appear to be relatively silent in association with slow wave activity.
In contrast to the former, however, the LDT/PPT cholinergic neurons did not show any
phasic, rhythmic discharge in association with theta-like EEG activity. Rhythmic
bursting by basal forebrain cholinergic neurons had been shown in vitro to be driven by
low threshold calcium spikes (Khateb et al., 1992), which were also found in LDT
cholinergic neurons, though rarely associated with bursts (Leonard and Llinas, 1990;
Kamondi et al., 1992). Here in vivo, no spike bursts were observed in cholinergic
LDT/SubLDT or MPPT cells. They would thus appear to provide a tonic slow input to
their target neurons. According to the postsynaptic actions of Acetylcholine (ACh) in the
thalamus, their tonic discharge could change the mode of firing of thalamic cells from
bursting, as occurs with spindling and slow wave oscillations during SWS, to tonic, as
115
occurs with fast cortical activity during waking (McCormick, 1992; Steriade, 1993). In
reaction to somatic stimulation, the vast majority of cholinergic neurons started to
increase their firing rate before the increase in fast cortical activity, suggesting that they
are among cells of the ascending activating system that are responsible for eliciting
cortical activation through excitation of thalamic, hypothalamic and basal forebrain
relays.
5.1.2 GABAergic neurons
The GABAergic LDT/SubLDT/MPPT neurons were heterogeneous in both their
physiological and morphological properties. They comprised “On” (~48%) and “Off”
(~38%) cells, which respectively increased or decreased their discharge in response to
somatic stimulation. “On” and “Off” GABAergic subgroups each included small,
presumed locally projecting neurons and a contingent of medium-large, presumed long
projecting neurons, which send their axons into the forebrain (Ford et al., 1995). The
GABAergic “On” neurons discharged and behaved in a similar manner to the cholinergic
cells by increasing their rate of discharge and firing tonically during somatic stimulation.
They could thus act in parallel with the cholinergic neurons either as locally projecting
neurons, inhibiting other “Off” cells in the LDT region, or as projection neurons to other
“Off” cells in distant regions. The GABAergic “Off” cells behaved in a reciprocal
manner to the cholinergic cells. These GABAergic “Off” cells could thus normally play a
role in dampening cortical activation by exerting an inhibitory influence on other neurons
of the activating system. Yet, in contrast to the cholinergic neurons, most GABAergic
neurons changed their rate of firing after the change in EEG evoked by somatic
stimulation. This time course suggests that the GABAergic cells may be secondarily
116
modulated by neighboring cells, including the cholinergic via release of ACh and action
upon the muscarinic type 1 (M1) ACh receptors (M1 AChRs) for excitation of “On” cells,
or the muscarinic type 2 (M2) ACh receptors (M2 AChRs) for inhibition of “Off” cells.
Different responses to ACh have been found among identified GABAergic neurons
recorded in the pontine tegmentum in vitro (Brown et al., 2008). And with
immunohistochemical staining, M2 AChRs have been visualized upon GABAergic
neurons in subLDT and adjacent pontine tegmentum (Brischoux et al., 2008). The
GABAergic neurons could also be influenced by the local glutamatergic neurons (below)
or by other distant neurons involving feedback from the thalamus, hypothalamus and/or
basal forebrain.
5.1.3 Putative glutamatergic neurons
Like the GABAergic neurons, the putative glutamatergic neurons were also
heterogeneous in their properties and response to somatic stimulation, thus also
comprising “On” (~49%) and “Off” (~35%) cell groups, which similarly varied in size
and shape. In this case, however, the response of the putative glutamatergic neurons
generally preceded the changes in cortical activation, as it did for the cholinergic cells.
Indeed, the glutamatergic “On” cells could act in parallel to the cholinergic cells and form
an important contingent of long ascending projections from the LDT/PPT into the
forebrain (Pare et al., 1988; Jones and Cuello, 1989; Rasmusson et al., 1994; Ford et al.,
1995). The putative glutamatergic “On” and “Off” cells could also control the local
GABAergic “On” and “Off” cells (above).
Given the impossibility of identifying recorded cells as cholinergic, GABAergic
or putative glutamatergic according to discharge properties here in anesthetized animals,
117
it is also not possible to postulate that they correspond to cells previously recorded in
unanesthetized animals and characterized as discharging in particular sleep-wake states.
Nonetheless, given the homogeneous response profile of cholinergic
LDT/SubLDT/MPPT neurons found here, it can be stated that these cells discharge in
association with cortical activation and thus could do so during both waking (W) and
paradoxical sleep (PS), as was established to be the case for identified cholinergic
neurons in the basal forebrain (Manns et al., 2000a; Lee et al., 2005b). Indeed, ACh
release in the thalamus, which would arise largely from the brainstem cholinergic
neurons, is low during slow-wave sleep (SWS) and high during both W and PS in
association with cortical activation (Williams et al., 1994). In the LDT/PPT region of
both cat and rat, W-PS active cells were previously postulated to be ‘presumptive’ or
‘possibly’ cholinergic neurons (El Mansari et al., 1989; Steriade et al., 1990a; Kayama et
al., 1992). However, our results would indicate that such W-PS cells likely also include
noncholinergic cells. ‘Possibly’ cholinergic neurons were also proposed to be most active
during PS and relatively silent during waking (Kayama et al., 1992). Yet, such PS-active
cells also increased their discharge during SWS relative to W (Steriade et al., 1990a;
Kayama et al., 1992). They would thus more likely correspond to noncholinergic cells
which were found here to have a higher rate of discharge during spontaneous irregular
slow activity and thus to GABAergic or putative glutamatergic “Off” neurons. Such
“Off” cells could thus gradually increase their rate of firing during sleep to fire maximally
during PS in association with decreasing muscle tone in the natural sleep cycle.
GABAergic “Off” cells could progressively inhibit other surrounding neurons during
sleep, such as the serotonergic or noradrenergic cells which discharge during W and turn
off during sleep to be silent during PS (McGinty and Harper, 1976a; Aston-Jones and

118
Bloom, 1981; Maloney et al., 1999). Discharging in parallel but also in the lead,
glutamatergic “Off” cells may normally excite these GABAergic “Off”, postulated sleep-
active cells in the region. Cells classified as W-active, which discharge during W and not
during SWS or PS (Kayama et al., 1992), might include some of the putative
glutamatergic and GABAergic “On” cells recorded here. Clearly, future studies applying
recording with juxtacellular labeling in naturally sleeping-waking rats will be necessary
to elucidate the precise roles of these cell groups in sleep-wake states. The present results
indicate that cholinergic, GABAergic and putative glutamatergic neurons can function in
parallel or reciprocal manners to modulate cortical activity and behavioral state across the
sleep-waking cycle.
119
5.2 The activity profiles of LDT/PPT neurons during natural sleep-wake
states
In the present study, we characterized for the first time the discharge profiles
across natural sleep-wake states of three types of chemically identified neurons within the
LDT/PPT: cholinergic, GABAergic and non-cholinergic/non-GABAergic neurons, which
are referred to as "putative glutamatergic" neurons. These chemically identified neurons
were functionally classified in three distinct sub-groups: (1) W/PS-max active sub-group,
which had a discharge profile that correlated positively with fast EEG activity and
included cholinergic, GABAergic and putative glutamatergic neurons, (2) PS-max active
sub-group, which had a discharge profile that correlated negatively with EMG activity
and included GABAergic and putative glutamatergic neurons, and (3) W-max active sub-
group, which had a discharge profile that correlated positively with EMG activity and
included only putative glutamatergic neurons. The discharge profiles of these different
sub-groups were related to either fast EEG activity (W/PS-max active sub-group) or to
EMG activity in a reciprocal manner (W-max active and PS-max active sub-groups),
suggesting the potential role of the intermingled LDT/PPT neurons in modulating cortical
or behavioral changes across sleep-wake states. Additionally, no SWS-max active cells
(those that discharge maximally during SWS) were found in the LDT/PPT area,
suggesting the particularity of this region in controlling W and PS states rather than SWS
(Steriade et al., 1990a; Jones, 2005, 2008). Of the total cells recorded and identified in
LDT/PPT, all cells of the PS-max active sub-group and many of the W/PS-max active
sub-group discharged at their maximal rates during PS. Interestingly, most of these cells
started to increase their rate of discharge prior to PS during the transition (tPS),
120
suggesting the potential role of different LDT/PPT cell groups in triggering the PS state
and/or in controlling different activities related to PS (Webster and Jones, 1988; Vanni-
Mercier et al., 1989; Sakai et al., 1990).
The cells of the W/PS-max active sub-group that discharged in positive correlation
with fast EEG activity could potentially influence cortical activation via ascending
pathways to the forebrain, as reflected in fast EEG activity during both W and PS (Satoh
and Fibiger, 1986; Steriade et al., 1990a). These cells could correspond to the "On-cells"
found in our acute study in anaesthetized rats, whose discharge was positively associated
with evoked cortical activation. The cells of the PS-max active sub-group that discharged
in negative correlation with EMG activity could potentially participate in dampening
muscle tone and behavioral arousal, as reflected in minimal EMG amplitude during sleep,
particularly during PS (Velazquez-Moctezuma et al., 1989; Baghdoyan and Lydic, 1999;
Brischoux et al., 2008). These cells could possibly correspond to the "Off-cells" found in
our acute study. The Off-cells were negatively associated with evoked cortical activation
and were active during irregular slow-wave activity, possibly acting to dampen muscle
tone and behavioral arousal.
Out of the 32 Nb+ cells identified in the LDT/PPT area, 3% were cholinergic,
22% were GABAergic and 75% were putative glutamatergic cells. This sample of
identified cells does not conform to the proportions found in this area in our acute study
(see above) or in histochemical studies (Ford et al., 1995; Wang and Morales, 2009). The
relatively low numbers obtained in the present study, particularly of cholinergic neurons
and also to a lesser degree of GABAergic neurons, could be due mainly to the challenging
recording conditions in the pontomesencephalic tegmentum, which necessitated an angled
approach of the recording electrode, resulting in greater recording instability, particularly
121
during aW. Some cells were difficult to hold through the full sleep-waking cycle and
particularly during the transition from PS to aW, often associated with sudden movement.
Thus, cells were often lost at the end of PS upon waking and possibly cholinergic cells
were among those that are more vulnerable to such physical trauma. The particular
paucity of cholinergic neurons in our findings could also be due to the difficulty of
capturing them while active, particularly since recording is done mostly during SWS,
when cholinergic neurons appear to be silent in the pontomesencephalic, as they are in the
basal forebrain (Lee et al., 2005b). Since only one neuron per side per animal could be
labeled, only a small number of cells could be submitted to the juxtacellular labelling
procedure and of those less than 80% were found to be labelled. Moreover, since for each
rat a minimum time of three weeks was necessary for recovery from surgery and
habituation to the head-fixation before recording began, only a limited number of animals
could be recorded over one year. Thus, the present approach and project requires
considerable time to obtain adequate samples for the different cell populations.
Based on their anatomical and physiological features, LDT/PPT Nb+/VAChT+,
Nb+/GAD+ and Nb+/VAChT-/GAD- cells could not be clearly distinguished. Moreover,
except for the spike duration measurements between two W/PS-max active sub-groups,
Nb+/VAChT+, Nb+/GAD+ and Nb+/VAChT-/GAD- cells did not show significant
differences in their electrophysiological properties. This lack of clear differentiation was
due to an extensive overlap in their respective properties. The overlap in
electrophysiological properties was also found between chemically different LDT/PPT
neurons in our acute study (see above) as well as between congener basal forebrain
neurons (Hassani et al., 2009). Chemically different neurons could thus have similar or
equivalent electrophysiological properties and discharge profiles across sleep-wake states.

122
It is thus not possible to distinguish between individual cells based only upon their
electrophysiological characteristics. Therefore by identifying the neurotransmitter
phenotypes of the recorded cells with immunohistochemical staining, the present study
overcame the fundamental limitations of previous electrophysiological studies (El
Mansari et al., 1989; Steriade et al., 1990b; Kayama et al., 1992) that attempted to
identify cell populations based upon their electrophysiological properties.
5.2.1 Cholinergic neurons
The cholinergic neuron found in the present study was a W/PS-max active cell. It
discharged maximally during both waking and PS with higher discharge during PS than
waking. This neuron was silent during SWS. Supporting evidence would suggest that
this single neuron could be representative of the population of LDT/PPT cholinergic
neurons as W/PS-active cells: (1) In our acute study, one homogenous group of
cholinergic neurons was found that increased firing in association with evoked cortical
activation, mimicking fast EEG activity during both waking and PS states; (2) ACh is
released in high quantities during both waking and PS in the thalamus (Williams et al.,
1994), where the cholinergic LDT/PPT neurons project (Sofroniew et al., 1985; Woolf
and Butcher, 1986; Hallanger et al., 1987; Jones and Webster, 1988; Pare et al., 1988;
Steriade et al., 1988); (3) Basal forebrain cholinergic neurons form one homogenous
group found to be W/PS-max active neurons (Lee et al., 2005b). Previous recording
studies of unidentified neurons in LDT/PPT found two major groups (El Mansari et al.,
1989; Steriade et al., 1990b; Kayama et al., 1992) that were proposed to be ‘possibly’
cholinergic, one as W/PS-active and another as PS-active. The W/PS-active group could
correspond to the cholinergic neuron identified here, whereas the PS-active group could

123
correspond to the GABAergic and/or glutamatergic PS-max active neurons identified
here. It is thus possible to suggest from this evidence that LDT/PPT cholinergic neurons
are W/PS-max active neurons.
However, in addition to the preceding suggestions, there is another hypothesis that
proposes reciprocal roles between cholinergic and monoaminergic systems in eliciting PS
and waking respectively, in which cholinergic neurons are proposed to be PS-active while
monoaminergic neurons are W-active (McCarley and Hobson, 1975).
Electrophysiological studies had indicated the presence of two sub-groups of possible
cholinergic neurons in LDT/PPT, one W/PS-active and the other PS-active (El Mansari et
al., 1989; Steriade et al., 1990a; Kayama et al., 1992; Thakkar et al., 1998). Some of
these studies suggested that cholinergic PS-active neurons, particularly located in the
lateral PPT (lPPT) are related to the phasic, ponto-geniculo-occipital (PGO) waves that
characterize PS (El Mansari et al., 1989; Steriade et al., 1990a; Koyama and Sakai, 2000).
Thus, the possible existence of another sub-group of cholinergic neurons, perhaps located
in the lPPT, that are exclusively PS-max active neurons, in addition to the W/PS- max
active subgroup found here in the LDT and in the medial PPT (mPPT), cannot be
excluded.
As mentioned above, the present results showed that the LDT/PPT cholinergic
neuron discharged at its highest rate during PS. Like the majority of the recorded cells, it
started discharging prior to PS during tPS and increased its rate to maintain a high level
during the entire period of PS. Thus, during PS, LDT/PPT cholinergic neurons could
drive cortical activation through their two ascending pathways, the dorsal and the ventral
(Fig. 5.1; Jones, 2004). They could also participate in the cognitive correlate of PS,
dreaming (Hobson, 1992), by either direct stimulation of the limbic and cortical structures

124
to which they project (Satoh and Fibiger, 1986) or indirectly by exciting the ventral
tegmental area (VTA) dopaminergic neurons (Forster and Blaha, 2000) that were found to
burst during PS (Dahan et al., 2007). The VTA dopaminergic neuron could in turn
release dopamine in their target areas, such as limbic and cortical structures to which
these neurons project (Fallon and Moore, 1978). The activation of these terminal
structures could be responsible for the cognitive correlate of PS (Portavella and Vargas,
2005; Behrendt, 2010).
Via their innervation of the PS effector zone in the pons, which includes the oral
pontine reticular formation (PnO) and the subcoeruleus (SubC) regions of the medial and
lateral pontine tegmentum (Jones, 2004), LDT/PPT cholinergic neurons could excite the
ascending projecting glutamatergic W/PS-max neurons probably through M1 AChRs
(Greene and Carpenter, 1985; Greene et al., 1989). These reticular neurons would
participate in generating the EEG components of PS, cortical activation, reflected in high
gamma with theta activity (Fig. 5.1; Jones, 2004). Yet, the action of LDT/PPT
cholinergic neurons on the PS effector neurons could also induce the EMG components
of PS, muscle atonia (Jones, 2004). Such muscle atonia could be elicited in part by
inhibition, through the M2 AChRs, of the putative glutamatergic W-active reticulospinal
neurons concentrated in the PnC (Brischoux et al., 2008) resulting in disfacilitation of
motor neurons in the brainstem and spinal cord (Fig 5.1). Cholinergic neurons could also
inhibit GABAergic W-active neurons that are located in the PnO through their M2
AChRs (Brischoux et al., 2008) and are suggested to inhibit their neighboring putative
glutamatergic PS-active neurons (Maloney et al., 2000). They could also stimulate, via
M1 AChRs, putative glutamatergic PS-active neurons (Greene and Carpenter, 1985;
Greene et al., 1989). These PS-active neurons could in turn stimulate

125
GABAergic/glycinergic neurons located in the ventral medullary gigantocellular reticular
formation (GiV) that could inhibit motoneurons in brainstem and spinal cord, resulting in
muscle atonia during PS (Fig. 5.1).
The present results also showed that the LDT/PPT cholinergic neuron was active
during wakefulness, although at lower frequency than during PS. Indeed, other evidence
has suggested that the LDT/PPT cholinergic neurons could be active during wakefulness:
(1) In vivo recordings of possible LDT/PPT cholinergic neurons found that they fire
tonically at low to moderate rates during wakefulness (Sakai, 1985; El Mansari et al.,
1989; Steriade et al., 1990a; Kayama et al., 1992); (2) High levels of ACh were reported
to be released in the thalamus during waking (Williams et al., 1994); (3) Stimulation of
cholinergic neurons by injection of a high dose of the excitatory amino-acid, L-glutamate
into the PPT induced a waking state (Datta and Siwek, 1997). Thus, during waking,
cholinergic neurons could stimulate thalamo-cortical neurons and block their rhythmic
activity resulting in EEG activation and desynchronization (Steriade, 1993).
Since cholinergic neurons are active during wakefulness as well as during PS, we
can then ask why cholinergic neurons do not elicit PS features, particularly muscle atonia
during wakefulness? In fact, it was shown that the injection of the acetylcholinesterase
inhibitor physostigmine (eserine) elicited a PS-like state with muscle atonia, yet only after
the depletion of monoamines with reserpine (Karczmar et al., 1970). It is suggested
therefore that monoaminergic neurons, which are active during wakefulness (McGinty
and Harper, 1976b; Trulson and Jacobs, 1979; Aston-Jones and Bloom, 1981) and exert
an inhibitory influence on cholinergic neurons (Luebke et al., 1992), may play a
protective role to prevent cholinergic neurons from eliciting PS features during
wakefulness (McCarley and Hobson, 1975). By considering that all cholinergic neurons
126
are W/PS-active, it is possible that monoaminergic neurons act to dampen the activity of
cholinergic neurons during arousal but not to block their firing completely. Yet, the
action of monoaminergic neurons in preventing cholinergic neurons from triggering PS
during waking could also occur through postsynaptic actions on the cholinoceptive
neurons of the PS effector zone, where many monoaminergic in addition to cholinergic
neurons project (Semba, 1993). Accordingly, reticulospinal and other neurons in the
pontine reticular formation could be excited by noradrenaline or serotonin and inhibited
by ACh through M2 AChRs (Greene et al., 1989). It is thus probable that monoaminergic
and cholinergic neurons act on the same pontine neurons respectively to prevent and to
elicit PS with muscle atonia (Fig. 5.1). The same counterbalancing role could be taken
by orexin (also called hypocretin) neurons with cholinergic neurons, since orexin
neurons, which are active only during waking (Lee et al., 2005a), project to the brainstem
and can excite cholinoceptive reticular neurons which are inhibited by ACh through M2
AChRs (Brischoux et al., 2008). Indeed, the deficiency of the orexinergic system in the
hypothalamus results in narcolepsy with cataplexy (Chemelli et al., 1999; Lin et al., 1999;
Peyron et al., 2000; Thannickal et al., 2000). This cataplexy could be induced by
cholinergic neurons in the absence of orexin neurons, which degenerate in patients having
narcolepsy with cataplexy (Thannickal et al., 2000).
It is thus likely that cholinergic neurons could promote cortical activation during
waking when they are prevented from inducing muscle atonia either through dampening
of their activity by monoaminergic neurons (McCarley and Hobson, 1975) and/or by the
counterbalancing action of monoaminergic and orexin neurons on reticular, including
reticulospinal, neurons (Stevens et al., 1992; Brischoux et al., 2008).
127
LDT/PPT cholinergic neurons could thus stimulate cortical activation, during
waking and during PS, when they also could promote tonic motor inhibition and muscle
atonia (Fig. 5.1).
5.2.2 GABAergic neurons
In the present study, two different sleep-wake sub-groups of LDT/PPT
GABAergic neurons were found, W/PS-max active sub-group (57%) and PS-max active
sub-group (43%).
5.2.2.1 GABAergic W/PS-max neurons
The GABAergic neurons of the W/PS-max active sub-group, which are
predominantly fast firing, discharged in positive correlation with fast gamma EEG
activity. These neurons likely correspond to the "GABAergic-On" neurons found in our
acute study. It was previously shown that some GABAegic neurons in the LDT/PPT give
rise to ascending projections to the forebrain (Ford et al., 1995). Thus, as projecting
neurons in parallel with cholinergic neurons (Steriade et al., 1988; Ford et al., 1995),
these GABAergic neurons could participate in modulating fast cortical activity by either
fast pacing (Somogyi and Klausberger, 2005) or the disinhibition (Freund and
Meskenaite, 1992) of their targeted neurons. They could also inhibit SWS active neurons
found in the mesencephalic reticular formation (Huttenlocher, 1961; Steriade et al., 1982)
which could be GABAergic and inhibit in turn glutamatergic W/PS-active neurons of
that region (Fig. 5.1; Jones, 2010).
128
5.2.2.2 GABAergic PS-max neurons
The GABAergic cells of the PS-max active sub-group, which are all fast firing
neurons, increased their discharge rate progressively across sleep stages to discharge at
their maximum rate during PS. They could correspond to some neurons with brief action
potentials and high frequency discharge during PS that were previously recorded but not
identified in the LDT/PPT (Steriade et al., 1990a). Yet the latter could also correspond in
part to non-GABAergic, putative glutamatergic neurons with the same characteristics
recorded in the present study (see below). Indeed, according to a c-Fos expression study,
GABAergic neurons in LDT/PPT have been demonstrated to be active during PS
(Maloney et al., 1999). The GABAergic PS-max active neurons could thus participate in
dampening behavioral arousal during sleep, particularly during PS. This decrease in
behavioral arousal might be due to an inhibition of monoaminergic neurons in the region.
Indeed, a greater release of GABA was found in both the locus coeruleus (LC) and dorsal
raphe (DR) during PS compared to SWS and waking (Nitz and Siegel, 1997a; Nitz and
Siegel, 1997b). Microinjections of GABA agonists induced a decrease in the activity of
serotonergic neurons (Gallager and Aghajanian, 1976) and an increase of PS (Lancel et
al., 1996; Nitz and Siegel, 1997a). In contrast, microinjection of the GABAA antagonist,
bicuculline, induced an increase in the activity of serotonergic neurons (Levine and
Jacobs, 1992). Bicuculline had the same effect in the LC, where its microinjection
resulted in a reversal of the suppression of noradrenergic neuronal activity (Gervasoni et
al., 1998). This microinjection also resulted in a decrease in PS (Kaur et al., 1997).
Taken together, this evidence suggests that LDT/PPT GABAergic neurons could inhibit
monoaminergic neurons during PS to prevent behavioral arousal (Fig. 5.1).
129
There is evidence that GABA blocks reticular PS-On neurons in the PnO/SubC
region, the PS effector zone, to induce PS. Indeed, injections of the GABAA antagonist,
bicuculline, into PnO region elicited state of PS (Xi et al., 1999; Sanford et al., 2003),
whereas injections of the GABAA agonist, muscimol, into the same region suppressed PS
(Sanford et al., 2003). Moreover in c-Fos studies, it appeared that GABAergic neurons in
the PnO become inactive during PS (Maloney et al., 2000). It is thus possible that
LDT/PPT GABAergic PS-max active neurons inhibit these GABAergic W-active neurons
to disinhibit PS effector neurons (Fig. 5.1).
As locally projecting interneurons, GABAergic PS-max active neurons could
also inhibit their codistributed putative glutamatergic, W-max active neurons during PS
(Fig. 5.1).
5.2.3 Putative glutamatergic neurons
In the present study, Nb+/VAChT-/GAD-, putative glutamatergic neurons were
found to form the largest cell group, 75% of LDT/PPT recorded and identified neurons.
The glutamatergic neurons have been found to represent a slightly larger proportion
(40%) than the cholinergic or GABAergic neurons in the LDT/PPT (Wang and Morales,
2009). Yet, the large proportion of the sample represented by these neurons here is
probably due to the fact that these neurons are easy to target during the recording
compared to cholinergic and GABAergic neurons, since they generally continue to
discharge during SWS, although at a lower rate than during W or PS. LDT/PPT putative
glutamatergic neurons comprise three different sleep-wake sub-groups: W/PS-max active
sub-group (46%), PS-max active sub-group (37%) and W-max active sub-group (17%).
130
5.2.3.1 Putative glutamatergic W/PS-max neurons
The putative glutamatergic cells of the W/PS-max active sub-group would
correspond to the putative "glutamatergic-On" cells found in our acute study that could be
involved in inducing cortical activation during both W and PS. Surprisingly, putative
glutamatergic W/PS-max active neurons were found to have a similar profile to the
cholinergic (W/PS-max active) neuron. Since these putative glutamatergic neurons form,
in parallel to the cholinergic neurons, an important contingent of long ascending
projections from LDT/PPT into the forebrain (Pare et al., 1988; Jones and Cuello, 1989;
Rasmusson et al., 1994; Ford et al., 1995), they could thus share the role of cholinergic
neurons in stimulating cortical activation during both waking and PS (Fig. 5.1). Indeed,
blockage of glutamatergic transmission in the basal forebrain cholinergic cell area
decreased cortical ACh release and EEG activation during electrical stimulation of the
PPT region (Rasmusson et al., 1994). They could also stimulate the ascending projecting
glutamatergic W/PS-max neurons in the PnO (Fig. 5.1). LDT/PPT putative glutamatergic
W/PS-max neurons could thus share the role of cholinergic neurons in stimulating cortical
activation during both waking and PS (Fig. 5.1).
5.2.3.2 Putative glutamatergic PS-max neurons
The putative glutamatergic cells of the PS-max active sub-group, which were all
fast firing neurons and fired maximally during PS in negative correlation with EMG
activity, could correspond to the putative "glutamatergic-Off" cells found in our acute
study. They could accordingly be involved in dampening behavioural arousal or response
to stimulation and decreasing muscle tone during SWS/PS.

131
A c-Fos study showed that a population of glutamatergic neurons in the region of
the SubC, a PS effector zone, was active during PS (Lu et al., 2006). Moreover,
application of kainate, agonist for ionotropic glutamatergic receptors, into the SubC
region increased PS (Onoe and Sakai, 1995). It is possible that LDT/PPT glutamatergic,
PS-max active neurons stimulate the PS effector neurons in the SubC and PnO and could
thus indirectly participate in inducing muscle atonia, which is suggested to be driven by
these PS effector neurons (Fig.5.1, Kodama et al., 1998; Boissard et al., 2002).
As locally projecting, they could also excite, via local collaterals, other PS-max
active neurons such as congener GABAergic neurons in the LDT/PPT.
5.2.3.3 Putative glutamatergic W-max neurons
As a singular profile, putative glutamatergic cells of the W-max active sub-group
fired maximally during waking in positive correlation with EMG activity. Although
previous electrophysiological studies showed that some neurons recorded within the
pontomesencephalic tegmentum were W-active/PS-inactive neurons, they suggested that
they are monoaminergic neurons (El Mansari et al., 1989; Kayama et al., 1992). Those
neurons could, in fact, correspond to the VAChT-/GAD- W-max neurons found in the
present study. What are otherwise considered glutamatergic W-max neurons could
participate, in response to sensory stimulation, in stimulating behavioral arousal during
wakefulness, possibly by stimulating pontine reticulospinal and/or medullary
reticulospinal neurons involved in driving behavioral arousal and muscle tone ( Fig.5.1,
Siegel and McGinty, 1977).
Finally, the present study showed that with their large number and their
heterogeneous discharge profiles, LDT/PPT putative glutamatergic neurons seem to play

132
a role as important as other LDT/PPT cell types, notably the cholinergic cells, may play
in modulating sleep-wake states. As W/PS-active neurons, they could work, in parallel
with cholinergic neurons, to stimulate cortical activation during both waking and PS; as
PS-active neurons, they could actively participate in inducing muscle atonia; and finally
as W-active neurons, they could participate in stimulating behavioral arousal and muscle
tone during wakefulness. These putative glutamatergic neurons need to be unequivocally
identified as glutamatergic neurons in further investigations.

133
5.3 Figure 5.1
Figure 5.1. Regulation of sleep-wake states by neurons of the pontomesencephalic
tegmentum.

134
Figure 5.1. Regulation of sleep-wake states by neurons of the pontomesencephalic
tegmentum. Sagittal schematic view depicting the recorded LDT/PPT cholinergic,
GABAergic and putative glutamatergic neurons and how they might influence cortical
activity and behavior through actions upon other neurons in the brain. The LDT/PPT
neurons that are maximally active during both waking (W) and paradoxical sleep (PS)
and discharge in positive association with fast EEG activity (W/PS-active, filled red
symbols) could stimulate cortical activation during both W and PS by excitation of
neurons within the reticular activating system, presumed to be glutamatergic, and by
excitation of neurons primarily in the thalamus and also hypothalamus and basal
forebrain. They include cholinergic (ACh) and putative glutamatergic (Glu) neurons that
would exert direct excitatory actions and also GABAergic (GABA) neurons that could
inhibit slow wave sleep (SWS)-active neurons in part located in the mesencephalic
reticular formation. Cholinergic neurons could also stimulate the PS-active neurons in
the PnO and subcoeruleus (SubC) whereas they would inhibit the W-active neurons
through M2 ACh Rs during PS. The inhibitory actions of ACh upon these neurons would
be antagonized during W by orexin (Orx) and noradrenalinergic (NA) neurons.
LDT/PPT neurons that are maximally active during PS (PS-active, aqua symbols) in
negative association with EMG activity could stimulate behavioral sleep with muscle
atonia during PS. They include GABAergic and putative glutamatergic neurons. The
GABAergic neurons could inhibit their neighboring W-active putative glutamatergic
neurons and the W-active NA LC neurons. They could also inhibit W-active GABAergic
neurons in the PnO region, resulting in the disinhibition of PS-active neurons of the PnO
and SubC. The putative glutamatergic neurons could stimulate PS-active neurons in the
PnO and SubC, which in turn stimulate GABAergic (or glycinergic) neurons located in

135
the gigantocellular field of the medullary reticular formation, ventral part (GiV). These
GABAergic (or glycinergic) neurons in turn inhibit motoneurons in the brainstem and
spinal cord, resulting in muscle atonia. LDT/PPT neurons that are maximally active
during W (W-active, open red symbols) in positive association with EMG activity could
stimulate behavioral arousal with muscle tone during W. They included only putative
glutamatergic neurons that could stimulate, together with Orx and NA neurons, the PnC
W-active neurons, which in turn stimulate glutamatergic neurons located in the
gigantocellular region of the medullary reticular formation (Gi RF). These glutamatergic
neurons stimulate in turn motoneurons resulting in behavioral arousal with high muscle
tone. Note that LDT/PPT neurons and their proposed projections are shown in dark
colors, whereas their target neurons are shown in lighter colors. Abbreviations: 7g, genu
7th nerve; Gi RF, gigantocellular reticular formation; GiV, gigantocellular, ventral part
RF; LC, locus coeruleus nucleus; LDT, laterodorsal tegmental nucleus; Mes RF,
mesencephalic reticular formation; PH, posterior hypothalamus; PnC, pontine, caudal part
RF; PnO, pontine, oral part RF; PPT, pedunculopontine tegmental nucleus; RF, reticular
formation; scp, superior cerebellar peduncle; SubC, subcoeruleus.
136
5.4 General Conclusion
The studies of the present thesis illuminate for the first time the discharge profiles
of chemically identified cholinergic, GABAergic and putative glutamatergic LDT/PPT
neurons in relation to evoked cortical activation in anaesthetized rats and in relation to
cortical activity and muscular tone across the sleep-waking cycle in naturally sleeping and
waking rats. The findings advance several points that should be considered as important
discoveries of the present thesis. (1) There is a similarity in the discharge profiles of
chemically different cell populations (cholinergic, GABAergic and putative glutamatergic
neurons) within the same functional sleep-wake sub-group on the one hand and
reciprocity in their discharge profiles with other sleep-wake sub-groups on the other hand.
The similarity in the discharge profiles of cholinergic, GABAergic and putative
glutamatergic neurons of the W/PS-max active sub-group could suggest that these cells
are working in a parallel manner to drive cortical activation during both waking and PS.
Additionally, the similarity in the discharge profiles of GABAergic and putative
glutamatergic neurons of the PS-max active sub-group could suggest that these cells are
working in parallel manner to dampen behavioral arousal and muscle tone during PS.
They could also be partially redundant in their roles. The reciprocity between the
discharge profiles of putative glutamatergic neurons of the W-max active sub-group on
the one hand and GABAergic and putative glutamatergic neurons of the PS-max active
sub-group on the other hand could suggest that these neurons are working in reciprocal
manner to stimulate and to dampen behavioral arousal and muscle tone respectively.
Therefore, LDT/PPT cholinergic, GABAergic and glutamatergic neurons may be playing
an important role in modulating sleep-wake states either by interacting locally or upon

137
their target cells. This phenomenon is not exclusive to the pontomesencephalic
tegmentum region but was found also within the basal forebrain cholinergic cell area
(Hassani et al., 2009), and indicates that no cell type is acting individually, but rather in
parallel and/or in complement with other cell types to orchestrate the sleep-wake cycle.
(2) There is considerable heterogeneity in chemical or neurotransmitter cell phenotypes
and functional sleep-wake discharge profiles even in a small area like the LDT/PPT in the
pontomesencephalic tegmentum. This heterogeneity was also found in other brain areas
such as the basal forebrain (Hassani et al., 2009) and lateral hypothalamus (Hassani et al.,
2010). Such heterogeneity reflects the diversity of cell populations in different brain
areas, which may form local networks and through interconnections, larger networks that
orchestrate the sleep-wake cycle rather than isolated centers in the brain, one responsible
for waking, another for SWS and another for PS as some have proposed (Saper et al.,
2010).
Finally, the results of the present thesis reveal the important role that different
cell types in LDT/PPT may play in controlling the sleep-wake cycle. The W/PS-max
active neurons could participate in stimulating cortical activation during both W and PS;
the PS-max active neurons could participate in dampening behavioral arousal and muscle
tone during PS, whereas the W-max active neurons could participate in stimulating
behavioral arousal and muscle tone during wakefulness. These new results should add
missing pieces to the puzzle that our laboratory and others are working to complete in
order to understand how the sleep-wake cycle is orchestrated.

138
6. References
Amatruda TT, Black DA, McKenna TM, McCarley RW, Hobson JA (1975) Sleep cycle
control and cholinergic mechanisms: differential effects of carbachol injections at
pontine brain stem sites. Brain Res 98:501-515.
Armstrong DM, Saper CB, Levey AI, Wainer BH, Terry RD (1983) Distribution of
cholinergic neurons in rat brain: Demonstrated by the immunocytochemical
localization of choline acetyltransferase. J Comp Neurol 216:53-68.
Aserinsky E, Kleitman N (1953) Regularly occurring periods of eye motility, and
concomitant phenomena during sleep. Science 118:273-274.
Aston-Jones G, Bloom FE (1981) Activity of norepinephrine-containing locus coeruleus
neurons in behaving rats anticipates fluctuations in the sleep-waking cycle. J
Neurosci 1:876-886.
Baghdoyan HA, Lydic R (1999) M2 muscarinic receptor subtype in the feline medial
pontine reticular formation modulates the amount of rapid eye movement sleep.
Sleep 22:835-847.
Baxter BL (1969) Induction of both emotional behavior and a novel form of REM sleep
by chemical stimulation applied to cat mesencephalon. Exp Neurol 23:220-230.
Behrendt RP (2010) Contribution of hippocampal region CA3 to consciousness and
schizophrenic hallucinations. Neurosci Biobehav Rev 34:1121-1136.
Bellocchio EE, Reimer RJ, Fremeau RT, Jr., Edwards RH (2000) Uptake of glutamate
into synaptic vesicles by an inorganic phosphate transporter. Science 289:957-
960.
139
Bevan MD, Bolam JP (1995) Cholinergic, GABAergic, and glutamate-enriched inputs
from the mesopontine tegmentum to the subthalamic nucleus in the rat. J Neurosci
15:7105-7120.
Boissard R, Gervasoni D, Schmidt MH, Barbagli B, Fort P, Luppi PH (2002) The rat
ponto-medullary network responsible for paradoxical sleep onset and
maintenance: a combined microinjection and functional neuroanatomical study.
Eur J Neurosci 16:1959-1973.
Brischoux F, Mainville L, Jones BE (2008) Muscarinic-2 and orexin-2 receptors on
GABAergic and other neurons in the rat mesopontine tegmentum and their
potential role in sleep-wake state control. J Comp Neurol 510:607-630.
Brown RE, McKenna JT, Winston S, Basheer R, Yanagawa Y, Thakkar MM, McCarley
RW (2008) Characterization of GABAergic neurons in rapid-eye-movement sleep
controlling regions of the brainstem reticular formation in GAD67-green
fluorescent protein knock-in mice. Eur J Neurosci 27:352-363.
Butcher LL, Woolf NJ (1984) Histochemical distribution of acetylcholinesterase in the
central nervous system: clues to the localization of cholinergic neurons. In:
Handbook of Chemical Neuroanatomy. Vol. 3: Classical Transmitters and
Transmitter Receptors in the CNS, Part II (Bjorklund A, Hokfelt T, Kuhar MJ,
eds), pp 1-50. Amsterdam: Elsevier.
Cape EG, Jones BE (1998) Differential modulation of high-frequency gamma-
electroencephalogram activity and sleep-wake state by noradrenaline and
serotonin microinjections into the region of cholinergic basalis neurons. J
Neurosci 18:2653-2666.

140
Carli G, Zanchetti A (1965) A study of pontine lesions suppressing deep sleep in the cat.
Arch Ital Biol 103:751-788.
Chase MH, Morales FR, Boxer PA, Fung SJ, Soja PJ (1986) Effect of stimulation of the
nucleus reticularis gigantocellularis on the membrane potential of cat lumbar
motoneurons during sleep and wakefulness. Brain Res 386:237-244.
Chemelli RM, Willie JT, Sinton CM, Elmquist JK, Scammell T, Lee C, Richardson JA,
Williams SC, Xiong Y, Kisanuki Y, Fitch TE, Nakazato M, Hammer RE, Saper
CB, Yanagisawa M (1999) Narcolepsy in orexin knockout mice: molecular
genetics of sleep regulation. Cell 98:437-451.
Clement EA, Richard A, Thwaites M, Ailon J, Peters S, Dickson CT (2008) Cyclic and
sleep-like spontaneous alternations of brain state under urethane anaesthesia.
PLoS ONE 3:e2004.
Clements JR, Grant S (1990) Glutamate-like immunoreactivity in neurons of the
laterodorsal tegmental and pedunculopontine nuclei in the rat. Neurosci Lett
120:70-73.
Dahan L, Astier B, Vautrelle N, Urbain N, Kocsis B, Chouvet G (2007) Prominent burst
firing of dopaminergic neurons in the ventral tegmental area during paradoxical
sleep. Neuropsychopharmacology 32:1232-1241.
Datta S (1995) Neuronal activity in the peribrachial area: relationship to behavioral state
control. Neurosci Biobehav Rev 19:67-84.
Datta S, Siwek DF (1997) Excitation of the brain stem pedunculopontine tegmentum
cholinergic cells induces wakefulness and REM sleep. J Neurophysiol 77:2975-
2988.
141
Dement W, Kleitman N (1957) The relation of eye movements during sleep to dream
activity: an objective method for the study of dreaming. J Exptl Psychol 53:339-
346.
Di Chiara G, Imperato A (1988) Drugs abused by humans preferentially increase synaptic
dopamine concentrations in the mesolimbic system of freely moving rats. Proc
Natl Acad Sci U S A 85:5274-5278.
Domino EF, Yamamoto K, Dren AT (1968) Role of cholinergic mechanisms in states of
wakefulness and sleep. Progr Brain Res 28:113-133.
El Mansari M, Sakai M, Jouvet M (1989) Unitary characteristics of presumptive
cholinergic tegmental neurons during the sleep-waking cycle in freely moving
cats. Exp Brain Res 76:519-529.
Fallon JH, Moore RY (1978) Catecholamine innervation of the basal forebrain. IV.
Topography. J Comp Neurol 180:545-580.
Feldberg W, Vogt M (1948) Acetylcholine synthesis in different regions of the central
nervous system. J Physiol 107:372-381.
Fibiger HC (1982) The organization and some projections of cholinergic neurons of the
mammalian forebrain. Brain Res Rev 4:327-388.
Fonnum F, Gottesfeld Z, Grofova I (1978) Distribution of glutamate decarboxylase,
choline acetyl-transferase and aromatic amino acid decarboxylase in the basal
ganglia of normal and operated rats. Evidence for striatopallidal,
striatoentopeduncular and striatonigral GABAergic fibres. Brain Res 143:125-
138.
Ford B, Holmes C, Mainville L, Jones BE (1995) GABAergic neurons in the rat
pontomesencephalic tegmentum: codistribution with cholinergic and other

142
tegmental neurons projecting to the posterior lateral hypothalamus. J Comp
Neurol 363:177-196.
Forster GL, Blaha CD (2000) Laterodorsal tegmental stimulation elicits dopamine efflux
in the rat nucleus accumbens by activation of acetylcholine and glutamate
receptors in the ventral tegmental area. Eur J Neurosci 12:3596-3604.
Fremeau RT, Jr., Voglmaier S, Seal RP, Edwards RH (2004) VGLUTs define subsets of
excitatory neurons and suggest novel roles for glutamate. Trends Neurosci 27:98-
103.
Fremeau RT, Jr., Troyer MD, Pahner I, Nygaard GO, Tran CH, Reimer RJ, Bellocchio
EE, Fortin D, Storm-Mathisen J, Edwards RH (2001) The expression of vesicular
glutamate transporters defines two classes of excitatory synapse. Neuron 31:247-
260.
Fremeau RT, Jr., Burman J, Qureshi T, Tran CH, Proctor J, Johnson J, Zhang H, Sulzer
D, Copenhagen DR, Storm-Mathisen J, Reimer RJ, Chaudhry FA, Edwards RH
(2002) The identification of vesicular glutamate transporter 3 suggests novel
modes of signaling by glutamate. Proc Natl Acad Sci U S A 99:14488-14493.
Freund TF, Meskenaite V (1992) Gamma-aminobutyric acid-containing basal forebrain
neurons innervate inhibitory interneurons in the neocortex. Proc Natl Acad Sci
USA 89:738-742.
Fujiyama F, Furuta T, Kaneko T (2001) Immunocytochemical localization of candidates
for vesicular glutamate transporters in the rat cerebral cortex. J Comp Neurol
435:379-387.
Gallager DW, Aghajanian GK (1976) Effect of antipsychotic drugs on the firing of dorsal
raphe cells. II. Reversal by picrotoxin. Eur J Pharmacol 39:357-364.
143
Garzon M, Pickel VM (2000) Dendritic and axonal targeting of the vesicular
acetylcholine transporter to membranous cytoplasmic organelles in laterodorsal
and pedunculopontine tegmental nuclei. J Comp Neurol 419:32-48.
Gasbarri A, Campana E, Pacitti C, Hajdu F, Tombol T (1991) Organization of the
projections from the ventral tegmental area of Tsai to the hippocampal formation
in the rat. J Hirnforsch 32:429-437.
George R, Haslett W, Jenden D (1964) A cholinergic mechanism in the brainstem
reticular formation: induction of paradoxical sleep. Int J Neuropharmacol 3:541-
552.
Gervasoni D, Darracq L, Fort P, Souliere F, Chouvet G, Luppi PH (1998)
Electrophysiological evidence that noradrenergic neurons of the rat locus
coeruleus are tonically inhibited by GABA during sleep. Eur J Neurosci 10:964-
970.
Gilmor ML, Nash NR, Roghani A, Edwards RH, Yi H, Hersch SM, Levey AI (1996)
Expression of the putative vesicular acetylcholine transporter in rat brain and
localization in cholinergic synaptic vesicles. J Neurosci 16:2179-2190.
Gong H, McGinty D, Guzman-Marin R, Chew KT, Stewart D, Szymusiak R (2004)
Activation of c-fos in GABAergic neurones in the preoptic area during sleep and
in response to sleep deprivation. J Physiol 556:935-946.
Greene RW, Carpenter DO (1985) Actions of neurotransmitters on pontine medial
reticular formation neurons of the cat. J Neurophysiol 54:520-531.
Greene RW, Gerber U, McCarley RW (1989) Cholinergic activation of medial pontine
reticular formation neurons in vitro. Brain Res 476:154-159.

144
Haas LF (2003) Hans Berger (1873-1941), Richard Caton (1842-1926), and
electroencephalography. J Neurol Neurosurg Psychiatry 74:9.
Hallanger AE, Levey AI, Lee HJ, Rye DB, Wainer BH (1987) The origins of cholinergic
and other subcortical afferents to the thalamus in the rat. J Comp Neurol 262:105-
124.
Hassani OK, Lee MG, Henny P, Jones BE (2009) Discharge profiles of identified
GABAergic in comparison to cholinergic and putative glutamatergic basal
forebrain neurons across the sleep-wake cycle. J Neurosci 29:11828-11840.
Hassani OK, Henny P, Lee MG, Jones BE (2010) GABAergic neurons intermingled with
orexin and MCH neurons in the lateral hypothalamus discharge maximally during
sleep. Eur J Neurosci 32:448-457.
Henny P, Jones BE (2008) Projections from basal forebrain to prefrontal cortex comprise
cholinergic, GABAergic and glutamatergic inputs to pyramidal cells or
interneurons. Eur J Neurosci 27:654-670.
Hernandez-Lopez S, Bargas J, Reyes A, Galarraga E (1996) Dopamine modulates the
afterhyperpolarization in neostriatal neurones. Neuroreport 7:454-456.
Herzog E, Gilchrist J, Gras C, Muzerelle A, Ravassard P, Giros B, Gaspar P, El
Mestikawy S (2004) Localization of VGLUT3, the vesicular glutamate transporter
type 3, in the rat brain. Neuroscience 123:983-1002.
Hobson JA (1992) Sleep and dreaming: induction and mediation of REM sleep by
cholinergic mechanisms. Curr Opin Neurobiol 2:759-763.
Hobson JA, McCarley RW, Wyzinski PW (1975) Sleep cycle oscillation: reciprocal
discharge by two brainstem neuronal groups. Science 189:55-58.

145
Holmes CJ, Jones BE (1994) Importance of cholinergic, GABAergic, serotonergic and
other neurons in the medial medullary reticular formation for sleep-wake states
studied by cytotoxic lesions in the cat. Neuroscience 62:1179-1200.
Holmes CJ, Mainville LS, Jones BE (1994) Distribution of cholinergic, GABAergic and
serotonergic neurons in the medullary reticular formation and their projections
studied by cytotoxic lesions in the cat. Neuroscience 62:1155-1178.
Hou YP, Manns ID, Jones BE (2001) Expression of alpha-1 and alpha-2 adrenergic
receptors on the noradrenergic and cholinergic neurons of the pontomesencephalic
tegmentum. Actas de Fisiologia 7:184.
Houser CR, Crawford GD, Barber RP, Salvaterra P (1983) Organization and
morphological characteristics of cholinergic neurons: an immunocytochemical
study with a monoclonal antibody to choline acetyltransferase. Brain Res 266:97-
119.
Imeri L, Bianchi S, Angeli P, Mancia M (1994) Selective blockade of different brain stem
muscarinic receptor subtypes: effects on the sleep-wake cycle. Brain Res 636:68-
72.
Jasper HH, Tessier J (1971) Acetylcholine liberation from cerebral cortex during
paradoxical (REM) sleep. Science 172:601-602.
Johanson CE, Roehrs T, Schuh K, Warbasse L (1999) The effects of cocaine on mood
and sleep in cocaine-dependent males. Exp Clin Psychopharmacol 7:338-346.
Jones B (1972) The respective involvement of noradrenaline and its deaminated
metabolites in waking and paradoxical sleep: a neuropharmacological model.
Brain Res 39:121-136.

146
Jones BE (1989) Basic mechanisms of sleep-wake states. In: Principles and Practice of
Sleep Medicine (Kryger MR, Roth T, Dement WC, eds), pp 121-138.
Philadelphia: Saunders.
Jones BE (1990a) Influence of the brainstem reticular formation, including intrinsic
monoaminergic and cholinergic neurons, upon forebrain mechanisms of sleep and
waking. In: The Diencephalon and Sleep (Mancia M, Marini G, eds), pp 31-48.
New York: Raven Press.
Jones BE (1990b) Immunohistochemical study of choline acetyl transferase-
immunoreactive processes and cells innervating the pontomedullary reticular
formation. J Comp Neurol 295:485-514.
Jones BE (1991a) Noradrenergic locus coeruleus neurons: their distant connections and
their relationship to neighboring--including cholinergic and GABAergic--neurons
of the central gray and reticular formation. In: Neurobiology of the Locus
Coeruleus. Progress in Brain Research, Vol. 85 (Barnes C, Pompeiano O, eds), pp
15-30. Amsterdam: Elsevier.
Jones BE (1991b) The role of noradrenergic locus coeruleus neurons and neighboring
cholinergic neurons of the pontomesencephalic tegmentum in sleep-wake states.
Prog Brain Res 88:533-543.
Jones BE (1991c) Paradoxical sleep and its chemical/structural substrates in the brain.
Neuroscience 40:637-656.
Jones BE (1993) The organization of central cholinergic systems and their functional
importance in sleep-waking states. Prog Brain Res 98:61-71.
147
Jones BE (1995) Reticular formation. Cytoarchitecture, transmitters and projections. In:
The Rat Nervous System, 2nd Edition (Paxinos G, ed), pp 155-171. Sydney:
Academic Press Australia.
Jones BE (2003) Arousal systems. Front Biosci 8:S438-451.
Jones BE (2004) Paradoxical REM sleep promoting and permitting neuronal networks.
Arch Ital Biol 142:379-396.
Jones BE (2005) From waking to sleeping: neuronal and chemical substrates. Trends
Pharmacol Sci 26:578-586.
Jones BE (2008) Modulation of cortical activation and behavioral arousal by cholinergic
and orexinergic systems. Ann N Y Acad Sci 1129:26-34.
Jones BE (2010) Neurobiology of waking and sleeping. In: Handbook of Clinical
Neurology. Sleep Disorders. (Montagna P, Chokroverty S, eds), pp 131-148.
Amsterdam: Elsevier.
Jones BE, Yang T-Z (1985) The efferent projections from the reticular formation and the
locus coeruleus studied by anterograde and retrograde axonal transport in the rat. J
Comp Neurol 242:56-92.
Jones BE, Beaudet A (1987) Distribution of acetylcholine and catecholamine neurons in
the cat brain stem studied by choline acetyltransferase and tyrosine hydroxylase
immunohistochemistry. J Comp Neurol 261:15-32.
Jones BE, Webster HH (1988) Neurotoxic lesions of the dorsolateral pontomesencephalic
tegmentum - cholinergic cell area in the cat. I. Effects upon the cholinergic
innervation of the brain. Brain Res 451:13-32.
148
Jones BE, Cuello AC (1989) Afferents to the basal forebrain cholinergic cell area from
pontomesencephalic--catecholamine, serotonin, and acetylcholine--neurons.
Neuroscience 31:37-61.
Jones BE, Bobillier P, Pin C, Jouvet M (1973) The effect of lesions of catecholamine-
containing neurons upon monoamine content of the brain and EEG and behavioral
waking in the cat. Brain Res 58:157-177.
Jones BE, Holmes CJ, Rodriguez-Veiga E, Mainville L (1991) GABA-synthesizing
neurons in the medulla: Their relationship to serotonin-containing and spinally
projecting neurons in the rat. J Comp Neurol 312:1-19.
Jouvet M (1962) Recherches sur les structures nerveuses et les mécanismes responsables
des differentes phases du sommeil physiologique. Arch Ital Biol 100:125-206.
Jouvet M (1972) The role of monoamines and acetylcholine-containing neurons in the
regulation of the sleep-waking cycle. Ergeb Physiol 64:165-307.
Jouvet M, Michel F, Courjon J (1959) Sur un stade d'activité électrique cérébrale rapide
au cours du sommeil physiologique. C R Soc Biol 153:1024-1028.
Kamondi A, Williams JA, Hutcheon B, Reiner PB (1992) Membrane properties of
mesopontine cholinergic neurons studied with the whole-cell patch-clamp
technique: implications for behavioral state control. J Neurophysiol 68:1359-1372.
Kanamori N, Sakai K, Jouvet M (1980) Neuronal activity specific to paradoxical sleep in
the ventromedial medullary reticular formation of unrestrained cats. Brain Res
189:251-255.
Kaneko T, Itoh K, Shigemoto R, Mizuno N (1989) Glutaminase-like immunoreactivity in
the lower brainstem and cerebellum of the adult rat. Neuroscience 32:79-98.
149
Karczmar AG, Longo VG, Scotti de Carolis A (1970) A pharmacological model of
paradoxical sleep: the role of cholinergic and monoamine systems. Physiol Behav
5:175-182.
Kaur S, Saxena RN, Mallick BN (1997) GABA in locus coeruleus regulates spontaneous
rapid eye movement sleep by acting on GABAA receptors in freely moving rats.
Neurosci Lett 223:105-108.
Kayama Y, Ogawa T (1987) Electrophysiology of ascending, possibly cholinergic
neurons in the rat laterodorsal tegmental nucleus: comparison with monoamine
neurons. Neurosci Lett 77:277-282.
Kayama Y, Ohta M, Jodo E (1992) Firing of 'possibly' cholinergic neurons in the rat
laterodorsal tegmental nucleus during sleep and wakefulness. Brain Res 569:210-
220.
Keane PE, Candy JM, Bradley PB (1976) The role of endogenous catecholamines in the
regulation of electrocortical activity in the encephale isole cat. Electroencephalogr
Clin Neurophysiol 41:561-570.
Khateb A, Muhlethaler M, Alonso A, Serafin M, Mainville L, Jones BE (1992)
Cholinergic nucleus basalis neurons display the capacity for rhythmic bursting
activity mediated by low threshold calcium spikes. Neuroscience 51:489-494.
Kodama T, Takahashi Y, Honda Y (1990) Enhancement of acetylcholine release during
paradoxical sleep in the dorsal tegmental field of the cat brain stem. Neurosci Lett
114:277-282.
Kodama T, Lai YY, Siegel JM (1998) Enhanced glutamate release during REM sleep in
the rostromedial medulla as measured by in vivo microdialysis. Brain Res
780:176-179.
150
Koelle GB (1951) The elimination of enzymatic diffusion artifacts in the histochemical
localization of cholinesterases and a survey of their cellular distributions. J
Pharmacol Exp Ther 103:153-171.
Koyama Y, Sakai K (2000) Modulation of presumed cholinergic mesopontine tegmental
neurons by acetylcholine and monoamines applied iontophoretically in
unanesthetized cats. Neuroscience 96:723-733.
Koyama Y, Takahashi K, Kodama T, Kayama Y (2003) State-dependent activity of
neurons in the perifornical hypothalamic area during sleep and waking.
Neuroscience 119:1209-1219.
Koyama Y, Honda T, Kusakabe M, Kayama Y, Sugiura Y (1998) In vivo
electrophysiological distinction of histochemically identified cholinergic neurons
using extracellular recording and labelling in rat laterodorsal tegmental nucleus.
Neuroscience 83:1105-1112.
Krenzer M, Anaclet C, Vetrivelan R, Wang N, Vong L, Lowell BB, Fuller PM, Lu J
(2011) Brainstem and spinal cord circuitry regulating REM sleep and muscle
atonia. PLoS One 6:e24998.
Lancel M, Cronlein TA, Faulhaber J (1996) Role of GABAA receptors in sleep
regulation. Differential effects of muscimol and midazolam on sleep in rats.
Neuropsychopharmacology 15:63-74.
Lee MG, Hassani OK, Jones BE (2005a) Discharge of identified orexin/hypocretin
neurons across the sleep-waking cycle. J Neurosci 25:6716-6720.
Lee MG, Manns ID, Alonso A, Jones BE (2004) Sleep-wake related discharge properties
of basal forebrain neurons recorded with micropipettes in head-fixed rats. J
Neurophysiol 92:1182-1198.
151
Lee MG, Hassani OK, Alonso A, Jones BE (2005b) Cholinergic basal forebrain neurons
burst with theta during waking and paradoxical sleep. J Neurosci 25:4365-4369.
Leonard CS, Llinas RR (1990) Electrophysiology of mammalian pedunculopontine and
laterodorsal tegmental neurons in vitro: implications for the control of REM sleep.
In: Brain Cholinergic Systems (Steriade M, Biesold D, eds), pp 205-223. New
York: Oxford University Press.
Levine ES, Jacobs BL (1992) Neurochemical afferents controlling the activity of
serotonergic neurons in the dorsal raphe nucleus: Microiontophoretic studies in
the awake cat. J Neurosci 12:4037-4044.
Lin L, Faraco J, Li R, Kadotani H, Rogers W, Lin X, Qiu X, de Jong PJ, Nishino S,
Mignot E (1999) The sleep disorder canine narcolepsy is caused by a mutation in
the hypocretin (orexin) receptor 2 gene. Cell 98:365-376.
Lindsley DB, Bowden JW, Magoun HW (1949) Effect upon the EEG of acute injury to
the brain stem activating system. Electroencephalogr Clin Neurophysiol 1:475-
486.
Lindsley DB, Schreiner LH, Knowles WB, Magoun HW (1950) Behavioral and EEG
changes following chronic brain stem lesions. Electroencephalogr Clin
Neurophysiol 2:483-498.
Loomis AL, Harvey EN, Hobart G (1935a) Potential Rhythms of the Cerebral Cortex
during Sleep. Science 81:597-598.
Loomis AL, Harvey EN, Hobart G (1935b) Further Observations on the Potential
Rhythms of the Cerebral Cortex during Sleep. Science 82:198-200.
152
Loughlin SE, Fallon JH (1983) Dopaminergic and non-dopaminergic projections to
amygdala from substantia nigra and ventral tegmental area. Brain Res 262:334-
338.
Lu J, Sherman D, Devor M, Saper CB (2006) A putative flip-flop switch for control of
REM sleep. Nature 441:589-594.
Luebke JI, Greene RW, Semba K, Kamondi A, McCarley RW, Reiner PB (1992)
Serotonin hyperpolarizes cholinergic low-threshold burst neurons in the rat
laterodorsal tegmental nucleus in vitro. Proc Natl Acad Sci 89:743-747.
MacIntosh FC (1941) The distribution of acetylcholine in the peripheral and the central
nervous system. J Physiol, Lond 99:436-442.
Maclver MB, Mikulec AA, Amagasu SM, Monroe FA (1996) Volatile anesthetics depress
glutamate transmission via presynaptic actions. Anesthesiology 85:823-834.
Magoun HW, Rhines R (1946) An inhibitory mechanism in the bulbar reticular
formation. J Neurophysiol 9:165-171.
Maloney KJ, Mainville L, Jones BE (1999) Differential c-Fos expression in cholinergic,
monoaminergic and GABAergic cell groups of the pontomesencephalic
tegmentum after paradoxical sleep deprivation and recovery. J Neurosci 19:3057-
3072.
Maloney KJ, Mainville L, Jones BE (2000) c-Fos expression in GABAergic, serotonergic
and other neurons of the pontomedullary reticular formation and raphe after
paradoxical sleep deprivation and recovery. J Neurosci 20:4669-4679.
Maloney KJ, Mainville L, Jones BE (2002) c-Fos expression in dopaminergic and
GABAergic neurons of the ventral mesencephalic tegmentum after paradoxical
sleep deprivation and recovery. Eur J Neurosci 15:774-778.

153
Maloney KJ, Cape EG, Gotman J, Jones BE (1997) High-frequency gamma
electroencephalogram activity in association with sleep-wake states and
spontaneous behaviors in the rat. Neuroscience 76:541-555.
Manns ID, Alonso A, Jones BE (2000a) Discharge properties of juxtacellularly labeled
and immunohistochemically identified cholinergic basal forebrain neurons
recorded in association with the electroencephalogram in anesthetized rats. J
Neurosci 20:1505-1518.
Manns ID, Alonso A, Jones BE (2000b) Discharge profiles of juxtacellularly labeled and
immunohistochemically identified GABAergic basal forebrain neurons recorded
in association with the electroencephalogram in anesthetized rats. J Neurosci
20:9252-9263.
Manns ID, Mainville L, Jones BE (2001) Evidence for glutamate, in addition to
acetylcholine and GABA, neurotransmitter synthesis in basal forebrain neurons
projecting to the entorhinal cortex. Neuroscience 107:249-263.
Manns ID, Alonso A, Jones BE (2003) Rhythmically discharging basal forebrain units
comprise cholinergic, GABAergic, and putative glutamatergic cells. J
Neurophysiol 89:1057-1066.
McCarley RW, Hobson JA (1975) Neuronal excitability modulation over the sleep cycle:
a structural and mathematical model. Science 189:58-60.
McCarley RW, Greene RW, Rainnie D, Portas CM (1995) Brainstem neuromodulation
and REM sleep. The Neurosciences 7:341-354.
McCormick DA (1992) Cellular mechanisms underlying cholinergic and noradrenergic
modulation of neuronal firing mode in the cat and guinea pig dorsal lateral
geniculate nucleus. J Neurosci 12:278-289.

154
McCormick DA, Prince DA (1986) Acetylcholine induces burst firing in thalamic
reticular neurones by activatiing a potassium conductance. Nature 319:1-3.
McCormick DA, Prince DA (1987) Actions of acetylcholine in the guinea-pig and cat
medial and lateral geniculate nuclei, in vitro. J Physiol (Lond) 392:147-165.
McGinty D, Harper RM (1976a) Dorsal raphe neurons: depression of firing during sleep
in cats. Brain Res 101:569-575.
McGinty DJ, Harper RM (1976b) Dorsal raphe neurons: depression of firing during sleep
in cats. Brain Res 101:569-575.
McGinty DJ, Harper RM, Fairbanks MK (1974) Neuronal unit activity and the control of
sleep states. In: Advances in Sleep Research (Weitzman ED, ed), pp 173-216.
New York: Spectrum Publications.
Mena-Segovia J, Sims HM, Magill PJ, Bolam JP (2008) Cholinergic brainstem neurons
modulate cortical gamma activity during slow oscillations. J Physiol 586:2947-
2960.
Mendelson WB (1985) GABA-Benzodiazepine receptor-chloride ionophore complex:
implications for the pharmacology of sleep. In: Sleep. Neurotransmitters and
Neuromodulators (Wauquier A, Monti JM, Gaillard JM, Radulovacki M, eds), pp
229-236. New York: Raven Press.
Mesulam M-M, Mufson EJ, Wainer BH, Levey AI (1983) Central cholinergic pathways
in the rat: an overview based on an alternative nomenclature (Ch1-Ch6).
Neuroscience 10:1185-1201.
Mesulam M-M, Mufson EJ, Levey AI, Wainer BH (1984) Atlas of cholinergic neurons in
the forebrain and upper brainstem of the macaque based on monoclonal choline
155
acetyltransferase immunohistochemistry and acetylcholinesterase histochemistry.
Neuroscience 12:669-686.
Mirenowicz J, Schultz W (1996) Preferential activation of midbrain dopamine neurons by
appetitive rather than aversive stimuli. Nature 379:449-451.
Mitani A, Ito K, Hallanger AE, Wainer BH, Kataoka K, McCarley RW (1988)
Cholinergic projections from the laterodorsal and pedunculopontine tegmental
nuclei to the pontine gigantocellular tegmental field in the cat. Brain Res 451:397-
402.
Mitler MM, Dement WC (1974) Cataplectic-like behavior in cats after microinjections of
carbachol in pontine reticular formation. Brain Res 68:335-343.
Modirrousta M, Mainville L, Jones BE (2004) GABAergic neurons with alpha2-
adrenergic receptors in basal forebrain and preoptic area express c-Fos during
sleep. Neuroscience 129:803-810.
Montaron M-F, Bouyer J-J, Rougeul A, Buser P (1982) Ventral mesencephalic
tegmentum (VMT) controls electrocortical beta rhythms and associated attentive
behaviour in the cat. Behav Brain Res 6:129-145.
Moruzzi G, Magoun HW (1949) Brain stem reticular formation and activation of the
EEG. Electroencephalogr Clin Neurophysiol 1:455-473.
Mugnaini E, Oertel WH (1985) An atlas of the distribution of GABAergic neurons and
terminals. In: Handbook of Chemical Neuroanatomy. Vol. 4: GABA and
Neuropeptides in the CNS, Part I. (Bjorklund A, Hokfelt T, eds), pp 436-608.
Amsterdam: Elsevier.
Narita M, Matsushima Y, Niikura K, Takagi S, Nakahara K, Kurahashi K, Abe M, Saeki
M, Asato M, Imai S, Ikeda K, Kuzumaki N, Suzuki T (2010) Implication of
156
dopaminergic projection from the ventral tegmental area to the anterior cingulate
cortex in mu-opioid-induced place preference. Addict Biol 15:434-447.
Nauta WJH, Kuypers HGJM (1958) Some ascending pathways in the brain stem reticular
formation. In: Reticular Formation of the Brain (Jasper HH, Proctor LD, Knighton
RS, Noshay WC, eds), pp 3-30. Boston: Little, Brown & Co.
Nickerson Poulin A, Guerci A, El Mestikawy S, Semba K (2006) Vesicular glutamate
transporter 3 immunoreactivity is present in cholinergic basal forebrain neurons
projecting to the basolateral amygdala in rat. J Comp Neurol 498:690-711.
Nitz D, Siegel J (1997a) GABA release in the dorsal raphe nucleus: role in the control of
REM sleep. Am J Physiol 273:R451-R455.
Nitz D, Siegel JM (1997b) GABA release in the locus coeruleus as a function of
sleep/wake state. Neuroscience 78:795-801.
Oertel WH, Nitsch C, Mugnaini E (1984) Immunocytochemical demonstration of the
GABA-ergic neurons in rat globus pallidus and nucleus entopeduncularis and their
GABA-ergic innervation. Adv Neurol 40:91-98.
Onoe H, Sakai K (1995) Kainate receptors: a novel mechanism in paradoxical (REM)
sleep generation. Neuroreport 6:353-356.
Paiva T, Bugalho P, Bentes C (2011) Dreaming and cognition in patients with
frontotemporal dysfunction. Conscious Cogn 20:1027-1035.
Pare D, Smith Y, Parent A, Steriade M (1988) Projections of brainstem core cholinergic
and non-cholinergic neurons of cat to intralaminar and reticular thalamic nuclei.
Neuroscience 25:69-86.
Peyron C et al. (2000) A mutation in a case of early onset narcolepsy and a generalized
absence of hypocretin peptides in human narcoleptic brains. Nat Med 6:991-997.
157
Pinault D (1996) A novel single-cell staining procedure performed in vivo under
electrophysiological control: morpho-functional features of juxtacellularly labeled
thalamic cells and other central neurons with biocytin or Neurobiotin. J Neurosci
Methods 65:113-136.
Pinault D (2008) N-methyl d-aspartate receptor antagonists ketamine and MK-801 induce
wake-related aberrant gamma oscillations in the rat neocortex. Biol Psychiatry
63:730-735.
Portas CM, Bjorvatn B, Fagerland S, Gronli J, Mundal V, Sorensen E, Ursin R (1998)
On-line detection of extracellular levels of serotonin in dorsal raphe nucleus and
frontal cortex over the sleep/wake cycle in the freely moving rat. Neuroscience
83:807-814.
Portavella M, Vargas JP (2005) Emotional and spatial learning in goldfish is dependent
on different telencephalic pallial systems. Eur J Neurosci 21:2800-2806.
Rasmusson DD, Clow K, Szerb JC (1994) Modification of neocortical acetylcholine
release and electroencephalogram desynchronization due to brainstem stimulation
by drugs applied to the basal forebrain. Neuroscience 60:665-677.
Richardson NR, Gratton A (1996) Behavior-relevant changes in nucleus accumbens
dopamine transmission elicited by food reinforcement: an electrochemical study
in rat. J Neurosci 16:8160-8169.
Rukhadze I, Kubin L (2007) Mesopontine cholinergic projections to the hypoglossal
motor nucleus. Neurosci Lett 413:121-125.
Sakai K (1985) Neurons responsible for paradoxical sleep. In: Sleep: Neurotransmitters
and Neuromodulators (Wauquier A, Gaillard JM, Monti JM, Radulovacki M, eds),
pp 29-42. New York: Raven Press.
158
Sakai K, Koyama Y (1996) Are there cholinergic and non-cholinergic paradoxical sleep-
on neurones in the pons. NeuroReport 7:2449-2453.
Sakai K, El Mansari M, Jouvet M (1990) Inhibition by carbachol microinjections of
presumptive cholinergic PGO-on neurons in freely moving cats. Brain Res
527:213-223.
Sakai K, Sastre J-P, Kanamori N, Jouvet M (1981) State-specific neurons in the ponto-
medullary reticular formation with special reference to the postural atonia during
paradoxical sleep in the cat. In: Brain Mechanisms and Perceptual Awareness
(Pompeiano O, Ajmone-Marsan C, eds), pp 405-429. New York: Raven Press.
Sakai K, Sastre J-P, Salvert D, Touret M, Tohyama M, Jouvet M (1979)
Tegmentoreticular projections with special reference to the muscular atonia during
paradoxical sleep in the cat: an HRP study. Brain Res 176:233-254.
Sanford LD, Tang X, Xiao J, Ross RJ, Morrison AR (2003) GABAergic regulation of
REM sleep in reticularis pontis oralis and caudalis in rats. J Neurophysiol 90:938-
945.
Saper CB, Fuller PM, Pedersen NP, Lu J, Scammell TE (2010) Sleep state switching.
Neuron 68:1023-1042.
Sapin E, Lapray D, Berod A, Goutagny R, Leger L, Ravassard P, Clement O, Hanriot L,
Fort P, Luppi PH (2009) Localization of the brainstem GABAergic neurons
controlling paradoxical (REM) sleep. PLoS One 4:e4272.
Satoh K, Fibiger HC (1986) Cholinergic neurons of the laterodorsal tegmental nucleus:
efferent and afferent connections. J Comp Neurol 253:277-302.
Satoh K, Armstrong DM, Fibiger HC (1983) A comparison of the distribution of central
cholinergic neurons as demonstrated by acetylcholinesterase

159
pharmacohistochemistry and choline acetyltransferase immunohistochemistry.
Brain Res Bull 11:693-720.
Scheibel ME, Scheibel AB (1958) Structural substrates for integrative patterns in the
brain stem reticular core. In: Reticular Formation of the Brain (Jasper HH, Proctor
LD, Knighton RS, Noshay WC, eds), pp 31-68. Boston: Little, Brown & Co.
Schulz DW, Macdonald RL (1981) Barbiturate enhancement of GABA-mediated
inhibition and activation of chloride ion conductance: Correlation with
anticonvulsant and anesthetic actions. Brain Res 209:177-188.
Semba K (1993) Aminergic and cholinergic afferents to REM sleep induction regions of
the pontine reticular formation in the rat. J Comp Neurol 330:543-556.
Semba K, Reiner PB, Fibiger HC (1990) Single cholinergic mesopontine tegmental
neurons project to both the pontine reticular formation and the thalamus in the rat.
Neuroscience 38:643-654.
Shute CCD, Lewis PR (1963) Cholinesterase-containing systems of the brain of the rat.
Nature 199:1160-1164.
Shute CCD, Lewis PR (1967) The ascending cholinergic reticular system: neocortical,
olfactory and subcortical projections. Brain 90:497-520.
Siegel JM (1979) Behavioral functions of the reticular formation. Brain Res 180:69-105.
Siegel JM, McGinty DJ (1977) Pontine reticular formation neurons: relationship of
discharge to motor activity. Science 196:678-680.
Siegel JM, Nienhuis R, Fahringer HM, Paul R, Shiromani P, Dement WC, Mignot E,
Chiu C (1991) Neuronal activity in narcolepsy: Identification of cataplexy-related
cells in the medial medulla. Science 252:1315-1318.
160
Sobel E, Corbett D (1984) Axonal branching of ventral tegmental and raphe projections
to the frontal cortex in the rat. Neurosci Lett 48:121-125.
Sofroniew MV, Priestley JV, Consolazione A, Eckenstein F, Cuello AC (1985)
Cholinergic projections from the midbrain and pons to the thalamus in the rat,
identified by combined retrograde tracing and choline acetyltransferase
immunohistochemistry. Brain Res 329:213-223.
Somogyi P, Klausberger T (2005) Defined types of cortical interneurone structure space
and spike timing in the hippocampus. J Physiol 562:9-26.
Starzl TE, Taylor CW, Magoun HW (1951) Ascending conduction in reticular activating
system, with special reference to the diencephalon. J Neurophysiol 14:461-477.
Steriade M (1993) Cholinergic blockage of network- and intrinsically generated slow
oscillations promotes waking and REM sleep activity patterns in thalamic and
cortical neurons. Prog Brain Res 98:345-355.
Steriade M (2003) Pioneering steps in studies on sleep and epilepsy (Chapter 1). In:
Neuronal Substrates of Sleep and Epilepsy (Press CU, ed).
Steriade M (2004) Acetylcholine systems and rhythmic activities during the waking--
sleep cycle. Prog Brain Res 145:179-196.
Steriade M, Hobson JA (1976) Neuronal activity during the sleep-waking cycle. Prog
Neurobiol 6:155-376.
Steriade M, Deschenes M (1984) The thalamus as a neuronal oscillator. Brain Res Rev
8:1-63.
Steriade M, Llinas RR (1988) The functional states of the thalamus and the associated
neuronal interplay. Physiol Rev 68:649-742.

161
Steriade M, Oakson G, Ropert N (1982) Firing rates and patterns of midbrain reticular
neurons during steady and transitional states of the sleep-waking cycle. Exp Brain
Res 46:37-51.
Steriade M, Domich L, Oakson G (1986) Reticularis thalami neurons revisited: Activity
changes during shifts in states of vigilance. J Neurosci 6:68-81.
Steriade M, Timofeev I, Grenier F (2001) Natural waking and sleep states: a view from
inside neocortical neurons. J Neurophysiol 85:1969-1985.
Steriade M, Pare D, Parent A, Smith Y (1988) Projections of cholinergic and non-
cholinergic neurons of the brainstem core to relay and associational thalamic
nuclei in the cat and macaque monkey. Neuroscience 25:47-67.
Steriade M, Curro Dossi R, Pare D, Oakson G (1991) Fast oscillations (20-40Hz) in
thalamocortical systems and their potentiation by mesopontine cholinergic nuclei
in the cat. Proc Natl Acad Sci USA 88:4396-4400.
Steriade M, Datta S, Pare D, Oakson G, Curro Dossi RC (1990a) Neuronal activities in
brain-stem cholinergic nuclei related to tonic activation processes in
thalamocortical systems. J Neurosci 10:2541-2559.
Steriade M, Pare D, Datta S, Oakson G, Curro Dossi R (1990b) Different cellular types in
mesopontine cholinergic nuclei related to ponto-geniculo-occipital waves. J
Neurosci 10:2560-2579.
Stevens DR, McCarley RW, Greene RW (1992) Serotonin1 and serotonin2 receptors
hyperpolarize and depolarize separate populations of medial pontine reticular
formation neurons in vitro. Neuroscience 47:545-553.

162
Takakusaki K, Shiroyama T, Kitai ST (1997) Two types of cholinergic neurons in the rat
tegmental pedunculopontine nucleus: electrophysiological and morphological
characterization. Neuroscience 79:1089-1109.
Tepper JM, Martin LP, Anderson DR (1995) GABAA receptor-mediated inhibition of rat
substantia nigra dopaminergic neurons by pars reticulata projection neurons. J
Neurosci 15:3092-3103.
Thakkar MM, Strecker RE, McCarley RW (1998) Behavioral state control through
differential serotonergic inhibition in the mesopontine cholinergic nuclei: a
simultaneous unit recording and microdialysis study. J Neurosci 18:5490-5497.
Thannickal TC, Moore RY, Nienhuis R, Ramanathan L, Gulyani S, Aldrich M, Cornford
M, Siegel JM (2000) Reduced number of hypocretin neurons in human
narcolepsy. Neuron 27:469-474.
Timofeev I, Grenier F, Steriade M (1998) Spike-wave complexes and fast components of
cortically generated seizures. IV. Paroxysmal fast runs in cortical and thalamic
neurons. J Neurophysiol 80:1495-1513.
Trulson ME, Jacobs BL (1979) Raphe unit activity in freely moving cats: correlation with
level of behavioral arousal. Brain Res 163:135-150.
Ungerstedt U (1971) Adipsia and aphagia after 6-hydroxydopamine induced degeneration
of the nigro-striatal dopamine system. Acta Physiol Scand Suppl 367:95-122.
Vanni-Mercier G, Sakai K, Lin J-S, Jouvet M (1989) Mapping of cholinoceptive
brainstem structures responsible for the generation of paradoxical sleep in the cat.
Arch Ital Biol 127:133-164.
Velazquez-Moctezuma J, Gillin JC, Shiromani PJ (1989) Effect of specific M1, M2
muscarinic receptor agonists on REM sleep generation. Brain Res 503:128-131.

163
Velazquez-Moctezuma J, Shalauta M, Gillin JC, Shiromani PJ (1991) Cholinergic
antagonists and REM sleep generation. Brain Res 543:175-179.
Vertes RP, Kocsis B (1997) Brainstem-diencephalo-septohippocampal systems
controlling the theta rhythm of the hippocampus. Neuroscience 81:893-926.
Vincent SR, Reiner PB (1987) The immunohistochemical localization of choline
acetyltransferase in the cat brain. Brain Res Bull 18:371-415.
Wang HL, Morales M (2009) Pedunculopontine and laterodorsal tegmental nuclei contain
distinct populations of cholinergic, glutamatergic and GABAergic neurons in the
rat. Eur J Neurosci 29:340-358.
Watanabe M, Maemura K, Kanbara K, Tamayama T, Hayasaki H (2002) GABA and
GABA receptors in the central nervous system and other organs. Int Rev Cytol
213:1-47.
Webster HH, Jones BE (1988) Neurotoxic lesions of the dorsolateral pontomesencephalic
tegmentum-cholinergic cell area in the cat. II. Effects upon sleep-waking states.
Brain Res 458:285-302.
Webster HH, Friedman L, Jones BE (1986) Modification of paradoxical sleep following
transections of the reticular formation at the pontomedullary junction. Sleep 9:1-
23.
Wilkinson LO, Auerbach SB, Jacobs BL (1991) Extracellular serotonin levels change
with behavioral state but not with pyrogen-induced hyperthermia. J Neurosci
11:2732-2741.
Williams JA, Comisarow J, Day J, Fibiger HC, Reiner PB (1994) State-dependent release
of acetylcholine in rat thalamus measured by in vivo microdialysis. J Neurosci
14:5236-5242.

164
Woolf NJ, Butcher LL (1986) Cholinergic systems in the rat brain: III. Projections from
the pontomesencephalic tegmentum to the thalamus, tectum, basal ganglia and
basal forebrain. Brain Res Bull 16:603-637.
Xi M-C, Morales FR, Chase MH (1999) Evidence that wakefulness and REM sleep are
controlled by a GABAergic pontine mechanism. J Neurophysiol 82:2015-2019.
Yamamura T, Harada K, Okamura A, Kemmotsu O (1990) Is the site of action of
ketamine anesthesia the N-methyl-D-aspartate receptor? Anesthesiology 72:704-
710.