document design - amazon s3...document design the maryland department of transportation maryland...
TRANSCRIPT
1 0 - Y E A R C A P I T A L N E E D S | C Y 2 0 1 9 - 2 0 2 8 i
Contents Executive Summary ......................................................................................................................... 1 1. Background and Purpose ........................................................................................................... 6
1.1 Service Overview ........................................................................................................................................ 6 1.2 Purpose of the CNI ..................................................................................................................................... 9 1.3 CNI Requirements ...................................................................................................................................... 9
2. Current Capital Asset Inventory ............................................................................................... 11 2.1 Current Asset Base ................................................................................................................................... 11
3. Methodology .......................................................................................................................... 14 3.1 Methodology Overview ............................................................................................................................ 14 3.2 Alignment to MDOT MTA Strategic Priorities, Transit Asset Management Requirements .................... 19
4. State of Good Repair Needs ..................................................................................................... 22 4.1 SGR Backlog Overview ............................................................................................................................. 22 4.2 10-Year SGR Needs Estimates ................................................................................................................. 23
5. Enhancement Needs ............................................................................................................... 27 5.1 Call for Projects Overview ....................................................................................................................... 27 5.2 10-Year Enhancement Needs Estimates .................................................................................................... 27
6. Total Capital Investment Needs ............................................................................................... 29 6.1 10-Year Total Needs ................................................................................................................................. 29 6.2 Key Findings ............................................................................................................................................. 30
7. Prioritization .......................................................................................................................... 31 7.1 Overview .................................................................................................................................................. 31 7.2 SGR Needs ................................................................................................................................................ 32 7.3 Enhancement Needs ................................................................................................................................ 37
Conclusion .................................................................................................................................... 40 Appendix A: Acronyms ................................................................................................................... 41 Appendix B .................................................................................................................................... 42
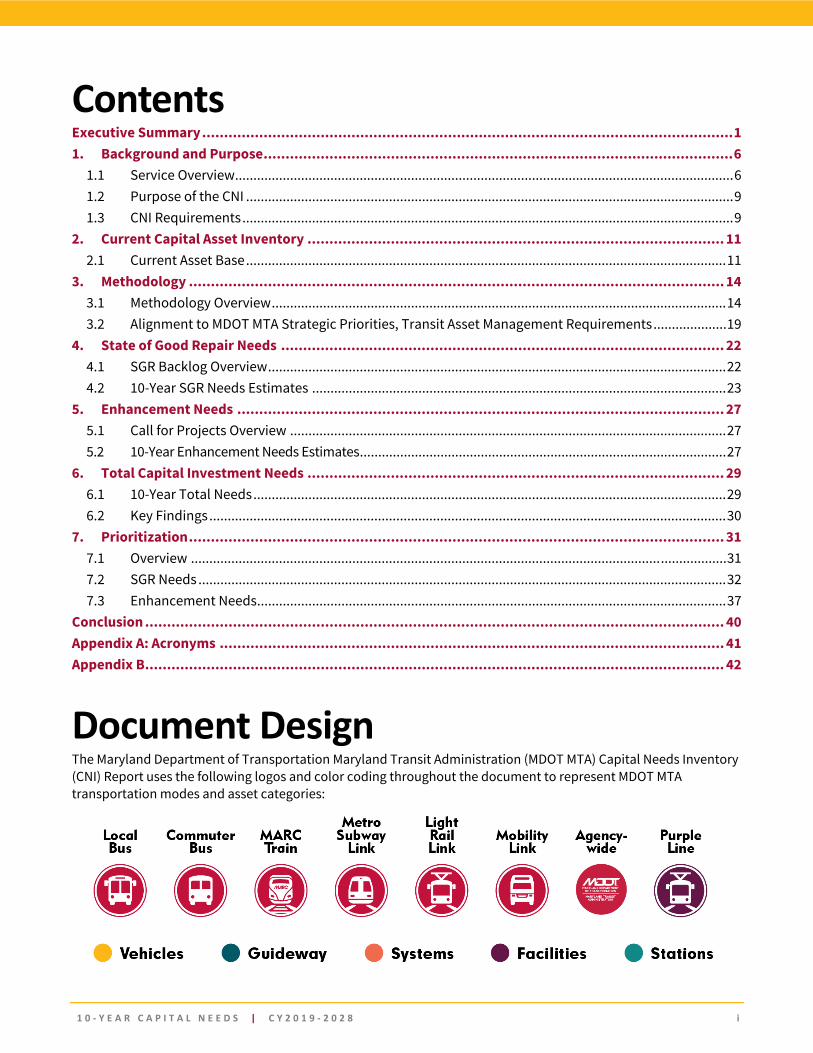
Document Design The Maryland Department of Transportation Maryland Transit Administration (MDOT MTA) Capital Needs Inventory (CNI) Report uses the following logos and color coding throughout the document to represent MDOT MTA transportation modes and asset categories:
1 0 - Y E A R C A P I T A L N E E D S | C Y 2 0 1 9 - 2 0 2 8 1
Executive Summary MDOT MTA is the 13th largest multi-modal transit system in the United States, operating and maintaining $9.5 billion in physical assets to provide transportation services to over 2.2 million people in the State of Maryland. Investing in the state of good repair of these assets and system enhancements is critical for MDOT MTA to deliver safe, efficient, reliable, and customer-focused services. This CNI, consistent with ongoing transit asset management (TAM) analyses, outlines the unconstrained investment needs between 2019 and 2028 that will help MDOT MTA meet current and future service demands and system performance goals.
MDOT MTA’s CNI captures and quantifies ongoing unconstrained capital needs over a 10-year period. It presents information from MDOT MTA’s ongoing asset management analyses and needs inventory, and is intended to support improved decision making regarding the maintenance and enhancements required to keep the overall transit system in a state of good repair and meet service demands over the long-term. Capital needs include the costs to: maintain assets in a state of good repair; meet existing or new regulatory requirements; invest in transit infrastructure, assets, or service enhancements; and modernize or adapt to new technologies or new mobility options. The Federal Transit Administration (FTA) defines state of good repair (SGR) as, “the condition in which a capital asset is able to operate at a full level of performance.”
This CNI captures and quantifies the capital investment needs for MDOT MTA-owned assets over the 10-year period for the following modes:
― Local Bus (CityLink, LocalLink, and Express BusLink)
― Commuter Bus ― MARC Train ― Metro SubwayLink ― Light RailLink ― MobilityLink
In addition, an Agencywide category captures technology and operations-related capital needs that serve multiple modes (e.g., system technology, police, treasury, and operations support).
MDOT MTA’s six transit modes and 2,560 square-mile service area connects communities with Maryland’s job centers, schools, healthcare, retail, and cultural centers.
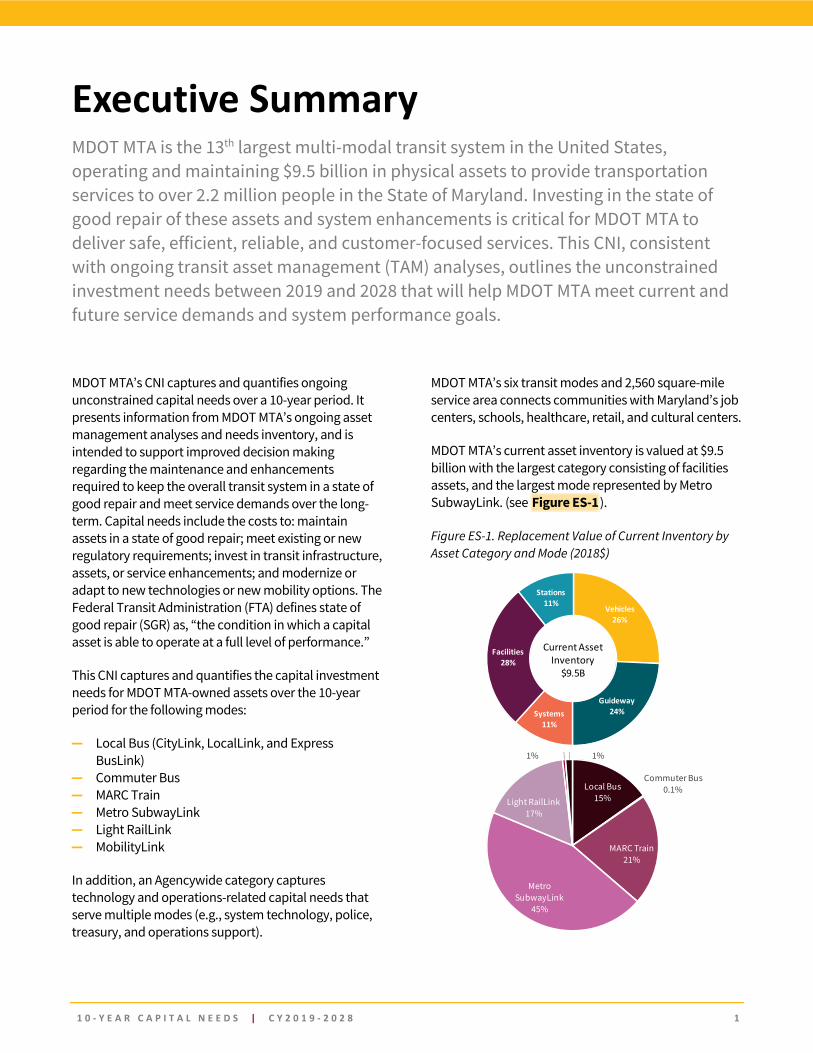
MDOT MTA’s current asset inventory is valued at $9.5 billion with the largest category consisting of facilities assets, and the largest mode represented by Metro SubwayLink. (see Figure ES-1).
Figure ES-1. Replacement Value of Current Inventory by Asset Category and Mode (2018$)
Local Bus15%
Commuter Bus0.1%
MARC Train21%
Metro SubwayLink
45%
Light RailLink17%
Mobility Link1%
Agencywide1%
Vehicles26%
Guideway24%Systems
11%
Facilities28%
Stations11%
Current Asset Inventory
$9.5B
1 0 - Y E A R C A P I T A L N E E D S | C Y 2 0 1 9 - 2 0 2 8 2
Per Maryland Chapter 352 of the 2018 legislative session, MDOT MTA’s CNI will be updated at least once every three years. Routine maintenance activities are considered operating expenses and are not included in this CNI. Significant investments and funding constraints related to the Purple Line, Locally Operated Transit Systems (LOTS), and freight rail are not included in this analysis.
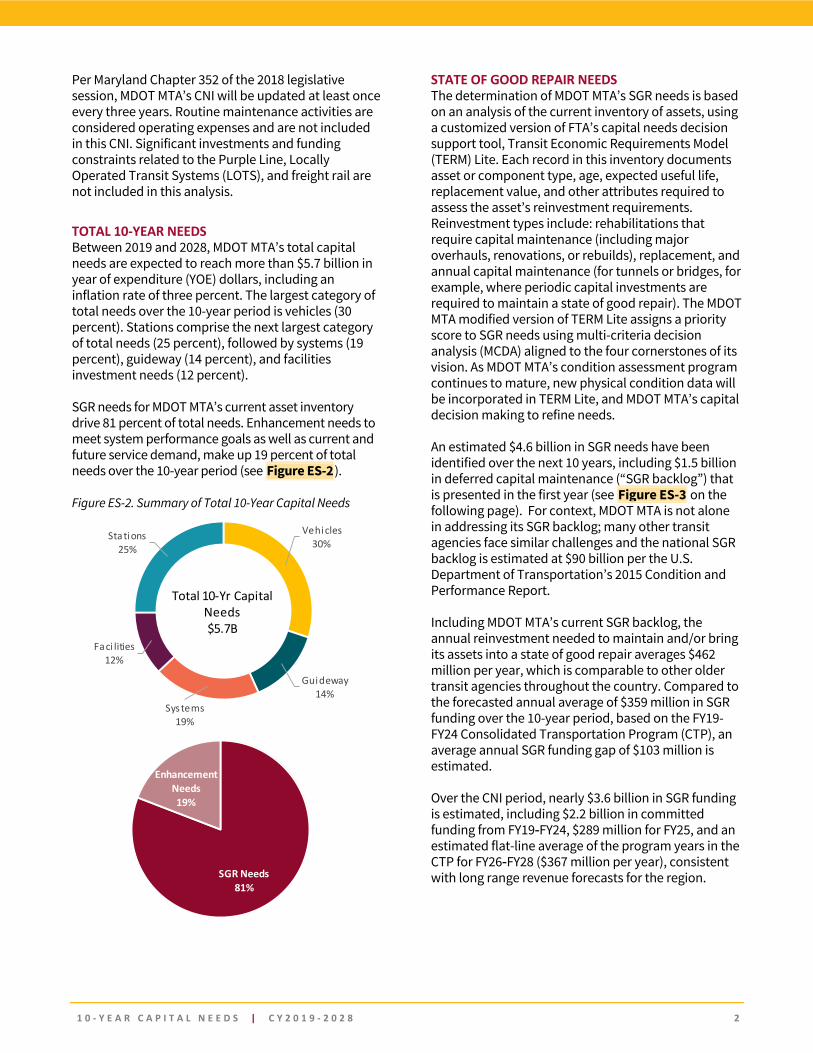
TOTAL 10-YEAR NEEDS Between 2019 and 2028, MDOT MTA’s total capital needs are expected to reach more than $5.7 billion in year of expenditure (YOE) dollars, including an inflation rate of three percent. The largest category of total needs over the 10-year period is vehicles (30 percent). Stations comprise the next largest category of total needs (25 percent), followed by systems (19 percent), guideway (14 percent), and facilities investment needs (12 percent).
SGR needs for MDOT MTA’s current asset inventory drive 81 percent of total needs. Enhancement needs to meet system performance goals as well as current and future service demand, make up 19 percent of total needs over the 10-year period (see Figure ES-2).
Figure ES-2. Summary of Total 10-Year Capital Needs
STATE OF GOOD REPAIR NEEDS The determination of MDOT MTA’s SGR needs is based on an analysis of the current inventory of assets, using a customized version of FTA’s capital needs decision support tool, Transit Economic Requirements Model (TERM) Lite. Each record in this inventory documents asset or component type, age, expected useful life, replacement value, and other attributes required to assess the asset’s reinvestment requirements. Reinvestment types include: rehabilitations that require capital maintenance (including major overhauls, renovations, or rebuilds), replacement, and annual capital maintenance (for tunnels or bridges, for example, where periodic capital investments are required to maintain a state of good repair). The MDOT MTA modified version of TERM Lite assigns a priority score to SGR needs using multi-criteria decision analysis (MCDA) aligned to the four cornerstones of its vision. As MDOT MTA’s condition assessment program continues to mature, new physical condition data will be incorporated in TERM Lite, and MDOT MTA’s capital decision making to refine needs.
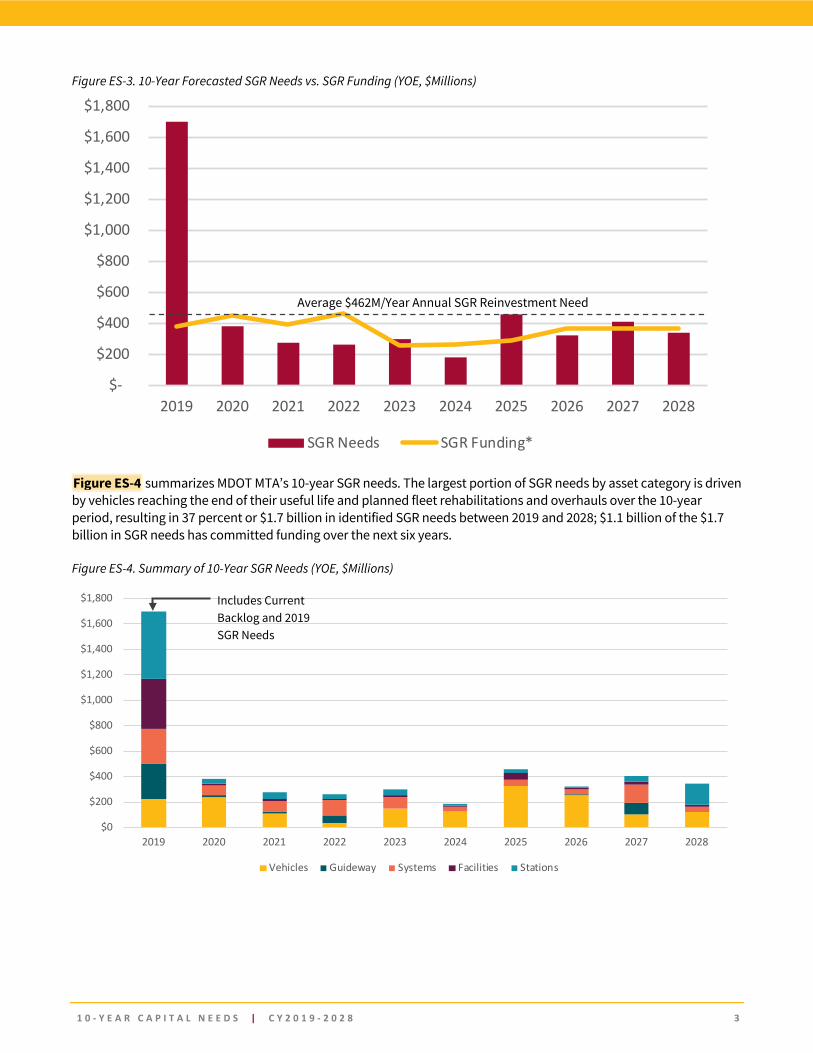
An estimated $4.6 billion in SGR needs have been identified over the next 10 years, including $1.5 billion in deferred capital maintenance (“SGR backlog”) that is presented in the first year (see Figure ES-3 on the following page). For context, MDOT MTA is not alone in addressing its SGR backlog; many other transit agencies face similar challenges and the national SGR backlog is estimated at $90 billion per the U.S. Department of Transportation’s 2015 Condition and Performance Report.
Including MDOT MTA’s current SGR backlog, the annual reinvestment needed to maintain and/or bring its assets into a state of good repair averages $462 million per year, which is comparable to other older transit agencies throughout the country. Compared to the forecasted annual average of $359 million in SGR funding over the 10-year period, based on the FY19-FY24 Consolidated Transportation Program (CTP), an average annual SGR funding gap of $103 million is estimated.
Over the CNI period, nearly $3.6 billion in SGR funding is estimated, including $2.2 billion in committed funding from FY19-FY24, $289 million for FY25, and an estimated flat-line average of the program years in the CTP for FY26-FY28 ($367 million per year), consistent with long range revenue forecasts for the region. SGR Needs
81%
Enhancement Needs19%
Vehicles30%
Guideway14%
Systems19%
Faci lities12%
Stations25%
Total 10-Yr Capital Needs$5.7B
1 0 - Y E A R C A P I T A L N E E D S | C Y 2 0 1 9 - 2 0 2 8 3
Figure ES-3. 10-Year Forecasted SGR Needs vs. SGR Funding (YOE, $Millions)
Figure ES-4 summarizes MDOT MTA’s 10-year SGR needs. The largest portion of SGR needs by asset category is driven by vehicles reaching the end of their useful life and planned fleet rehabilitations and overhauls over the 10-year period, resulting in 37 percent or $1.7 billion in identified SGR needs between 2019 and 2028; $1.1 billion of the $1.7 billion in SGR needs has committed funding over the next six years.
Figure ES-4. Summary of 10-Year SGR Needs (YOE, $Millions)
$0
$200
$400
$600
$800
$1,000
$1,200
$1,400
$1,600
$1,800
2019 2020 2021 2022 2023 2024 2025 2026 2027 2028
Vehicles Guideway Systems Facilities Stations
Includes Current Backlog and 2019 SGR Needs
$-
$200
$400
$600
$800
$1,000
$1,200
$1,400
$1,600
$1,800
2019 2020 2021 2022 2023 2024 2025 2026 2027 2028
SGR Needs SGR Funding*
Average $462M/Year Annual SGR Reinvestment Need
1 0 - Y E A R C A P I T A L N E E D S | C Y 2 0 1 9 - 2 0 2 8 4
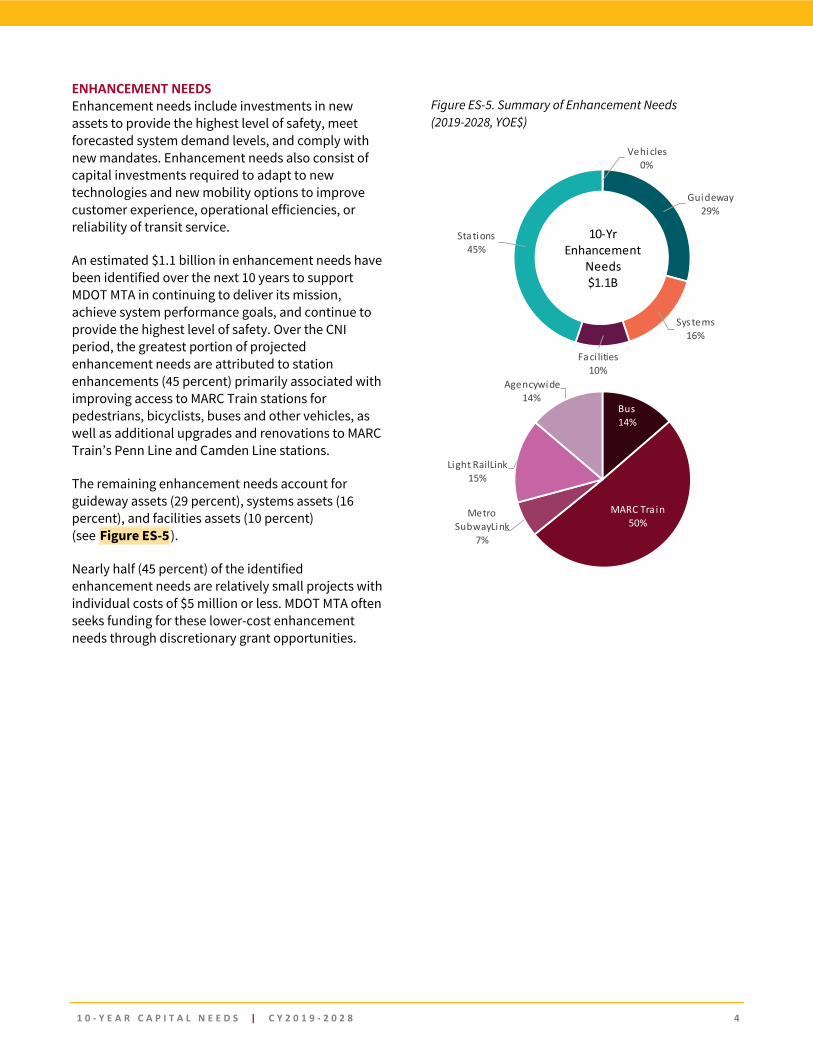
ENHANCEMENT NEEDS Enhancement needs include investments in new assets to provide the highest level of safety, meet forecasted system demand levels, and comply with new mandates. Enhancement needs also consist of capital investments required to adapt to new technologies and new mobility options to improve customer experience, operational efficiencies, or reliability of transit service.
An estimated $1.1 billion in enhancement needs have been identified over the next 10 years to support MDOT MTA in continuing to deliver its mission, achieve system performance goals, and continue to provide the highest level of safety. Over the CNI period, the greatest portion of projected enhancement needs are attributed to station enhancements (45 percent) primarily associated with improving access to MARC Train stations for pedestrians, bicyclists, buses and other vehicles, as well as additional upgrades and renovations to MARC Train’s Penn Line and Camden Line stations.
The remaining enhancement needs account for guideway assets (29 percent), systems assets (16 percent), and facilities assets (10 percent) (see Figure ES-5).
Nearly half (45 percent) of the identified enhancement needs are relatively small projects with individual costs of $5 million or less. MDOT MTA often seeks funding for these lower-cost enhancement needs through discretionary grant opportunities.
Figure ES-5. Summary of Enhancement Needs (2019-2028, YOE$)
Vehicles 0%
Guideway29%
Systems 16%
Faci lities 10%
Stations 45%
10-Yr Enhancement
Needs$1.1B
Bus14%
MARC Tra in50%
Metro SubwayLink
7%
Light RailLink15%
Agencywide14%
1 0 - Y E A R C A P I T A L N E E D S | C Y 2 0 1 9 - 2 0 2 8 5
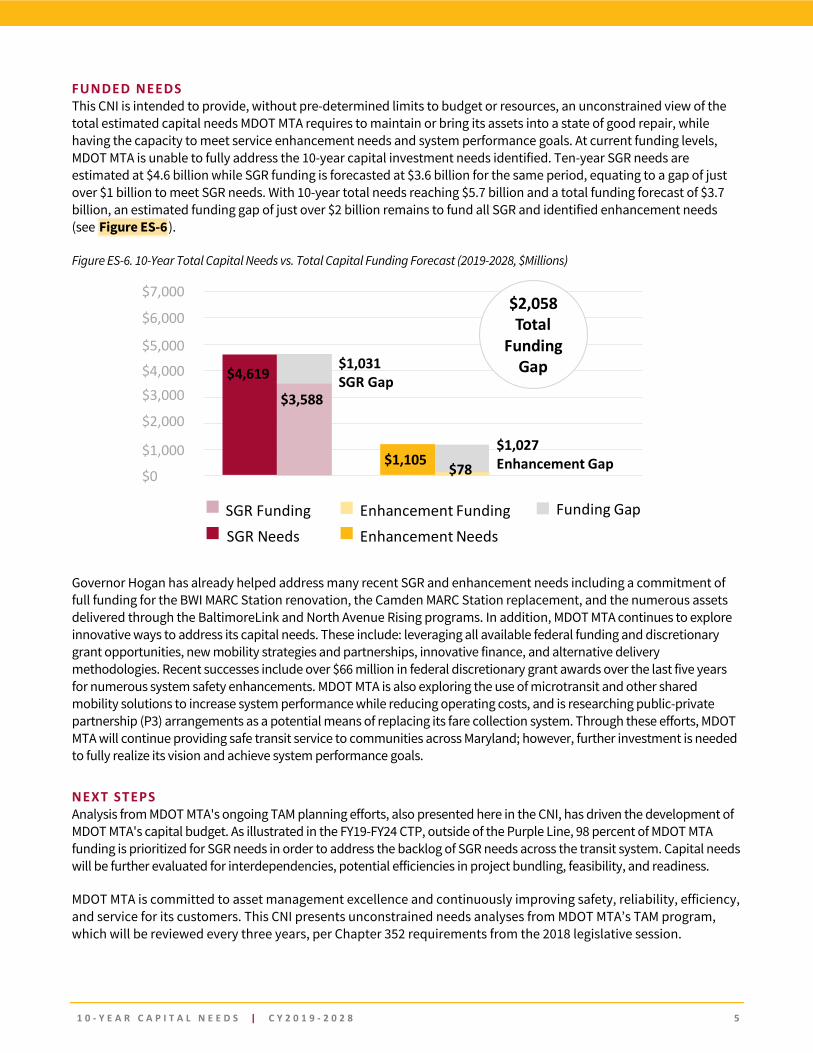
FUNDED NEEDS This CNI is intended to provide, without pre-determined limits to budget or resources, an unconstrained view of the total estimated capital needs MDOT MTA requires to maintain or bring its assets into a state of good repair, while having the capacity to meet service enhancement needs and system performance goals. At current funding levels, MDOT MTA is unable to fully address the 10-year capital investment needs identified. Ten-year SGR needs are estimated at $4.6 billion while SGR funding is forecasted at $3.6 billion for the same period, equating to a gap of just over $1 billion to meet SGR needs. With 10-year total needs reaching $5.7 billion and a total funding forecast of $3.7 billion, an estimated funding gap of just over $2 billion remains to fund all SGR and identified enhancement needs (see Figure ES-6).
Figure ES-6. 10-Year Total Capital Needs vs. Total Capital Funding Forecast (2019-2028, $Millions)
Governor Hogan has already helped address many recent SGR and enhancement needs including a commitment of full funding for the BWI MARC Station renovation, the Camden MARC Station replacement, and the numerous assets delivered through the BaltimoreLink and North Avenue Rising programs. In addition, MDOT MTA continues to explore innovative ways to address its capital needs. These include: leveraging all available federal funding and discretionary grant opportunities, new mobility strategies and partnerships, innovative finance, and alternative delivery methodologies. Recent successes include over $66 million in federal discretionary grant awards over the last five years for numerous system safety enhancements. MDOT MTA is also exploring the use of microtransit and other shared mobility solutions to increase system performance while reducing operating costs, and is researching public-private partnership (P3) arrangements as a potential means of replacing its fare collection system. Through these efforts, MDOT MTA will continue providing safe transit service to communities across Maryland; however, further investment is needed to fully realize its vision and achieve system performance goals.
NEXT STEPS Analysis from MDOT MTA's ongoing TAM planning efforts, also presented here in the CNI, has driven the development of MDOT MTA's capital budget. As illustrated in the FY19-FY24 CTP, outside of the Purple Line, 98 percent of MDOT MTA funding is prioritized for SGR needs in order to address the backlog of SGR needs across the transit system. Capital needs will be further evaluated for interdependencies, potential efficiencies in project bundling, feasibility, and readiness.
MDOT MTA is committed to asset management excellence and continuously improving safety, reliability, efficiency, and service for its customers. This CNI presents unconstrained needs analyses from MDOT MTA’s TAM program, which will be reviewed every three years, per Chapter 352 requirements from the 2018 legislative session.
$6,000
$5,000
$4,000$3,000
$2,000
$1,000
$0
$7,000
$4,619
$1,105
$3,588
SGR FundingSGR Needs
Enhancement FundingEnhancement Needs
Funding Gap
$1,027 Enhancement Gap$78
$1,031 SGR Gap
$2,058Total
Funding Gap
1 0 - Y E A R C A P I T A L N E E D S | C Y 2 0 1 9 - 2 0 2 8 6
1. Background and Purpose MDOT MTA has served as the primary transit provider throughout the State of Maryland since its inception in 1969 as Baltimore Metropolitan Transit Authority. Today, MDOT MTA is the 13th largest multi-modal transit system in the United States. MDOT MTA’s core service area covers 2,560 square miles, serving over 2.2 million people. This CNI identifies and prioritizes the unconstrained capital investments required over the next 10 years for MDOT MTA to maintain its existing transit assets in a state of good repair and continue to meet the current and future needs of its stakeholders.
1.1 Service Overview With an average of nearly 320,000 daily trips system-wide, hundreds of thousands of daily customers rely on MDOT MTA’s operation of Local Buses (CityLink, LocalLink, and Express BusLink), Commuter Buses, Light RailLink, Metro SubwayLink, Maryland Area Regional Commuter (MARC) Train Service, and Paratransit service (MobilityLink).
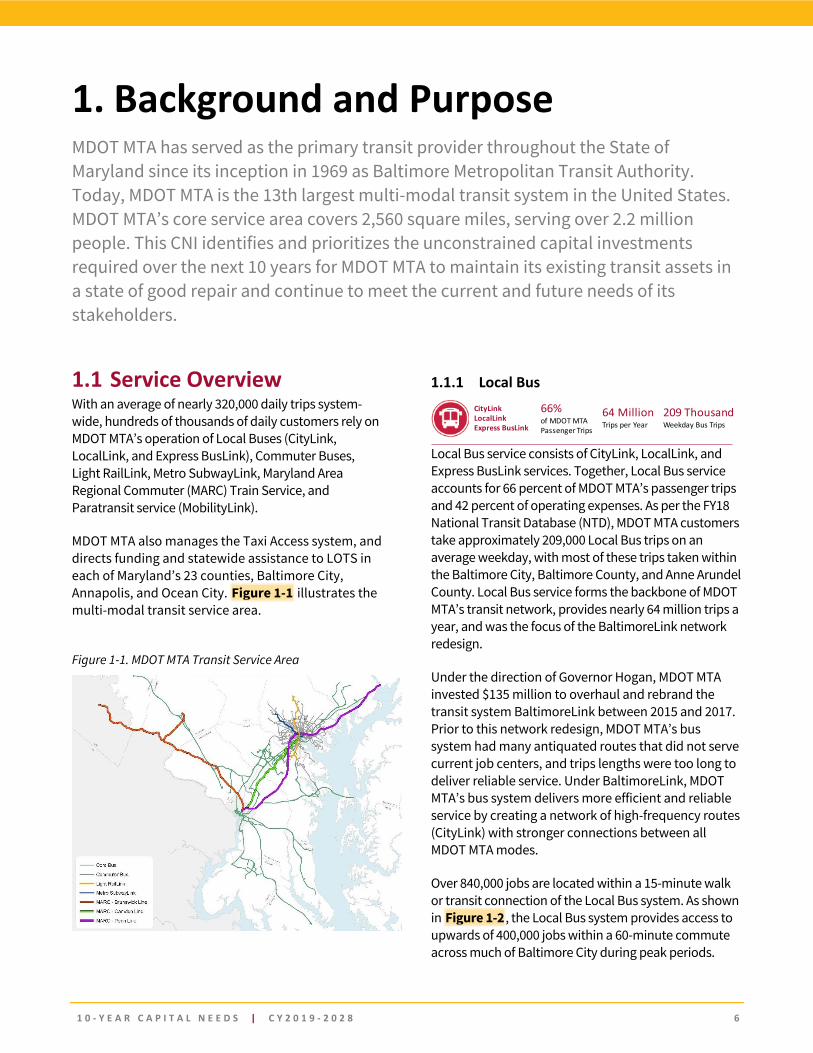
MDOT MTA also manages the Taxi Access system, and directs funding and statewide assistance to LOTS in each of Maryland’s 23 counties, Baltimore City, Annapolis, and Ocean City. Figure 1-1 illustrates the multi-modal transit service area.
1.1.1 Local Bus
Local Bus service consists of CityLink, LocalLink, and Express BusLink services. Together, Local Bus service accounts for 66 percent of MDOT MTA’s passenger trips and 42 percent of operating expenses. As per the FY18 National Transit Database (NTD), MDOT MTA customers take approximately 209,000 Local Bus trips on an average weekday, with most of these trips taken within the Baltimore City, Baltimore County, and Anne Arundel County. Local Bus service forms the backbone of MDOT MTA’s transit network, provides nearly 64 million trips a year, and was the focus of the BaltimoreLink network redesign.
Under the direction of Governor Hogan, MDOT MTA invested $135 million to overhaul and rebrand the transit system BaltimoreLink between 2015 and 2017. Prior to this network redesign, MDOT MTA’s bus system had many antiquated routes that did not serve current job centers, and trips lengths were too long to deliver reliable service. Under BaltimoreLink, MDOT MTA’s bus system delivers more efficient and reliable service by creating a network of high-frequency routes (CityLink) with stronger connections between all MDOT MTA modes.
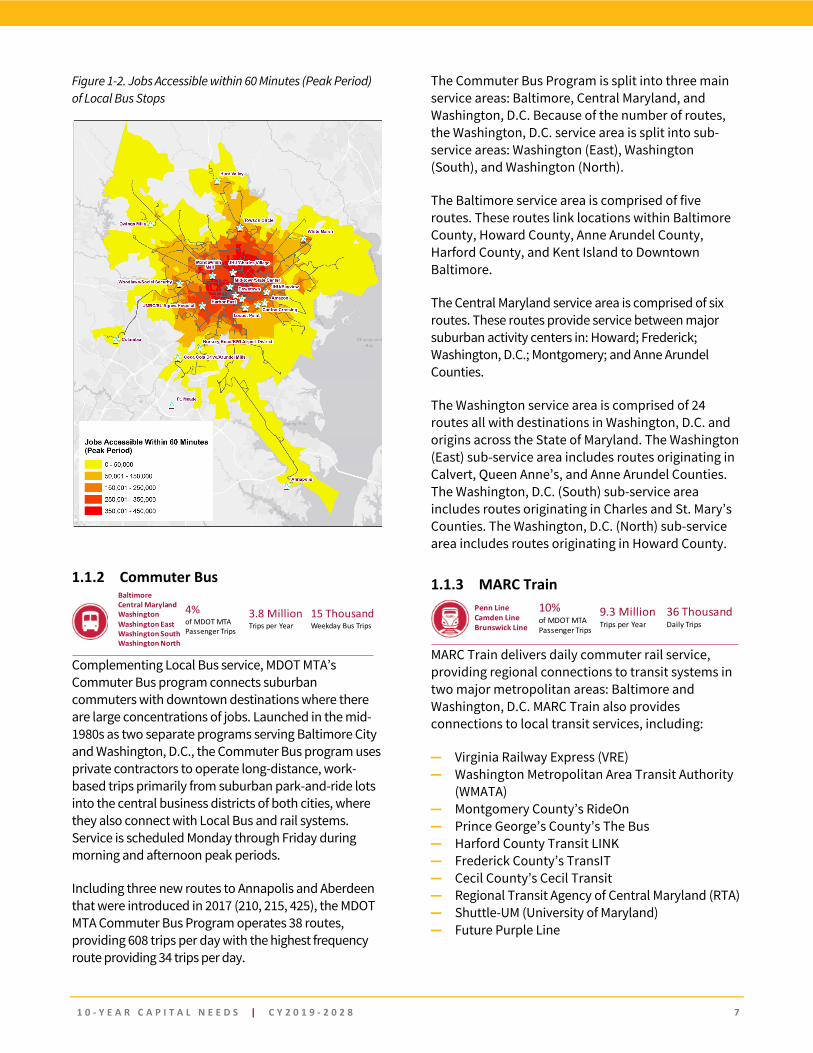
Over 840,000 jobs are located within a 15-minute walk or transit connection of the Local Bus system. As shown in Figure 1-2, the Local Bus system provides access to upwards of 400,000 jobs within a 60-minute commute across much of Baltimore City during peak periods.
Figure 1-1. MDOT MTA Transit Service Area
CityLinkLocalLinkExpress BusLink
64 MillionTrips per Year
209 ThousandWeekday Bus Trips
66% of MDOT MTA Passenger Trips
1 0 - Y E A R C A P I T A L N E E D S | C Y 2 0 1 9 - 2 0 2 8 7
Figure 1-2. Jobs Accessible within 60 Minutes (Peak Period) of Local Bus Stops
1.1.2 Commuter Bus
Complementing Local Bus service, MDOT MTA’s Commuter Bus program connects suburban commuters with downtown destinations where there are large concentrations of jobs. Launched in the mid-1980s as two separate programs serving Baltimore City and Washington, D.C., the Commuter Bus program uses private contractors to operate long-distance, work-based trips primarily from suburban park-and-ride lots into the central business districts of both cities, where they also connect with Local Bus and rail systems. Service is scheduled Monday through Friday during morning and afternoon peak periods.
Including three new routes to Annapolis and Aberdeen that were introduced in 2017 (210, 215, 425), the MDOT MTA Commuter Bus Program operates 38 routes, providing 608 trips per day with the highest frequency route providing 34 trips per day.
The Commuter Bus Program is split into three main service areas: Baltimore, Central Maryland, and Washington, D.C. Because of the number of routes, the Washington, D.C. service area is split into sub-service areas: Washington (East), Washington (South), and Washington (North).
The Baltimore service area is comprised of five routes. These routes link locations within Baltimore County, Howard County, Anne Arundel County, Harford County, and Kent Island to Downtown Baltimore.
The Central Maryland service area is comprised of six routes. These routes provide service between major suburban activity centers in: Howard; Frederick; Washington, D.C.; Montgomery; and Anne Arundel Counties.
The Washington service area is comprised of 24 routes all with destinations in Washington, D.C. and origins across the State of Maryland. The Washington (East) sub-service area includes routes originating in Calvert, Queen Anne’s, and Anne Arundel Counties. The Washington, D.C. (South) sub-service area includes routes originating in Charles and St. Mary’s Counties. The Washington, D.C. (North) sub-service area includes routes originating in Howard County.
1.1.3 MARC Train
MARC Train delivers daily commuter rail service, providing regional connections to transit systems in two major metropolitan areas: Baltimore and Washington, D.C. MARC Train also provides connections to local transit services, including:
― Virginia Railway Express (VRE) ― Washington Metropolitan Area Transit Authority
(WMATA) ― Montgomery County’s RideOn ― Prince George’s County’s The Bus ― Harford County Transit LINK ― Frederick County’s TransIT ― Cecil County’s Cecil Transit ― Regional Transit Agency of Central Maryland (RTA) ― Shuttle-UM (University of Maryland) ― Future Purple Line
BaltimoreCentral Maryland WashingtonWashington EastWashington SouthWashington North
3.8 MillionTrips per Year
15 Thousand Weekday Bus Trips
4% of MDOT MTA Passenger Trips
Penn LineCamden LineBrunswick Line
9.3 MillionTrips per Year
36 Thousand Daily Trips
10% of MDOT MTA Passenger Trips
1 0 - Y E A R C A P I T A L N E E D S | C Y 2 0 1 9 - 2 0 2 8 8
MARC Train provides over nine million annual passenger trips, or about 36,000 daily trips, accounting for 10 percent of MDOT MTA’s total ridership. Ridership has grown since 2002 with an overall average annual growth rate of two percent in weekday boardings systemwide. Of the three routes, the Penn Line has experienced the largest increase in average weekday boardings with an annual growth rate of three percent. The Brunswick Line also has experienced a steady increase of just under one percent in average weekday boardings while the Camden Line has remained relatively steady.
The Penn Line is a segment of the Northeast Corridor (NEC), the busiest passenger railroad corridor in the United States. Stretching from Boston, MA to Washington, D.C., passenger service on the NEC accommodates 710,000 commuters and 40,000 intercity travelers on 2,000 trains each day. The Penn Line carries the largest share of MARC Train passengers throughout the system with 64 percent of the total 21,700 annual passengers in 2017. The Brunswick Line carries 22 percent of all MARC passengers and has the second largest share of average annual passengers throughout the MARC Train system. The Camden Line accounts for 14 percent of all MARC Train passengers.
1.1.4 Metro SubwayLink
MDOT MTA operates one Metro SubwayLink line, which runs from Owings Mills to Johns Hopkins Hospital, passing through the core of downtown Baltimore.
Metro SubwayLink service runs from 5 AM to midnight every weekday and from 6 AM to midnight on weekends and holidays.
Headways (length of time between train arrivals) range from 8 minutes during weekday AM and PM peak periods to 15 minutes on weekends and holidays. The total scheduled travel time from end to end is approximately 30 minutes. Metro SubwayLink carries nearly nine million passenger trips per year, accounting for approximately nine percent of MDOT MTA’s total ridership.
Over 400,000 jobs are accessible within a 30-minute walk or transit ride of Metro SubwayLink stations, with over 240,000 of those within 15 minutes.
1.1.5 Light RailLink Light RailLink runs between Hunt Valley to the north, through downtown Baltimore, and terminates at Baltimore/ Washington International Thurgood Marshall Airport (BWI) or Glen Burnie (Cromwell Station). Light RailLink connects to both Penn Station and Camden Station.
The system includes four overlapping patterns, or variations, of train origin and destination along a common line:
― Hunt Valley to BWI – Operates with 20-minute headways
― Timonium to Cromwell – Operates during AM and PM peak periods to accommodate high-ridership
― Hunt Valley to Cromwell – Operates during middays and evenings
― Penn Station to Camden Station (Penn-Camden Shuttle) – Typically only uses single vehicle trains
On average, approximately 23,000 customers ride Light RailLink per day. During special events (e.g., Orioles games, Ravens games, etc.) peak level service is provided with additional train cars to efficiently manage the higher ridership volumes.
Over 550,000 jobs are accessible within a 30-minute walk or transit ride of Light RailLink stations, with over 290,000 of those within 15 minutes.
1.1.6 MobilityLink
MDOT MTA’s MobilityLink paratransit service operates in Baltimore City and Baltimore County, with limited service to parts of Anne Arundel and Howard Counties. MobilityLink offers persons with disabilities shared ride access anywhere within ¾ of a mile of MDOT MTA’s Local Bus (CityLink, LocalLink), Light RailLink, and Metro SubwayLink stops and stations.
Owings MillsthroughDowntown Baltimore toJohns Hopkins Hospital
9 MillionTrips per Year
9% of MDOT MTA Passenger Trips
28 Thousand Daily Trips
Hunt Valley throughDowntown Baltimore to BWI / Glen Burnie
7.4 MillionTrips per Year
8% of MDOT MTA Passenger Trips
23 Thousand Daily Trips
Shared ride access within ¾ mile of Local Bus stops and stations
2 MillionTrips per Year
2% of MDOT MTA Passenger Trips
7 Thousand Daily Trips
1 0 - Y E A R C A P I T A L N E E D S | C Y 2 0 1 9 - 2 0 2 8 9
Due to the BaltimoreLink network redesign and the resulting expansion of the Local Bus service area, MobilityLink’s service area was expanded in June 2017, now covering over 1,800 square miles. MobilityLink also provides connections with other systems, including Baltimore County CountyRide, the RTA, and Annapolis Transit. In 2017, MobilityLink service provided over two million rides, with ridership continuing to grow.
MDOT MTA manages MobilityLink as a contracted service. MDOT MTA owns the MobilityLink vehicles and staffs the call center for booking trips. The daily scheduling and operations, as well as vehicle maintenance however, are performed by several service providers under contract with MDOT MTA.
Technology plays a critical role in managing MobilityLink service. All MobilityLink trips are dispatched through a centralized control center. All MDOT MTA vehicles are equipped with Global Positioning System (GPS), Automated Vehicle Locator (AVL), and mobile data terminal (MDT) hardware.
1.1.7 Purple Line
In the future, MDOT MTA will offer 16.4 miles of new light rail transit service connecting Bethesda, Silver Spring, Takoma/Langley Park, the University of Maryland at College Park, and New Carrollton linking to WMATA, The Bus, RideOn, and Shuttle-UM. The Purple Line will offer service options parallel to the Capital Beltway.
1.2 Purpose of the CNI The purpose of this CNI is to assess MDOT MTA’s ongoing unconstrained capital needs over a 10-year period. It presents information from MDOT MTA’s ongoing TAM analyses, needs inventory, and is intended to support improved decision making regarding the maintenance and enhancement needs of MDOT MTA’s transit assets over the long-term. Capital needs may include but are not limited to the costs to: maintain assets in a state of good repair; meet existing or new regulatory requirements; invest in transit infrastructure, assets, or service enhancements; and modernize or adapt to new technologies or new mobility options. The CNI is updated at least once every three years by law.
1.3 CNI Requirements Table 1-2 outlines the requirements for preparing the Capital Needs Inventory as defined in Maryland State Law, Chapter 352, and the strategy for how compliance is achieved in this document. These requirements were met by drawing upon MDOT MTA’s ongoing SGR analyses as part of its annual TAM planning process in addition to its annual Call for Projects (CFP) process.
ConnectingBethesda, Silver Spring, Takoma/Langley Park, University of Maryland at College Park, New Carrollton
21Stations
1 0 - Y E A R C A P I T A L N E E D S | C Y 2 0 1 9 - 2 0 2 8 1 0
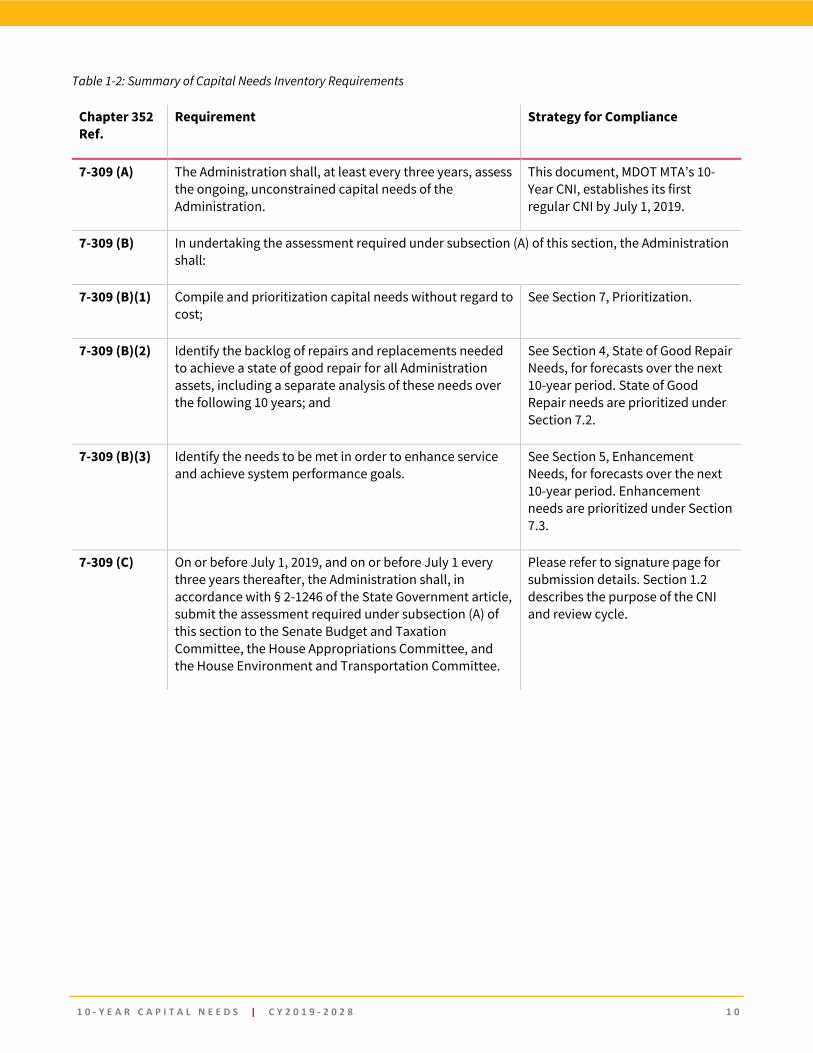
Table 1-2: Summary of Capital Needs Inventory Requirements
Chapter 352 Ref.
Requirement Strategy for Compliance
7-309 (A) The Administration shall, at least every three years, assess the ongoing, unconstrained capital needs of the Administration.
This document, MDOT MTA’s 10-Year CNI, establishes its first regular CNI by July 1, 2019.
7-309 (B) In undertaking the assessment required under subsection (A) of this section, the Administration shall:
7-309 (B)(1) Compile and prioritization capital needs without regard to cost;
See Section 7, Prioritization.
7-309 (B)(2) Identify the backlog of repairs and replacements needed to achieve a state of good repair for all Administration assets, including a separate analysis of these needs over the following 10 years; and
See Section 4, State of Good Repair Needs, for forecasts over the next 10-year period. State of Good Repair needs are prioritized under Section 7.2.
7-309 (B)(3) Identify the needs to be met in order to enhance service and achieve system performance goals.
See Section 5, Enhancement Needs, for forecasts over the next 10-year period. Enhancement needs are prioritized under Section 7.3.
7-309 (C) On or before July 1, 2019, and on or before July 1 every three years thereafter, the Administration shall, in accordance with § 2-1246 of the State Government article, submit the assessment required under subsection (A) of this section to the Senate Budget and Taxation Committee, the House Appropriations Committee, and the House Environment and Transportation Committee.
Please refer to signature page for submission details. Section 1.2 describes the purpose of the CNI and review cycle.
1 0 - Y E A R C A P I T A L N E E D S | C Y 2 0 1 9 - 2 0 2 8 1 1
2. Current Capital Asset Inventory With $9.5 billion in facilities, guideway, stations, systems, and vehicle assets, MDOT MTA provides over 100 million annual trips across the State of Maryland. Capital asset information (e.g., condition, remaining useful life, replacement cost, etc.) is currently maintained in MDOT MTA’s capital asset inventory and forms the basis for understanding the required capital needs to maintain its assets in a state of good repair.
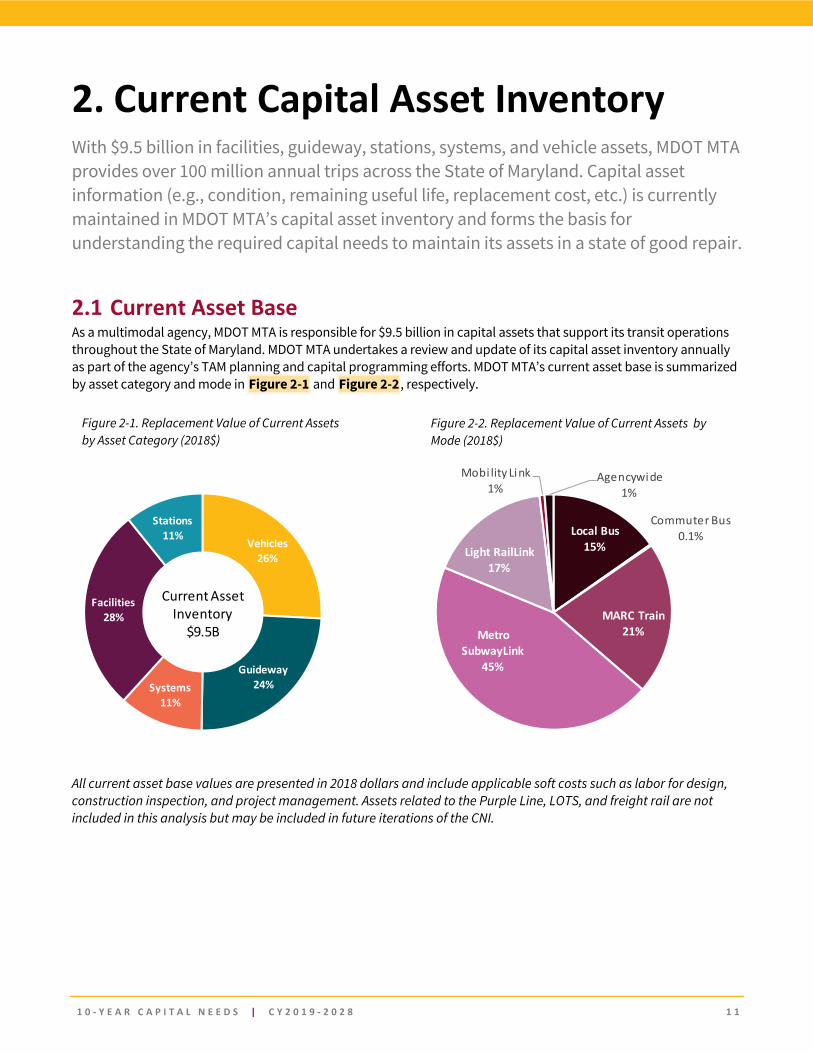
2.1 Current Asset Base As a multimodal agency, MDOT MTA is responsible for $9.5 billion in capital assets that support its transit operations throughout the State of Maryland. MDOT MTA undertakes a review and update of its capital asset inventory annually as part of the agency’s TAM planning and capital programming efforts. MDOT MTA’s current asset base is summarized by asset category and mode in Figure 2-1 and Figure 2-2 , respectively.
All current asset base values are presented in 2018 dollars and include applicable soft costs such as labor for design, construction inspection, and project management. Assets related to the Purple Line, LOTS, and freight rail are not included in this analysis but may be included in future iterations of the CNI.
Figure 2-1. Replacement Value of Current Assets by Asset Category (2018$)
Figure 2-2. Replacement Value of Current Assets by Mode (2018$)
Vehicles26%
Guideway24%Systems
11%
Facilities28%
Stations11%
Current Asset Inventory
$9.5B
Local Bus15%
Commuter Bus0.1%
MARC Train21%Metro
SubwayLink45%
Light RailLink17%
Mobi lity Link1%
Agencywide1%
1 0 - Y E A R C A P I T A L N E E D S | C Y 2 0 1 9 - 2 0 2 8 1 2
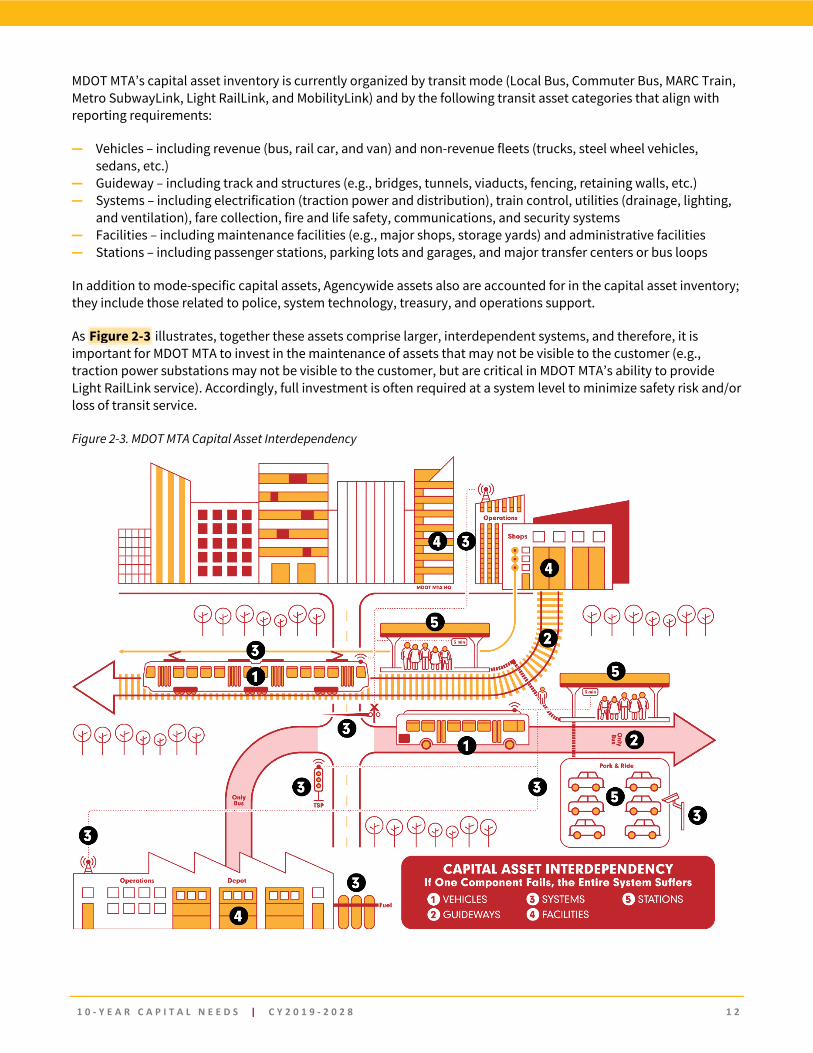
MDOT MTA’s capital asset inventory is currently organized by transit mode (Local Bus, Commuter Bus, MARC Train, Metro SubwayLink, Light RailLink, and MobilityLink) and by the following transit asset categories that align with reporting requirements:
― Vehicles – including revenue (bus, rail car, and van) and non-revenue fleets (trucks, steel wheel vehicles, sedans, etc.)
― Guideway – including track and structures (e.g., bridges, tunnels, viaducts, fencing, retaining walls, etc.) ― Systems – including electrification (traction power and distribution), train control, utilities (drainage, lighting,
and ventilation), fare collection, fire and life safety, communications, and security systems ― Facilities – including maintenance facilities (e.g., major shops, storage yards) and administrative facilities ― Stations – including passenger stations, parking lots and garages, and major transfer centers or bus loops
In addition to mode-specific capital assets, Agencywide assets also are accounted for in the capital asset inventory; they include those related to police, system technology, treasury, and operations support.
As Figure 2-3 illustrates, together these assets comprise larger, interdependent systems, and therefore, it is important for MDOT MTA to invest in the maintenance of assets that may not be visible to the customer (e.g., traction power substations may not be visible to the customer, but are critical in MDOT MTA’s ability to provide Light RailLink service). Accordingly, full investment is often required at a system level to minimize safety risk and/or loss of transit service.
Figure 2-3. MDOT MTA Capital Asset Interdependency

1 0 - Y E A R C A P I T A L N E E D S | C Y 2 0 1 9 - 2 0 2 8 1 3
Table 2-1 provides a high-level summary of MDOT MTA’s current capital asset inventory and estimated replacement values, organized by transit mode. This CNI includes assets for which MDOT MTA has direct capital responsibility. Therefore, transit modes with a significant number of third-party assets may reflect low replacement values relative to network size (e.g., MARC Train utilizes many third-party assets including track, systems, facilities, and stations).
Table 2-1. Summary of MDOT MTA’s Current Capital Asset Inventory (2018$)
Mode Name
Asset Category
Est. 2018 Replacement
Value ($000s)**
% of Asset Base
Vehicles $626,780 6.6%
Guideway
Systems $35,296 0.4%
Facilities $764,841 8.1%
Stations $19,599 0.2%
Vehicles $11,134 0.1%
Guideway
Systems
Facilities
Stations
Vehicles $1,114,314 11.8%
Guideway $271,485 2.9%
Systems $64,322 0.7%
Facilities $201,744 2.1%
Stations $336,519 3.6%
Vehicles $333,269 3.5%
Guideway $1,360,354 14.4%
Systems $461,897 4.9%
Facilities $1,487,638 15.7%
Stations $597,530 6.3%
Mode Name
Asset Category
Est. 2018 Replacement
Value ($000s)**
% of Asset Base
Vehicles $309,708 3.3%
Guideway $662,981 7.0%
Systems $425,321 4.5%
Facilities $124,358 1.3%
Stations $73,817 0.8%
Vehicles $45,565 0.5%
Guideway
Systems $9,764 0.1%
Facilities $4,984 0.1%
Stations
Vehicles $9,863 0.1%
Guideway
Systems $90,013 1.0%
Facilities $18,850 0.2%
Stations
**Total $9,461,945 100%
*“Agencywide” category includes: Police, Operations Support, Systemwide, System Technology, and Treasury assets. **Totals may not add due to rounding. *** Blank cells indicate information is not applicable.
MobilityLink
$60MReplacementValue
MARC Train
$2BReplacementValue
Metro SubwayLink
$4.2BReplacement Value
Local Bus
$1.4BReplacement Value
Light RailLink
$1.6BReplacement Value
Agencywide*
$119MReplacement Value
Commuter Bus
$11MReplacement Value
1 0 - Y E A R C A P I T A L N E E D S | C Y 2 0 1 9 - 2 0 2 8 1 4
3. Methodology This CNI is designed to present an unconstrained set of prioritized investment needs over the next 10 years, aligned to MDOT MTA’s vision, strategic priorities, and consistent with ongoing TAM analyses. MDOT MTA’s CNI methodology is based on data in its existing capital asset inventory, drawing from a combination of sources describing the asset attributes such as age, condition, and lifecycle management strategies to help determine timescales and associated costs for replacement or rehabilitation of assets. In addition, the CNI draws upon MDOT MTA’s CFP process and Cornerstone Plans to identify additional capital enhancement needs to meet the current and future demands of the system and its customers.
3.1 Methodology Overview MDOT MTA’s investment needs are organized into two major categories:
― SGR needs are capital investment needs associated with existing assets and ongoing or periodic investment required to maintain or achieve a state of good repair. The FTA defines state of good repair as “the condition in which a capital asset is able to operate at a full level of performance.” A capital asset is in a state of good repair when that asset:
1. Is able to safely perform its designed function; 2. Does not pose a known unacceptable safety risk; and/or 3. Its lifecycle investments have been met or recovered.
― Enhancement needs are new capital investments in transit infrastructure, assets, or service enhancements that support achievement of the agency’s strategic priorities as well as current or future service demand. Enhancement needs may also include investments to upgrade, modernize, or adapt the system to new requirements, technologies, or new mobility options. While enhancement investments are often perceived as new assets, they may also include safety and environmental improvements or actions to protect existing assets. For example, new capital investments were needed to implement positive train control systems and meet the Positive Train Control Enforcement and Implementation Act requirements by December 31, 2018. Similarly, to meet the new Total Maximum Daily Load (TMDL) requirements from the Environmental Protection Agency (EPA), new assets will also be needed to comply and realize environmental benefits.
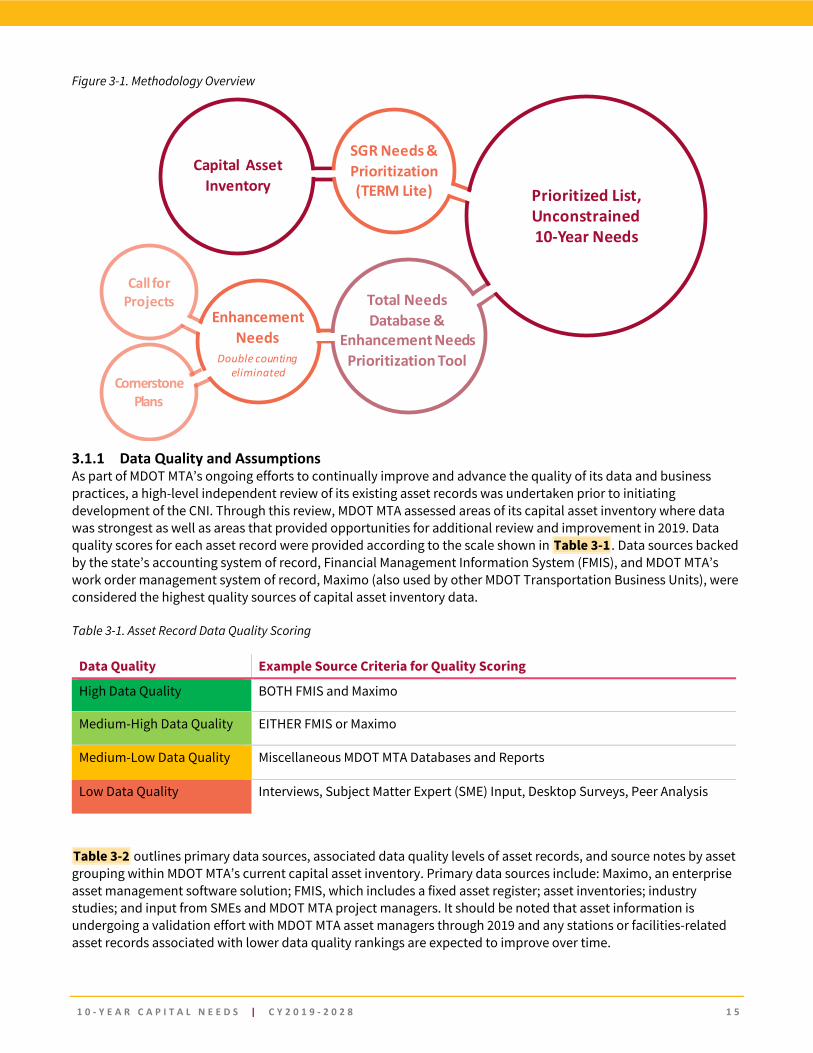
Figure 3-1 depicts how existing TAM and CFP processes have been leveraged to support this CNI. The basis of MDOT MTA’s investment needs is informed by a comprehensive inventory of existing capital assets. The inventory includes information such as asset type, location(s), lifecycle management strategy (e.g., planning through disposal or renewal of assets, activities, and frequencies), replacement cost(s), and age and/or condition, which help predict or determine the timing and anticipated capital costs of future repairs or replacements. Capital maintenance needs for existing assets are primarily identified and derived through MDOT MTA’s inventory process. New capital projects or enhancement needs, on the other hand, are identified through MDOT MTA’s CFP process and Cornerstone Plans which outline new capital projects. Cornerstone Plans serve as modal long-range plans to meet the four cornerstones of MDOT MTA’s vision (safety, efficiency, reliability, and world-class customer service). Since CFP proposal submissions can cover SGR or enhancement needs, SGR-related CFP project proposals are not included in the current CNI analysis to avoid any double-counting from those SGR needs identified from TERM Lite.
1 0 - Y E A R C A P I T A L N E E D S | C Y 2 0 1 9 - 2 0 2 8 1 5
Figure 3-1. Methodology Overview
3.1.1 Data Quality and Assumptions As part of MDOT MTA’s ongoing efforts to continually improve and advance the quality of its data and business practices, a high-level independent review of its existing asset records was undertaken prior to initiating development of the CNI. Through this review, MDOT MTA assessed areas of its capital asset inventory where data was strongest as well as areas that provided opportunities for additional review and improvement in 2019. Data quality scores for each asset record were provided according to the scale shown in Table 3-1 . Data sources backed by the state’s accounting system of record, Financial Management Information System (FMIS), and MDOT MTA’s work order management system of record, Maximo (also used by other MDOT Transportation Business Units), were considered the highest quality sources of capital asset inventory data.
Table 3-1. Asset Record Data Quality Scoring
Data Quality Example Source Criteria for Quality Scoring
High Data Quality BOTH FMIS and Maximo
Medium-High Data Quality EITHER FMIS or Maximo
Medium-Low Data Quality Miscellaneous MDOT MTA Databases and Reports
Low Data Quality Interviews, Subject Matter Expert (SME) Input, Desktop Surveys, Peer Analysis
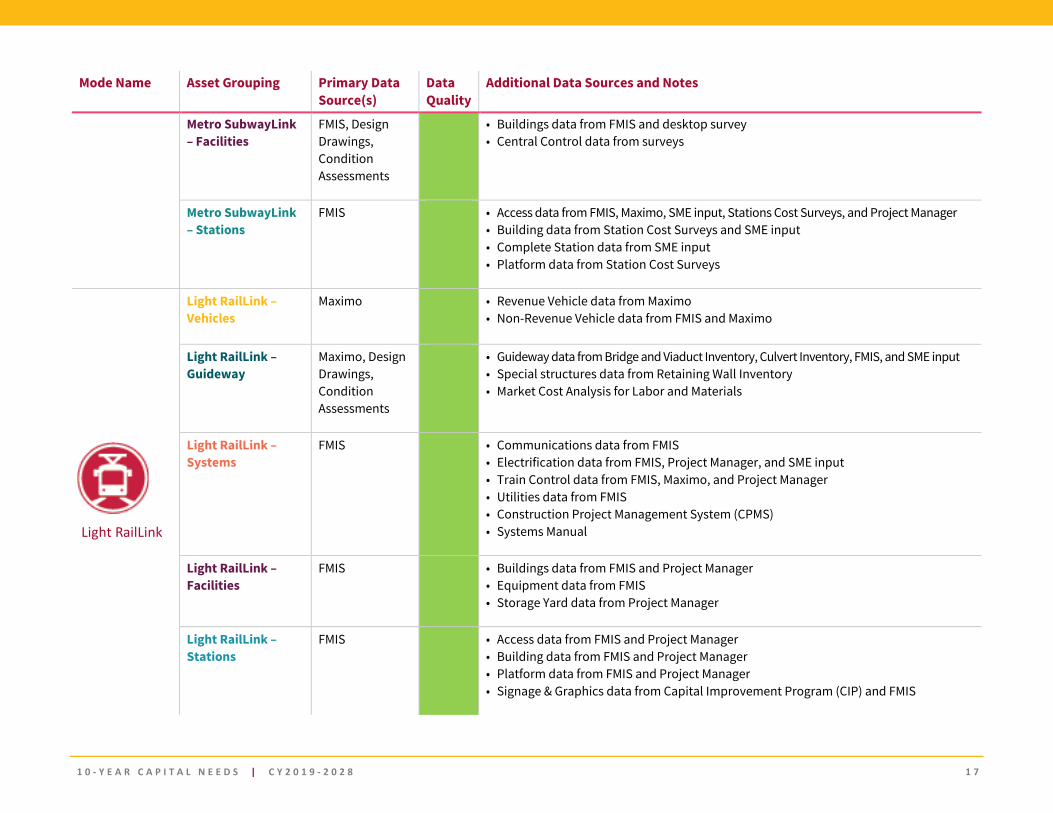
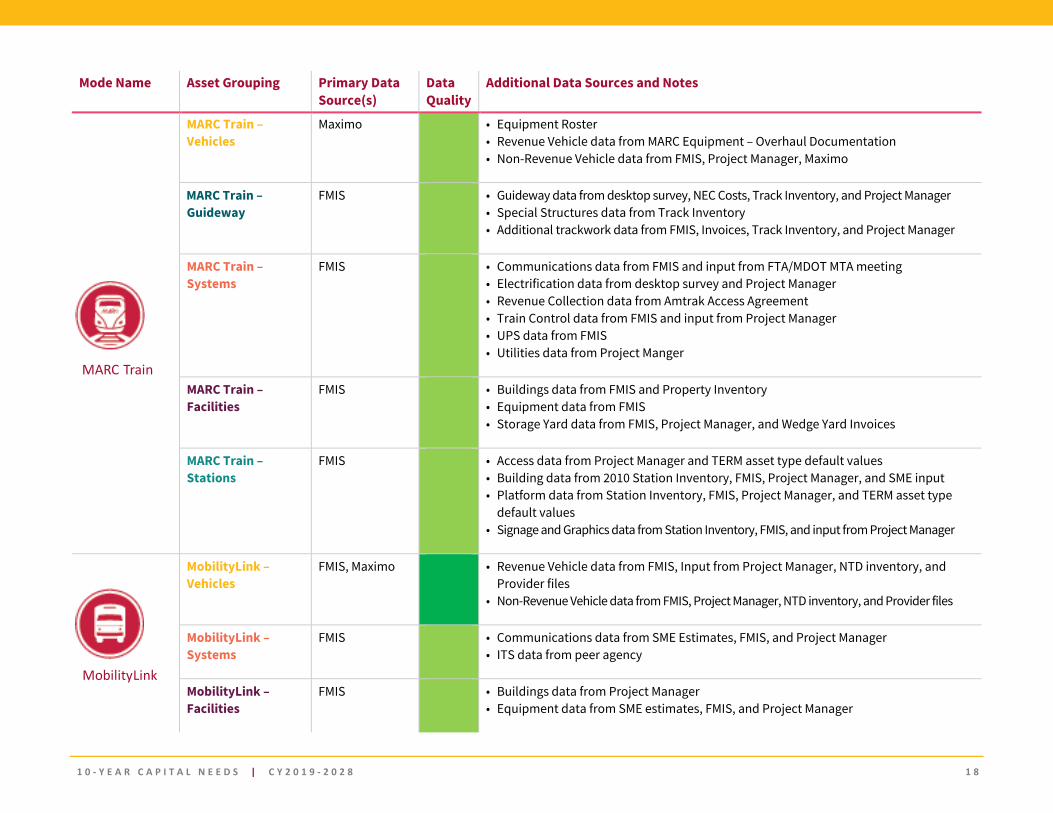
Table 3-2 outlines primary data sources, associated data quality levels of asset records, and source notes by asset grouping within MDOT MTA’s current capital asset inventory. Primary data sources include: Maximo, an enterprise asset management software solution; FMIS, which includes a fixed asset register; asset inventories; industry studies; and input from SMEs and MDOT MTA project managers. It should be noted that asset information is undergoing a validation effort with MDOT MTA asset managers through 2019 and any stations or facilities-related asset records associated with lower data quality rankings are expected to improve over time.
Cornerstone Plans
Total Needs Database &
Enhancement Needs Prioritization Tool
SGR Needs & Prioritization (TERM Lite)
Enhancement Needs
Double counting eliminated
Capital Asset Inventory
Call for Projects
Prioritized List, Unconstrained 10-Year Needs

1 0 - Y E A R C A P I T A L N E E D S | C Y 2 0 1 9 - 2 0 2 8 1 6
Table 3-2. Existing Capital Asset Inventory – Summary of Data Sources and Assumptions
Mode Name Asset Grouping Primary Data Source(s)
Data Quality
Additional Data Sources and Notes
Local Bus – Vehicles FMIS, Maximo • Vehicle Equipment / Parts from FMIS • Non-Revenue Vehicles from Maximo and Vehicle Tracking Report • Revenue Vehicle Data from Maximo and SME
Local Bus – Systems FMIS • Communications, Intelligent Transportation System (ITS), UPS, Revenue Collection Data from FMIS
• Utilities and other Systems from SMEs
Local Bus – Facilities
FMIS, Maximo • Facility Conditions Update in Progress per new MDOT MTA Facility Condition Assessment Program
• Surveys and interviews
Local Bus – Stations SME • Project Managers, Operations Group Support
Commuter Bus – Vehicles
Maximo • Project Managers • Motor Coach Industries (MCI) Motorcoach Assignments
Metro SubwayLink – Vehicles
FMIS, Maximo • Revenue Vehicle data from Maximo, contracts • Non-Revenue Vehicle data from FMIS
Metro SubwayLink ‒ Guideway
Maximo, Design Drawings, Condition Assessments
• Industry Study • Capital Assets and Mainline 1 & 2 Curves Report • Market Cost Analysis for Labor and Materials
Metro SubwayLink – Systems (Train Control)
FMIS • Train control data from SME, Project Manager, and FMIS
Local Bus
Commuter Bus
Metro SubwayLink
1 0 - Y E A R C A P I T A L N E E D S | C Y 2 0 1 9 - 2 0 2 8 1 7
Mode Name Asset Grouping Primary Data Source(s)
Data Quality
Additional Data Sources and Notes
Metro SubwayLink – Facilities
FMIS, Design Drawings, Condition Assessments
• Buildings data from FMIS and desktop survey • Central Control data from surveys
Metro SubwayLink – Stations
FMIS • Access data from FMIS, Maximo, SME input, Stations Cost Surveys, and Project Manager • Building data from Station Cost Surveys and SME input • Complete Station data from SME input • Platform data from Station Cost Surveys
Light RailLink – Vehicles
Maximo • Revenue Vehicle data from Maximo • Non-Revenue Vehicle data from FMIS and Maximo
Light RailLink – Guideway
Maximo, Design Drawings, Condition Assessments
• Guideway data from Bridge and Viaduct Inventory, Culvert Inventory, FMIS, and SME input • Special structures data from Retaining Wall Inventory • Market Cost Analysis for Labor and Materials
Light RailLink – Systems
FMIS • Communications data from FMIS • Electrification data from FMIS, Project Manager, and SME input • Train Control data from FMIS, Maximo, and Project Manager • Utilities data from FMIS • Construction Project Management System (CPMS) • Systems Manual
Light RailLink – Facilities
FMIS • Buildings data from FMIS and Project Manager • Equipment data from FMIS • Storage Yard data from Project Manager
Light RailLink – Stations
FMIS • Access data from FMIS and Project Manager • Building data from FMIS and Project Manager • Platform data from FMIS and Project Manager • Signage & Graphics data from Capital Improvement Program (CIP) and FMIS
Light RailLink
1 0 - Y E A R C A P I T A L N E E D S | C Y 2 0 1 9 - 2 0 2 8 1 8
Mode Name Asset Grouping Primary Data Source(s)
Data Quality
Additional Data Sources and Notes
MARC Train – Vehicles
Maximo • Equipment Roster • Revenue Vehicle data from MARC Equipment – Overhaul Documentation • Non-Revenue Vehicle data from FMIS, Project Manager, Maximo
MARC Train –Guideway
FMIS • Guideway data from desktop survey, NEC Costs, Track Inventory, and Project Manager • Special Structures data from Track Inventory • Additional trackwork data from FMIS, Invoices, Track Inventory, and Project Manager
MARC Train – Systems
FMIS • Communications data from FMIS and input from FTA/MDOT MTA meeting • Electrification data from desktop survey and Project Manager • Revenue Collection data from Amtrak Access Agreement • Train Control data from FMIS and input from Project Manager • UPS data from FMIS • Utilities data from Project Manger
MARC Train – Facilities
FMIS • Buildings data from FMIS and Property Inventory • Equipment data from FMIS • Storage Yard data from FMIS, Project Manager, and Wedge Yard Invoices
MARC Train – Stations
FMIS • Access data from Project Manager and TERM asset type default values • Building data from 2010 Station Inventory, FMIS, Project Manager, and SME input • Platform data from Station Inventory, FMIS, Project Manager, and TERM asset type
default values • Signage and Graphics data from Station Inventory, FMIS, and input from Project Manager
MobilityLink – Vehicles
FMIS, Maximo • Revenue Vehicle data from FMIS, Input from Project Manager, NTD inventory, and Provider files
• Non-Revenue Vehicle data from FMIS, Project Manager, NTD inventory, and Provider files
MobilityLink – Systems
FMIS • Communications data from SME Estimates, FMIS, and Project Manager • ITS data from peer agency
MobilityLink – Facilities
FMIS • Buildings data from Project Manager • Equipment data from SME estimates, FMIS, and Project Manager
MARC Train
MobilityLink
1 0 - Y E A R C A P I T A L N E E D S | C Y 2 0 1 9 - 2 0 2 8 1 9
3.2 Alignment to MDOT MTA Strategic Priorities, Transit Asset Management Requirements
3.2.1 Prioritization Criteria Aligned to Strategic Direction MDOT MTA’s vision is “to provide safe, efficient, and reliable transit across Maryland with world-class customer service.” To realize this vision, MDOT MTA uses four cornerstones to guide the strategic direction of the agency:
― Safety ― Efficiency ― Reliability ― Customer Service
MDOT MTA’s current approach to prioritizing its capital investments for the CNI is two-pronged. It focuses on: 1) fulfilling SGR needs of existing assets; and 2) enhancement needs to enable MDOT MTA to meet the current and future demands of the transportation system and its customers. Evaluation and prioritization of needs against the four cornerstones take place to ensure strategic alignment with MDOT MTA’s vision and system performance goals.
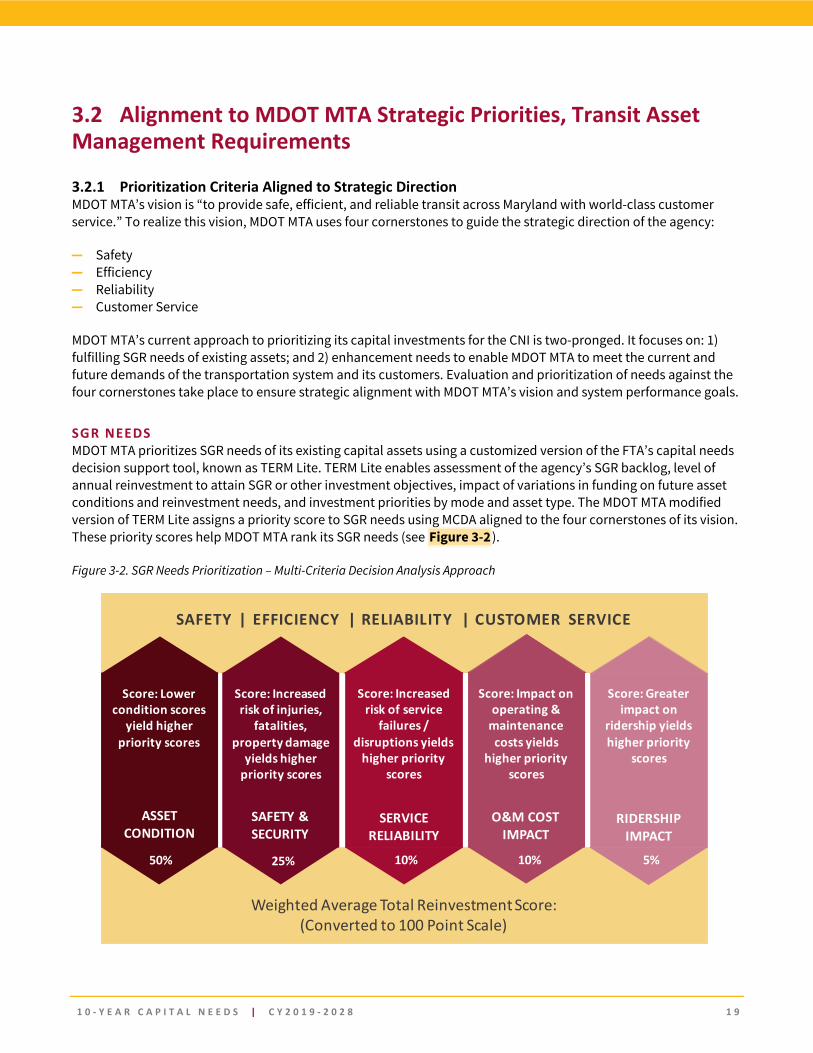
SGR NEEDS MDOT MTA prioritizes SGR needs of its existing capital assets using a customized version of the FTA’s capital needs decision support tool, known as TERM Lite. TERM Lite enables assessment of the agency’s SGR backlog, level of annual reinvestment to attain SGR or other investment objectives, impact of variations in funding on future asset conditions and reinvestment needs, and investment priorities by mode and asset type. The MDOT MTA modified version of TERM Lite assigns a priority score to SGR needs using MCDA aligned to the four cornerstones of its vision. These priority scores help MDOT MTA rank its SGR needs (see Figure 3-2).
Figure 3-2. SGR Needs Prioritization – Multi-Criteria Decision Analysis Approach
SAFETY | EFFICIENCY | RELIABILITY | CUSTOMER SERVICE
Weighted Average Total Reinvestment Score:(Converted to 100 Point Scale)
Score: Lower condition scores
yield higher priority scores
ASSET CONDITION
50%
Score: Increased risk of injuries,
fatalities, property damage
yields higher priority scores
SAFETY & SECURITY
25%
Score: Increased risk of service
failures / disruptions yields
higher priority scores
SERVICE RELIABILITY
10%
Score: Impact on operating &
maintenance costs yields
higher priority scores
O&M COST IMPACT
10%
Score: Greater impact on
ridership yields higher priority
scores
RIDERSHIP IMPACT
5%
1 0 - Y E A R C A P I T A L N E E D S | C Y 2 0 1 9 - 2 0 2 8 2 0
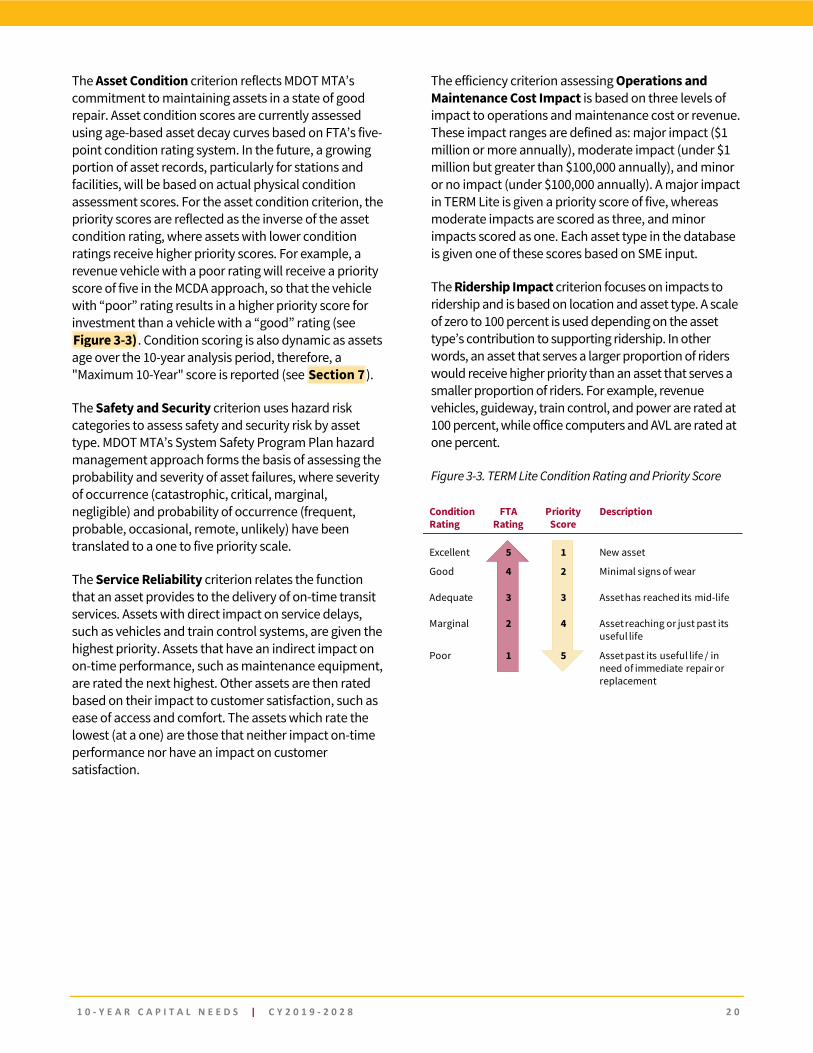
The Asset Condition criterion reflects MDOT MTA’s commitment to maintaining assets in a state of good repair. Asset condition scores are currently assessed using age-based asset decay curves based on FTA’s five-point condition rating system. In the future, a growing portion of asset records, particularly for stations and facilities, will be based on actual physical condition assessment scores. For the asset condition criterion, the priority scores are reflected as the inverse of the asset condition rating, where assets with lower condition ratings receive higher priority scores. For example, a revenue vehicle with a poor rating will receive a priority score of five in the MCDA approach, so that the vehicle with “poor” rating results in a higher priority score for investment than a vehicle with a “good” rating (see Figure 3-3). Condition scoring is also dynamic as assets age over the 10-year analysis period, therefore, a "Maximum 10-Year" score is reported (see Section 7).
The Safety and Security criterion uses hazard risk categories to assess safety and security risk by asset type. MDOT MTA’s System Safety Program Plan hazard management approach forms the basis of assessing the probability and severity of asset failures, where severity of occurrence (catastrophic, critical, marginal, negligible) and probability of occurrence (frequent, probable, occasional, remote, unlikely) have been translated to a one to five priority scale.
The Service Reliability criterion relates the function that an asset provides to the delivery of on-time transit services. Assets with direct impact on service delays, such as vehicles and train control systems, are given the highest priority. Assets that have an indirect impact on on-time performance, such as maintenance equipment, are rated the next highest. Other assets are then rated based on their impact to customer satisfaction, such as ease of access and comfort. The assets which rate the lowest (at a one) are those that neither impact on-time performance nor have an impact on customer satisfaction.
The efficiency criterion assessing Operations and Maintenance Cost Impact is based on three levels of impact to operations and maintenance cost or revenue. These impact ranges are defined as: major impact ($1 million or more annually), moderate impact (under $1 million but greater than $100,000 annually), and minor or no impact (under $100,000 annually). A major impact in TERM Lite is given a priority score of five, whereas moderate impacts are scored as three, and minor impacts scored as one. Each asset type in the database is given one of these scores based on SME input.
The Ridership Impact criterion focuses on impacts to ridership and is based on location and asset type. A scale of zero to 100 percent is used depending on the asset type’s contribution to supporting ridership. In other words, an asset that serves a larger proportion of riders would receive higher priority than an asset that serves a smaller proportion of riders. For example, revenue vehicles, guideway, train control, and power are rated at 100 percent, while office computers and AVL are rated at one percent.
Figure 3-3. TERM Lite Condition Rating and Priority Score
Condition Rating
FTA Rating
Priority Score
Description
Excellent 5 1 New asset
Good 4 2 Minimal signs of wear
Adequate 3 3 Asset has reached its mid-life
Marginal 2 4 Asset reaching or just past its useful life
Poor 1 5 Asset past its useful life / in need of immediate repair or replacement
1 0 - Y E A R C A P I T A L N E E D S | C Y 2 0 1 9 - 2 0 2 8 2 1
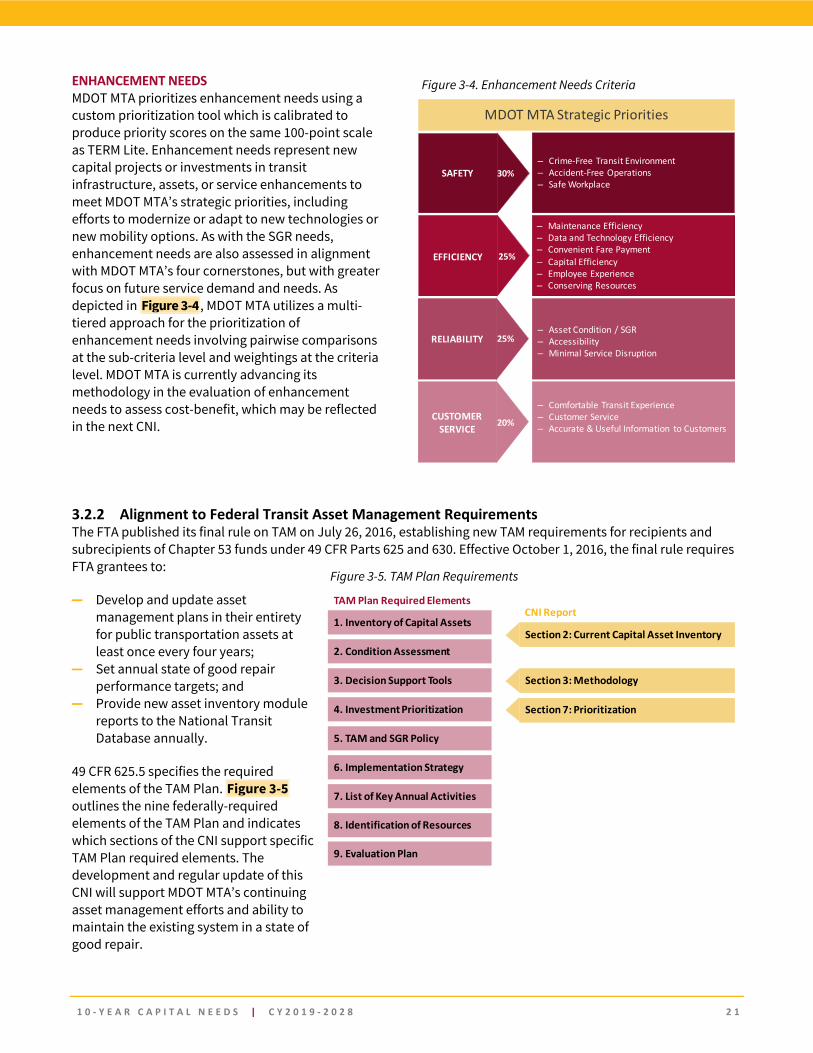
ENHANCEMENT NEEDS MDOT MTA prioritizes enhancement needs using a custom prioritization tool which is calibrated to produce priority scores on the same 100-point scale as TERM Lite. Enhancement needs represent new capital projects or investments in transit infrastructure, assets, or service enhancements to meet MDOT MTA’s strategic priorities, including efforts to modernize or adapt to new technologies or new mobility options. As with the SGR needs, enhancement needs are also assessed in alignment with MDOT MTA’s four cornerstones, but with greater focus on future service demand and needs. As depicted in Figure 3-4, MDOT MTA utilizes a multi-tiered approach for the prioritization of enhancement needs involving pairwise comparisons at the sub-criteria level and weightings at the criteria level. MDOT MTA is currently advancing its methodology in the evaluation of enhancement needs to assess cost-benefit, which may be reflected in the next CNI.
3.2.2 Alignment to Federal Transit Asset Management Requirements The FTA published its final rule on TAM on July 26, 2016, establishing new TAM requirements for recipients and subrecipients of Chapter 53 funds under 49 CFR Parts 625 and 630. Effective October 1, 2016, the final rule requires FTA grantees to:
― Develop and update asset management plans in their entirety for public transportation assets at least once every four years;
― Set annual state of good repair performance targets; and
― Provide new asset inventory module reports to the National Transit Database annually.
49 CFR 625.5 specifies the required elements of the TAM Plan. Figure 3-5 outlines the nine federally-required elements of the TAM Plan and indicates which sections of the CNI support specific TAM Plan required elements. The development and regular update of this CNI will support MDOT MTA’s continuing asset management efforts and ability to maintain the existing system in a state of good repair.
Figure 3-5. TAM Plan Requirements
Figure 3-4. Enhancement Needs Criteria
MDOT MTA Strategic Priorities
CUSTOMER SERVICE
20%
RELIABILITY 25%
EFFICIENCY 25%
SAFETY 30%‒ Crime-Free Transit Environment‒ Accident-Free Operations‒ Safe Workplace
‒ Maintenance Efficiency‒ Data and Technology Efficiency‒ Convenient Fare Payment‒ Capital Efficiency‒ Employee Experience‒ Conserving Resources
‒ Asset Condition / SGR‒ Accessibility‒ Minimal Service Disruption
‒ Comfortable Transit Experience‒ Customer Service‒ Accurate & Useful Information to Customers
1. Inventory of Capital Assets
2. Condition Assessment
3. Decision Support Tools
4. Investment Prioritization
5. TAM and SGR Policy
6. Implementation Strategy
7. List of Key Annual Activities
8. Identification of Resources
9. Evaluation Plan
Section 3: Methodology
Section 7: Prioritization
TAM Plan Required ElementsCNI Report
Section 2: Current Capital Asset Inventory
1 0 - Y E A R C A P I T A L N E E D S | C Y 2 0 1 9 - 2 0 2 8 2 2
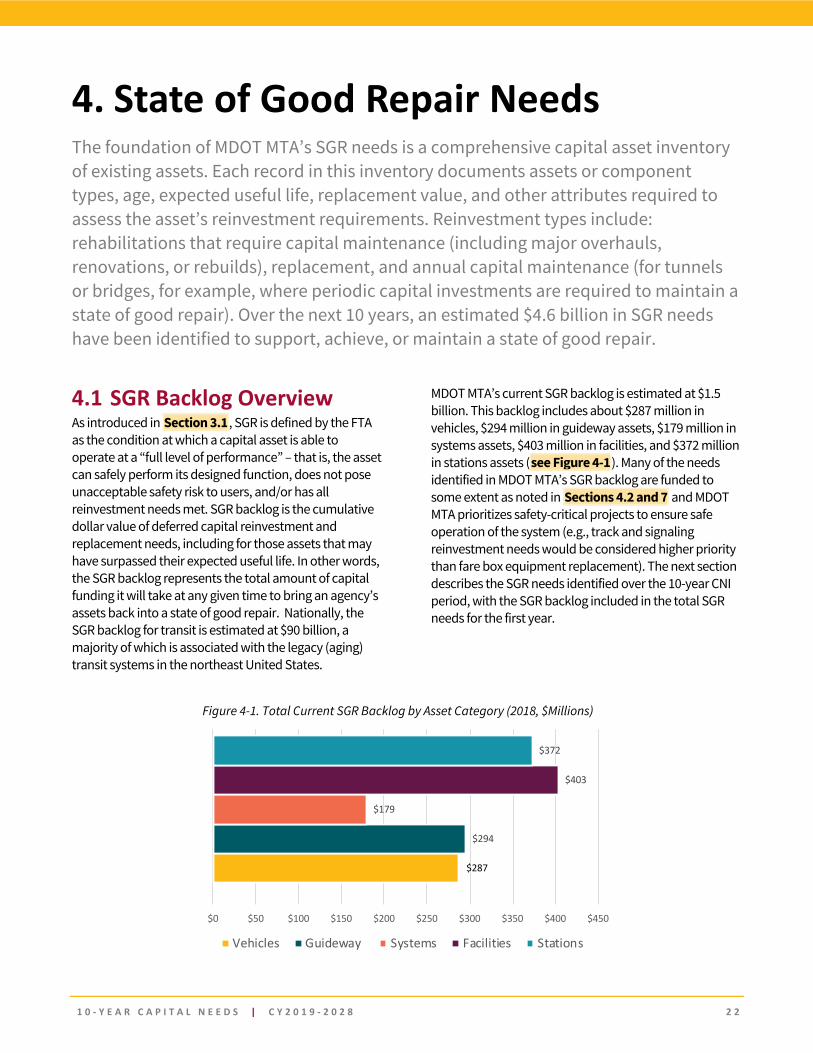
4. State of Good Repair Needs The foundation of MDOT MTA’s SGR needs is a comprehensive capital asset inventory of existing assets. Each record in this inventory documents assets or component types, age, expected useful life, replacement value, and other attributes required to assess the asset’s reinvestment requirements. Reinvestment types include: rehabilitations that require capital maintenance (including major overhauls, renovations, or rebuilds), replacement, and annual capital maintenance (for tunnels or bridges, for example, where periodic capital investments are required to maintain a state of good repair). Over the next 10 years, an estimated $4.6 billion in SGR needs have been identified to support, achieve, or maintain a state of good repair.
4.1 SGR Backlog Overview As introduced in Section 3.1, SGR is defined by the FTA as the condition at which a capital asset is able to operate at a “full level of performance” – that is, the asset can safely perform its designed function, does not pose unacceptable safety risk to users, and/or has all reinvestment needs met. SGR backlog is the cumulative dollar value of deferred capital reinvestment and replacement needs, including for those assets that may have surpassed their expected useful life. In other words, the SGR backlog represents the total amount of capital funding it will take at any given time to bring an agency’s assets back into a state of good repair. Nationally, the SGR backlog for transit is estimated at $90 billion, a majority of which is associated with the legacy (aging) transit systems in the northeast United States.
MDOT MTA’s current SGR backlog is estimated at $1.5 billion. This backlog includes about $287 million in vehicles, $294 million in guideway assets, $179 million in systems assets, $403 million in facilities, and $372 million in stations assets (see Figure 4-1). Many of the needs identified in MDOT MTA’s SGR backlog are funded to some extent as noted in Sections 4.2 and 7 and MDOT MTA prioritizes safety-critical projects to ensure safe operation of the system (e.g., track and signaling reinvestment needs would be considered higher priority than fare box equipment replacement). The next section describes the SGR needs identified over the 10-year CNI period, with the SGR backlog included in the total SGR needs for the first year.
$287
$294
$179
$403
$372
$0 $50 $100 $150 $200 $250 $300 $350 $400 $450
Figure 4-1. Total Current SGR Backlog by Asset Category (2018, $Millions)
Vehicles Guideway Systems Facilities Stations
1 0 - Y E A R C A P I T A L N E E D S | C Y 2 0 1 9 - 2 0 2 8 2 3
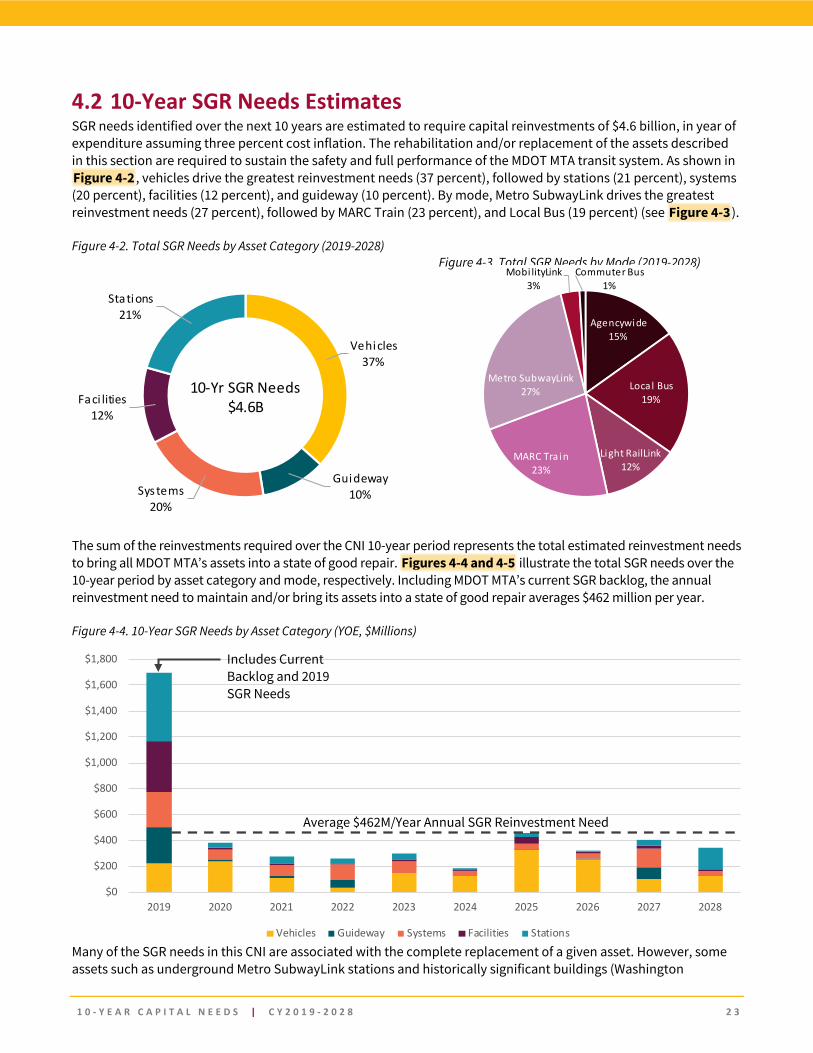
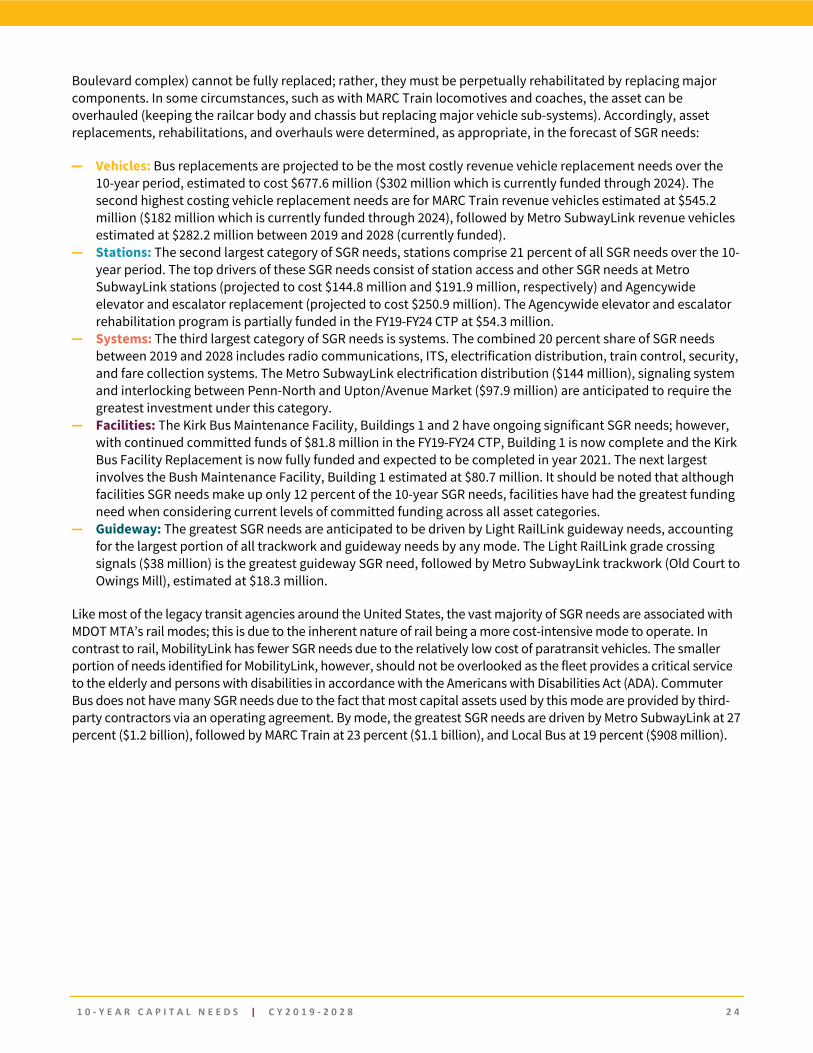
4.2 10-Year SGR Needs Estimates SGR needs identified over the next 10 years are estimated to require capital reinvestments of $4.6 billion, in year of expenditure assuming three percent cost inflation. The rehabilitation and/or replacement of the assets described in this section are required to sustain the safety and full performance of the MDOT MTA transit system. As shown in Figure 4-2 , vehicles drive the greatest reinvestment needs (37 percent), followed by stations (21 percent), systems (20 percent), facilities (12 percent), and guideway (10 percent). By mode, Metro SubwayLink drives the greatest reinvestment needs (27 percent), followed by MARC Train (23 percent), and Local Bus (19 percent) (see Figure 4-3).
Figure 4-2. Total SGR Needs by Asset Category (2019-2028)
The sum of the reinvestments required over the CNI 10-year period represents the total estimated reinvestment needs to bring all MDOT MTA’s assets into a state of good repair. Figures 4-4 and 4-5 illustrate the total SGR needs over the 10-year period by asset category and mode, respectively. Including MDOT MTA’s current SGR backlog, the annual reinvestment need to maintain and/or bring its assets into a state of good repair averages $462 million per year.
Figure 4-4. 10-Year SGR Needs by Asset Category (YOE, $Millions)
Many of the SGR needs in this CNI are associated with the complete replacement of a given asset. However, some assets such as underground Metro SubwayLink stations and historically significant buildings (Washington
Figure 4-3. Total SGR Needs by Mode (2019-2028)
Vehicles37%
Guideway10%Systems
20%
Faci lities12%
Stations21%
10-Yr SGR Needs$4.6B
$0
$200
$400
$600
$800
$1,000
$1,200
$1,400
$1,600
$1,800
2019 2020 2021 2022 2023 2024 2025 2026 2027 2028
Vehicles Guideway Systems Facilities Stations
Includes Current Backlog and 2019 SGR Needs
Average $462M/Year Annual SGR Reinvestment Need
Agencywide15%
Local Bus19%
Light RailLink12%
MARC Tra in23%
Metro SubwayLink27%
Mobi lityLink3%
Commuter Bus1%
1 0 - Y E A R C A P I T A L N E E D S | C Y 2 0 1 9 - 2 0 2 8 2 4
Boulevard complex) cannot be fully replaced; rather, they must be perpetually rehabilitated by replacing major components. In some circumstances, such as with MARC Train locomotives and coaches, the asset can be overhauled (keeping the railcar body and chassis but replacing major vehicle sub-systems). Accordingly, asset replacements, rehabilitations, and overhauls were determined, as appropriate, in the forecast of SGR needs:
― Vehicles: Bus replacements are projected to be the most costly revenue vehicle replacement needs over the 10-year period, estimated to cost $677.6 million ($302 million which is currently funded through 2024). The second highest costing vehicle replacement needs are for MARC Train revenue vehicles estimated at $545.2 million ($182 million which is currently funded through 2024), followed by Metro SubwayLink revenue vehicles estimated at $282.2 million between 2019 and 2028 (currently funded).
― Stations: The second largest category of SGR needs, stations comprise 21 percent of all SGR needs over the 10-year period. The top drivers of these SGR needs consist of station access and other SGR needs at Metro SubwayLink stations (projected to cost $144.8 million and $191.9 million, respectively) and Agencywide elevator and escalator replacement (projected to cost $250.9 million). The Agencywide elevator and escalator rehabilitation program is partially funded in the FY19-FY24 CTP at $54.3 million.
― Systems: The third largest category of SGR needs is systems. The combined 20 percent share of SGR needs between 2019 and 2028 includes radio communications, ITS, electrification distribution, train control, security, and fare collection systems. The Metro SubwayLink electrification distribution ($144 million), signaling system and interlocking between Penn-North and Upton/Avenue Market ($97.9 million) are anticipated to require the greatest investment under this category.
― Facilities: The Kirk Bus Maintenance Facility, Buildings 1 and 2 have ongoing significant SGR needs; however, with continued committed funds of $81.8 million in the FY19-FY24 CTP, Building 1 is now complete and the Kirk Bus Facility Replacement is now fully funded and expected to be completed in year 2021. The next largest involves the Bush Maintenance Facility, Building 1 estimated at $80.7 million. It should be noted that although facilities SGR needs make up only 12 percent of the 10-year SGR needs, facilities have had the greatest funding need when considering current levels of committed funding across all asset categories.
― Guideway: The greatest SGR needs are anticipated to be driven by Light RailLink guideway needs, accounting for the largest portion of all trackwork and guideway needs by any mode. The Light RailLink grade crossing signals ($38 million) is the greatest guideway SGR need, followed by Metro SubwayLink trackwork (Old Court to Owings Mill), estimated at $18.3 million.
Like most of the legacy transit agencies around the United States, the vast majority of SGR needs are associated with MDOT MTA’s rail modes; this is due to the inherent nature of rail being a more cost-intensive mode to operate. In contrast to rail, MobilityLink has fewer SGR needs due to the relatively low cost of paratransit vehicles. The smaller portion of needs identified for MobilityLink, however, should not be overlooked as the fleet provides a critical service to the elderly and persons with disabilities in accordance with the Americans with Disabilities Act (ADA). Commuter Bus does not have many SGR needs due to the fact that most capital assets used by this mode are provided by third-party contractors via an operating agreement. By mode, the greatest SGR needs are driven by Metro SubwayLink at 27 percent ($1.2 billion), followed by MARC Train at 23 percent ($1.1 billion), and Local Bus at 19 percent ($908 million).
1 0 - Y E A R C A P I T A L N E E D S | C Y 2 0 1 9 - 2 0 2 8 2 5
Figure 4-5. 10-Year SGR Needs by Mode (2018-2028, YOE, $Millions)
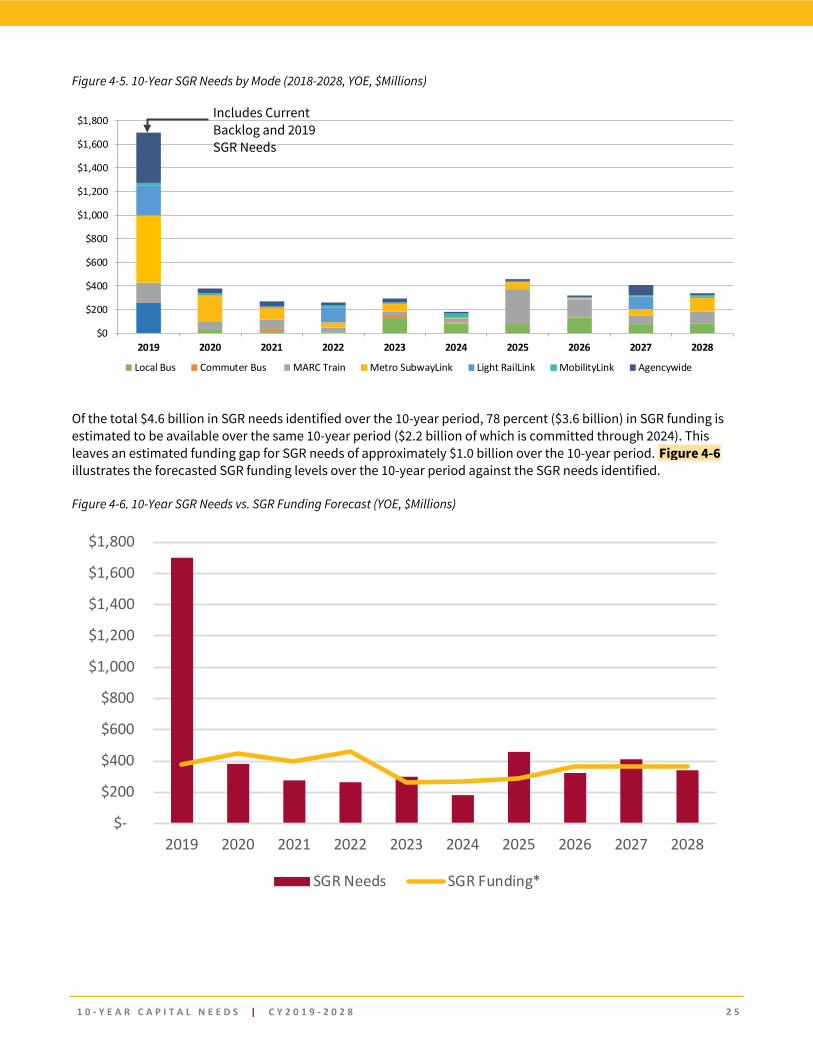
Of the total $4.6 billion in SGR needs identified over the 10-year period, 78 percent ($3.6 billion) in SGR funding is estimated to be available over the same 10-year period ($2.2 billion of which is committed through 2024). This leaves an estimated funding gap for SGR needs of approximately $1.0 billion over the 10-year period. Figure 4-6 illustrates the forecasted SGR funding levels over the 10-year period against the SGR needs identified.
Figure 4-6. 10-Year SGR Needs vs. SGR Funding Forecast (YOE, $Millions)
* Analysis does not include MDOT MTA needs or funding associated with the Purple Line, LOTS, or freight rail.
$0
$200
$400
$600
$800
$1,000
$1,200
$1,400
$1,600
$1,800
2019 2020 2021 2022 2023 2024 2025 2026 2027 2028
Local Bus Commuter Bus MARC Train Metro SubwayLink Light RailLink MobilityLink Agencywide
Includes Current Backlog and 2019 SGR Needs
$-
$200
$400
$600
$800
$1,000
$1,200
$1,400
$1,600
$1,800
2019 2020 2021 2022 2023 2024 2025 2026 2027 2028
SGR Needs SGR Funding*
1 0 - Y E A R C A P I T A L N E E D S | C Y 2 0 1 9 - 2 0 2 8 2 6
4.2.1 Key Findings The following key findings summarize the context for SGR needs identified in this CNI:
― MDOT MTA’s SGR needs over the next 10 years total an estimated $4.6 billion, with a large majority of SGR needs in 2019 due to the current $1.5 billion SGR backlog.
― Of the $4.6 billion in SGR needs identified, $3.6 billion in funding is estimated ($2.2 billion of which is committed through 2024), leaving an estimated funding gap for SGR needs of $1 billion over the 10-year period.
― Including MDOT MTA’s current SGR backlog, the annual reinvestment needed to maintain and/or bring its assets into a state of good repair average $462 million per year.
― Current funding levels will not eliminate the SGR backlog. ― The largest portion of SGR needs by asset category is driven by vehicles reaching the end of their useful lives
and planned fleet rehabilitations or overhauls over the 10-year period, resulting in 37 percent or $1.7 billion in identified SGR needs between 2019 and 2028; $1.1 billion of which is committed through 2024.
― MDOT MTA’s SGR needs and backlog are not unique in the transit industry.
While some of MDOT MTA’s biggest SGR needs are already funded (e.g., Light RailLink vehicle midlife overhaul program, Metro SubwayLink vehicle fleet replacement program, and Metro SubwayLink signal system), several significant unfunded SGR needs are on the horizon including:
― Light RailLink traction power and catenary system replacement ― Metro SubwayLink traction power substation replacements ― Metro SubwayLink station rehabilitation
With many assets being interdependent by nature, smaller or less visible investment needs can be equally important to consider. As a result, comprehensive investment is often required at a system level to fully minimize safety risk and/or loss of transit service.
1 0 - Y E A R C A P I T A L N E E D S | C Y 2 0 1 9 - 2 0 2 8 2 7
5. Enhancement Needs MDOT MTA annually solicits information from modal departments on new capital investments needed to meet industry standards, satisfy forecasted system demand and service levels, improve system safety and security, as well as other enhancements required to adapt to new technologies and new mobility options. An estimated $1.1 billion in enhancement needs have been identified over the next 10 years to support MDOT MTA in continuing to deliver its mission, enhance service, and achieve system performance goals.
5.1 Call for Projects Overview As described in Section 3.1, enhancement needs are new capital investments in transit infrastructure, assets, or service enhancements that support MDOT MTA’s strategic priorities, and current or future service demand. They may also involve new capital investments to improve safety, protection of existing assets, environmental outcomes and/or adapt the system to new requirements, technologies, and new mobility options. Enhancement needs are identified through MDOT MTA’s modal long-range plans, also known as Cornerstone Plans, and the CFP process.
The CFP process engages project managers from across MDOT MTA’s organization to provide information on future capital investment needs, including details regarding project type, purpose and need, scope, costs, schedule, and existing or new assets involved. CFP proposal submissions also include information relating how the proposed capital investments support MDOT MTA’s vision of safety, reliability, efficiency, and customer service. CFP proposal submissions cover both SGR and enhancement needs. Because of this, the SGR-related CFP project proposals are not included in the current CNI analysis to avoid any double-counting from those SGR needs identified from TERM Lite.
A separate review of CFP proposal scopes was also conducted with MDOT MTA staff to eliminate duplicate enhancement needs submitted and identify potential bundling of projects (e.g., where CCTV installations were proposed for various locations, these were bundled Agencywide). The review identified a total of 62 enhancement needs for the current CNI period.
5.2 10-Year Enhancement Needs Estimates
Enhancement needs identified over the next 10 years require an estimated capital investment of $1.1 billion (in YOE dollars, assuming a three percent inflation rate).
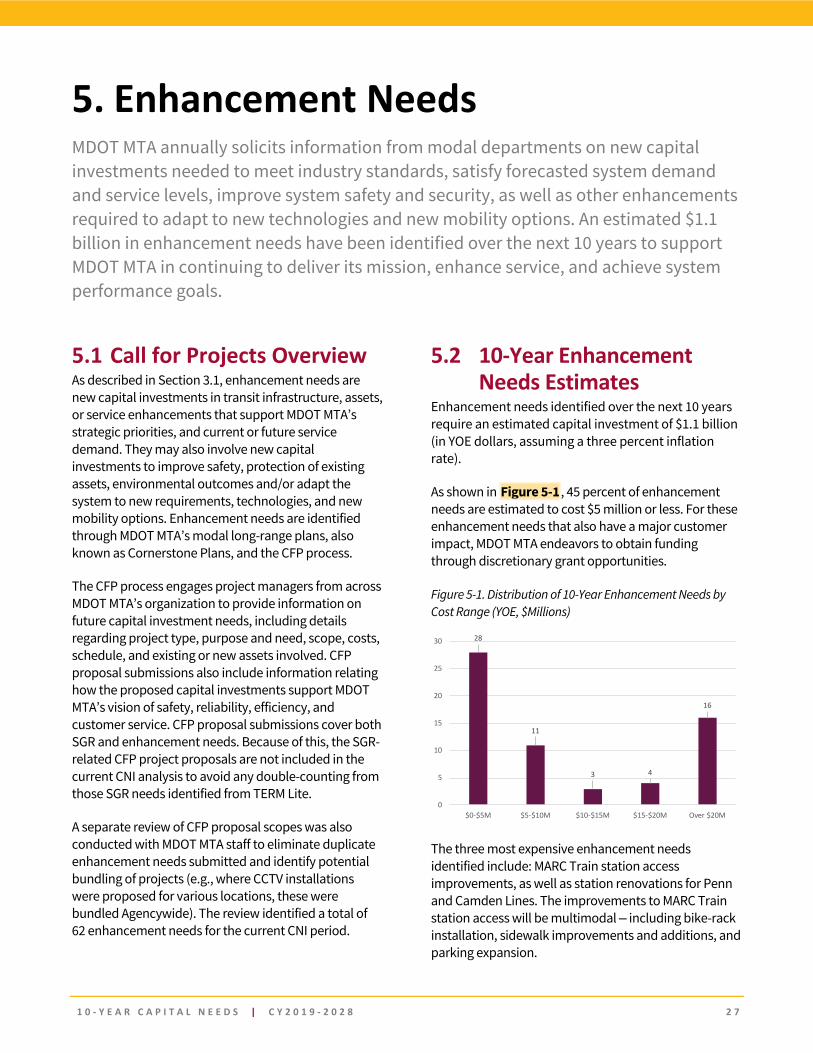
As shown in Figure 5-1, 45 percent of enhancement needs are estimated to cost $5 million or less. For these enhancement needs that also have a major customer impact, MDOT MTA endeavors to obtain funding through discretionary grant opportunities.
Figure 5-1. Distribution of 10-Year Enhancement Needs by Cost Range (YOE, $Millions)
The three most expensive enhancement needs identified include: MARC Train station access improvements, as well as station renovations for Penn and Camden Lines. The improvements to MARC Train station access will be multimodal ‒ including bike-rack installation, sidewalk improvements and additions, and parking expansion.
28
11
3 4
16
0
5
10
15
20
25
30
$0-$5M $5-$10M $10-$15M $15-$20M Over $20M
1 0 - Y E A R C A P I T A L N E E D S | C Y 2 0 1 9 - 2 0 2 8 2 8
MARC Train station access improvements, projected to cost $104 million over the 10-year period, are part of MDOT MTA’s continued efforts to improve access to MARC Train stations by foot, bike, local transit, and car. Example improvements include installation of bike racks at stations; installation or improvement of sidewalks; completion of grade-separated pedestrian crossings at stations; crosswalks and other bicycle and pedestrian access infrastructure; and parking expansion at appropriate stations where current lots are already operating at or above capacity. Penn Line station renovations are projected to cost $90 million over the 10-year period. Renovations include technology and system upgrades for security, communications, and wayfinding at the 12 stations. Additional enhancement needs include safety and environmental improvements like meeting new TMDL requirements from the EPA, as well as smaller investments like upgrading the in-station variable messaging system at all 14 Metro SubwayLink stations to include next train arrival information, information about local events, and emergency alerts.
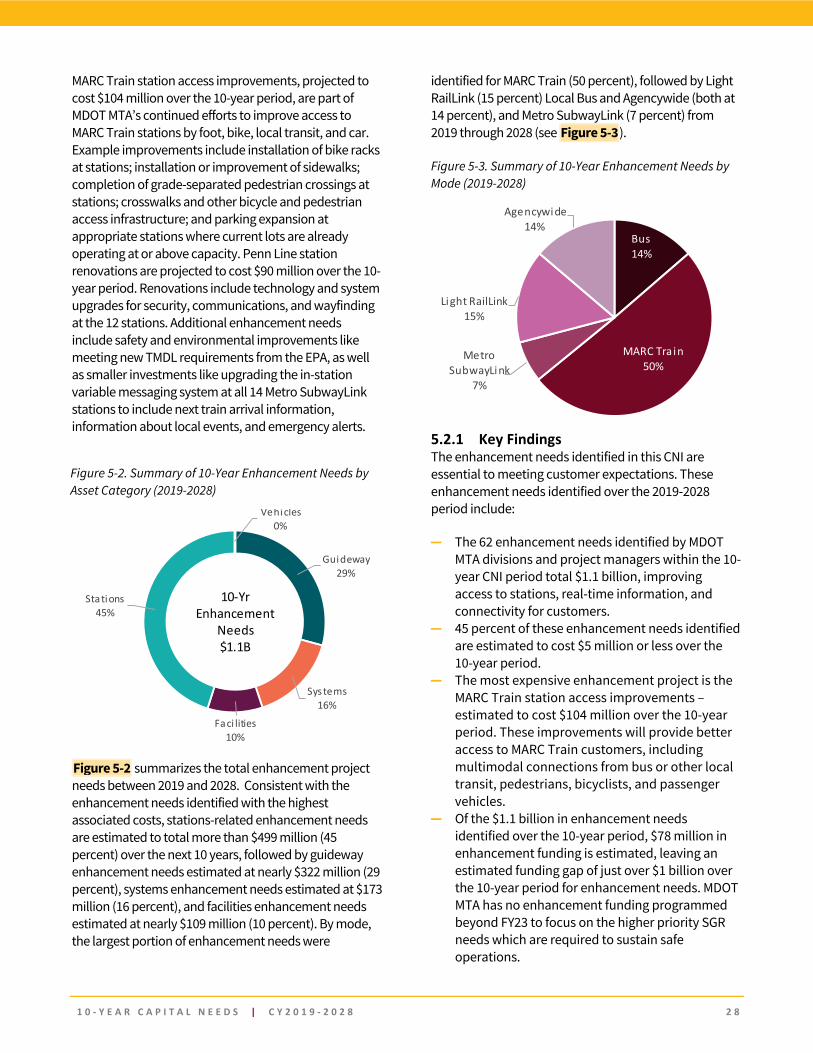
Figure 5-2 summarizes the total enhancement project needs between 2019 and 2028. Consistent with the enhancement needs identified with the highest associated costs, stations-related enhancement needs are estimated to total more than $499 million (45 percent) over the next 10 years, followed by guideway enhancement needs estimated at nearly $322 million (29 percent), systems enhancement needs estimated at $173 million (16 percent), and facilities enhancement needs estimated at nearly $109 million (10 percent). By mode, the largest portion of enhancement needs were
identified for MARC Train (50 percent), followed by Light RailLink (15 percent) Local Bus and Agencywide (both at 14 percent), and Metro SubwayLink (7 percent) from 2019 through 2028 (see Figure 5-3).
Figure 5-3. Summary of 10-Year Enhancement Needs by Mode (2019-2028)
5.2.1 Key Findings The enhancement needs identified in this CNI are essential to meeting customer expectations. These enhancement needs identified over the 2019-2028 period include:
― The 62 enhancement needs identified by MDOT MTA divisions and project managers within the 10-year CNI period total $1.1 billion, improving access to stations, real-time information, and connectivity for customers.
― 45 percent of these enhancement needs identified are estimated to cost $5 million or less over the 10-year period.
― The most expensive enhancement project is the MARC Train station access improvements – estimated to cost $104 million over the 10-year period. These improvements will provide better access to MARC Train customers, including multimodal connections from bus or other local transit, pedestrians, bicyclists, and passenger vehicles.
― Of the $1.1 billion in enhancement needs identified over the 10-year period, $78 million in enhancement funding is estimated, leaving an estimated funding gap of just over $1 billion over the 10-year period for enhancement needs. MDOT MTA has no enhancement funding programmed beyond FY23 to focus on the higher priority SGR needs which are required to sustain safe operations.
Figure 5-2. Summary of 10-Year Enhancement Needs by Asset Category (2019-2028)
Vehicles 0%
Guideway29%
Systems 16%
Faci lities 10%
Stations 45%
10-Yr Enhancement
Needs$1.1B
Bus14%
MARC Tra in50%
Metro SubwayLink
7%
Light RailLink15%
Agencywide14%
1 0 - Y E A R C A P I T A L N E E D S | C Y 2 0 1 9 - 2 0 2 8 2 9
6. Total Capital Investment Needs MDOT MTA’s combined unconstrained SGR and enhancement needs total an estimated $5.7 billion from 2019 to 2028. With a current SGR backlog of $1.5 billion in deferred capital investments, the greatest allocation of needs appears in 2019. Over the 10-year CNI period, the average annual capital needs identified total an estimated $572 million for both SGR and enhancements.
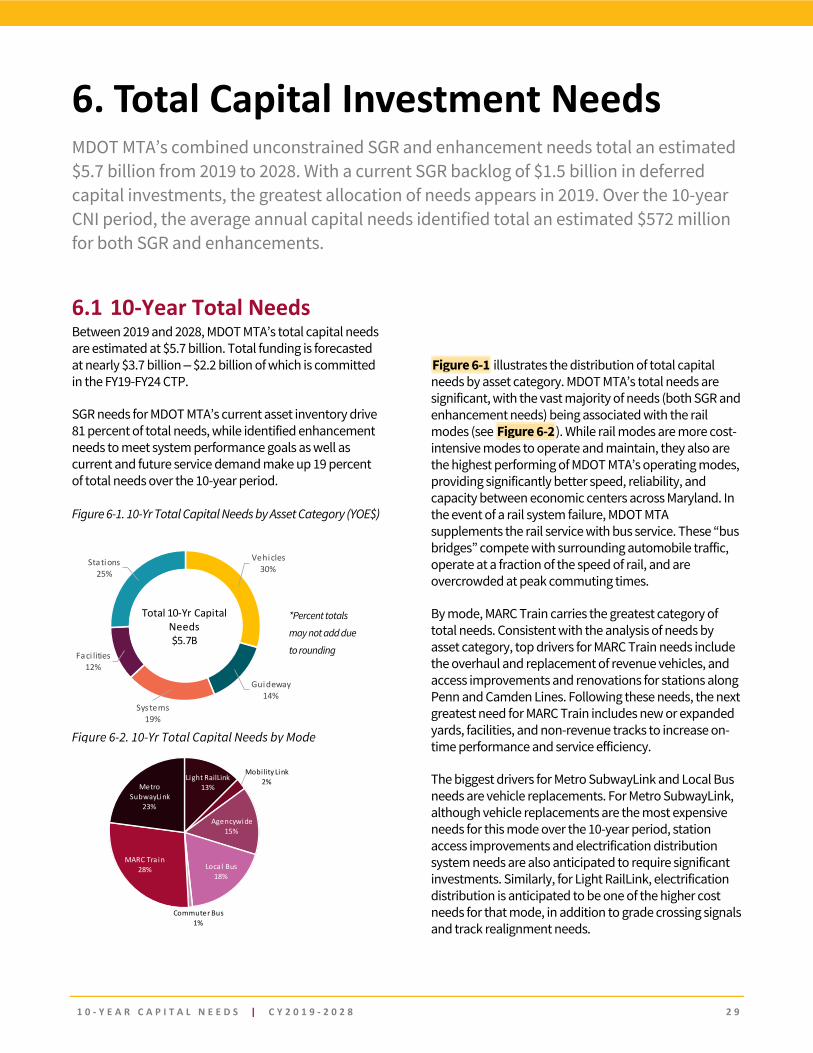
6.1 10-Year Total Needs Between 2019 and 2028, MDOT MTA’s total capital needs are estimated at $5.7 billion. Total funding is forecasted at nearly $3.7 billion ‒ $2.2 billion of which is committed in the FY19-FY24 CTP.
SGR needs for MDOT MTA’s current asset inventory drive 81 percent of total needs, while identified enhancement needs to meet system performance goals as well as current and future service demand make up 19 percent of total needs over the 10-year period.
Figure 6-1. 10-Yr Total Capital Needs by Asset Category (YOE$)
Figure 6-1 illustrates the distribution of total capital needs by asset category. MDOT MTA’s total needs are significant, with the vast majority of needs (both SGR and enhancement needs) being associated with the rail modes (see Figure 6-2). While rail modes are more cost-intensive modes to operate and maintain, they also are the highest performing of MDOT MTA’s operating modes, providing significantly better speed, reliability, and capacity between economic centers across Maryland. In the event of a rail system failure, MDOT MTA supplements the rail service with bus service. These “bus bridges” compete with surrounding automobile traffic, operate at a fraction of the speed of rail, and are overcrowded at peak commuting times.
By mode, MARC Train carries the greatest category of total needs. Consistent with the analysis of needs by asset category, top drivers for MARC Train needs include the overhaul and replacement of revenue vehicles, and access improvements and renovations for stations along Penn and Camden Lines. Following these needs, the next greatest need for MARC Train includes new or expanded yards, facilities, and non-revenue tracks to increase on-time performance and service efficiency.
The biggest drivers for Metro SubwayLink and Local Bus needs are vehicle replacements. For Metro SubwayLink, although vehicle replacements are the most expensive needs for this mode over the 10-year period, station access improvements and electrification distribution system needs are also anticipated to require significant investments. Similarly, for Light RailLink, electrification distribution is anticipated to be one of the higher cost needs for that mode, in addition to grade crossing signals and track realignment needs.
Vehicles30%
Guideway14%
Systems19%
Faci lities12%
Stations25%
Total 10-Yr Capital Needs$5.7B
*Percent totals
may not add due
to rounding
Light RailLink13%
Mobi lity Link2%
Agencywide15%
Local Bus18%
Commuter Bus 1%
MARC Tra in28%
Metro SubwayLink
23%
Figure 6-2. 10-Yr Total Capital Needs by Mode
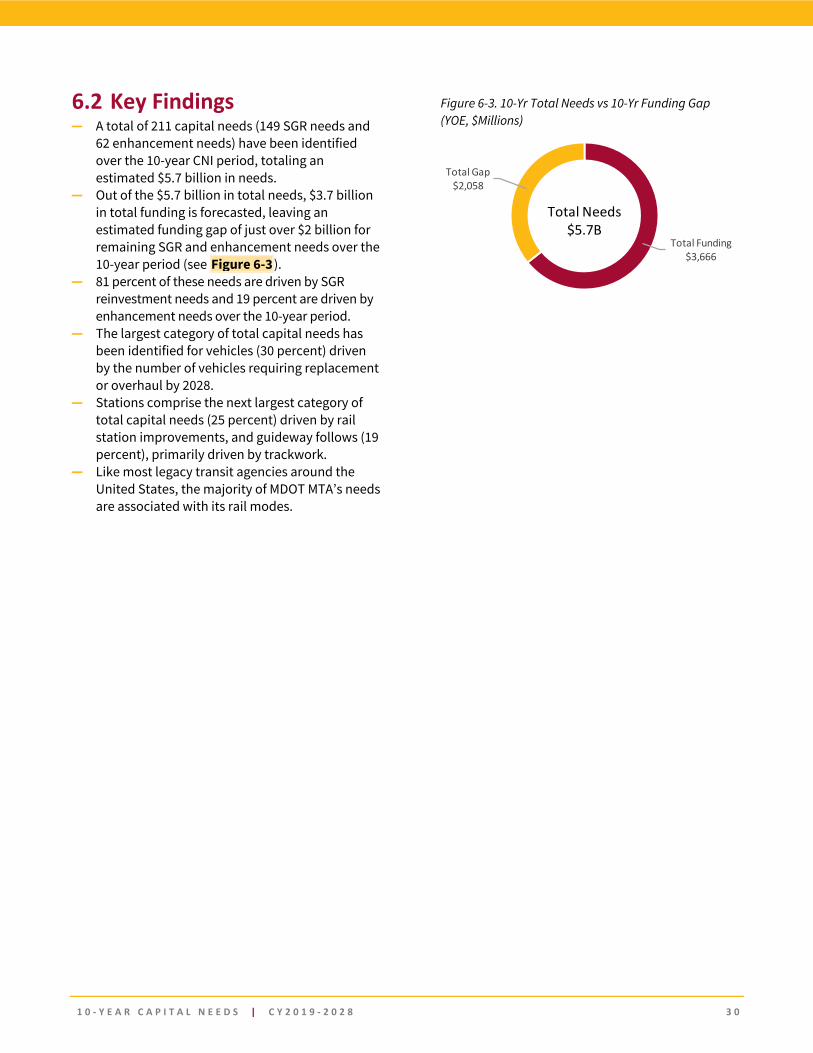
1 0 - Y E A R C A P I T A L N E E D S | C Y 2 0 1 9 - 2 0 2 8 3 0
6.2 Key Findings ― A total of 211 capital needs (149 SGR needs and
62 enhancement needs) have been identified over the 10-year CNI period, totaling an estimated $5.7 billion in needs.
― Out of the $5.7 billion in total needs, $3.7 billion in total funding is forecasted, leaving an estimated funding gap of just over $2 billion for remaining SGR and enhancement needs over the 10-year period (see Figure 6-3).
― 81 percent of these needs are driven by SGR reinvestment needs and 19 percent are driven by enhancement needs over the 10-year period.
― The largest category of total capital needs has been identified for vehicles (30 percent) driven by the number of vehicles requiring replacement or overhaul by 2028.
― Stations comprise the next largest category of total capital needs (25 percent) driven by rail station improvements, and guideway follows (19 percent), primarily driven by trackwork.
― Like most legacy transit agencies around the United States, the majority of MDOT MTA’s needs are associated with its rail modes.
Figure 6-3. 10-Yr Total Needs vs 10-Yr Funding Gap (YOE, $Millions)
Total Funding$3,666
Total Gap$2,058
Total Needs$5.7B
1 0 - Y E A R C A P I T A L N E E D S | C Y 2 0 1 9 - 2 0 2 8 3 1
7. Prioritization This CNI provides an unconstrained view of the total estimated capital needs MDOT MTA requires to maintain or bring its assets into a state of good repair while having the capacity to meet service enhancement needs and system performance goals without pre-determined limits to budget or resources. At current funding levels, MDOT MTA is unable to fully address the 10-year capital investment needs identified. MDOT MTA prioritizes these needs to inform budgetary decision making and ensure that the most critical needs that align with the organization’s strategic priorities can be addressed.
7.1 Overview MDOT MTA has been progressively and proactively investing in better methods of prioritizing its capital needs and exploring innovative approaches to address these needs and narrow existing funding gaps. Building upon its existing asset inventory process, MDOT MTA began using TERM Lite to score and prioritize SGR needs in 2013. Over the last several years, the agency has also improved its method for scoring and prioritizing its enhancement needs. Addressing these combined needs not only supports achievement of MDOT MTA’s performance targets and FTA TAM requirements, but also supports reducing the agency’s $1.5 billion SGR backlog—and further—the nation’s $90 billion SGR backlog. As described in Section 3, these prioritization methodologies help ensure that available funding is prioritized for safety-critical needs above all else.
The prioritization methodology and criteria applied to evaluate identified needs is described in Section 3. TERM Lite identifies “grouped needs” to bring groupings of assets in the current asset inventory into a state of good repair over the 10-year period. These grouped SGR needs are identified in TERM Lite based on common location and function by asset type. They should not be considered the same as the scoped projects that result from MDOT MTA’s CFP process. Priority scores for these grouped SGR needs are determined within TERM Lite, and are based on the weighted average of the max 10-year priority score of each asset in a group. Asset condition is the primary driving factor in prioritization accounting for the rate of deterioration for each asset type, followed by safety and security impacts. However, there are additional considerations that factor into the scoring, including
regulatory considerations, asset interdependencies, service disruption minimization, and environmental and operational efficiency gains.
As enhancement needs are identified through MDOT MTA’s CFP process, these scoped project submissions also undergo similar review against weighted criteria, aligned to the organization’s strategic priorities. For both SGR and enhancement needs, any project or grouped need flagged with a mandate results in higher priority scoring. For example, the TMDL Compliance enhancement need received a priority score of 100.00 because it is a legal mandate.
All needs are scored on a 100-point scale. The exception, however, are high scoring needs identified with committed funding, which may result in a weighted priority score above 100 points, as is the case for the rehabilitation of Metro SubwayLink revenue vehicles. Funded needs are scored the highest as those needs are already programmed to be met.
As the CNI is an unconstrained inventory of needs, there is no relationship between the total cost of a need and its priority score (see Figure 7-1). All but three identified needs are estimated to cost less than $250 million: ― Revenue vehicle rehabilitation for Metro
SubwayLink (SGR need, priority score: 101.05, $282 million);
― Revenue vehicle rehabilitation for MARC Train (SGR need, priority score: 68.79, $545 million); and
― Rehabilitation and replacement of Bus revenue vehicles (SGR need, priority score: 73.18, $677 million).
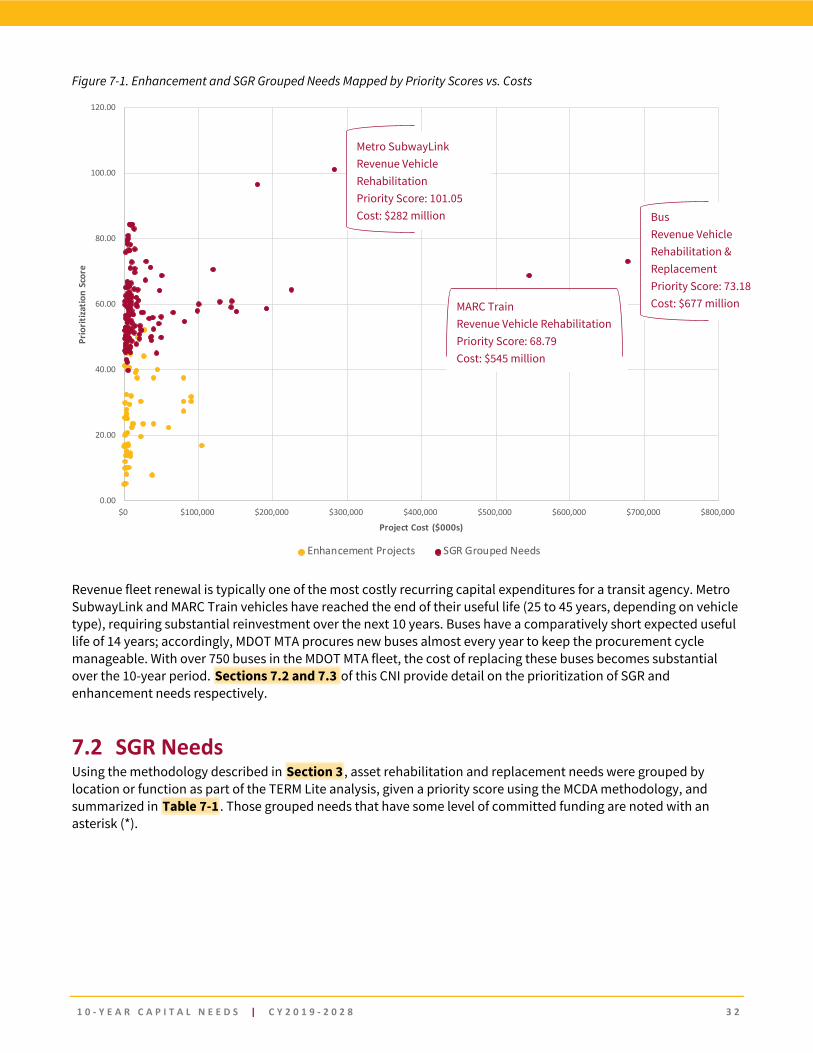
1 0 - Y E A R C A P I T A L N E E D S | C Y 2 0 1 9 - 2 0 2 8 3 2
Figure 7-1. Enhancement and SGR Grouped Needs Mapped by Priority Scores vs. Costs
Revenue fleet renewal is typically one of the most costly recurring capital expenditures for a transit agency. Metro SubwayLink and MARC Train vehicles have reached the end of their useful life (25 to 45 years, depending on vehicle type), requiring substantial reinvestment over the next 10 years. Buses have a comparatively short expected useful life of 14 years; accordingly, MDOT MTA procures new buses almost every year to keep the procurement cycle manageable. With over 750 buses in the MDOT MTA fleet, the cost of replacing these buses becomes substantial over the 10-year period. Sections 7.2 and 7.3 of this CNI provide detail on the prioritization of SGR and enhancement needs respectively.
7.2 SGR Needs Using the methodology described in Section 3 , asset rehabilitation and replacement needs were grouped by location or function as part of the TERM Lite analysis, given a priority score using the MCDA methodology, and summarized in Table 7-1 . Those grouped needs that have some level of committed funding are noted with an asterisk (*).
0.00
20.00
40.00
60.00
80.00
100.00
120.00
$0 $100,000 $200,000 $300,000 $400,000 $500,000 $600,000 $700,000 $800,000
Prio
ritiza
tion
Scor
e
Project Cost ($000s)
Enhancement Projects SGR Grouped Needs
Metro SubwayLink Revenue Vehicle Rehabilitation Priority Score: 101.05 Cost: $282 million Bus
Revenue Vehicle Rehabilitation & Replacement Priority Score: 73.18 Cost: $677 million MARC Train
Revenue Vehicle Rehabilitation Priority Score: 68.79 Cost: $545 million
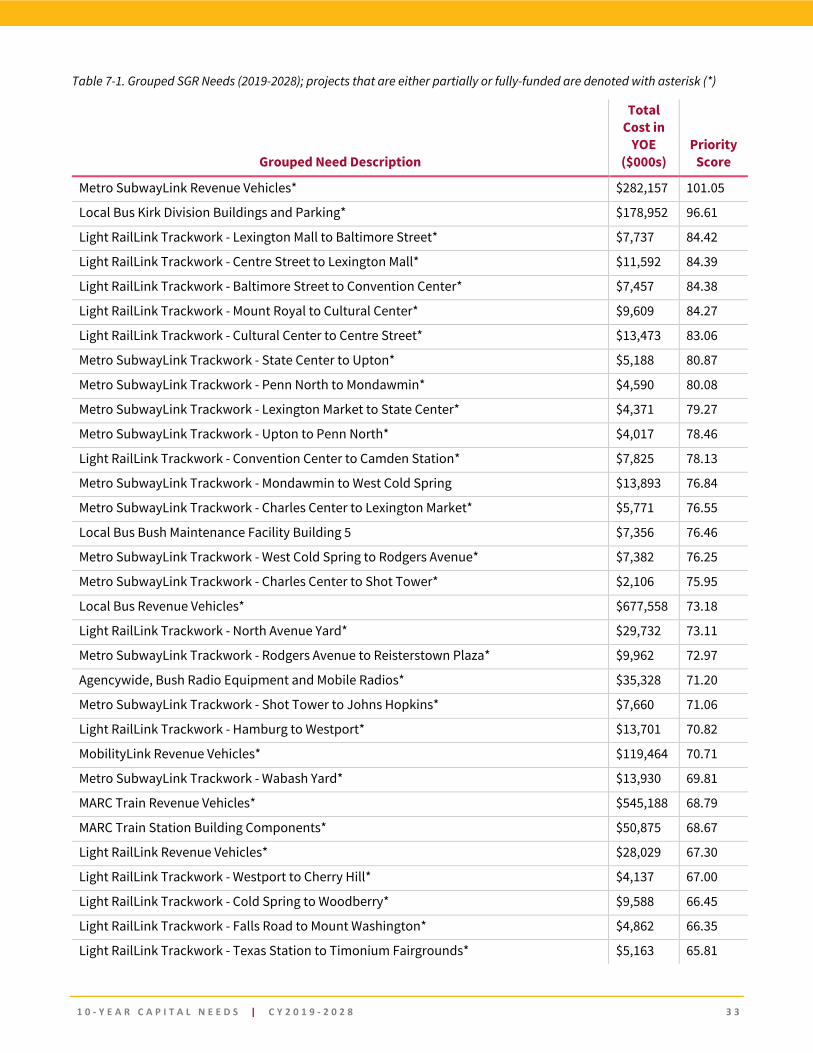
1 0 - Y E A R C A P I T A L N E E D S | C Y 2 0 1 9 - 2 0 2 8 3 3
Table 7-1. Grouped SGR Needs (2019-2028); projects that are either partially or fully-funded are denoted with asterisk (*)
Grouped Need Description
Total Cost in
YOE ($000s)
Priority Score
Metro SubwayLink Revenue Vehicles* $282,157 101.05
Local Bus Kirk Division Buildings and Parking* $178,952 96.61
Light RailLink Trackwork - Lexington Mall to Baltimore Street* $7,737 84.42
Light RailLink Trackwork - Centre Street to Lexington Mall* $11,592 84.39
Light RailLink Trackwork - Baltimore Street to Convention Center* $7,457 84.38
Light RailLink Trackwork - Mount Royal to Cultural Center* $9,609 84.27
Light RailLink Trackwork - Cultural Center to Centre Street* $13,473 83.06
Metro SubwayLink Trackwork - State Center to Upton* $5,188 80.87
Metro SubwayLink Trackwork - Penn North to Mondawmin* $4,590 80.08
Metro SubwayLink Trackwork - Lexington Market to State Center* $4,371 79.27
Metro SubwayLink Trackwork - Upton to Penn North* $4,017 78.46
Light RailLink Trackwork - Convention Center to Camden Station* $7,825 78.13
Metro SubwayLink Trackwork - Mondawmin to West Cold Spring $13,893 76.84
Metro SubwayLink Trackwork - Charles Center to Lexington Market* $5,771 76.55
Local Bus Bush Maintenance Facility Building 5 $7,356 76.46
Metro SubwayLink Trackwork - West Cold Spring to Rodgers Avenue* $7,382 76.25
Metro SubwayLink Trackwork - Charles Center to Shot Tower* $2,106 75.95
Local Bus Revenue Vehicles* $677,558 73.18
Light RailLink Trackwork - North Avenue Yard* $29,732 73.11
Metro SubwayLink Trackwork - Rodgers Avenue to Reisterstown Plaza* $9,962 72.97
Agencywide, Bush Radio Equipment and Mobile Radios* $35,328 71.20
Metro SubwayLink Trackwork - Shot Tower to Johns Hopkins* $7,660 71.06
Light RailLink Trackwork - Hamburg to Westport* $13,701 70.82
MobilityLink Revenue Vehicles* $119,464 70.71
Metro SubwayLink Trackwork - Wabash Yard* $13,930 69.81
MARC Train Revenue Vehicles* $545,188 68.79
MARC Train Station Building Components* $50,875 68.67
Light RailLink Revenue Vehicles* $28,029 67.30
Light RailLink Trackwork - Westport to Cherry Hill* $4,137 67.00
Light RailLink Trackwork - Cold Spring to Woodberry* $9,588 66.45
Light RailLink Trackwork - Falls Road to Mount Washington* $4,862 66.35
Light RailLink Trackwork - Texas Station to Timonium Fairgrounds* $5,163 65.81
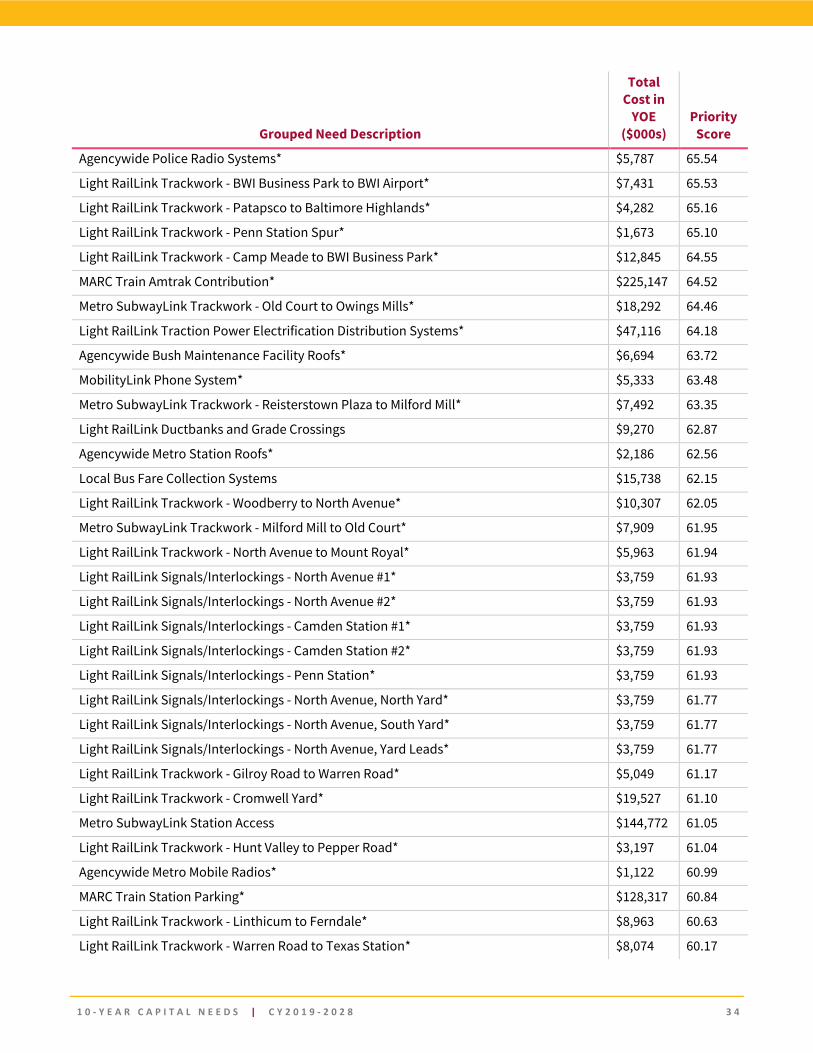
1 0 - Y E A R C A P I T A L N E E D S | C Y 2 0 1 9 - 2 0 2 8 3 4
Grouped Need Description
Total Cost in
YOE ($000s)
Priority Score
Agencywide Police Radio Systems* $5,787 65.54
Light RailLink Trackwork - BWI Business Park to BWI Airport* $7,431 65.53
Light RailLink Trackwork - Patapsco to Baltimore Highlands* $4,282 65.16
Light RailLink Trackwork - Penn Station Spur* $1,673 65.10
Light RailLink Trackwork - Camp Meade to BWI Business Park* $12,845 64.55
MARC Train Amtrak Contribution* $225,147 64.52
Metro SubwayLink Trackwork - Old Court to Owings Mills* $18,292 64.46
Light RailLink Traction Power Electrification Distribution Systems* $47,116 64.18
Agencywide Bush Maintenance Facility Roofs* $6,694 63.72
MobilityLink Phone System* $5,333 63.48
Metro SubwayLink Trackwork - Reisterstown Plaza to Milford Mill* $7,492 63.35
Light RailLink Ductbanks and Grade Crossings $9,270 62.87
Agencywide Metro Station Roofs* $2,186 62.56
Local Bus Fare Collection Systems $15,738 62.15
Light RailLink Trackwork - Woodberry to North Avenue* $10,307 62.05
Metro SubwayLink Trackwork - Milford Mill to Old Court* $7,909 61.95
Light RailLink Trackwork - North Avenue to Mount Royal* $5,963 61.94
Light RailLink Signals/Interlockings - North Avenue #1* $3,759 61.93
Light RailLink Signals/Interlockings - North Avenue #2* $3,759 61.93
Light RailLink Signals/Interlockings - Camden Station #1* $3,759 61.93
Light RailLink Signals/Interlockings - Camden Station #2* $3,759 61.93
Light RailLink Signals/Interlockings - Penn Station* $3,759 61.93
Light RailLink Signals/Interlockings - North Avenue, North Yard* $3,759 61.77
Light RailLink Signals/Interlockings - North Avenue, South Yard* $3,759 61.77
Light RailLink Signals/Interlockings - North Avenue, Yard Leads* $3,759 61.77
Light RailLink Trackwork - Gilroy Road to Warren Road* $5,049 61.17
Light RailLink Trackwork - Cromwell Yard* $19,527 61.10
Metro SubwayLink Station Access $144,772 61.05
Light RailLink Trackwork - Hunt Valley to Pepper Road* $3,197 61.04
Agencywide Metro Mobile Radios* $1,122 60.99
MARC Train Station Parking* $128,317 60.84
Light RailLink Trackwork - Linthicum to Ferndale* $8,963 60.63
Light RailLink Trackwork - Warren Road to Texas Station* $8,074 60.17
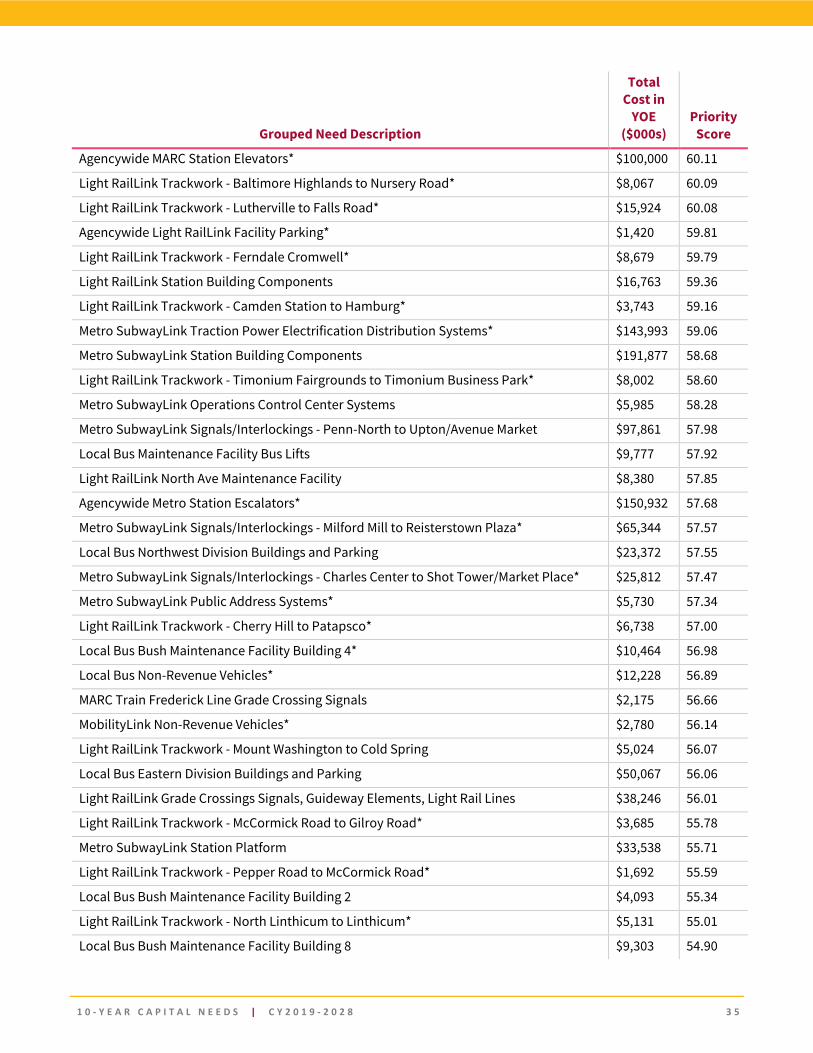
1 0 - Y E A R C A P I T A L N E E D S | C Y 2 0 1 9 - 2 0 2 8 3 5
Grouped Need Description
Total Cost in
YOE ($000s)
Priority Score
Agencywide MARC Station Elevators* $100,000 60.11
Light RailLink Trackwork - Baltimore Highlands to Nursery Road* $8,067 60.09
Light RailLink Trackwork - Lutherville to Falls Road* $15,924 60.08
Agencywide Light RailLink Facility Parking* $1,420 59.81
Light RailLink Trackwork - Ferndale Cromwell* $8,679 59.79
Light RailLink Station Building Components $16,763 59.36
Light RailLink Trackwork - Camden Station to Hamburg* $3,743 59.16
Metro SubwayLink Traction Power Electrification Distribution Systems* $143,993 59.06
Metro SubwayLink Station Building Components $191,877 58.68
Light RailLink Trackwork - Timonium Fairgrounds to Timonium Business Park* $8,002 58.60
Metro SubwayLink Operations Control Center Systems $5,985 58.28
Metro SubwayLink Signals/Interlockings - Penn-North to Upton/Avenue Market $97,861 57.98
Local Bus Maintenance Facility Bus Lifts $9,777 57.92
Light RailLink North Ave Maintenance Facility $8,380 57.85
Agencywide Metro Station Escalators* $150,932 57.68
Metro SubwayLink Signals/Interlockings - Milford Mill to Reisterstown Plaza* $65,344 57.57
Local Bus Northwest Division Buildings and Parking $23,372 57.55
Metro SubwayLink Signals/Interlockings - Charles Center to Shot Tower/Market Place* $25,812 57.47
Metro SubwayLink Public Address Systems* $5,730 57.34
Light RailLink Trackwork - Cherry Hill to Patapsco* $6,738 57.00
Local Bus Bush Maintenance Facility Building 4* $10,464 56.98
Local Bus Non-Revenue Vehicles* $12,228 56.89
MARC Train Frederick Line Grade Crossing Signals $2,175 56.66
MobilityLink Non-Revenue Vehicles* $2,780 56.14
Light RailLink Trackwork - Mount Washington to Cold Spring $5,024 56.07
Local Bus Eastern Division Buildings and Parking $50,067 56.06
Light RailLink Grade Crossings Signals, Guideway Elements, Light Rail Lines $38,246 56.01
Light RailLink Trackwork - McCormick Road to Gilroy Road* $3,685 55.78
Metro SubwayLink Station Platform $33,538 55.71
Light RailLink Trackwork - Pepper Road to McCormick Road* $1,692 55.59
Local Bus Bush Maintenance Facility Building 2 $4,093 55.34
Light RailLink Trackwork - North Linthicum to Linthicum* $5,131 55.01
Local Bus Bush Maintenance Facility Building 8 $9,303 54.90
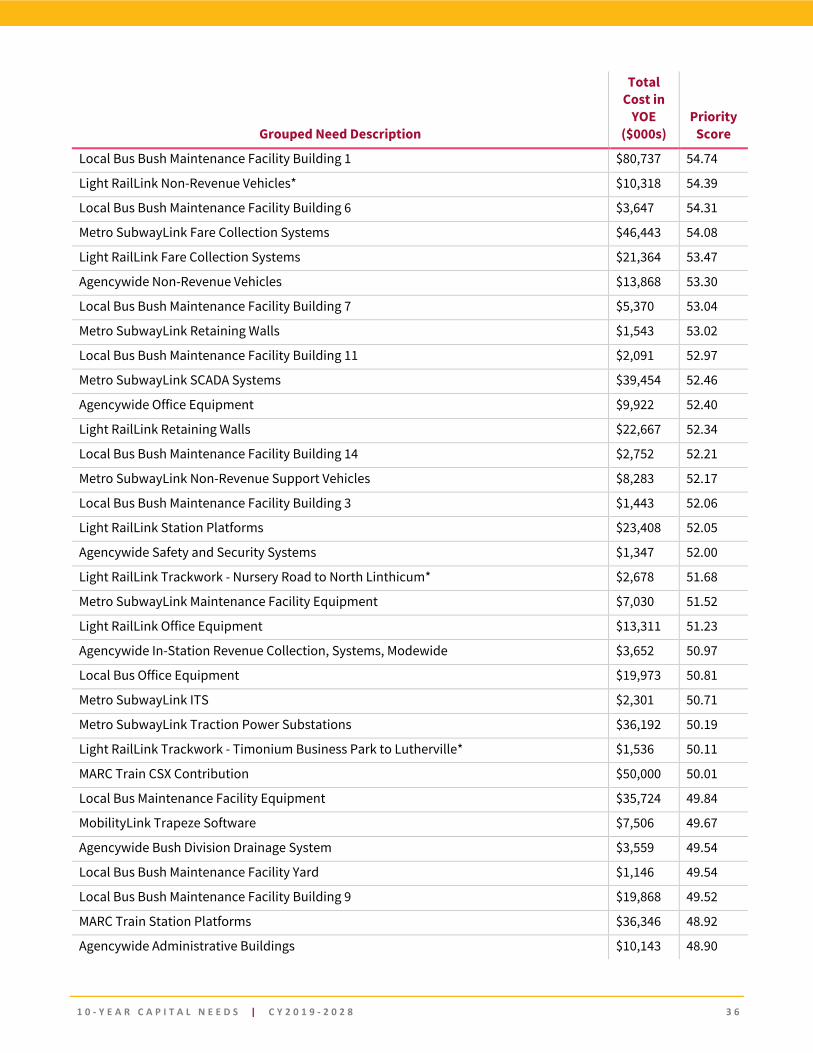
1 0 - Y E A R C A P I T A L N E E D S | C Y 2 0 1 9 - 2 0 2 8 3 6
Grouped Need Description
Total Cost in
YOE ($000s)
Priority Score
Local Bus Bush Maintenance Facility Building 1 $80,737 54.74
Light RailLink Non-Revenue Vehicles* $10,318 54.39
Local Bus Bush Maintenance Facility Building 6 $3,647 54.31
Metro SubwayLink Fare Collection Systems $46,443 54.08
Light RailLink Fare Collection Systems $21,364 53.47
Agencywide Non-Revenue Vehicles $13,868 53.30
Local Bus Bush Maintenance Facility Building 7 $5,370 53.04
Metro SubwayLink Retaining Walls $1,543 53.02
Local Bus Bush Maintenance Facility Building 11 $2,091 52.97
Metro SubwayLink SCADA Systems $39,454 52.46
Agencywide Office Equipment $9,922 52.40
Light RailLink Retaining Walls $22,667 52.34
Local Bus Bush Maintenance Facility Building 14 $2,752 52.21
Metro SubwayLink Non-Revenue Support Vehicles $8,283 52.17
Local Bus Bush Maintenance Facility Building 3 $1,443 52.06
Light RailLink Station Platforms $23,408 52.05
Agencywide Safety and Security Systems $1,347 52.00
Light RailLink Trackwork - Nursery Road to North Linthicum* $2,678 51.68
Metro SubwayLink Maintenance Facility Equipment $7,030 51.52
Light RailLink Office Equipment $13,311 51.23
Agencywide In-Station Revenue Collection, Systems, Modewide $3,652 50.97
Local Bus Office Equipment $19,973 50.81
Metro SubwayLink ITS $2,301 50.71
Metro SubwayLink Traction Power Substations $36,192 50.19
Light RailLink Trackwork - Timonium Business Park to Lutherville* $1,536 50.11
MARC Train CSX Contribution $50,000 50.01
Local Bus Maintenance Facility Equipment $35,724 49.84
MobilityLink Trapeze Software $7,506 49.67
Agencywide Bush Division Drainage System $3,559 49.54
Local Bus Bush Maintenance Facility Yard $1,146 49.54
Local Bus Bush Maintenance Facility Building 9 $19,868 49.52
MARC Train Station Platforms $36,346 48.92
Agencywide Administrative Buildings $10,143 48.90
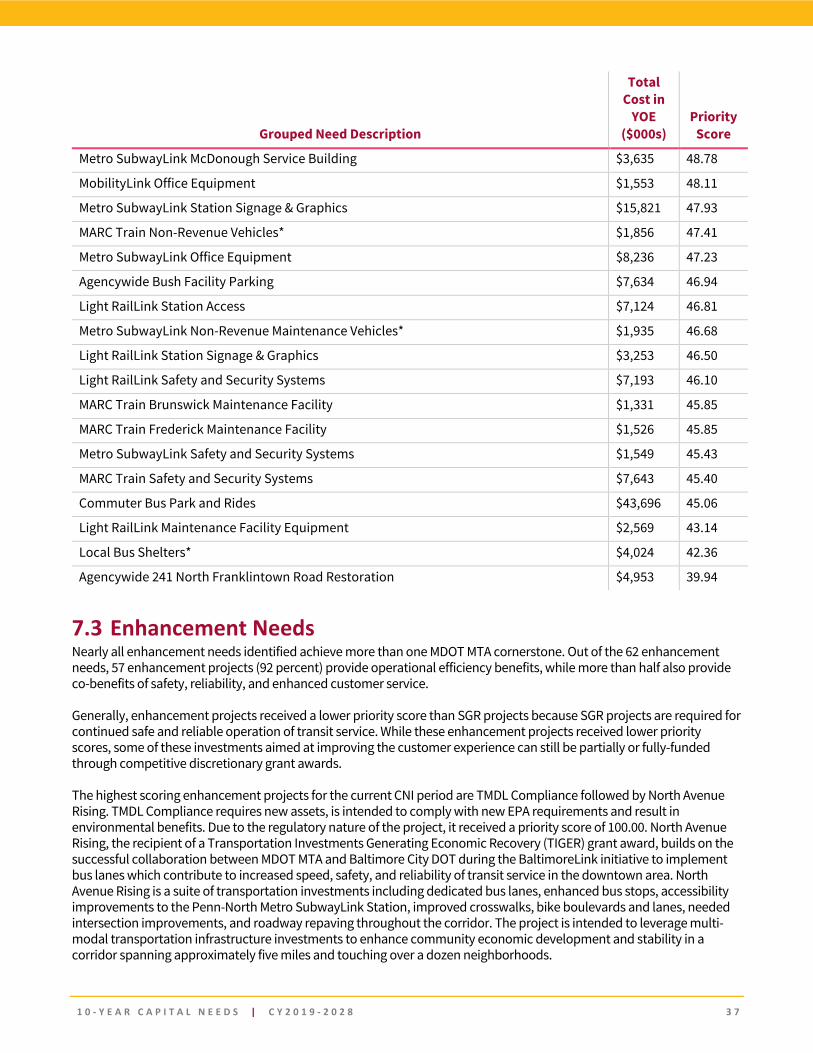
1 0 - Y E A R C A P I T A L N E E D S | C Y 2 0 1 9 - 2 0 2 8 3 7
Grouped Need Description
Total Cost in
YOE ($000s)
Priority Score
Metro SubwayLink McDonough Service Building $3,635 48.78
MobilityLink Office Equipment $1,553 48.11
Metro SubwayLink Station Signage & Graphics $15,821 47.93
MARC Train Non-Revenue Vehicles* $1,856 47.41
Metro SubwayLink Office Equipment $8,236 47.23
Agencywide Bush Facility Parking $7,634 46.94
Light RailLink Station Access $7,124 46.81
Metro SubwayLink Non-Revenue Maintenance Vehicles* $1,935 46.68
Light RailLink Station Signage & Graphics $3,253 46.50
Light RailLink Safety and Security Systems $7,193 46.10
MARC Train Brunswick Maintenance Facility $1,331 45.85
MARC Train Frederick Maintenance Facility $1,526 45.85
Metro SubwayLink Safety and Security Systems $1,549 45.43
MARC Train Safety and Security Systems $7,643 45.40
Commuter Bus Park and Rides $43,696 45.06
Light RailLink Maintenance Facility Equipment $2,569 43.14
Local Bus Shelters* $4,024 42.36
Agencywide 241 North Franklintown Road Restoration $4,953 39.94
7.3 Enhancement Needs Nearly all enhancement needs identified achieve more than one MDOT MTA cornerstone. Out of the 62 enhancement needs, 57 enhancement projects (92 percent) provide operational efficiency benefits, while more than half also provide co-benefits of safety, reliability, and enhanced customer service.
Generally, enhancement projects received a lower priority score than SGR projects because SGR projects are required for continued safe and reliable operation of transit service. While these enhancement projects received lower priority scores, some of these investments aimed at improving the customer experience can still be partially or fully-funded through competitive discretionary grant awards.
The highest scoring enhancement projects for the current CNI period are TMDL Compliance followed by North Avenue Rising. TMDL Compliance requires new assets, is intended to comply with new EPA requirements and result in environmental benefits. Due to the regulatory nature of the project, it received a priority score of 100.00. North Avenue Rising, the recipient of a Transportation Investments Generating Economic Recovery (TIGER) grant award, builds on the successful collaboration between MDOT MTA and Baltimore City DOT during the BaltimoreLink initiative to implement bus lanes which contribute to increased speed, safety, and reliability of transit service in the downtown area. North Avenue Rising is a suite of transportation investments including dedicated bus lanes, enhanced bus stops, accessibility improvements to the Penn-North Metro SubwayLink Station, improved crosswalks, bike boulevards and lanes, needed intersection improvements, and roadway repaving throughout the corridor. The project is intended to leverage multi-modal transportation infrastructure investments to enhance community economic development and stability in a corridor spanning approximately five miles and touching over a dozen neighborhoods.
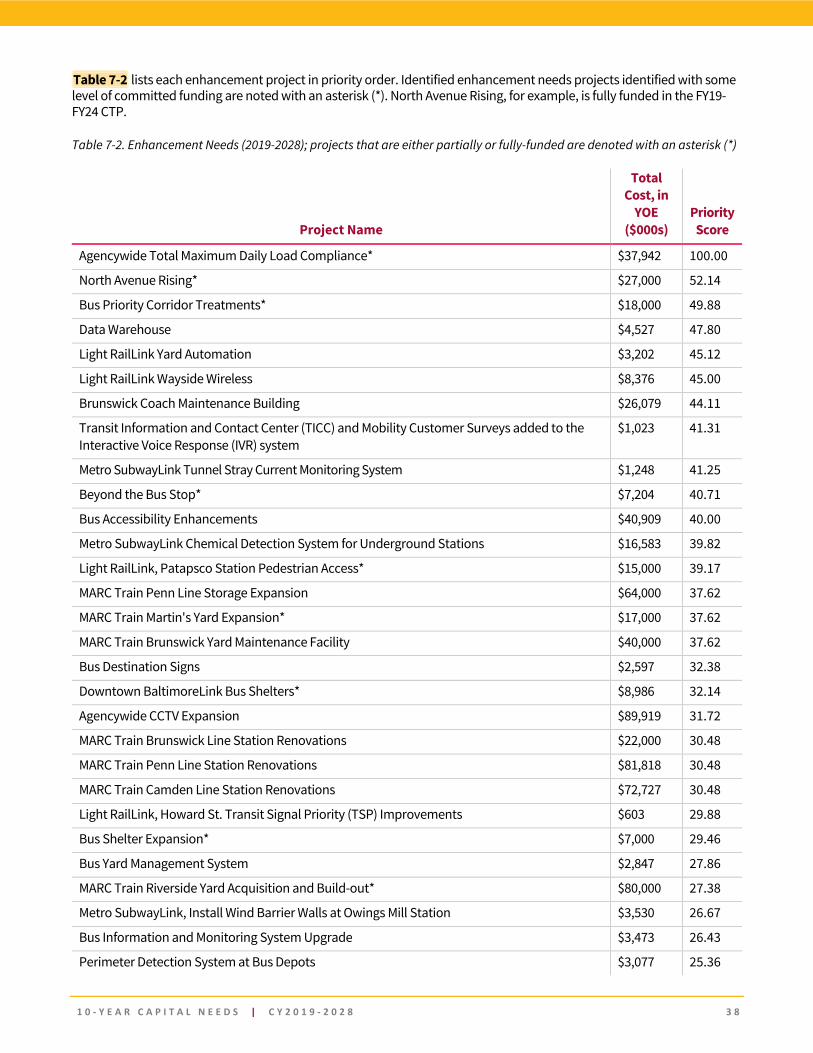
1 0 - Y E A R C A P I T A L N E E D S | C Y 2 0 1 9 - 2 0 2 8 3 8
Table 7-2 lists each enhancement project in priority order. Identified enhancement needs projects identified with some level of committed funding are noted with an asterisk (*). North Avenue Rising, for example, is fully funded in the FY19-FY24 CTP.
Table 7-2. Enhancement Needs (2019-2028); projects that are either partially or fully-funded are denoted with an asterisk (*)
Project Name
Total Cost, in
YOE ($000s)
Priority Score
Agencywide Total Maximum Daily Load Compliance* $37,942 100.00
North Avenue Rising* $27,000 52.14
Bus Priority Corridor Treatments* $18,000 49.88
Data Warehouse $4,527 47.80
Light RailLink Yard Automation $3,202 45.12
Light RailLink Wayside Wireless $8,376 45.00
Brunswick Coach Maintenance Building $26,079 44.11
Transit Information and Contact Center (TICC) and Mobility Customer Surveys added to the Interactive Voice Response (IVR) system
$1,023 41.31
Metro SubwayLink Tunnel Stray Current Monitoring System $1,248 41.25
Beyond the Bus Stop* $7,204 40.71
Bus Accessibility Enhancements $40,909 40.00
Metro SubwayLink Chemical Detection System for Underground Stations $16,583 39.82
Light RailLink, Patapsco Station Pedestrian Access* $15,000 39.17
MARC Train Penn Line Storage Expansion $64,000 37.62
MARC Train Martin's Yard Expansion* $17,000 37.62
MARC Train Brunswick Yard Maintenance Facility $40,000 37.62
Bus Destination Signs $2,597 32.38
Downtown BaltimoreLink Bus Shelters* $8,986 32.14
Agencywide CCTV Expansion $89,919 31.72
MARC Train Brunswick Line Station Renovations $22,000 30.48
MARC Train Penn Line Station Renovations $81,818 30.48
MARC Train Camden Line Station Renovations $72,727 30.48
Light RailLink, Howard St. Transit Signal Priority (TSP) Improvements $603 29.88
Bus Shelter Expansion* $7,000 29.46
Bus Yard Management System $2,847 27.86
MARC Train Riverside Yard Acquisition and Build-out* $80,000 27.38
Metro SubwayLink, Install Wind Barrier Walls at Owings Mill Station $3,530 26.67
Bus Information and Monitoring System Upgrade $3,473 26.43
Perimeter Detection System at Bus Depots $3,077 25.36
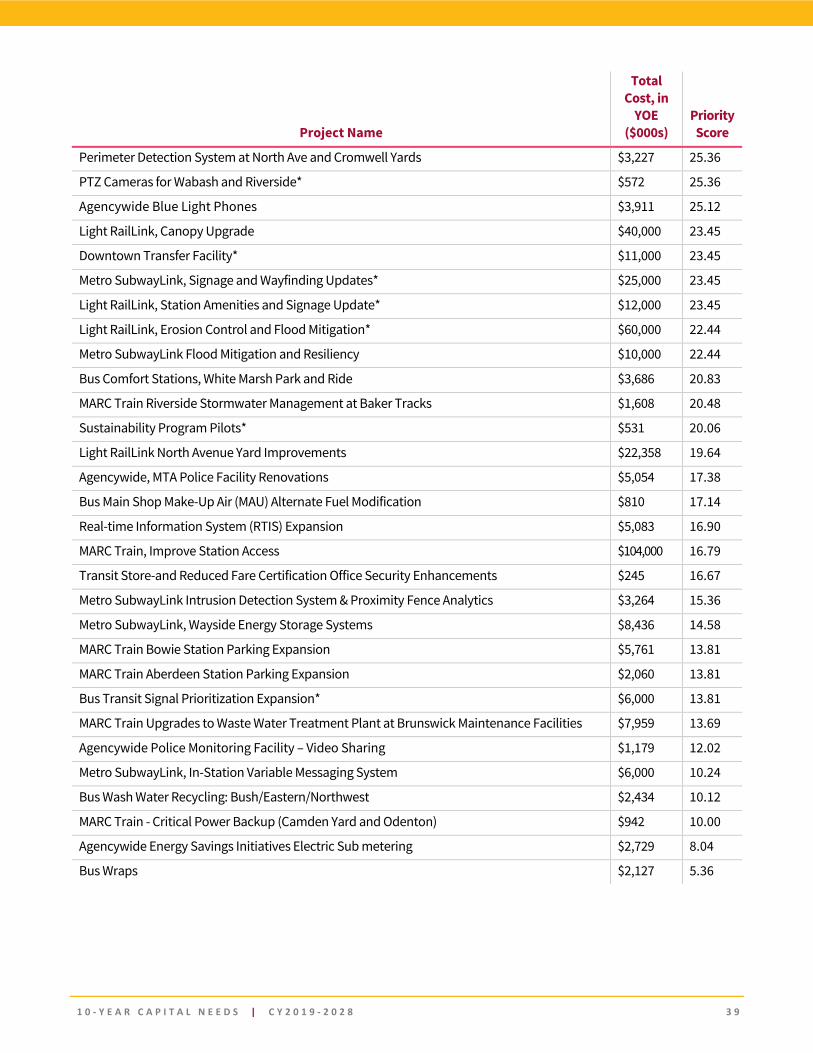
1 0 - Y E A R C A P I T A L N E E D S | C Y 2 0 1 9 - 2 0 2 8 3 9
Project Name
Total Cost, in
YOE ($000s)
Priority Score
Perimeter Detection System at North Ave and Cromwell Yards $3,227 25.36
PTZ Cameras for Wabash and Riverside* $572 25.36
Agencywide Blue Light Phones $3,911 25.12
Light RailLink, Canopy Upgrade $40,000 23.45
Downtown Transfer Facility* $11,000 23.45
Metro SubwayLink, Signage and Wayfinding Updates* $25,000 23.45
Light RailLink, Station Amenities and Signage Update* $12,000 23.45
Light RailLink, Erosion Control and Flood Mitigation* $60,000 22.44
Metro SubwayLink Flood Mitigation and Resiliency $10,000 22.44
Bus Comfort Stations, White Marsh Park and Ride $3,686 20.83
MARC Train Riverside Stormwater Management at Baker Tracks $1,608 20.48
Sustainability Program Pilots* $531 20.06
Light RailLink North Avenue Yard Improvements $22,358 19.64
Agencywide, MTA Police Facility Renovations $5,054 17.38
Bus Main Shop Make-Up Air (MAU) Alternate Fuel Modification $810 17.14
Real-time Information System (RTIS) Expansion $5,083 16.90
MARC Train, Improve Station Access $104,000 16.79
Transit Store-and Reduced Fare Certification Office Security Enhancements $245 16.67
Metro SubwayLink Intrusion Detection System & Proximity Fence Analytics $3,264 15.36
Metro SubwayLink, Wayside Energy Storage Systems $8,436 14.58
MARC Train Bowie Station Parking Expansion $5,761 13.81
MARC Train Aberdeen Station Parking Expansion $2,060 13.81
Bus Transit Signal Prioritization Expansion* $6,000 13.81
MARC Train Upgrades to Waste Water Treatment Plant at Brunswick Maintenance Facilities $7,959 13.69
Agencywide Police Monitoring Facility – Video Sharing $1,179 12.02
Metro SubwayLink, In-Station Variable Messaging System $6,000 10.24
Bus Wash Water Recycling: Bush/Eastern/Northwest $2,434 10.12
MARC Train - Critical Power Backup (Camden Yard and Odenton) $942 10.00
Agencywide Energy Savings Initiatives Electric Sub metering $2,729 8.04
Bus Wraps $2,127 5.36
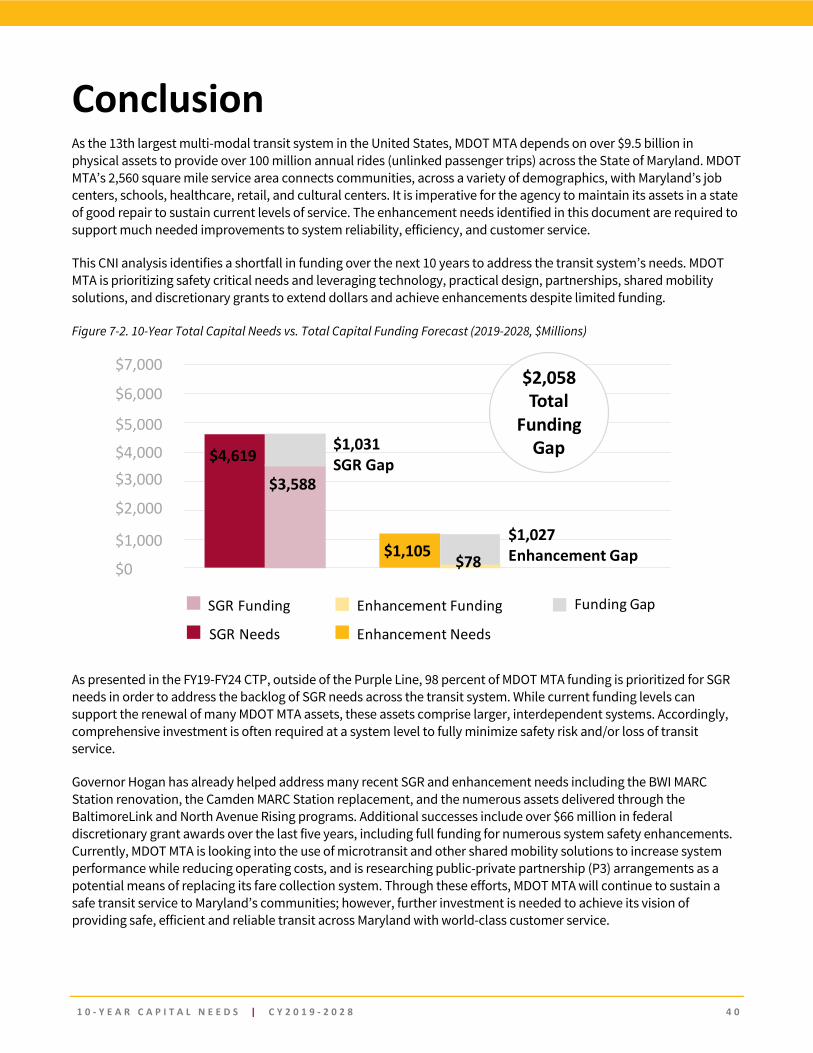
1 0 - Y E A R C A P I T A L N E E D S | C Y 2 0 1 9 - 2 0 2 8 4 0
Conclusion As the 13th largest multi-modal transit system in the United States, MDOT MTA depends on over $9.5 billion in physical assets to provide over 100 million annual rides (unlinked passenger trips) across the State of Maryland. MDOT MTA’s 2,560 square mile service area connects communities, across a variety of demographics, with Maryland’s job centers, schools, healthcare, retail, and cultural centers. It is imperative for the agency to maintain its assets in a state of good repair to sustain current levels of service. The enhancement needs identified in this document are required to support much needed improvements to system reliability, efficiency, and customer service.
This CNI analysis identifies a shortfall in funding over the next 10 years to address the transit system’s needs. MDOT MTA is prioritizing safety critical needs and leveraging technology, practical design, partnerships, shared mobility solutions, and discretionary grants to extend dollars and achieve enhancements despite limited funding.
Figure 7-2. 10-Year Total Capital Needs vs. Total Capital Funding Forecast (2019-2028, $Millions)
As presented in the FY19-FY24 CTP, outside of the Purple Line, 98 percent of MDOT MTA funding is prioritized for SGR needs in order to address the backlog of SGR needs across the transit system. While current funding levels can support the renewal of many MDOT MTA assets, these assets comprise larger, interdependent systems. Accordingly, comprehensive investment is often required at a system level to fully minimize safety risk and/or loss of transit service.
Governor Hogan has already helped address many recent SGR and enhancement needs including the BWI MARC Station renovation, the Camden MARC Station replacement, and the numerous assets delivered through the BaltimoreLink and North Avenue Rising programs. Additional successes include over $66 million in federal discretionary grant awards over the last five years, including full funding for numerous system safety enhancements. Currently, MDOT MTA is looking into the use of microtransit and other shared mobility solutions to increase system performance while reducing operating costs, and is researching public-private partnership (P3) arrangements as a potential means of replacing its fare collection system. Through these efforts, MDOT MTA will continue to sustain a safe transit service to Maryland’s communities; however, further investment is needed to achieve its vision of providing safe, efficient and reliable transit across Maryland with world-class customer service.
$6,000
$5,000
$4,000$3,000
$2,000
$1,000
$0
$7,000
$4,619
$1,105
$3,588
SGR Funding
SGR Needs
Enhancement Funding
Enhancement Needs
Funding Gap
$1,027 Enhancement Gap$78
$1,031 SGR Gap
$2,058Total
Funding Gap
1 0 - Y E A R C A P I T A L N E E D S | C Y 2 0 1 9 - 2 0 2 8 4 1
Appendix A: Acronyms
ADA – Americans with Disabilities Act
AVL – Automated Vehicle Locator
BWI – Baltimore / Washington International Thurgood Marshall Airport
CFP – Call for Projects
CIP – Capital Improvement Program
CNI – Capital Needs Inventory
CPMS – Construction Project Management System
CTP – Consolidated Transportation Program
EPA – Environmental Protection Agency
FMIS – Financial Management Information System
FTA – Federal Transit Administration
GPS – Global Positioning System
ITS – Intelligent Transportation Systems
IVR – Interactive Voice Response
LOTS – Locally Operated Transit Systems
MARC – Maryland Area Regional Commuter
MCDA – Multi-Criteria Decision Analysis
MCI – Motor Coach Industries
MDOT – Maryland Department of Transportation
MDT – Mobile Data Terminal
MTA – Maryland Transit Administration
NEC – Northeast Corridor
NTD – National Transit Database
P3 – Public-Private Partnership
RTA – Regional Transportation Agency of Central Maryland
RTIS – Real-Time Information System
SGR – State of Good Repair
SME – Subject Matter Expert
TAM – Transit Asset Management
TERM – Transit Economic Requirements Model
TICC – Transit Information and Contact Center
TIGER – Transportation Investments Generating Economic Recovery
TMDL – Total Maximum Daily Load
TSP – Transit Signal Priority
VRE – Virginia Railway Express
WMATA – Washington Metropolitan Area Transit Authority
YOE – Year of Expenditure

1 0 - Y E A R C A P I T A L N E E D S | C Y 2 0 1 9 - 2 0 2 8 4 2
Appendix B
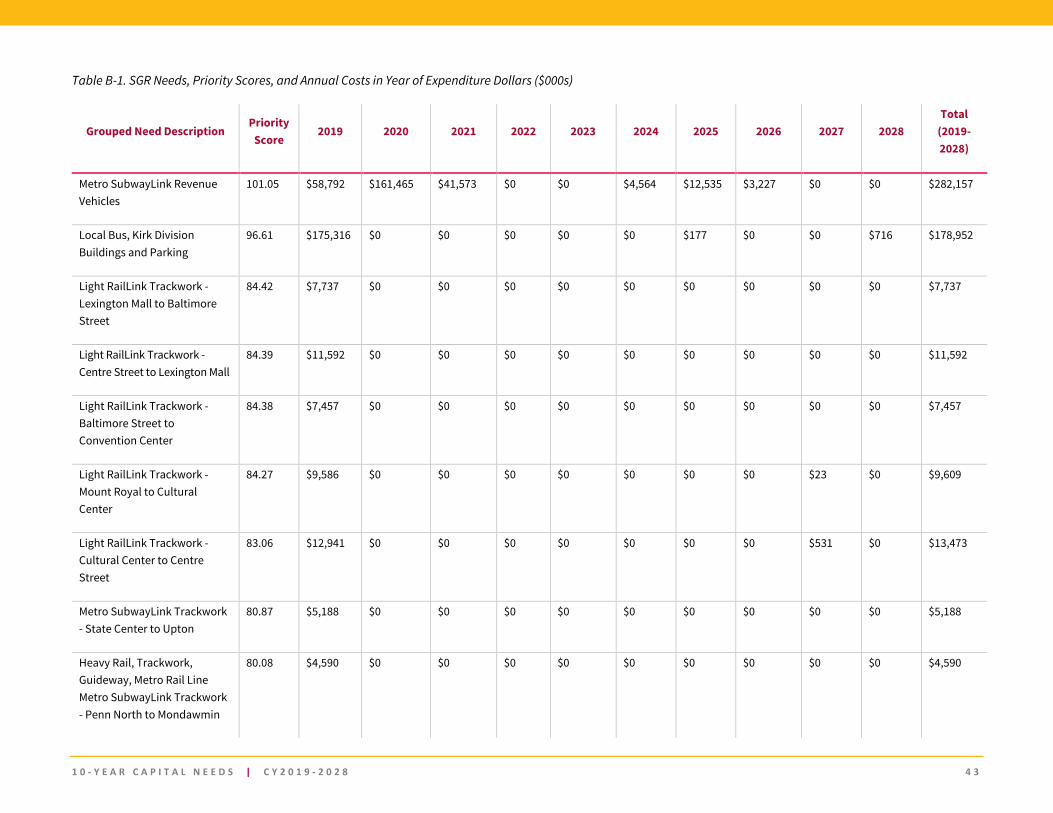
1 0 - Y E A R C A P I T A L N E E D S | C Y 2 0 1 9 - 2 0 2 8 4 3
Table B-1. SGR Needs, Priority Scores, and Annual Costs in Year of Expenditure Dollars ($000s)
Grouped Need Description Priority
Score 2019 2020 2021 2022 2023 2024 2025 2026 2027 2028
Total (2019-2028)
Metro SubwayLink Revenue Vehicles
101.05 $58,792 $161,465 $41,573 $0 $0 $4,564 $12,535 $3,227 $0 $0 $282,157
Local Bus, Kirk Division Buildings and Parking
96.61 $175,316 $0 $0 $0 $0 $0 $177 $0 $0 $716 $178,952
Light RailLink Trackwork - Lexington Mall to Baltimore Street
84.42 $7,737 $0 $0 $0 $0 $0 $0 $0 $0 $0 $7,737
Light RailLink Trackwork - Centre Street to Lexington Mall
84.39 $11,592 $0 $0 $0 $0 $0 $0 $0 $0 $0 $11,592
Light RailLink Trackwork - Baltimore Street to Convention Center
84.38 $7,457 $0 $0 $0 $0 $0 $0 $0 $0 $0 $7,457
Light RailLink Trackwork - Mount Royal to Cultural Center
84.27 $9,586 $0 $0 $0 $0 $0 $0 $0 $23 $0 $9,609
Light RailLink Trackwork - Cultural Center to Centre Street
83.06 $12,941 $0 $0 $0 $0 $0 $0 $0 $531 $0 $13,473
Metro SubwayLink Trackwork - State Center to Upton
80.87 $5,188 $0 $0 $0 $0 $0 $0 $0 $0 $0 $5,188
Heavy Rail, Trackwork, Guideway, Metro Rail Line Metro SubwayLink Trackwork - Penn North to Mondawmin
80.08 $4,590 $0 $0 $0 $0 $0 $0 $0 $0 $0 $4,590
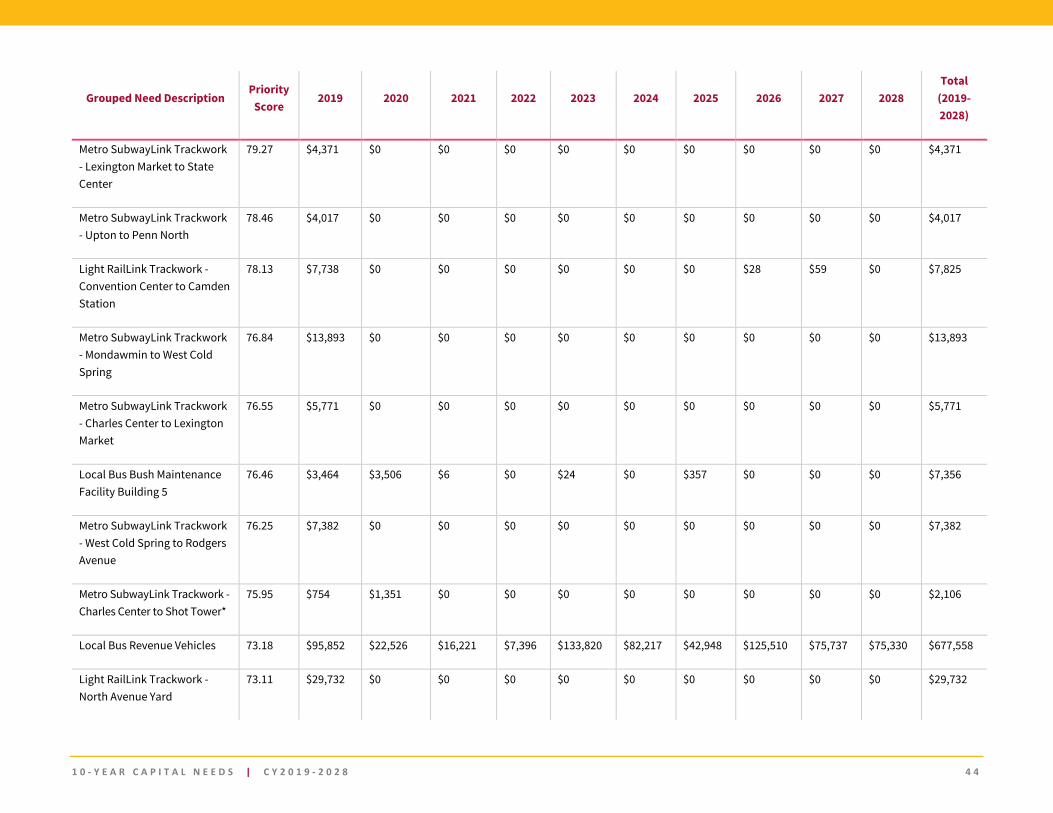
1 0 - Y E A R C A P I T A L N E E D S | C Y 2 0 1 9 - 2 0 2 8 4 4
Grouped Need Description Priority
Score 2019 2020 2021 2022 2023 2024 2025 2026 2027 2028
Total (2019-2028)
Metro SubwayLink Trackwork - Lexington Market to State Center
79.27 $4,371 $0 $0 $0 $0 $0 $0 $0 $0 $0 $4,371
Metro SubwayLink Trackwork - Upton to Penn North
78.46 $4,017 $0 $0 $0 $0 $0 $0 $0 $0 $0 $4,017
Light RailLink Trackwork - Convention Center to Camden Station
78.13 $7,738 $0 $0 $0 $0 $0 $0 $28 $59 $0 $7,825
Metro SubwayLink Trackwork - Mondawmin to West Cold Spring
76.84 $13,893 $0 $0 $0 $0 $0 $0 $0 $0 $0 $13,893
Metro SubwayLink Trackwork - Charles Center to Lexington Market
76.55 $5,771 $0 $0 $0 $0 $0 $0 $0 $0 $0 $5,771
Local Bus Bush Maintenance Facility Building 5
76.46 $3,464 $3,506 $6 $0 $24 $0 $357 $0 $0 $0 $7,356
Metro SubwayLink Trackwork - West Cold Spring to Rodgers Avenue
76.25 $7,382 $0 $0 $0 $0 $0 $0 $0 $0 $0 $7,382
Metro SubwayLink Trackwork - Charles Center to Shot Tower*
75.95 $754 $1,351 $0 $0 $0 $0 $0 $0 $0 $0 $2,106
Local Bus Revenue Vehicles 73.18 $95,852 $22,526 $16,221 $7,396 $133,820 $82,217 $42,948 $125,510 $75,737 $75,330 $677,558
Light RailLink Trackwork - North Avenue Yard
73.11 $29,732 $0 $0 $0 $0 $0 $0 $0 $0 $0 $29,732
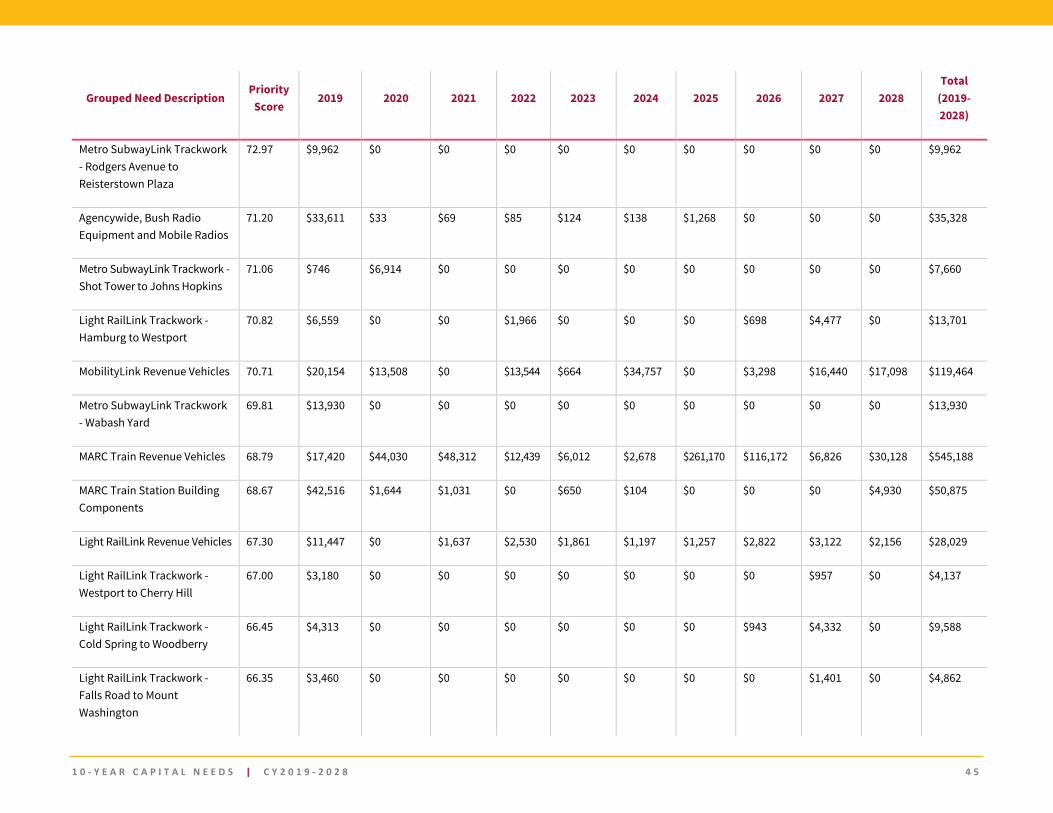
1 0 - Y E A R C A P I T A L N E E D S | C Y 2 0 1 9 - 2 0 2 8 4 5
Grouped Need Description Priority
Score 2019 2020 2021 2022 2023 2024 2025 2026 2027 2028
Total (2019-2028)
Metro SubwayLink Trackwork - Rodgers Avenue to Reisterstown Plaza
72.97 $9,962 $0 $0 $0 $0 $0 $0 $0 $0 $0 $9,962
Agencywide, Bush Radio Equipment and Mobile Radios
71.20 $33,611 $33 $69 $85 $124 $138 $1,268 $0 $0 $0 $35,328
Metro SubwayLink Trackwork - Shot Tower to Johns Hopkins
71.06 $746 $6,914 $0 $0 $0 $0 $0 $0 $0 $0 $7,660
Light RailLink Trackwork - Hamburg to Westport
70.82 $6,559 $0 $0 $1,966 $0 $0 $0 $698 $4,477 $0 $13,701
MobilityLink Revenue Vehicles 70.71 $20,154 $13,508 $0 $13,544 $664 $34,757 $0 $3,298 $16,440 $17,098 $119,464
Metro SubwayLink Trackwork - Wabash Yard
69.81 $13,930 $0 $0 $0 $0 $0 $0 $0 $0 $0 $13,930
MARC Train Revenue Vehicles 68.79 $17,420 $44,030 $48,312 $12,439 $6,012 $2,678 $261,170 $116,172 $6,826 $30,128 $545,188
MARC Train Station Building Components
68.67 $42,516 $1,644 $1,031 $0 $650 $104 $0 $0 $0 $4,930 $50,875
Light RailLink Revenue Vehicles 67.30 $11,447 $0 $1,637 $2,530 $1,861 $1,197 $1,257 $2,822 $3,122 $2,156 $28,029
Light RailLink Trackwork - Westport to Cherry Hill
67.00 $3,180 $0 $0 $0 $0 $0 $0 $0 $957 $0 $4,137
Light RailLink Trackwork - Cold Spring to Woodberry
66.45 $4,313 $0 $0 $0 $0 $0 $0 $943 $4,332 $0 $9,588
Light RailLink Trackwork - Falls Road to Mount Washington
66.35 $3,460 $0 $0 $0 $0 $0 $0 $0 $1,401 $0 $4,862
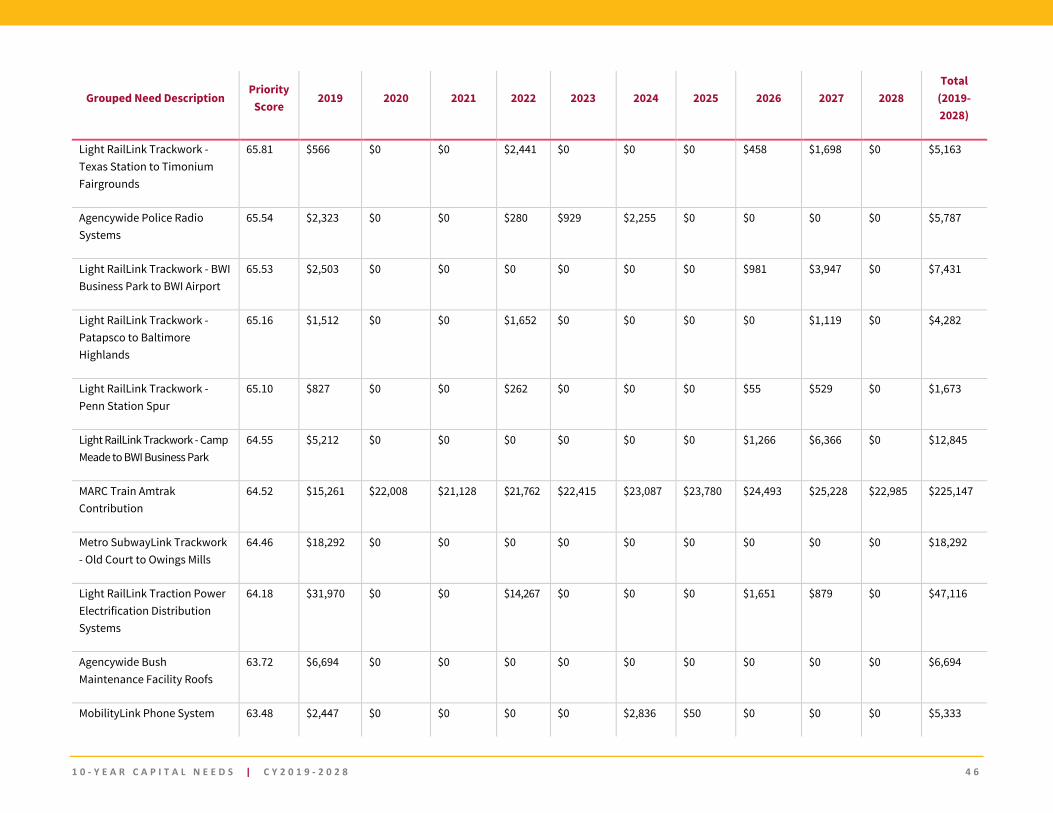
1 0 - Y E A R C A P I T A L N E E D S | C Y 2 0 1 9 - 2 0 2 8 4 6
Grouped Need Description Priority
Score 2019 2020 2021 2022 2023 2024 2025 2026 2027 2028
Total (2019-2028)
Light RailLink Trackwork - Texas Station to Timonium Fairgrounds
65.81 $566 $0 $0 $2,441 $0 $0 $0 $458 $1,698 $0 $5,163
Agencywide Police Radio Systems
65.54 $2,323 $0 $0 $280 $929 $2,255 $0 $0 $0 $0 $5,787
Light RailLink Trackwork - BWI Business Park to BWI Airport
65.53 $2,503 $0 $0 $0 $0 $0 $0 $981 $3,947 $0 $7,431
Light RailLink Trackwork - Patapsco to Baltimore Highlands
65.16 $1,512 $0 $0 $1,652 $0 $0 $0 $0 $1,119 $0 $4,282
Light RailLink Trackwork - Penn Station Spur
65.10 $827 $0 $0 $262 $0 $0 $0 $55 $529 $0 $1,673
Light RailLink Trackwork - Camp Meade to BWI Business Park
64.55 $5,212 $0 $0 $0 $0 $0 $0 $1,266 $6,366 $0 $12,845
MARC Train Amtrak Contribution
64.52 $15,261 $22,008 $21,128 $21,762 $22,415 $23,087 $23,780 $24,493 $25,228 $22,985 $225,147
Metro SubwayLink Trackwork - Old Court to Owings Mills
64.46 $18,292 $0 $0 $0 $0 $0 $0 $0 $0 $0 $18,292
Light RailLink Traction Power Electrification Distribution Systems
64.18 $31,970 $0 $0 $14,267 $0 $0 $0 $1,651 $879 $0 $47,116
Agencywide Bush Maintenance Facility Roofs
63.72 $6,694 $0 $0 $0 $0 $0 $0 $0 $0 $0 $6,694
MobilityLink Phone System 63.48 $2,447 $0 $0 $0 $0 $2,836 $50 $0 $0 $0 $5,333
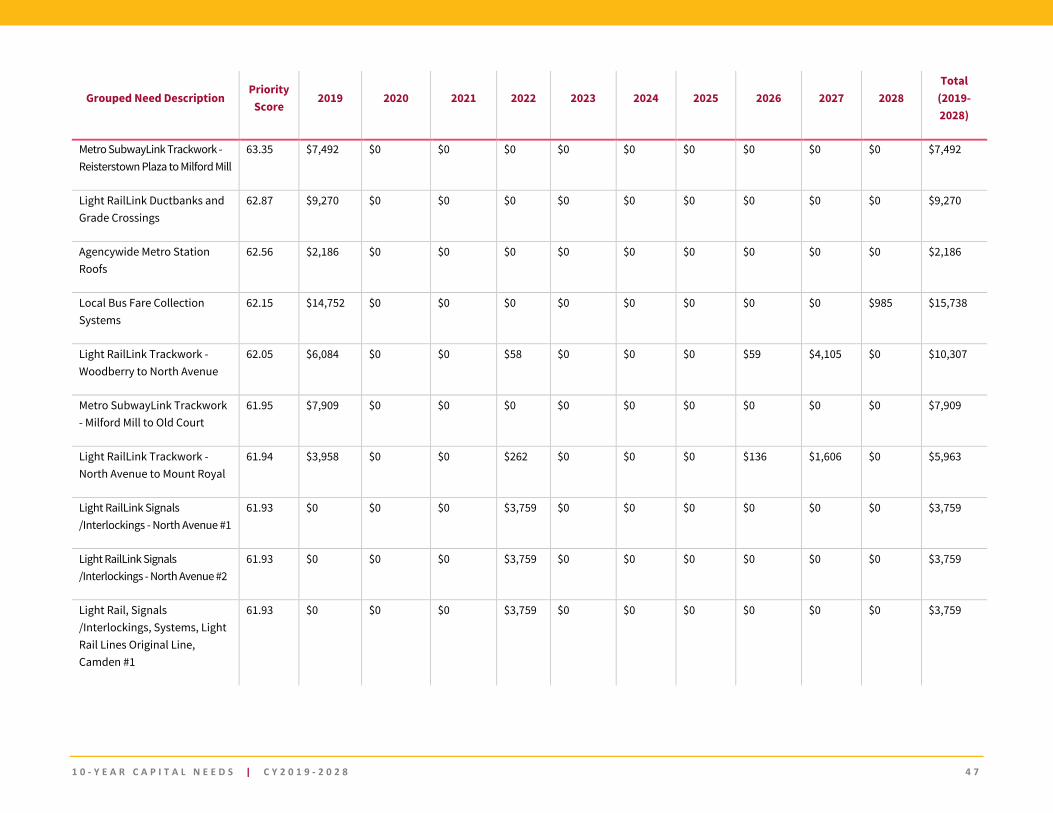
1 0 - Y E A R C A P I T A L N E E D S | C Y 2 0 1 9 - 2 0 2 8 4 7
Grouped Need Description Priority
Score 2019 2020 2021 2022 2023 2024 2025 2026 2027 2028
Total (2019-2028)
Metro SubwayLink Trackwork - Reisterstown Plaza to Milford Mill
63.35 $7,492 $0 $0 $0 $0 $0 $0 $0 $0 $0 $7,492
Light RailLink Ductbanks and Grade Crossings
62.87 $9,270 $0 $0 $0 $0 $0 $0 $0 $0 $0 $9,270
Agencywide Metro Station Roofs
62.56 $2,186 $0 $0 $0 $0 $0 $0 $0 $0 $0 $2,186
Local Bus Fare Collection Systems
62.15 $14,752 $0 $0 $0 $0 $0 $0 $0 $0 $985 $15,738
Light RailLink Trackwork - Woodberry to North Avenue
62.05 $6,084 $0 $0 $58 $0 $0 $0 $59 $4,105 $0 $10,307
Metro SubwayLink Trackwork - Milford Mill to Old Court
61.95 $7,909 $0 $0 $0 $0 $0 $0 $0 $0 $0 $7,909
Light RailLink Trackwork - North Avenue to Mount Royal
61.94 $3,958 $0 $0 $262 $0 $0 $0 $136 $1,606 $0 $5,963
Light RailLink Signals /Interlockings - North Avenue #1
61.93 $0 $0 $0 $3,759 $0 $0 $0 $0 $0 $0 $3,759
Light RailLink Signals /Interlockings - North Avenue #2
61.93 $0 $0 $0 $3,759 $0 $0 $0 $0 $0 $0 $3,759
Light Rail, Signals /Interlockings, Systems, Light Rail Lines Original Line, Camden #1
61.93 $0 $0 $0 $3,759 $0 $0 $0 $0 $0 $0 $3,759
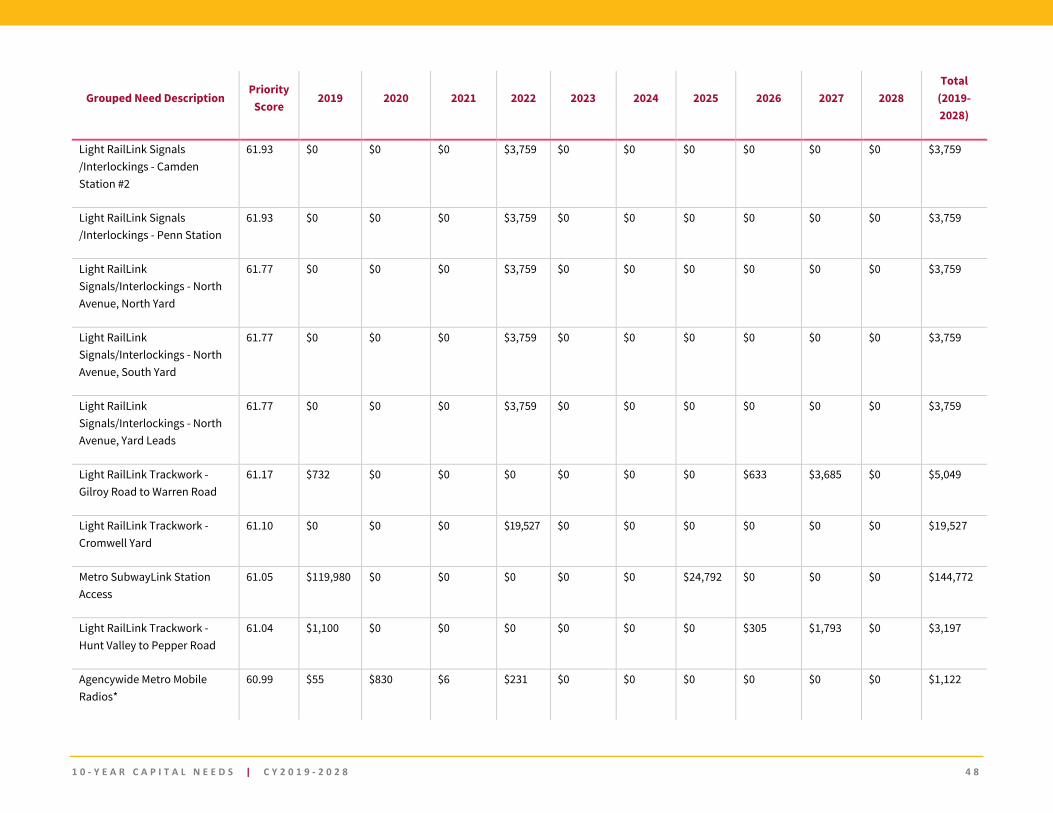
1 0 - Y E A R C A P I T A L N E E D S | C Y 2 0 1 9 - 2 0 2 8 4 8
Grouped Need Description Priority
Score 2019 2020 2021 2022 2023 2024 2025 2026 2027 2028
Total (2019-2028)
Light RailLink Signals /Interlockings - Camden Station #2
61.93 $0 $0 $0 $3,759 $0 $0 $0 $0 $0 $0 $3,759
Light RailLink Signals /Interlockings - Penn Station
61.93 $0 $0 $0 $3,759 $0 $0 $0 $0 $0 $0 $3,759
Light RailLink Signals/Interlockings - North Avenue, North Yard
61.77 $0 $0 $0 $3,759 $0 $0 $0 $0 $0 $0 $3,759
Light RailLink Signals/Interlockings - North Avenue, South Yard
61.77 $0 $0 $0 $3,759 $0 $0 $0 $0 $0 $0 $3,759
Light RailLink Signals/Interlockings - North Avenue, Yard Leads
61.77 $0 $0 $0 $3,759 $0 $0 $0 $0 $0 $0 $3,759
Light RailLink Trackwork - Gilroy Road to Warren Road
61.17 $732 $0 $0 $0 $0 $0 $0 $633 $3,685 $0 $5,049
Light RailLink Trackwork - Cromwell Yard
61.10 $0 $0 $0 $19,527 $0 $0 $0 $0 $0 $0 $19,527
Metro SubwayLink Station Access
61.05 $119,980 $0 $0 $0 $0 $0 $24,792 $0 $0 $0 $144,772
Light RailLink Trackwork - Hunt Valley to Pepper Road
61.04 $1,100 $0 $0 $0 $0 $0 $0 $305 $1,793 $0 $3,197
Agencywide Metro Mobile Radios*
60.99 $55 $830 $6 $231 $0 $0 $0 $0 $0 $0 $1,122
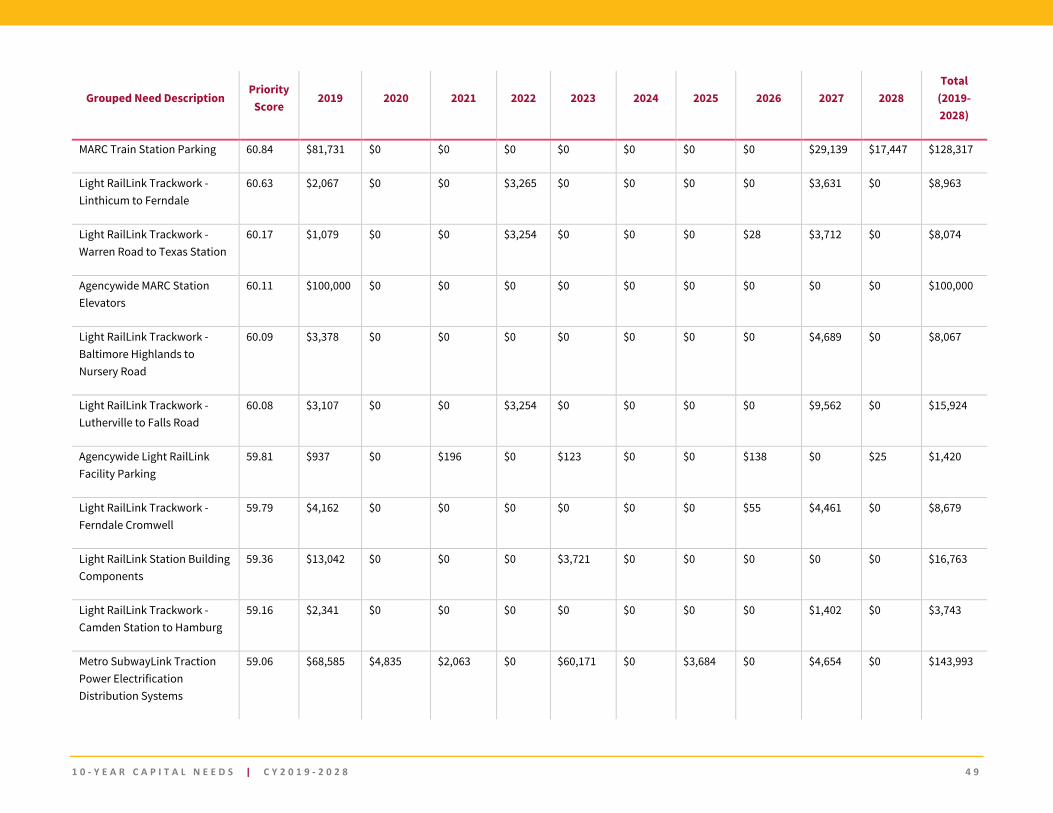
1 0 - Y E A R C A P I T A L N E E D S | C Y 2 0 1 9 - 2 0 2 8 4 9
Grouped Need Description Priority
Score 2019 2020 2021 2022 2023 2024 2025 2026 2027 2028
Total (2019-2028)
MARC Train Station Parking 60.84 $81,731 $0 $0 $0 $0 $0 $0 $0 $29,139 $17,447 $128,317
Light RailLink Trackwork - Linthicum to Ferndale
60.63 $2,067 $0 $0 $3,265 $0 $0 $0 $0 $3,631 $0 $8,963
Light RailLink Trackwork - Warren Road to Texas Station
60.17 $1,079 $0 $0 $3,254 $0 $0 $0 $28 $3,712 $0 $8,074
Agencywide MARC Station Elevators
60.11 $100,000 $0 $0 $0 $0 $0 $0 $0 $0 $0 $100,000
Light RailLink Trackwork - Baltimore Highlands to Nursery Road
60.09 $3,378 $0 $0 $0 $0 $0 $0 $0 $4,689 $0 $8,067
Light RailLink Trackwork - Lutherville to Falls Road
60.08 $3,107 $0 $0 $3,254 $0 $0 $0 $0 $9,562 $0 $15,924
Agencywide Light RailLink Facility Parking
59.81 $937 $0 $196 $0 $123 $0 $0 $138 $0 $25 $1,420
Light RailLink Trackwork - Ferndale Cromwell
59.79 $4,162 $0 $0 $0 $0 $0 $0 $55 $4,461 $0 $8,679
Light RailLink Station Building Components
59.36 $13,042 $0 $0 $0 $3,721 $0 $0 $0 $0 $0 $16,763
Light RailLink Trackwork - Camden Station to Hamburg
59.16 $2,341 $0 $0 $0 $0 $0 $0 $0 $1,402 $0 $3,743
Metro SubwayLink Traction Power Electrification Distribution Systems
59.06 $68,585 $4,835 $2,063 $0 $60,171 $0 $3,684 $0 $4,654 $0 $143,993
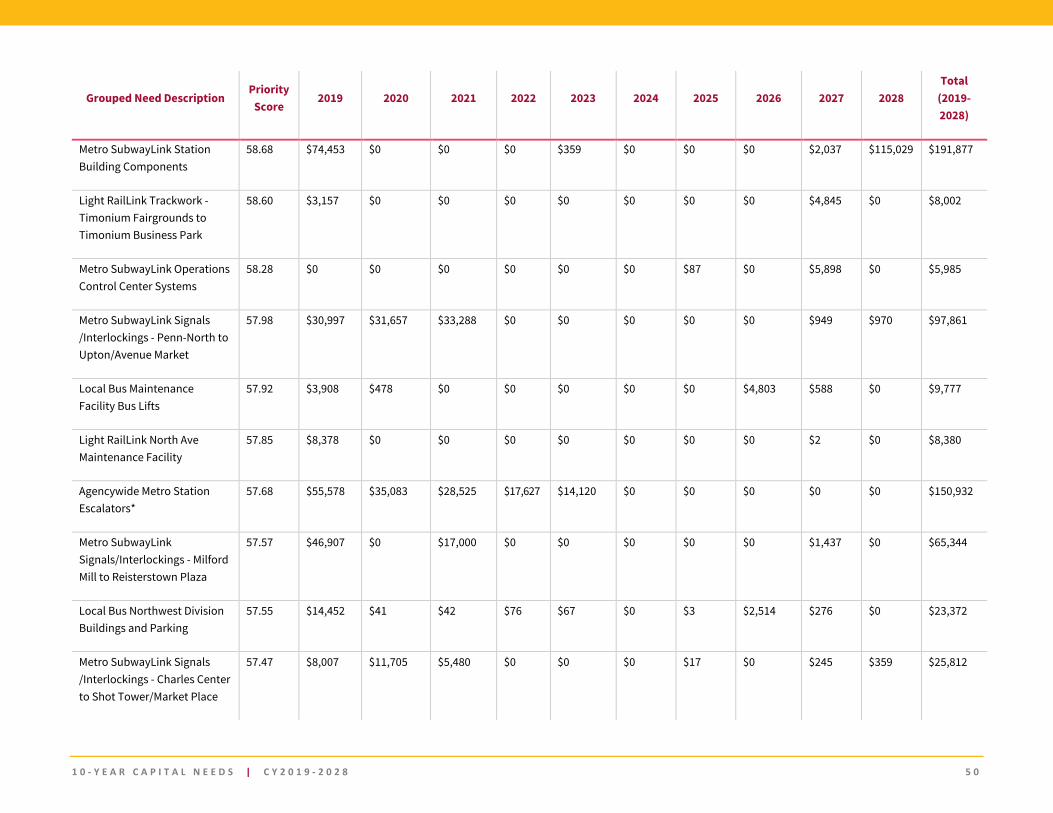
1 0 - Y E A R C A P I T A L N E E D S | C Y 2 0 1 9 - 2 0 2 8 5 0
Grouped Need Description Priority
Score 2019 2020 2021 2022 2023 2024 2025 2026 2027 2028
Total (2019-2028)
Metro SubwayLink Station Building Components
58.68 $74,453 $0 $0 $0 $359 $0 $0 $0 $2,037 $115,029 $191,877
Light RailLink Trackwork - Timonium Fairgrounds to Timonium Business Park
58.60 $3,157 $0 $0 $0 $0 $0 $0 $0 $4,845 $0 $8,002
Metro SubwayLink Operations Control Center Systems
58.28 $0 $0 $0 $0 $0 $0 $87 $0 $5,898 $0 $5,985
Metro SubwayLink Signals /Interlockings - Penn-North to Upton/Avenue Market
57.98 $30,997 $31,657 $33,288 $0 $0 $0 $0 $0 $949 $970 $97,861
Local Bus Maintenance Facility Bus Lifts
57.92 $3,908 $478 $0 $0 $0 $0 $0 $4,803 $588 $0 $9,777
Light RailLink North Ave Maintenance Facility
57.85 $8,378 $0 $0 $0 $0 $0 $0 $0 $2 $0 $8,380
Agencywide Metro Station Escalators*
57.68 $55,578 $35,083 $28,525 $17,627 $14,120 $0 $0 $0 $0 $0 $150,932
Metro SubwayLink Signals/Interlockings - Milford Mill to Reisterstown Plaza
57.57 $46,907 $0 $17,000 $0 $0 $0 $0 $0 $1,437 $0 $65,344
Local Bus Northwest Division Buildings and Parking
57.55 $14,452 $41 $42 $76 $67 $0 $3 $2,514 $276 $0 $23,372
Metro SubwayLink Signals /Interlockings - Charles Center to Shot Tower/Market Place
57.47 $8,007 $11,705 $5,480 $0 $0 $0 $17 $0 $245 $359 $25,812
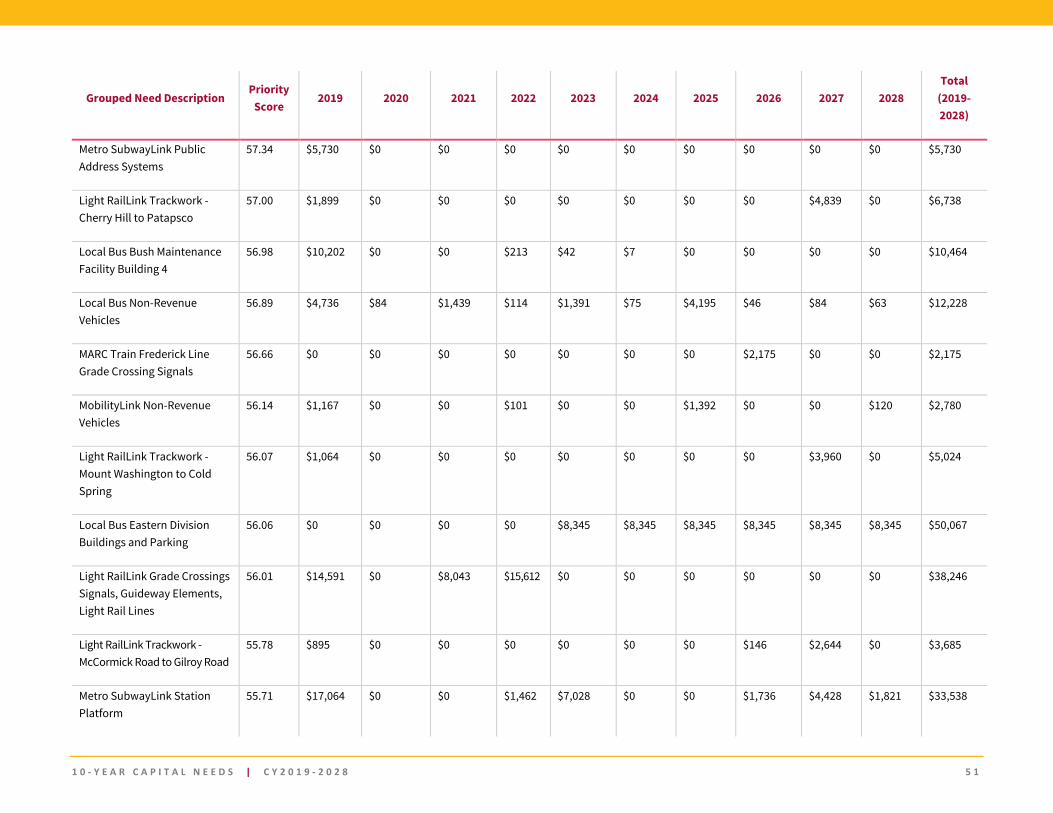
1 0 - Y E A R C A P I T A L N E E D S | C Y 2 0 1 9 - 2 0 2 8 5 1
Grouped Need Description Priority
Score 2019 2020 2021 2022 2023 2024 2025 2026 2027 2028
Total (2019-2028)
Metro SubwayLink Public Address Systems
57.34 $5,730 $0 $0 $0 $0 $0 $0 $0 $0 $0 $5,730
Light RailLink Trackwork - Cherry Hill to Patapsco
57.00 $1,899 $0 $0 $0 $0 $0 $0 $0 $4,839 $0 $6,738
Local Bus Bush Maintenance Facility Building 4
56.98 $10,202 $0 $0 $213 $42 $7 $0 $0 $0 $0 $10,464
Local Bus Non-Revenue Vehicles
56.89 $4,736 $84 $1,439 $114 $1,391 $75 $4,195 $46 $84 $63 $12,228
MARC Train Frederick Line Grade Crossing Signals
56.66 $0 $0 $0 $0 $0 $0 $0 $2,175 $0 $0 $2,175
MobilityLink Non-Revenue Vehicles
56.14 $1,167 $0 $0 $101 $0 $0 $1,392 $0 $0 $120 $2,780
Light RailLink Trackwork - Mount Washington to Cold Spring
56.07 $1,064 $0 $0 $0 $0 $0 $0 $0 $3,960 $0 $5,024
Local Bus Eastern Division Buildings and Parking
56.06 $0 $0 $0 $0 $8,345 $8,345 $8,345 $8,345 $8,345 $8,345 $50,067
Light RailLink Grade Crossings Signals, Guideway Elements, Light Rail Lines
56.01 $14,591 $0 $8,043 $15,612 $0 $0 $0 $0 $0 $0 $38,246
Light RailLink Trackwork - McCormick Road to Gilroy Road
55.78 $895 $0 $0 $0 $0 $0 $0 $146 $2,644 $0 $3,685
Metro SubwayLink Station Platform
55.71 $17,064 $0 $0 $1,462 $7,028 $0 $0 $1,736 $4,428 $1,821 $33,538
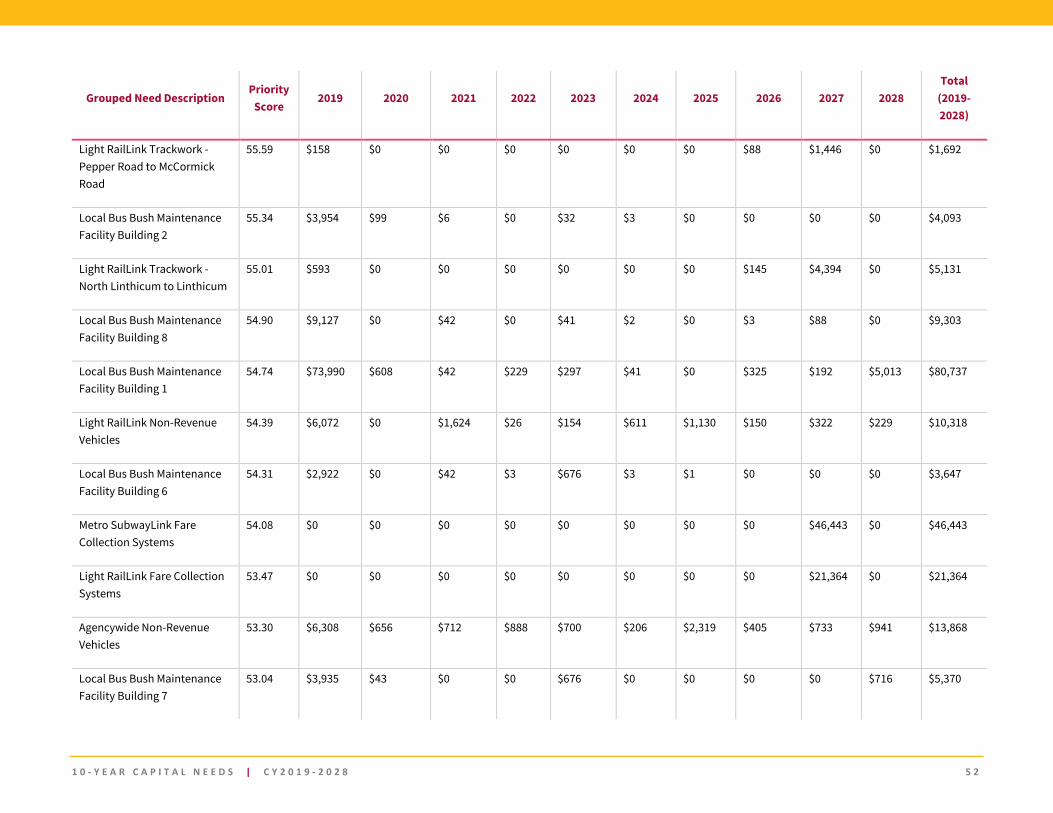
1 0 - Y E A R C A P I T A L N E E D S | C Y 2 0 1 9 - 2 0 2 8 5 2
Grouped Need Description Priority
Score 2019 2020 2021 2022 2023 2024 2025 2026 2027 2028
Total (2019-2028)
Light RailLink Trackwork - Pepper Road to McCormick Road
55.59 $158 $0 $0 $0 $0 $0 $0 $88 $1,446 $0 $1,692
Local Bus Bush Maintenance Facility Building 2
55.34 $3,954 $99 $6 $0 $32 $3 $0 $0 $0 $0 $4,093
Light RailLink Trackwork - North Linthicum to Linthicum
55.01 $593 $0 $0 $0 $0 $0 $0 $145 $4,394 $0 $5,131
Local Bus Bush Maintenance Facility Building 8
54.90 $9,127 $0 $42 $0 $41 $2 $0 $3 $88 $0 $9,303
Local Bus Bush Maintenance Facility Building 1
54.74 $73,990 $608 $42 $229 $297 $41 $0 $325 $192 $5,013 $80,737
Light RailLink Non-Revenue Vehicles
54.39 $6,072 $0 $1,624 $26 $154 $611 $1,130 $150 $322 $229 $10,318
Local Bus Bush Maintenance Facility Building 6
54.31 $2,922 $0 $42 $3 $676 $3 $1 $0 $0 $0 $3,647
Metro SubwayLink Fare Collection Systems
54.08 $0 $0 $0 $0 $0 $0 $0 $0 $46,443 $0 $46,443
Light RailLink Fare Collection Systems
53.47 $0 $0 $0 $0 $0 $0 $0 $0 $21,364 $0 $21,364
Agencywide Non-Revenue Vehicles
53.30 $6,308 $656 $712 $888 $700 $206 $2,319 $405 $733 $941 $13,868
Local Bus Bush Maintenance Facility Building 7
53.04 $3,935 $43 $0 $0 $676 $0 $0 $0 $0 $716 $5,370
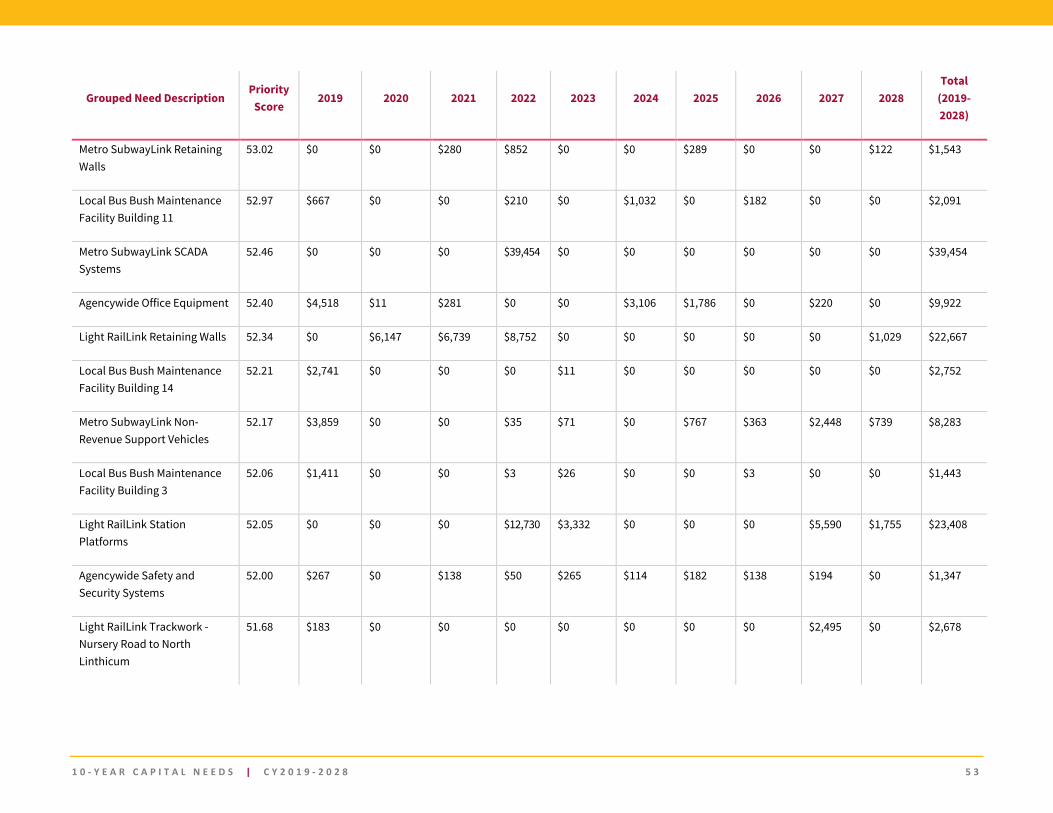
1 0 - Y E A R C A P I T A L N E E D S | C Y 2 0 1 9 - 2 0 2 8 5 3
Grouped Need Description Priority
Score 2019 2020 2021 2022 2023 2024 2025 2026 2027 2028
Total (2019-2028)
Metro SubwayLink Retaining Walls
53.02 $0 $0 $280 $852 $0 $0 $289 $0 $0 $122 $1,543
Local Bus Bush Maintenance Facility Building 11
52.97 $667 $0 $0 $210 $0 $1,032 $0 $182 $0 $0 $2,091
Metro SubwayLink SCADA Systems
52.46 $0 $0 $0 $39,454 $0 $0 $0 $0 $0 $0 $39,454
Agencywide Office Equipment 52.40 $4,518 $11 $281 $0 $0 $3,106 $1,786 $0 $220 $0 $9,922
Light RailLink Retaining Walls 52.34 $0 $6,147 $6,739 $8,752 $0 $0 $0 $0 $0 $1,029 $22,667
Local Bus Bush Maintenance Facility Building 14
52.21 $2,741 $0 $0 $0 $11 $0 $0 $0 $0 $0 $2,752
Metro SubwayLink Non-Revenue Support Vehicles
52.17 $3,859 $0 $0 $35 $71 $0 $767 $363 $2,448 $739 $8,283
Local Bus Bush Maintenance Facility Building 3
52.06 $1,411 $0 $0 $3 $26 $0 $0 $3 $0 $0 $1,443
Light RailLink Station Platforms
52.05 $0 $0 $0 $12,730 $3,332 $0 $0 $0 $5,590 $1,755 $23,408
Agencywide Safety and Security Systems
52.00 $267 $0 $138 $50 $265 $114 $182 $138 $194 $0 $1,347
Light RailLink Trackwork - Nursery Road to North Linthicum
51.68 $183 $0 $0 $0 $0 $0 $0 $0 $2,495 $0 $2,678
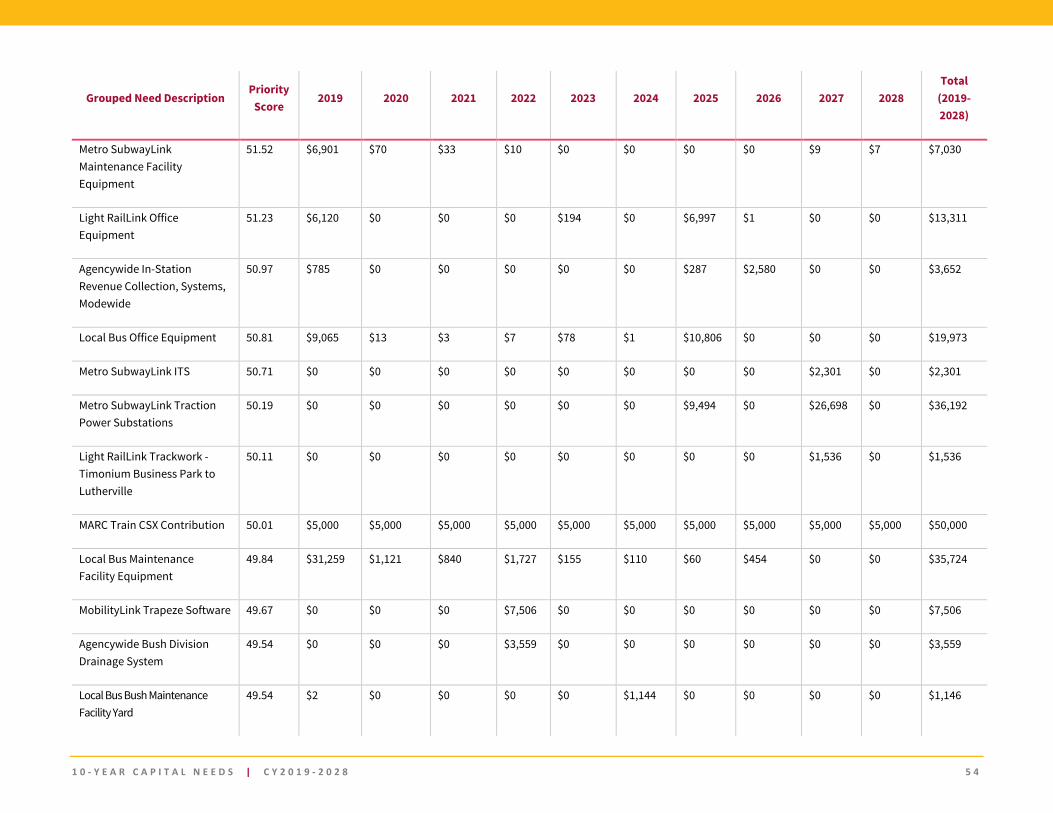
1 0 - Y E A R C A P I T A L N E E D S | C Y 2 0 1 9 - 2 0 2 8 5 4
Grouped Need Description Priority
Score 2019 2020 2021 2022 2023 2024 2025 2026 2027 2028
Total (2019-2028)
Metro SubwayLink Maintenance Facility Equipment
51.52 $6,901 $70 $33 $10 $0 $0 $0 $0 $9 $7 $7,030
Light RailLink Office Equipment
51.23 $6,120 $0 $0 $0 $194 $0 $6,997 $1 $0 $0 $13,311
Agencywide In-Station Revenue Collection, Systems, Modewide
50.97 $785
$0 $0 $0 $0 $0 $287 $2,580 $0 $0 $3,652
Local Bus Office Equipment 50.81 $9,065 $13 $3 $7 $78 $1 $10,806 $0 $0 $0 $19,973
Metro SubwayLink ITS 50.71 $0 $0 $0 $0 $0 $0 $0 $0 $2,301 $0 $2,301
Metro SubwayLink Traction Power Substations
50.19 $0 $0 $0 $0 $0 $0 $9,494 $0 $26,698 $0 $36,192
Light RailLink Trackwork - Timonium Business Park to Lutherville
50.11 $0 $0 $0 $0 $0 $0 $0 $0 $1,536 $0 $1,536
MARC Train CSX Contribution 50.01 $5,000 $5,000 $5,000 $5,000 $5,000 $5,000 $5,000 $5,000 $5,000 $5,000 $50,000
Local Bus Maintenance Facility Equipment
49.84 $31,259 $1,121 $840 $1,727 $155 $110 $60 $454 $0 $0 $35,724
MobilityLink Trapeze Software 49.67 $0 $0 $0 $7,506 $0 $0 $0 $0 $0 $0 $7,506
Agencywide Bush Division Drainage System
49.54 $0 $0 $0 $3,559 $0 $0 $0 $0 $0 $0 $3,559
Local Bus Bush Maintenance Facility Yard
49.54 $2 $0 $0 $0 $0 $1,144 $0 $0 $0 $0 $1,146
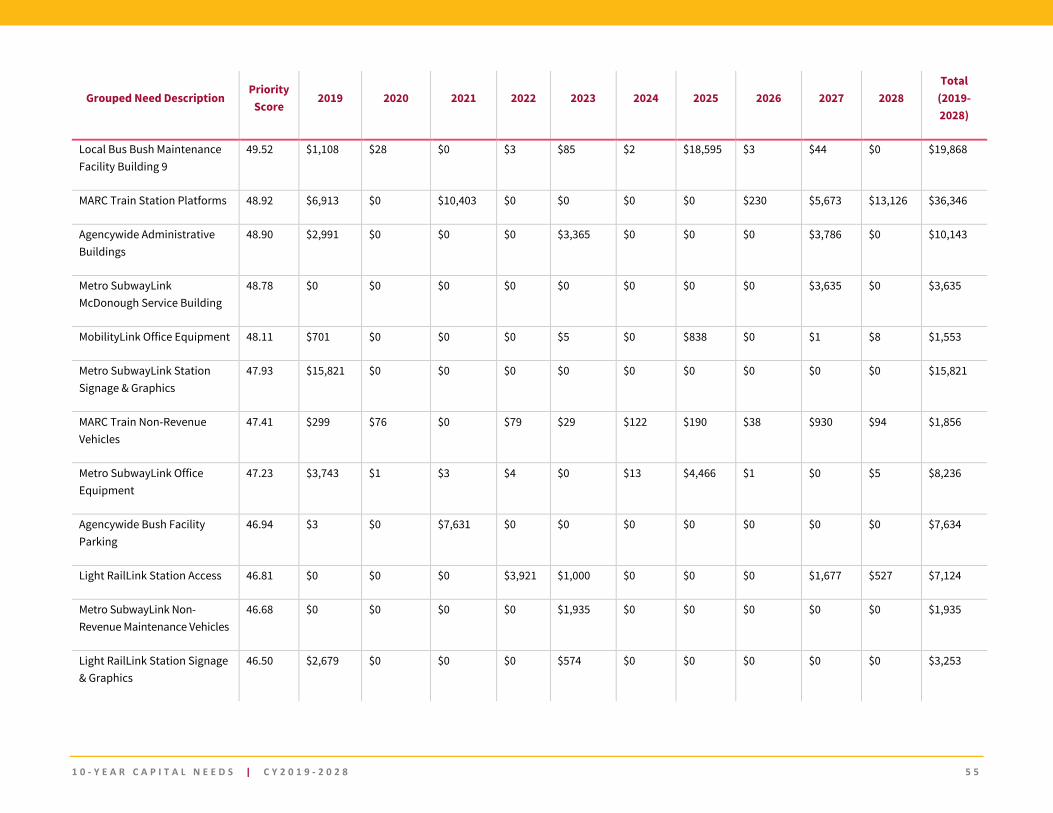
1 0 - Y E A R C A P I T A L N E E D S | C Y 2 0 1 9 - 2 0 2 8 5 5
Grouped Need Description Priority
Score 2019 2020 2021 2022 2023 2024 2025 2026 2027 2028
Total (2019-2028)
Local Bus Bush Maintenance Facility Building 9
49.52 $1,108 $28 $0 $3 $85 $2 $18,595 $3 $44 $0 $19,868
MARC Train Station Platforms 48.92 $6,913 $0 $10,403 $0 $0 $0 $0 $230 $5,673 $13,126 $36,346
Agencywide Administrative Buildings
48.90 $2,991 $0 $0 $0 $3,365 $0 $0 $0 $3,786 $0 $10,143
Metro SubwayLink McDonough Service Building
48.78 $0 $0 $0 $0 $0 $0 $0 $0 $3,635 $0 $3,635
MobilityLink Office Equipment 48.11 $701 $0 $0 $0 $5 $0 $838 $0 $1 $8 $1,553
Metro SubwayLink Station Signage & Graphics
47.93 $15,821 $0 $0 $0 $0 $0 $0 $0 $0 $0 $15,821
MARC Train Non-Revenue Vehicles
47.41 $299 $76 $0 $79 $29 $122 $190 $38 $930 $94 $1,856
Metro SubwayLink Office Equipment
47.23 $3,743 $1 $3 $4 $0 $13 $4,466 $1 $0 $5 $8,236
Agencywide Bush Facility Parking
46.94 $3 $0 $7,631 $0 $0 $0 $0 $0 $0 $0 $7,634
Light RailLink Station Access 46.81 $0 $0 $0 $3,921 $1,000 $0 $0 $0 $1,677 $527 $7,124
Metro SubwayLink Non-Revenue Maintenance Vehicles
46.68 $0 $0 $0 $0 $1,935 $0 $0 $0 $0 $0 $1,935
Light RailLink Station Signage & Graphics
46.50 $2,679 $0 $0 $0 $574 $0 $0 $0 $0 $0 $3,253
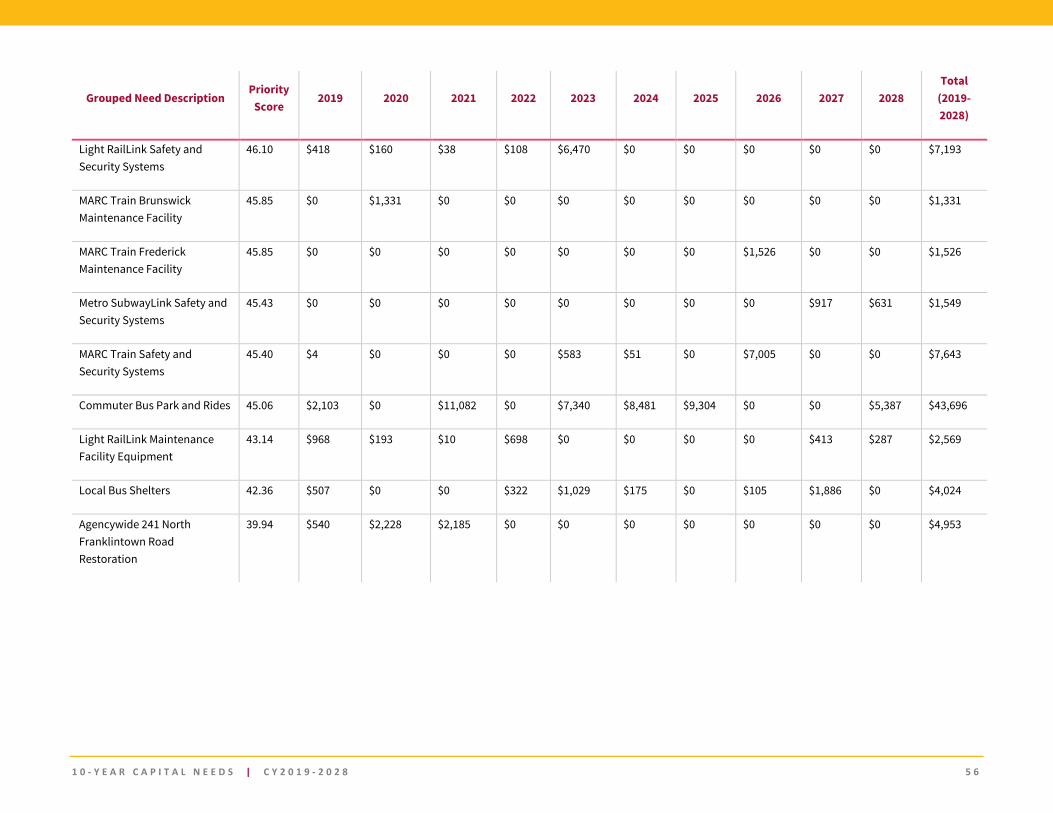
1 0 - Y E A R C A P I T A L N E E D S | C Y 2 0 1 9 - 2 0 2 8 5 6
Grouped Need Description Priority
Score 2019 2020 2021 2022 2023 2024 2025 2026 2027 2028
Total (2019-2028)
Light RailLink Safety and Security Systems
46.10 $418 $160 $38 $108 $6,470 $0 $0 $0 $0 $0 $7,193
MARC Train Brunswick Maintenance Facility
45.85 $0 $1,331 $0 $0 $0 $0 $0 $0 $0 $0 $1,331
MARC Train Frederick Maintenance Facility
45.85 $0 $0 $0 $0 $0 $0 $0 $1,526 $0 $0 $1,526
Metro SubwayLink Safety and Security Systems
45.43 $0 $0 $0 $0 $0 $0 $0 $0 $917 $631 $1,549
MARC Train Safety and Security Systems
45.40 $4 $0 $0 $0 $583 $51 $0 $7,005 $0 $0 $7,643
Commuter Bus Park and Rides 45.06 $2,103 $0 $11,082 $0 $7,340 $8,481 $9,304 $0 $0 $5,387 $43,696
Light RailLink Maintenance Facility Equipment
43.14 $968 $193 $10 $698 $0 $0 $0 $0 $413 $287 $2,569
Local Bus Shelters 42.36 $507 $0 $0 $322 $1,029 $175 $0 $105 $1,886 $0 $4,024
Agencywide 241 North Franklintown Road Restoration
39.94 $540 $2,228 $2,185 $0 $0 $0 $0 $0 $0 $0 $4,953
1 0 - Y E A R C A P I T A L N E E D S | C Y 2 0 1 9 - 2 0 2 8 5 7