mdot us-23 plans environmental assessment update, full document, january 2015
TRANSCRIPT
US-23 Improvements
M-14/US-23 West Interchange to Silver Lake Road Washtenaw and Livingston Counties JN 123214 CS 81075, 47013 January 2015
ENVIRONMENTAL ASSESSMENT


i
Preface
The National Environmental Policy Act (NEPA) of 1969 requires that social, economic, and natural environmental impacts of any proposed action of the federal government be analyzed for decision-making and public information purposes. There are three classes of action. Class I Actions are those that may significantly affect the environment and require the preparation of an Environmental Impact Statement (EIS). Class II Actions (or "categorical exclusions") are those that do not individually or cumulatively have a significant effect on the environment, and do not require the preparation of an EIS or an Environmental Assessment (EA). Class III Actions are those in which the significance of impacts is not clearly established. Class III Actions require the preparation of an EA to determine the significance of impacts and the appropriate environmental document to be prepared -- either an EIS or a Finding of No Significant Impact (FONSI).
This document is an Environmental Assessment for the proposed US-23 Improvements from the west US-23/M-14 Interchange north to the Silver Lake Road Interchange in Washtenaw and Livingston Counties. It describes and analyzes alternatives, potential impacts, and the measures proposed to minimize harm to the project area. It will be distributed to the public and to various federal, state, and local agencies for review and comment. A formal public hearing on this project will be held. If review and comment by the public and interested agencies support the determination of “no significant impact”, this EA will be forwarded to the Federal Highway Administration (FHWA) with a recommendation that a FONSI be issued. If it is determined that the preferred alternative will have significant impacts that cannot be mitigated, the preparation of an EIS will be required.
This document was prepared by the Michigan Department of Transportation (MDOT), in cooperation with FHWA. The study team includes representatives from the following areas within MDOT: Design, Project Planning, Real Estate, Construction and Technology, Traffic and Safety, Transportation Service Centers, and Region offices. Information contained in this EA was also furnished by other federal and state agencies, local units of government, public interest groups, and individual citizens.

ii
iii
Table of Contents PREFACE ...................................................................................................................... i
1.0 – DESCRIPTION OF THE PROJECT AREA .......................................................... 1
1.1 Project Location ..................................................................................................................... 1
1.2 Existing Conditions ................................................................................................................ 1
2.0 – PURPOSE AND NEED ........................................................................................ 3
3.0 – ALTERNATIVES .................................................................................................. 5
3.1 Feasibility Study .................................................................................................................... 5
3.1.1 Conclusion .................................................................................................................... 6
3.2 North-South Commuter Rail (WALLY) ................................................................................ 7
3.3 Alternatives’ Summary .......................................................................................................... 8
3.3.1 “No Build” .................................................................................................................... 8
3.3.2 Build Alternatives ......................................................................................................... 8
3.3.2.1 Transportation Systems Management (TSM) ..................................................... 8
3.3.2.2 Ramp Metering ................................................................................................... 9
3.3.2.3 Active Traffic Management (ATM) Preferred Alternative ................................. 9
3.3.2.4 ATM with High Occupancy Vehicles ............................................................... 10
4.0 – TRAFFIC ............................................................................................................ 13
4.1 Comparative Traffic Analysis .............................................................................................. 13
4.2 Peak Hour Congestion ......................................................................................................... 13
4.3 Ramp Operations ................................................................................................................. 14
4.4 Safety ................................................................................................................................... 15
4.5 Incident Management ........................................................................................................... 16
4.6 Interchange Operations (Intersection Analysis) ................................................................... 16
4.6.1 US-23 and North Territorial Rd. Interchange ............................................................. 17
4.6.2 US-23 and 6 Mile Rd. Interchange ............................................................................. 17
4.6.3 US-23 and 8 Mile Rd. Interchange ............................................................................. 17
4.6.4 Other US-23 Interchanges .......................................................................................... 19
4.7 Summary ............................................................................................................................... 20
iv
5.0 – PREFERRED ALTERNATIVE FEATURES ........................................................ 21
5.1 Active Traffic Management (ATM) .................................................................................... 21
5.2 Bridge Replacements at 8 Mile, 6Mile and N. Territorial Roads ........................................ 25
5.2.1 N. Territorial Road ..................................................................................................... 26
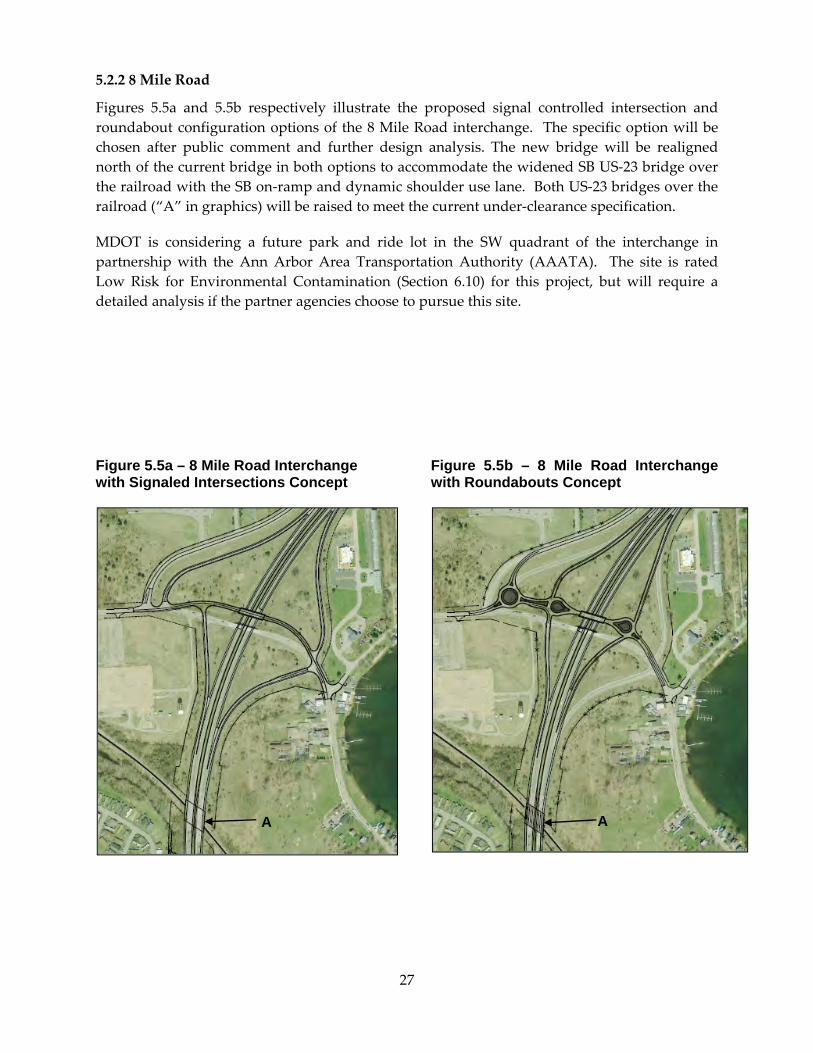
5.2.2 8 Mile Road ................................................................................................................ 27
5.3 Crash Investigation Sites (CIS) ............................................................................................ 28
5.4 Southbound (SB) US-23/M-14 Mitigation ............................................................. 29
6.0 – AFFECTED ENVIRONMENT AND POTENTIAL IMPACTS ............................... 33
6.1 Land Use Impacts .................................................................................................... 37
6.2 Right-of-Way and Relocation Impacts .................................................................... 38
6.3 Farmland and Agriculture Impacts .......................................................................... 43
6.4 Social and Economic Impacts .................................................................................. 43
6.4.1 Social .......................................................................................................................... 43
6.4.2 Economics .................................................................................................................. 44
6.5 Environmental Justice .............................................................................................. 44
6.6 Pedestrian/Non-Motorized Travel ........................................................................... 46
6.7 Parks and Recreation – 4(f) Properties .................................................................... 46
6.8 Effects on Air Quality .............................................................................................. 47
6.8.1 Project Conformity ..................................................................................................... 47
6.8.2 Mobile Source Air Toxics (MSAT) ........................................................................... 48
6.8.3 Greenhouse Gases (GHG)/Climate Change ............................................................... 48
6.9 Noise Impacts........................................................................................................... 49
6.9.1 Basic Acoustic Concepts ............................................................................................ 50
6.9.2 Federal Regulations and Guidance ............................................................................. 52
6.9.3 State Rules and Procedures ........................................................................................ 54
6.9.4 FHWA Traffic Noise Model® version 2.5 (TNM ) .................................................... 55
6.9.5 Noise Impact and Abatement Analysis ...................................................................... 55
6.9.5.1 Field Measurement and TNM Comparison ...................................................... 55
6.9.5.2 Impact Analysis ................................................................................................ 59
v
6.9.5.3 Abatement Analysis .......................................................................................... 62
6.9.6 Conclusions ................................................................................................................ 65
6.10 Environmental Contamination ............................................................................... 66
6.10.1 Mitigation ................................................................................................................. 66
6.11 Wetlands ................................................................................................................ 66
6.12 Water Quality ......................................................................................................... 67
6.12.1 Background .............................................................................................................. 67
6.12.2 Legal Requirements .................................................................................................. 67
6.12.3 Water Quality Impacts .............................................................................................. 68
6.12.3.1 TMDLs and Impaired Uses ............................................................... 68
6.12.3.2 Post-Construction Impacts ................................................................ 69
6.12.4 Mitigation Measures ................................................................................................. 69
6.12.4.1 Soil Erosion and Sedimentation Control During Construction ................... 69
6.13 Floodplains and Hydraulics ................................................................................... 70
6.14 Wild and Scenic Rivers or State Designated Natural Rivers ................................. 71
6.15 Stream and Drain Crossings................................................................................... 71
6.16 Fish and Wildlife.................................................................................................... 72
6.16.1 Migratory Birds ........................................................................................................ 72
6.17 Threatened and Endangered Species ..................................................................... 73
6.17.1 General Information ................................................................................................. 73
6.17.2 Potential Species in Corridor .................................................................................... 73
6.17.3 Flora Review ............................................................................................................ 74
6.17.4 Fauna Review ........................................................................................................... 75
6.17.5 Conclusion ................................................................................................................ 76
6.18 Coastal Zone Resources ......................................................................................... 76
6.19 Cultural Resources ................................................................................................. 76
6.20 Historic and Archaeological Resources ................................................................. 77
6.20.1 Historic ..................................................................................................................... 77
6.20.2 Archaeological .......................................................................................................... 77
vi
6.20.3 Traditional Cultural and Religious Properties .......................................................... 77
6.21 Indirect Impacts and Cumulative Effects ............................................................... 77
6.21.1 Indirect Impacts ............................................................................................. 78
6.21.2 Cumulative Effects ........................................................................................ 78
6.22 Maintaining Traffic during Construction ............................................................... 78
6.22.1 US-23 Mainline ................................................................................... 78
6.22.2 Bridges ............................................................................................... 79
6.23 Permits ................................................................................................................... 80
6.24 Construction Impacts and Measures to Minimize during Construction ................ 81
Green Sheet .................................................................................................................... 83
7.0 – PUBLIC INVOLVEMENT AND AGENCY COORDINATION .............................. 87
7.1 Public Involvement .................................................................................................. 87
7.2 Agency Coordination ............................................................................................... 87
8.0 – PROJECT COSTS ............................................................................................. 89
APPENDICES
A – Early Stakeholder Coordination
B – Maintenance of Traffic Concept Report
C – Right-of-Way Requirements
D – Historical, Archaeological, and Section 106 Coordination Letters
E – Project Area Contamination Survey (PACS) Report
F – Noise Analysis Impact and Benefiting Units Table and Maps
vii
TABLES
Table 4.0 – US-23 Travel Time Summary (average minutes) ..................................... 13
Table 4.1 – VISSIM LOS Results for Ramp Operation (SB US-23 in the AM Peak Hour) ............................................................. 15
Table 4.2 – VISSIM LOS Results for Ramp Operation (NB US-23 in the PM Peak Hour) ............................................................. 15
Table 4.3 – Estimated Travel Time during an Incident (right lane closure) .................. 16
Table 4.4 – Comparative Intersection Level-of-Service for AM Peak Hour for All Alternatives ............................................................ 18
Table 4.5 – Comparative Intersection Level-of-Service for PM Peak Hour (2040) ............................................................................... 19
Table 4.6 – Alternative Comparison ............................................................................ 20
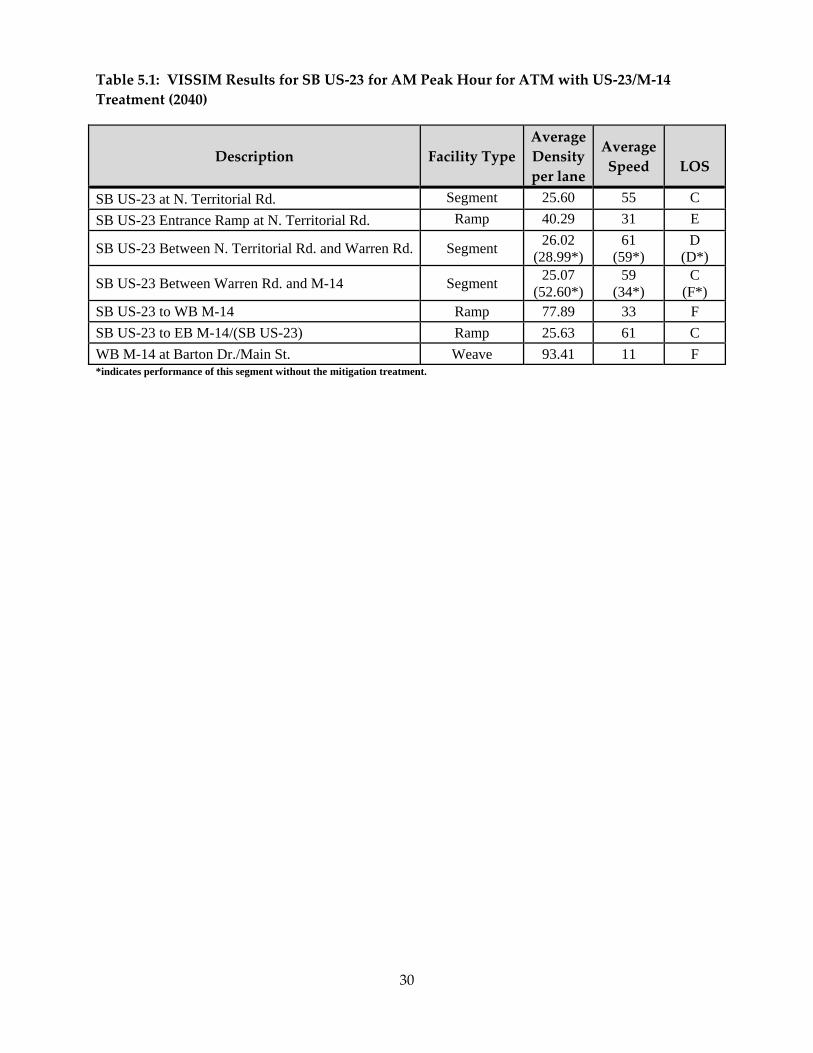
Table 5.1 – VISSIM Results for SB US-23 for AM Peak Hour with US-23/M-14 Treatment ..................................................................... 30
Table 6.0 – US-23 EA Corridor Growth Rates (M-14 to Silver Lake Road) ................. 37
Table 6.1 – Employment Growth Rates....................................................................... 37
Table 6.2 – Census Information .................................................................................. 45
Table 6.3 – Logarithmic Nature of Sound .................................................................... 50
Table 6.4 – FHWA Noise Abatement Criteria (NAC) ................................................... 53
Table 6.5 – Measured Existing Noise Levels during Peak Traffic ............................... 57
Table 6.6 – Comparison of Measured and Modeled Noise Levels .............................. 59
Table 6.7 – Existing 2015 Traffic Volumes (AM Peak) ................................................ 60
Table 6.8 – Existing 2015 Traffic Volumes (PM Peak) ................................................ 60
Table 6.9 – Future 2040 Traffic Volumes (AM Peak) .................................................. 61
Table 6.10 – Future 2040 Traffic Volumes (PM Peak) ................................................ 61
Table 6.11 – Number of Impacts per CNE .................................................................. 62
Table 6.12a – Evaluated Noise Barriers ...................................................................... 63
Table 6.12b – Evaluated Noise Barriers (continued) ................................................... 64
Table 6.13 – Noise Barriers Feasibility and Reasonableness Factors ........................ 65
Table 6.14 – Threatened and Endangered Species Survey Timeline ......................... 73
viii
FIGURES
Figure 1.0 – Environmental Assessment Study Corridor ............................................... 2
Figure 3.0 – Preferred Alternative ............................................................................... 11
Figure 5.0 – Active Traffic Management (ATM) with Dynamic Shoulder Use .............. 21
Figure 5.1 – Existing US-23 Mainline Cross Section ................................................... 23
Figure 5.2 – Dynamic Shoulder Use Cross Section .................................................... 24
Figure 5.3 – Non-Motorized/Pedestrian Access on Bridges Concept .......................... 25
Figure 5.4a – North Territorial Road Roundabout Concept ......................................... 26
Figure 5.4b – North Territorial Road Bridge Cross Section ......................................... 26
Figure 5.5a – 8 Mile Road Interchange with Signaled Intersections Concept ............. 27
Figure 5.5b – 8 Mile Road Interchange with Roundabouts Concept ........................... 27 Figure 5.6 – Crash Investigation Sites ......................................................................... 28
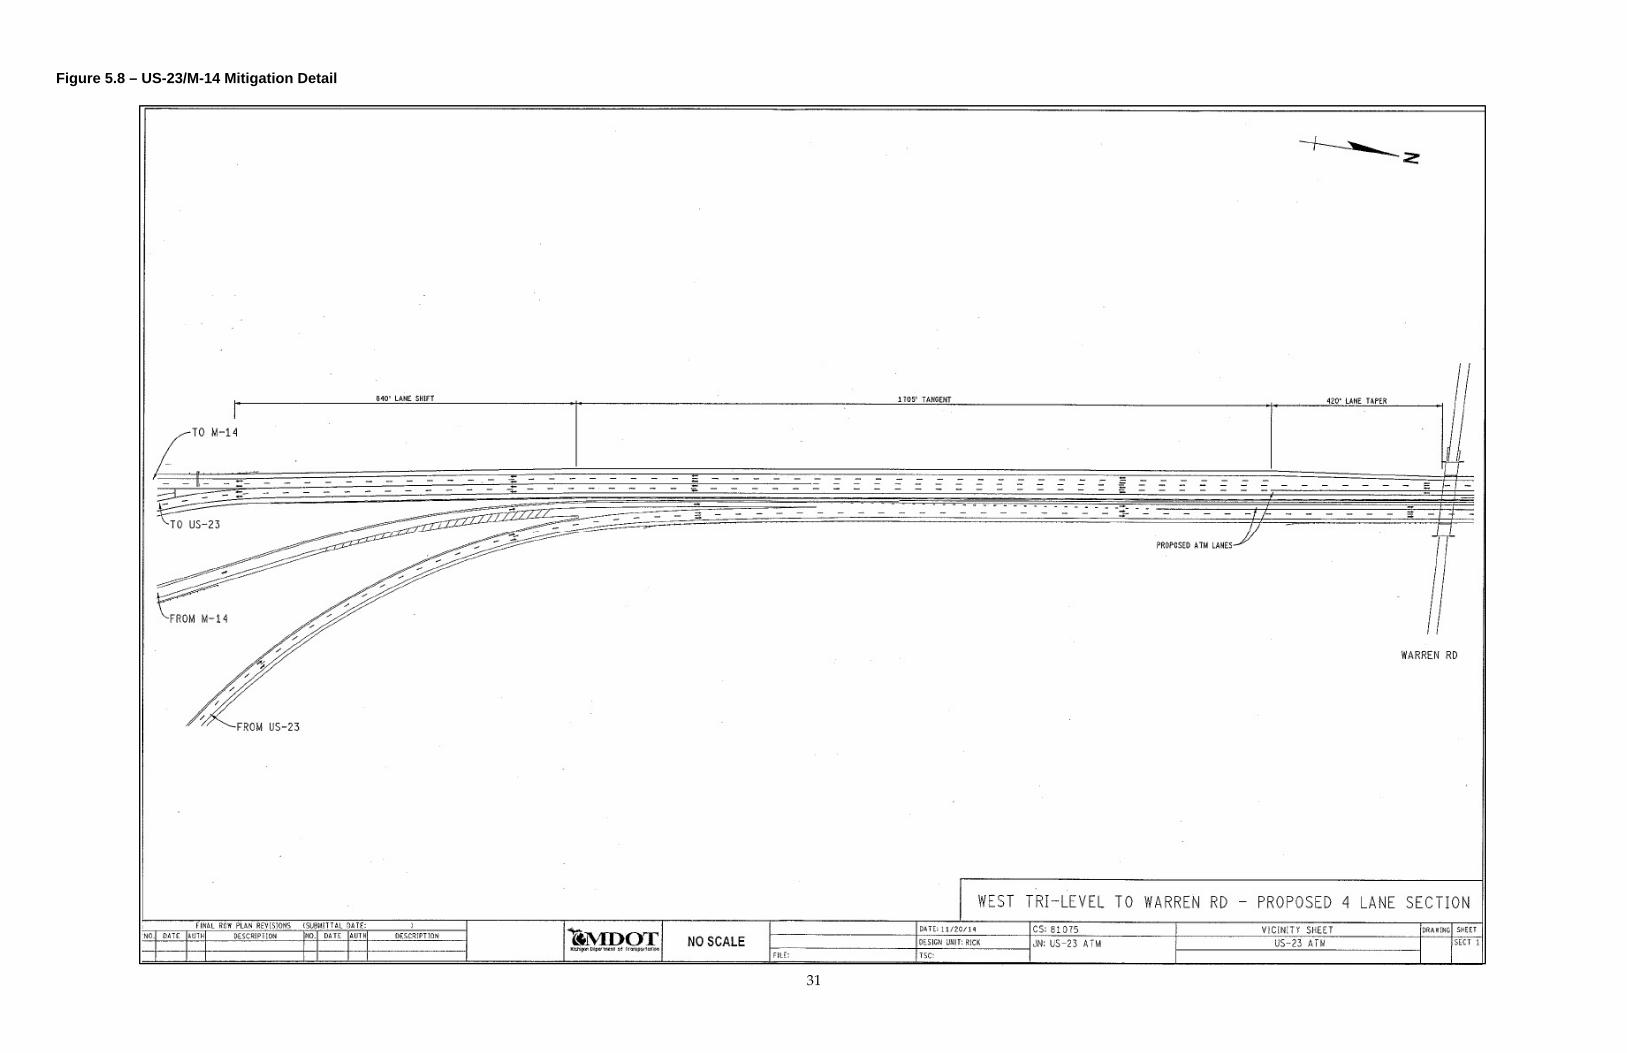
Figure 5.7 – SB US-23/M-14 Mitigation Configuration................................................. 29
Figure 5.8 – SB US-23/M-14 Mitigation Detail ............................................................. 31
Figure 6.0 – Environmental Constraints: North Section............................................... 33
Figure 6.1 – Environmental Constraints: North Central Section .................................. 34
Figure 6.2 – Environmental Constraints: South Central Section ................................. 35
Figure 6.3 – Environmental Constraints: South Section .............................................. 36
Figure 6.4 – Population Growth Data Area .................................................................. 38
Figure 6.5 – Livingston County Zoning ........................................................................ 39
Figure 6.6 – Washtenaw County Zoning ..................................................................... 40
Figure 6.7 – Livingston County Future Land Use ........................................................ 41
Figure 6.8 – Washtenaw County Future Land Use ..................................................... 42
Figure 6.9 – Sound Level Scale in dB(A) .................................................................... 51
Figure 6.10 – Common Noise Environments and Field Measurement Sites ............... 56
TECHNICAL REPORTS
US-23 Improvements Noise Analysis Report US-23 Improvements Traffic Report

ix

x
1
1.0 DESCRIPTION OF THE PROJECT AREA
1.1 Project Location
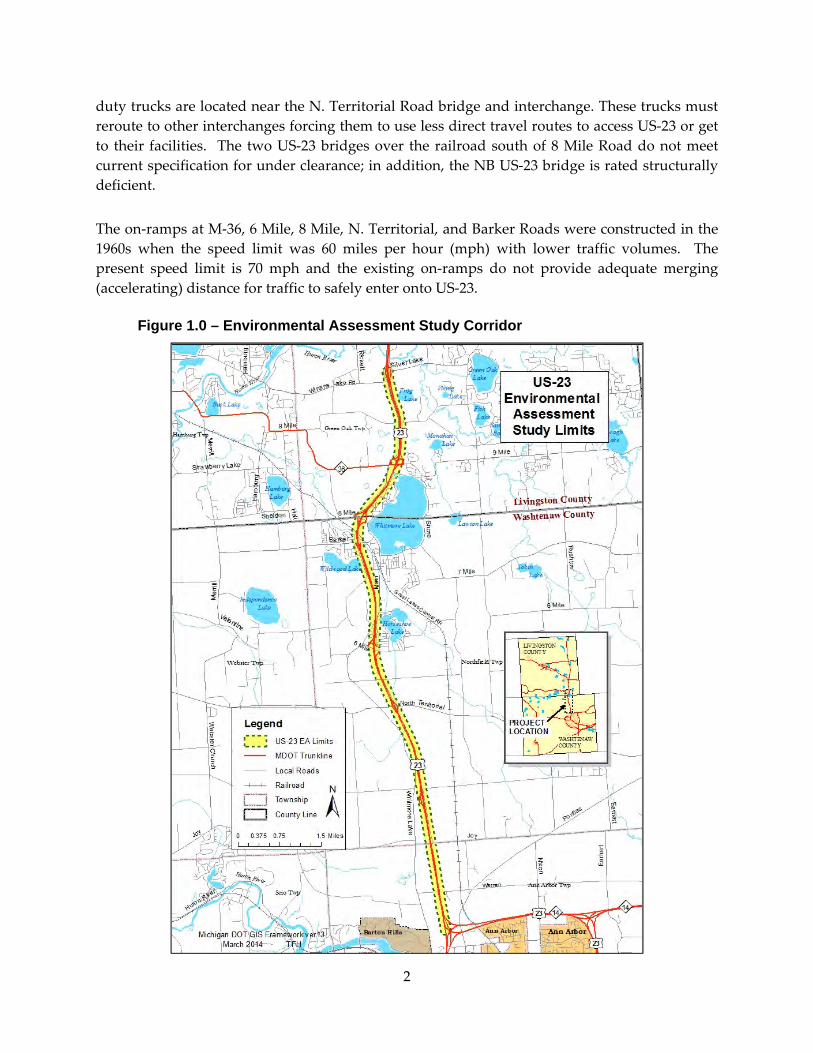
US‐23 freeway is a major north‐south arterial that begins in Michigan at the Ohio State Line
near Toledo, traverses through the cities of Ann Arbor and Flint, runs adjacent to the Lake
Huron shoreline and terminates at Mackinaw City. The project corridor is a 10 mile four‐lane
section of US‐23 within Livingston and Washtenaw Counties (Figure 1.0) from the west US‐
23/M‐14 (tri‐level) interchange (Exit 45) north to the Silver Lake Road interchange (Exit 55).
1.2 Existing Conditions
US‐23 experiences directional heavy traffic volumes during the weekday peak commuting
hours southbound (SB) in the morning (6:30 ‐ 9AM) and northbound (NB) in the late afternoon
(3:30 – 7PM). The congested traffic pattern is not a problem the rest of the day, which is evident
in the level of service (LOS) for this segment. LOS is a measure that reflects the density of traffic
on a roadway and ranges from LOS A, free flow condition with low traffic density, to LOS F,
extremely high congestion with very high traffic density. LOS A, B, and C are considered
acceptable traffic flow conditions and LOS D, E, and F reflect levels of traffic congestion. The
2015 morning SB and NB late afternoon peak traffic is LOS D to F. The predicted 2040 LOS
degrades to LOS E and F. In contrast, the 2015 and 2040 off‐peak level of service is LOS C.
Traffic congestion conditions are directional during peak hours with dense SB traffic in the
morning and NB traffic in the late afternoon.
Traffic incidents are another cause for traffic congestion in this segment. The corridor
experienced 25 traffic incidents from January 2014 through mid‐September 2014 with an
average lane closure duration of 1 hour and 17 minutes. Mechanical failure is the typical
incident with the occasional minor collision due to the bumper‐to‐bumper traffic experienced
during the periods of congestion. These incidents and a lack of redundancy in the local road
network adjacent to this segment create traffic flow delays. The lack of places for those involved
in an incident to safely pull off the roadway also exacerbates traffic delays.
The US‐23 bridges were constructed between 1957 and 1962 with a typical design life of fifty
years. The National Bridge Inventory (NBI) system rates Highway bridge conditions. The NBI
separately rates the bridge deck, superstructure, and substructure. Bridge rating ranges from 9,
excellent condition, to 0, failed condition. A “structurally deficient” highway bridge
classification occurs if the ratings of the deck, superstructure, or substructure are in ʺpoorʺ
condition (0 to 4 in the NBI rating scale). The bridges over US‐23 at 8 Mile, 6 Mile, and North
(N.) Territorial Road are determined to be structurally deficient1. Moreover, the N. Territorial
Road bridge has been posted for weight restrictions. Facilities that are destinations for heavy‐
1MDOT Highway Bridge Report, March 31, 2014
2
duty trucks are located near the N. Territorial Road bridge and interchange. These trucks must
reroute to other interchanges forcing them to use less direct travel routes to access US‐23 or get
to their facilities. The two US‐23 bridges over the railroad south of 8 Mile Road do not meet
current specification for under clearance; in addition, the NB US‐23 bridge is rated structurally
deficient.
The on‐ramps at M‐36, 6 Mile, 8 Mile, N. Territorial, and Barker Roads were constructed in the
1960s when the speed limit was 60 miles per hour (mph) with lower traffic volumes. The
present speed limit is 70 mph and the existing on‐ramps do not provide adequate merging
(accelerating) distance for traffic to safely enter onto US‐23.
Figure 1.0 – Environmental Assessment Study Corridor
3
2.0 PURPOSE AND NEED
The purpose is to address the immediate insufficiencies of the corridor as described in the
previous section by focusing on traffic safety, operational and infrastructure concerns, and the
directional peak hour congestion in the US‐23 corridor. The goal is to develop safe, efficient,
and sustainable transportation improvements to assure that the corridor will meet the current
and future highway operations with the use of state of the art traffic control measures along
with improved infrastructure.
The specific needs that the project will address are:
economically feasibility with regard to restricted funding and rapidly deteriorating
infrastructure conditions;
directional weekday (Monday – Friday) rush hour congestion (southbound morning,
6:30 – 9AM, and northbound late afternoon, 3:30 – 7PM);
structurally deficient bridges over US‐23 at 8 Mile, 6 Mile, North Territorial Roads, and
US‐23 bridges over state‐owned railroad tracks (leased by the Great Lakes Central
Railroad);
on‐ramps that are too short for adequate acceleration to safely merge into US‐23 traffic at
the 6 Mile Road, 8 Mile Road, Barker Road, and N. Territorial interchanges;
inefficient traffic operations at the corridor interchanges;
no incident management areas to safely clear and investigate accidents;
required roadway maintenance on US‐23 from the west US‐23/M‐14 interchange to
north of the Silver Lake Road interchange; and,
required roadway maintenance on the bridges over US‐23 at Joy and Warren Roads.
The resulting action will utilize cost effective innovative technologies and methods, expedite the
construction schedule, and limit travel disruption during construction.

4
5
3.0 ALTERNATIVES
3.1 US-23 Feasibility Study
MDOT completed a Feasibility Study in 2009 on the US‐23 corridor from south of I‐96 to north
of the west US‐23/M‐14 interchange. The Feasibility Study identified both short‐ and long‐term
improvements to enhance the US‐23 corridor. The intention of the study’s findings contained in
the planning level document were to act as a guide for investment decisions and a tool to
prioritize need and projects within the corridor for the next 20 years. The following are excerpts
from the Feasibility Study; the full US‐23 Feasibility Study, M‐14 to I‐96 is on the MDOT public
website at: www.michigan.gov/mdot/0,4616,7‐151‐9621_11058‐226949‐‐,00.html
The study analyzed both traditional and nontraditional improvements:
No‐Build/Baseline
Local System/Operational Improvements
Transit Service Options
Bus Bypass Shoulders
Additional General Purpose Lanes
Additional High Occupancy Vehicle (HOV) Lanes
Additional High Occupancy Toll (HOT) Lanes
The Feasibility Study studied corridor opportunities such as a commuter‐oriented transit
service, tolling, and transit‐oriented development for implementation and/or further
consideration in future phases of study.
The Feasibility Study recommendations include Near‐Term, Mid‐Term, and Long‐Term
opportunities2. The following is text from the Feasibility Study that is relevant to this EA:
“Near-Term Opportunities
Deploy ITS Technologies along US-23 in the south segment3 as a means to better monitor congestion and respond to incidents in the area. Non-recurring congestion was found to be a key factor in traffic issues in the corridor, and ITS could help to mitigate this factor by providing improved information to motorists and enabling faster incident clearance.
Expand Freeway Courtesy Patrol Program currently utilized in MDOT’s Metro Region could also help mitigate non-recurring congestion by enabling faster clearance of disabled vehicles from the roadside4.
2 Michigan Department of Transportation,US‐23 Feasibility Study, M‐14 to I‐96, Bureau of Transportation
Planning, 2009, page 88 3 The ITS deployment for this study focuses on the operation of the ATM from M‐36 to the West US‐
23BR/M‐14 interchange. 4 The Freeway Courtesy Patrol is now operating in the US‐23 corridor.
6
Mid-Term Opportunities:
Replace Critical Bridges at 6 Mile Road and 8 Mile Road that are rated in “Poor” condition and are in need of replacement and would provide the horizontal clearance required for future widening of US-23.
Replace Bridges over US-23 at Warren Road, Joy Road, North Territorial Road, Barker Road, the CSX railroad and 9 Mile Road (M-36). These bridges are designed to carry two lanes of traffic in each direction only and will require lengthening to accommodate potential future widening of US-23.
Operational Improvements to all the interchanges in the study area including the lengthening of all ramp acceleration and deceleration lanes and evaluating ramp terminal operations. This would include adjusting terminal turn lanes, signal optimization and investigating the opportunity for roundabouts. Modifications to the west US-23/M-14 tri-level would improve safety and weaving deficiencies.
Long-Term Opportunities:
Mainline US-23 Reconstruction and Widening is the best long-term solution to improve the current infrastructure conditions and resolve traffic congestion issues. The widening of mainline US-23 would commence with the south segment of US-23 where traffic congestion is the greatest. Consideration should be given to the elimination of the Barker Road interchange to improve traffic flow. It is recommended that all three scenarios for capacity enhancement – Three Lane General Purpose, HOV, HOT – be carried forward for further evaluation in the environmental process, as each was found to present a viable option for improving traffic operations throughout the corridor.”
The findings of the Feasibility Study were conceptual and not final. Advancing specific
alternative recommendations requires environmental clearance as well as some combination of
available federal, state, and local public and private funding sources to be approved, designed
and implemented.
3.1.1 Conclusions
The Feasibility Study reviewed the Bus Bypass Shoulders (BBS) as a mobility opportunity. The
Feasibility Study did not recommend the BBS so it was not moved forward as an alternative for
this EA. However, this EA has taken the concept of the temporal use of shoulders and, along
with ITS, expanded it to include all vehicles except heavy‐duty trucks during the times of
directional peak hour congestion. This operation is identified as an Active Traffic Management
(ATM) system and is included in the third and fourth alternatives in this document.
The Three‐Lane General Purpose scenario identified under the Feasibility Study’s Long‐Term
Opportunities is not carried forward in this Environmental Assessment. This scenario is not
considered in the EA because the economic impacts would be neither feasible nor prudent.
According to the Feasibility Study, the cost to widen mainline US‐23 in between M‐14 and the
7
Washtenaw County line under the Three Lane General Purpose scenario is $119 million (in 2016
dollars). This cost does not include right‐of‐way acquisition or the cost to replace the bridges
and interchanges between M‐14 and M‐36. The bridge and interchange replacements are
estimated to cost $101 million (in 2016 dollars). The total construction cost of the Three‐Lane
General Purpose scenario in Washtenaw County is $220 million (in 2016 dollars). Therefore, the
high cost of this alternative eliminates the Three Lane General Purpose scenario from
consideration.
3.2 North-South Commuter Rail (WALLY) The North‐South Commuter Rail from Howell to Ann Arbor, popularly known as the
WALLY (Washtenaw – Livingston Rail Line), is not an alternative in this study. However,
public comments from the December 2013 and August 2014 public meetings included
requests to add the WALLY as a “build alternative”. This section is in response to the
public comments by explaining the WALLY’s relationship to this Environmental Assessment.
The US‐23 Modernization EA and the WALLY are concurrent studies and are separate but
complementary projects, in that, neither project alone is likely to alleviate congestion in the
US‐23 corridor entirely, but each concept would be part of the solution. The two studies have
separate funding sources. The US‐23 Modernization EA is funded entirely with State funds,
but must receive FHWA approval before it can proceed to t h e final design and
construction phases. The WALLY study funds have come from donations from the City of
Howell, Washtenaw County and the Ann Arbor Downtown Development Authority for
further studies of the proposed route and station sites. The Ann Arbor Area Transportation
Authority (AAATA) is the designated authority with MDOT serving as its liaison for the
purpose of pursuing federal and state grant and funding opportunities. The MDOT Office of
Rail, Federal Highway Administration (FHWA) and the Federal Transit Authority (FTA) are
among the cooperating agencies.
In 2014, the WALLY study received an FHWA Transportation and Community System
Preservation (TCSP) grant and an FTA’s Smart Starts (5304) grant. The TCSP is funding a
Phase II detailed feasibility study, which began in late summer 2014. Phase II will establish in
greater detail the overall feasibility of the North‐South Commuter Rail project, including
station location analysis and identifying long‐term funding, operational plans, and the
preliminary environmental analysis relevant to the proposed commuter rail service.
WALLY development will continue with or without US‐23 development and will be required
to follow the environmental clearance process as defined in the National Environmental
policy Act (NEPA) after the feasibility study is complete. The separation of the US‐23
Improvement EA and the WALLY Phase II study ensure both projects proceed without delay.
The North‐South Commuter Rail website5 contains information on the Phase II study and
provides a forum for public comment and suggestion.
5 http://www.nsrailstudy.com/
8
3.3 Alternatives’ Summary
MDOT has considered five alternatives to address the transportation infrastructure and the
directional peak hour traffic congestion of the US‐23 Improvements project corridor. All the
Alternatives are primarily within MDOT right‐of‐way (ROW) except around the N. Territorial
Road bridge replacement and 5 Mile Road realignment that will require some ROW. Each
alternative satisfies elements of the purpose and needs of the corridor. The traffic comparative
analysis of all build alternatives is in the following section.
The MDOT is implementing Intelligent Transportation Systems (ITS) statewide throughout the
highway system and is part of all the alternatives listed here. The ITS will include installation
of additional traffic camera locations and electronic message boards to better inform the public
of travel conditions by identifying travel times to interchanges, construction dates and times,
and traffic incident notification.
3.3.1 “No Build”
The No Build alternative is the baseline alternative to compare traffic and impacts with the
Build Alternatives. It includes minor bridgework, ITS, and capital preventive maintenance
(CPM) in the US‐23 mainline from the west US‐23/M‐14 interchange north to the Silver Lake
Road interchange and on the Joy Road and Warren Road bridges. The No Build is not
considered a reasonable alternative because it does not address the functional obsolescence,
operational inefficiencies, structural deficiencies of the bridges or ramps, or provide for incident
management. Furthermore, it does not address the operational inefficiencies of the
interchanges or relieve the directional weekday peak hour traffic congestion. The modeling of
this alternative illustrates the continuation of the directional peak period congestion and
deterioration of the traffic flow in this corridor through 2040.
3.3.2 Build Alternatives
3.3.2.1 Transportation Systems Management (TSM):
This alternative includes the elements listed in the No Build Alternative, plus, bridge
replacements at N. Territorial, 8 Mile, 6 Mile Roads and the US‐23 bridges over the Great Lakes
Central Railroad. The N. Territorial, 8 Mile, and 6 Mile Roads bridge replacements will be
constructed to accommodate pedestrian and non‐motorized travel.
The N. Territorial Road bridge replacement includes the realignment of 5 Mile Road to intersect
N. Territorial Road approximately 500 feet east of the existing northbound on ramp.
Roundabouts will be constructed on N. Territorial Road at the ramp termini (Figure 5.4). The
park and ride lot will be removed and will be reviewed for replacement at a later date.
The TSM Alternative also includes ramp extensions and minor operational improvements at
intersection terminals such as signal timing changes or storage lanes that do not require right‐
of‐way.
9
This alternative does address infrastructure needs and some of the operational inefficiencies,
but does not present opportunities to relieve the US‐23 mainline traffic congestion due to traffic
incidents and directional weekday peak hour traffic congestion.
3.3.2.2 Ramp Metering:
Ramp metering is the use of traffic signals, typically a signal yellow light, to control the flow of
traffic entering a freeway facility. This control aims to maximize the capacity of the highway
and prevent traffic flow breakdown and the onset of congestion. This alternative analysis
included all the elements listed in the TSM Alternative and includes metering of the following
on‐ramps:
6 Mile Rd. On‐Ramp to SB US‐23 (300 feet from cross street)
8 Mile Rd. On‐ramp To SB US‐23 (381 feet from cross street)
M‐36 On‐Ramp to SB US‐23 (311 feet from cross street)
M‐36 On‐Ramp to NB US‐23 (300 feet from cross street)
Although the addition of ramp metering at these select locations did not result in significant
freeway operational improvements, it is anticipated that ramp metering will have an impact on
safety by reducing the number of crashes at the merge areas for these metered ramps. This
alternative does address infrastructure and some of the operational inefficiencies, but does not
present opportunities to relieve the US‐23 mainline traffic congestion due to traffic incidents
and directional weekday peak hour traffic congestion (SB: 6:30 – 9AM and PM and NB: 3:30 –
7PM).
3.3.2.3 Active Traffic Management (ATM), Preferred Alternative:
This Alternative includes all the elements listed in the TSM Alternative, six crash investigation
sites (CIS) and an active traffic management (ATM) system. The ATM includes dynamic
shoulder use from the west US‐23/M‐14 interchange to south of the M‐36 interchange, to relieve
the directional peak period traffic congestion. The southbound (SB) shoulders will only be open
to traffic during the typical AM peak period of 6:30 – 9AM. The northbound (NB) shoulders
will only be open to traffic during the typical PM peak period of 3:30 – 7PM. The shoulders will
be restricted to passenger vehicles and light‐duty trucks. The shoulders will also be available
for traffic diversion in the event of mainline incidents; such as, collisions, mechanical
breakdowns, or when traffic meets congestion thresholds during off‐peak hours due to special
event traffic or seasonal fluctuations. This Alternative requires the reconfiguration of the 8 Mile
Road interchange along with its bridge replacement due to the widening of the US‐23 bridges
over the railroad to accommodate the dynamic shoulder use configuration. It also requires the
widening of the US‐23 bridges over Barker Road to accommodate the dynamic shoulder use
configuration.
This alternative alleviates the stop‐and‐go traffic conditions that currently exist on US‐23.
Because of this, SB US‐23 would experience some congestion near the US‐23/M‐14 interchange.
MDOT has developed a design strategy to mitigate this congestion. MDOT is investigating a
four‐lane treatment that will start south of the Warren Road bridge and provide four lanes at
the US‐23 and M‐14 split (two lanes to each roadway). The additional lane will not require any
10
additional right‐of‐way. This option could reduce the traffic congestion during the peak hours
near the US‐23/M‐14 interchange.
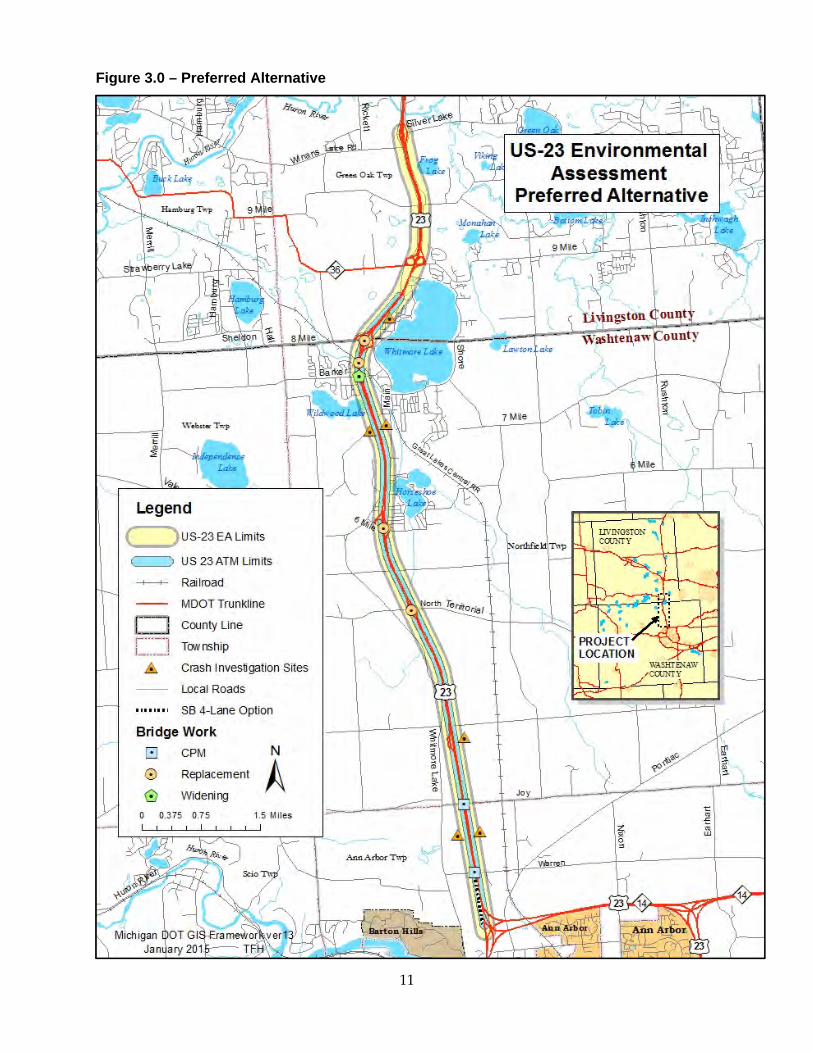
This is the Preferred Alternative as it fulfills all the elements of the purpose and need and is the
focus of this document. The features of the Preferred Alternative are represented in Figure 3.0
and are presented in Section 5.0.
3.3.2.4 ATM with High Occupancy Vehicles (ATM‐HOV):
This alternative includes all the elements listed in the ATM Alternative, except the dynamic
shoulder use during the periods of directional peak hour traffic would be designated an HOV
lane and will only be available for passenger vehicles and small trucks with 2 or more
occupants.
The HOV dynamic shoulder use has many issues with regard to enforcement and safety. The
State of Michigan does not have a specific law to enforce HOV only lanes. Such lanes can be
enforced under the Michigan Vehicle Code 257.642 mandating adherence to traffic control
devices, such as, signage or electronic message boards restricting lane usage. The frequently
asked questions associated with the FHWA pooled fund study, HOV Lane Enforcement Handbook
(2006),6 reported difficulty in recognizing a violating vehicle (detecting that there are 2 or more
people in the vehicle) during periods of heavy traffic. The designation of the median shoulder
for HOV‐only during the peak periods would require that police officers enforce the managed
shoulder during heavy traffic volumes to ensure its success. There is no inside shoulder with
this alternative where police officers can safely pull over a vehicle for an HOV violation. Either
the police officers would need to block the median shoulder lane to pull over a vehicle, which
would block the flow of traffic in that lane, or they would need to signal for the violating
vehicle to pull the vehicle over in the right shoulder, which would be very difficult and
dangerous. Both of these situations could result in a significant reduction to the US‐23 capacity
during the peak period or develop unsafe situations for police officers and other drivers.
Camera enforcement could improve the enforcement of HOV. However, Michigan does not
have the legislation or the infrastructure and resources to support camera enforcement at this
time.
The ATM‐HOV Alternative does fulfill most of the elements of the purpose and need, but due
to the enforcement and safety issues it is not a preferred alternative.
6 https://hovpfs.ops.fhwa.dot.gov/hov_pfs_members/docs/projects/10/enforce_faq.pdf
11
Figure 3.0 – Preferred Alternative

12
13
4.0 TRAFFIC ANALYSIS
The Preferred Alternative is the focus of this section with the information taken from the
accompanying US‐23 Improvements Traffic Analysis Report’s (Traffic Report). The report analyzes
the traffic for all the Alternatives.
4.1 Comparative Traffic Analysis
The comparative traffic analysis takes into account the operational and safety issues stated in
the purpose and need (Section 2.0) in making a determination on the preferred alternative.
4.2 Peak Hour Congestion
It is difficult to compare the overall benefits of the build alternatives by just comparing the LOS
from the VISSIM simulation (see Section 5 in the Traffic Report) because each of the build
alternatives shows improvements at different areas along the US‐23 corridor. Therefore, the
average travel time was computed (using VISSIM) for each of the alternatives to further
compare the overall benefits. The travel time was set up to measure from M‐14 to I‐96 in order
to capture any queuing that could occur along the corridor (14.7 miles southbound and 14.6
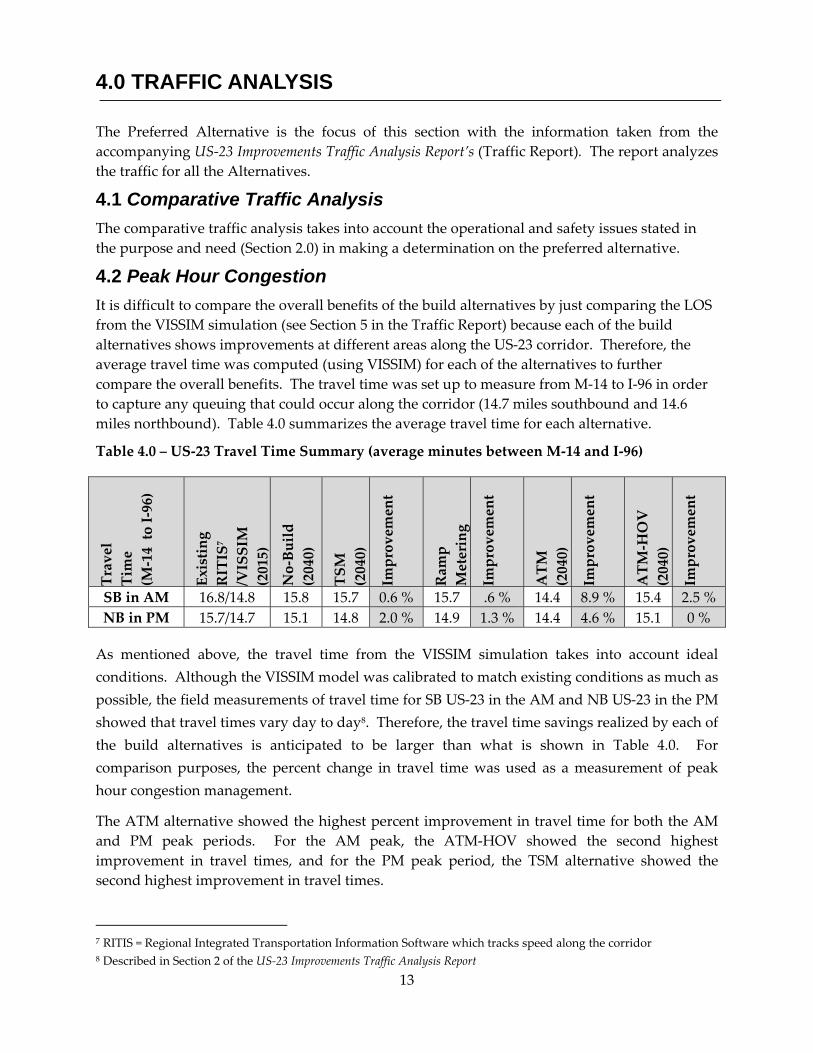
miles northbound). Table 4.0 summarizes the average travel time for each alternative.
Table 4.0 – US‐23 Travel Time Summary (average minutes between M‐14 and I‐96)
Travel
Time
(M‐14 to I‐96)
Existing
RITIS
7
/VISSIM
(2015)
No‐Build
(2040)
TSM
(2040)
Improvement
Ramp
Metering
Improvement
ATM
(2040)
Improvement
ATM‐HOV
(2040)
Improvement
SB in AM 16.8/14.8 15.8 15.7 0.6 % 15.7 .6 % 14.4 8.9 % 15.4 2.5 %
NB in PM 15.7/14.7 15.1 14.8 2.0 % 14.9 1.3 % 14.4 4.6 % 15.1 0 %
As mentioned above, the travel time from the VISSIM simulation takes into account ideal
conditions. Although the VISSIM model was calibrated to match existing conditions as much as
possible, the field measurements of travel time for SB US‐23 in the AM and NB US‐23 in the PM
showed that travel times vary day to day8. Therefore, the travel time savings realized by each of
the build alternatives is anticipated to be larger than what is shown in Table 4.0. For
comparison purposes, the percent change in travel time was used as a measurement of peak
hour congestion management.
The ATM alternative showed the highest percent improvement in travel time for both the AM
and PM peak periods. For the AM peak, the ATM‐HOV showed the second highest
improvement in travel times, and for the PM peak period, the TSM alternative showed the
second highest improvement in travel times.
7 RITIS = Regional Integrated Transportation Information Software which tracks speed along the corridor 8 Described in Section 2 of the US‐23 Improvements Traffic Analysis Report
14
It is important to note that although the travel time results from VISSIM do not show large
improvements in peak period travel time for the US‐23 corridor, the ATM and ATM‐HOV
alternative are servicing more people and vehicles during the AM and PM peak. The ATM
alternative shows that traffic will be diverted from other slower routes over the next twenty
years (8 to 18% depending on the location and time period9), and the ATM‐HOV alternative
shows about a 5% increase in vehicular traffic (with the HOV lane carrying vehicles with 2 or
more persons). Therefore, it is important to note that although the percent increase in the US‐23
travel time is low, there are more people‐trips benefiting from the improved travel time.
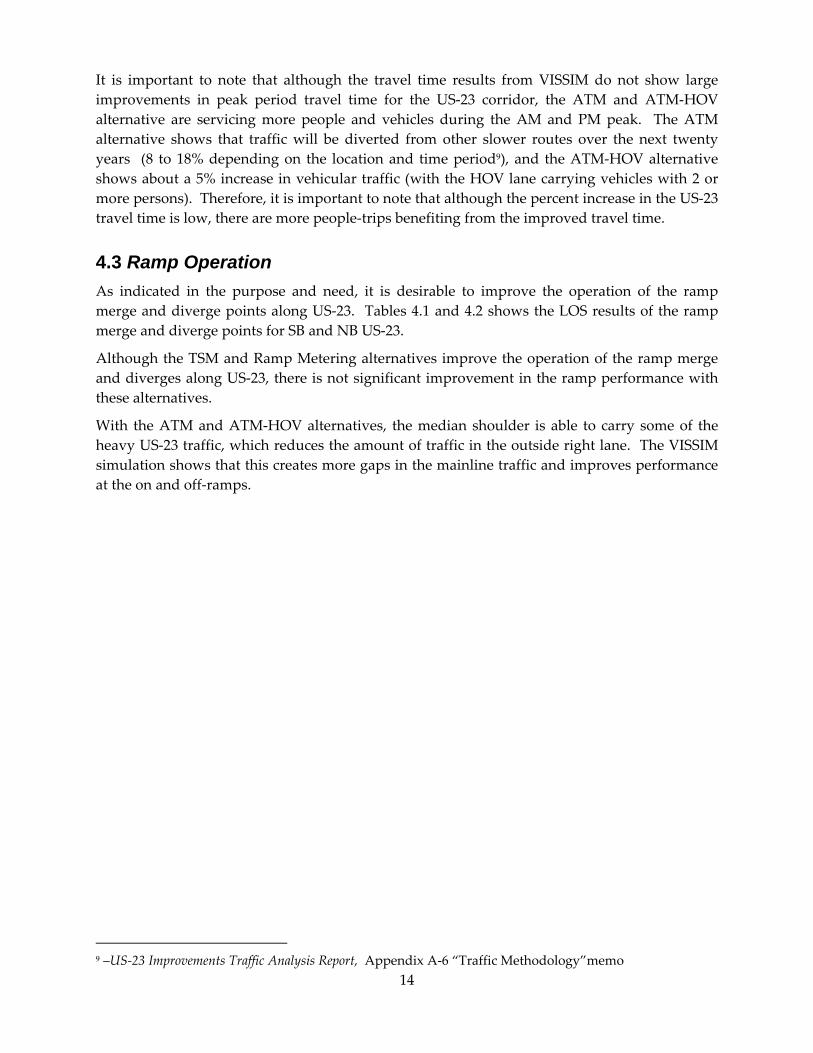
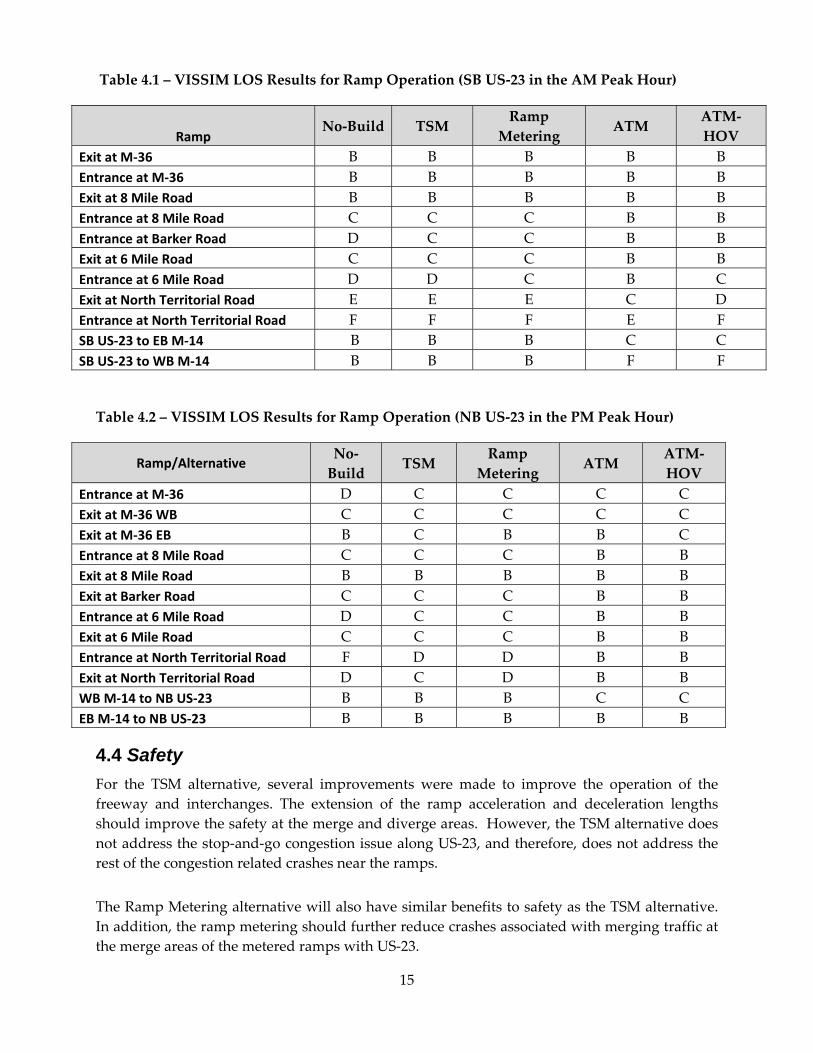
4.3 Ramp Operation
As indicated in the purpose and need, it is desirable to improve the operation of the ramp
merge and diverge points along US‐23. Tables 4.1 and 4.2 shows the LOS results of the ramp
merge and diverge points for SB and NB US‐23.
Although the TSM and Ramp Metering alternatives improve the operation of the ramp merge
and diverges along US‐23, there is not significant improvement in the ramp performance with
these alternatives.
With the ATM and ATM‐HOV alternatives, the median shoulder is able to carry some of the
heavy US‐23 traffic, which reduces the amount of traffic in the outside right lane. The VISSIM
simulation shows that this creates more gaps in the mainline traffic and improves performance
at the on and off‐ramps.
9 –US‐23 Improvements Traffic Analysis Report, Appendix A‐6 “Traffic Methodology”memo
15
Table 4.1 – VISSIM LOS Results for Ramp Operation (SB US‐23 in the AM Peak Hour)
Ramp No‐Build TSM
Ramp
Metering ATM
ATM‐
HOV
Exit at M‐36 B B B B B
Entrance at M‐36 B B B B B
Exit at 8 Mile Road B B B B B
Entrance at 8 Mile Road C C C B B
Entrance at Barker Road D C C B B
Exit at 6 Mile Road C C C B B
Entrance at 6 Mile Road D D C B C
Exit at North Territorial Road E E E C D
Entrance at North Territorial Road F F F E F
SB US‐23 to EB M‐14 B B B C C
SB US‐23 to WB M‐14 B B B F F
Table 4.2 – VISSIM LOS Results for Ramp Operation (NB US‐23 in the PM Peak Hour)
Ramp/Alternative No‐
Build TSM
Ramp
Metering ATM
ATM‐
HOV
Entrance at M‐36 D C C C C
Exit at M‐36 WB C C C C C
Exit at M‐36 EB B C B B C
Entrance at 8 Mile Road C C C B B
Exit at 8 Mile Road B B B B B
Exit at Barker Road C C C B B
Entrance at 6 Mile Road D C C B B
Exit at 6 Mile Road C C C B B
Entrance at North Territorial Road F D D B B
Exit at North Territorial Road D C D B B
WB M‐14 to NB US‐23 B B B C C
EB M‐14 to NB US‐23 B B B B B
4.4 Safety
For the TSM alternative, several improvements were made to improve the operation of the
freeway and interchanges. The extension of the ramp acceleration and deceleration lengths
should improve the safety at the merge and diverge areas. However, the TSM alternative does
not address the stop‐and‐go congestion issue along US‐23, and therefore, does not address the
rest of the congestion related crashes near the ramps.
The Ramp Metering alternative will also have similar benefits to safety as the TSM alternative.
In addition, the ramp metering should further reduce crashes associated with merging traffic at
the merge areas of the metered ramps with US‐23.
16
Both the ATM and the ATM‐HOV would use the median shoulder to help relieve traffic
congestion along US‐23 within the study area. The VISSIM model simulation shows that with
the use of the ATM shoulder during peak periods, there are more gaps and larger headways for
the on‐ramp traffic to merge into, which helps eliminate the slow‐down due to merging traffic.
In addition, the median shoulder would be used to maintain traffic during an incident, which
should decrease the likelihood of secondary crashes due to traffic backups.
4.5 Incident Management
For the TSM and Ramp Metering alternatives, there is little to no impact to the operational
conditions for incident management. Both the ATM alternative and the ATM‐HOV alternative
address the need to improve operations when there is an incident blocking the shoulder, or one
or more lanes. With both of these alternatives, traffic would be actively managed to use the
shoulder so there would be additional lanes for managing the traffic. This should improve the
reliability of US‐23 because of the frequency that the right shoulder is blocked on this corridor.
Also, by clearing traffic more efficiently, this should result in a decrease in secondary crashes
that happen in the traffic backups.
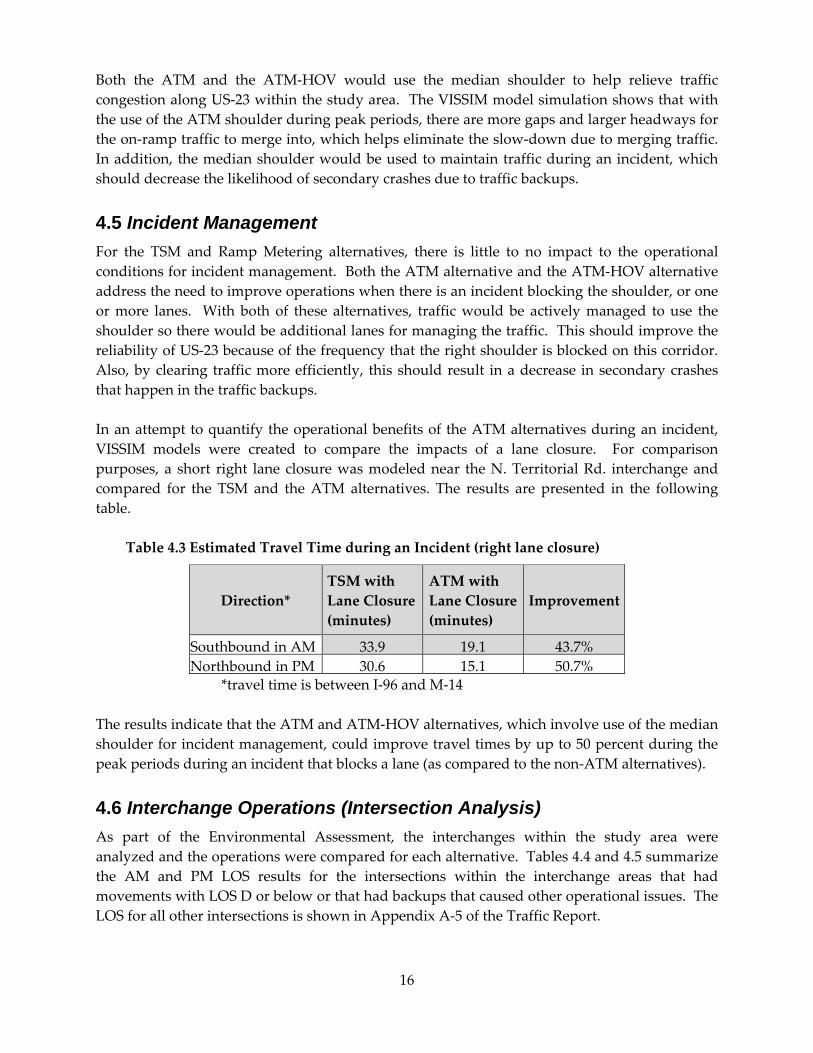
In an attempt to quantify the operational benefits of the ATM alternatives during an incident,
VISSIM models were created to compare the impacts of a lane closure. For comparison
purposes, a short right lane closure was modeled near the N. Territorial Rd. interchange and
compared for the TSM and the ATM alternatives. The results are presented in the following
table.
Table 4.3 Estimated Travel Time during an Incident (right lane closure)
Direction*
TSM with
Lane Closure
(minutes)
ATM with
Lane Closure
(minutes)
Improvement
Southbound in AM 33.9 19.1 43.7%
Northbound in PM 30.6 15.1 50.7% *travel time is between I‐96 and M‐14
The results indicate that the ATM and ATM‐HOV alternatives, which involve use of the median
shoulder for incident management, could improve travel times by up to 50 percent during the
peak periods during an incident that blocks a lane (as compared to the non‐ATM alternatives).
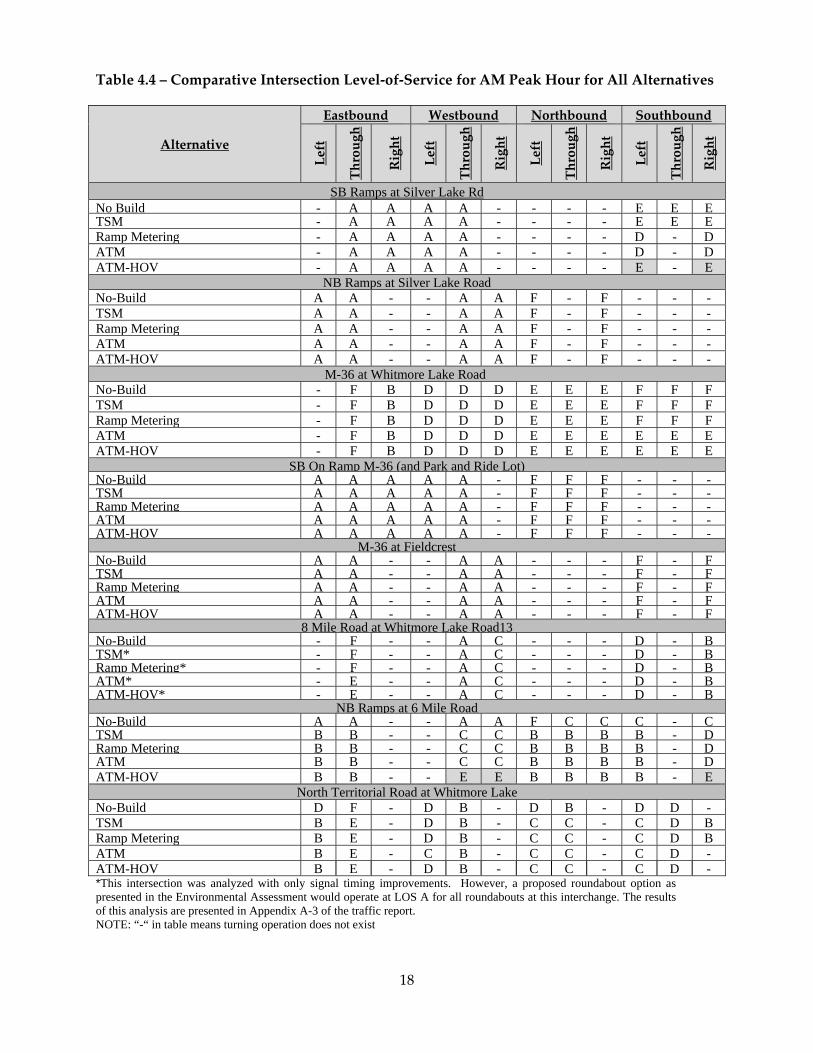
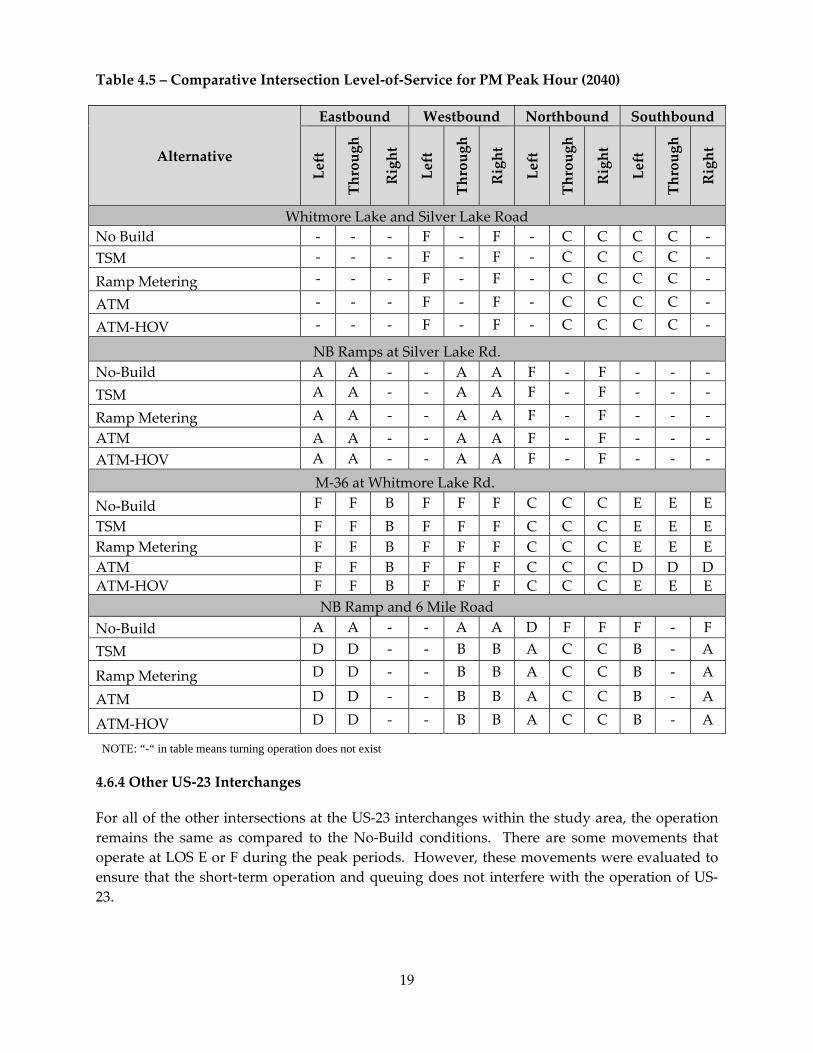
4.6 Interchange Operations (Intersection Analysis)
As part of the Environmental Assessment, the interchanges within the study area were
analyzed and the operations were compared for each alternative. Tables 4.4 and 4.5 summarize
the AM and PM LOS results for the intersections within the interchange areas that had
movements with LOS D or below or that had backups that caused other operational issues. The
LOS for all other intersections is shown in Appendix A‐5 of the Traffic Report.
17
For the TSM and Ramp Metering alternatives, there was no traffic volume change over the No‐
Build conditions for the intersections within the study area. The Ramp Metering alternative did
not impact the intersection terminals so the results of the Ramp Metering alternative were the
same as the TSM alternative.
With the ATM‐HOV, the volumes changes were minor and did not have a major impact on
intersection performance. For the ATM alternative, there were shifts in the traffic volume (as
shown in Appendix A‐2 of the Traffic Report), however, only the interchange of US‐23 and N.
Territorial Rd. had significant volume changes.
Because the volumes at most of the interchanges did not change significantly for the
alternatives, the results between the build alternatives are very similar.
4.6.1 US‐23 and North Territorial Rd. Interchange
For all the build alternatives, both the US‐23 NB ramp terminal and the US‐23 SB ramp
terminals were changed from signalized intersections to roundabouts resulting in significant
operational improvements (LOS A without significant queuing).
4.6.2 US‐23 and 6 Mile Rd. Interchange
Again, for all of the build alternatives, the intersection of the US‐23 NB off‐ramp to 6 Mile Rd.
was modified from a 2‐way to a 4‐way stop, which improved the operation for all of the build
alternatives, especially improving the queuing on the northbound off‐ramp. However, under
the ATM‐HOV alternative, the westbound movement drops to LOS E (but without impact to
US‐23 traffic). Also for the ATM‐HOV alternative, the westbound movement at the southbound
off‐ramp operates at LOS E.
4.6.3 US‐23 and 8 Mile Rd. Interchange
If the layout of the 8 Mile Rd. interchange remains with signalized control for all of the
intersections, the eastbound through movement would operate at LOS E for all of the build
alternatives. This eastbound movement, however, does not impact the operation of US‐23.
Another concept is being proposed for this interchange (for all of the build alternatives) which
has roundabouts at all of these intersections. With this concept, all interchange intersections
would operate at LOS A.
18
Table 4.4 – Comparative Intersection Level‐of‐Service for AM Peak Hour for All Alternatives
Alternative
Eastbound Westbound Northbound Southbound
Left
Through
Right
Left
Through
Right
Left
Through
Right
Left
Through
Right
SB Ramps at Silver Lake Rd No Build - A A A A - - - - E E ETSM - A A A A - - - - E E ERamp Metering - A A A A - - - - D - DATM - A A A A - - - - D - DATM-HOV - A A A A - - - - E - E
NB Ramps at Silver Lake RoadNo-Build A A - - A A F - F - - -TSM A A - - A A F - F - - -Ramp Metering A A - - A A F - F - - -ATM A A - - A A F - F - - -ATM-HOV A A - - A A F - F - - -
M-36 at Whitmore Lake RoadNo-Build - F B D D D E E E F F FTSM - F B D D D E E E F F FRamp Metering - F B D D D E E E F F FATM - F B D D D E E E E E EATM-HOV - F B D D D E E E E E E
SB On Ramp M-36 (and Park and Ride Lot)No-Build A A A A A - F F F - - -TSM A A A A A - F F F - - -Ramp Metering A A A A A - F F F - - -ATM A A A A A - F F F - - -ATM-HOV A A A A A - F F F - - -
M-36 at FieldcrestNo-Build A A - - A A - - - F - FTSM A A - - A A - - - F - FRamp Metering A A - - A A - - - F - FATM A A - - A A - - - F - FATM-HOV A A - - A A - - - F - F
8 Mile Road at Whitmore Lake Road13No-Build - F - - A C - - - D - BTSM* - F - - A C - - - D - BRamp Metering* - F - - A C - - - D - BATM* - E - - A C - - - D - BATM-HOV* - E - - A C - - - D - B
NB Ramps at 6 Mile Road No-Build A A - - A A F C C C - CTSM B B - - C C B B B B - DRamp Metering B B - - C C B B B B - DATM B B - - C C B B B B - DATM-HOV B B - - E E B B B B - E
North Territorial Road at Whitmore LakeNo-Build D F - D B - D B - D D -TSM B E - D B - C C - C D BRamp Metering B E - D B - C C - C D BATM B E - C B - C C - C D -ATM-HOV B E - D B - C C - C D -*This intersection was analyzed with only signal timing improvements. However, a proposed roundabout option as presented in the Environmental Assessment would operate at LOS A for all roundabouts at this interchange. The results of this analysis are presented in Appendix A-3 of the traffic report. NOTE: “-“ in table means turning operation does not exist
19
Table 4.5 – Comparative Intersection Level‐of‐Service for PM Peak Hour (2040)
Alternative
Eastbound Westbound Northbound Southbound
Left
Through
Right
Left
Through
Right
Left
Through
Right
Left
Through
Right
Whitmore Lake and Silver Lake Road
No Build ‐ ‐ ‐ F ‐ F ‐ C C C C ‐
TSM ‐ ‐ ‐ F ‐ F ‐ C C C C ‐
Ramp Metering ‐ ‐ ‐ F ‐ F ‐ C C C C ‐
ATM ‐ ‐ ‐ F ‐ F ‐ C C C C ‐
ATM‐HOV ‐ ‐ ‐ F ‐ F ‐ C C C C ‐
NB Ramps at Silver Lake Rd.
No‐Build A A ‐ ‐ A A F ‐ F ‐ ‐ ‐
TSM A A ‐ ‐ A A F ‐ F ‐ ‐ ‐
Ramp Metering A A ‐ ‐ A A F ‐ F ‐ ‐ ‐
ATM A A ‐ ‐ A A F ‐ F ‐ ‐ ‐
ATM‐HOV A A ‐ ‐ A A F ‐ F ‐ ‐ ‐
M‐36 at Whitmore Lake Rd.
No‐Build F F B F F F C C C E E E
TSM F F B F F F C C C E E E
Ramp Metering F F B F F F C C C E E E
ATM F F B F F F C C C D D D
ATM‐HOV F F B F F F C C C E E E
NB Ramp and 6 Mile Road
No‐Build A A ‐ ‐ A A D F F F ‐ F
TSM D D ‐ ‐ B B A C C B ‐ A
Ramp Metering D D ‐ ‐ B B A C C B ‐ A
ATM D D ‐ ‐ B B A C C B ‐ A
ATM‐HOV D D ‐ ‐ B B A C C B ‐ A
NOTE: “-“ in table means turning operation does not exist
4.6.4 Other US‐23 Interchanges
For all of the other intersections at the US‐23 interchanges within the study area, the operation
remains the same as compared to the No‐Build conditions. There are some movements that
operate at LOS E or F during the peak periods. However, these movements were evaluated to
ensure that the short‐term operation and queuing does not interfere with the operation of US‐
23.
20
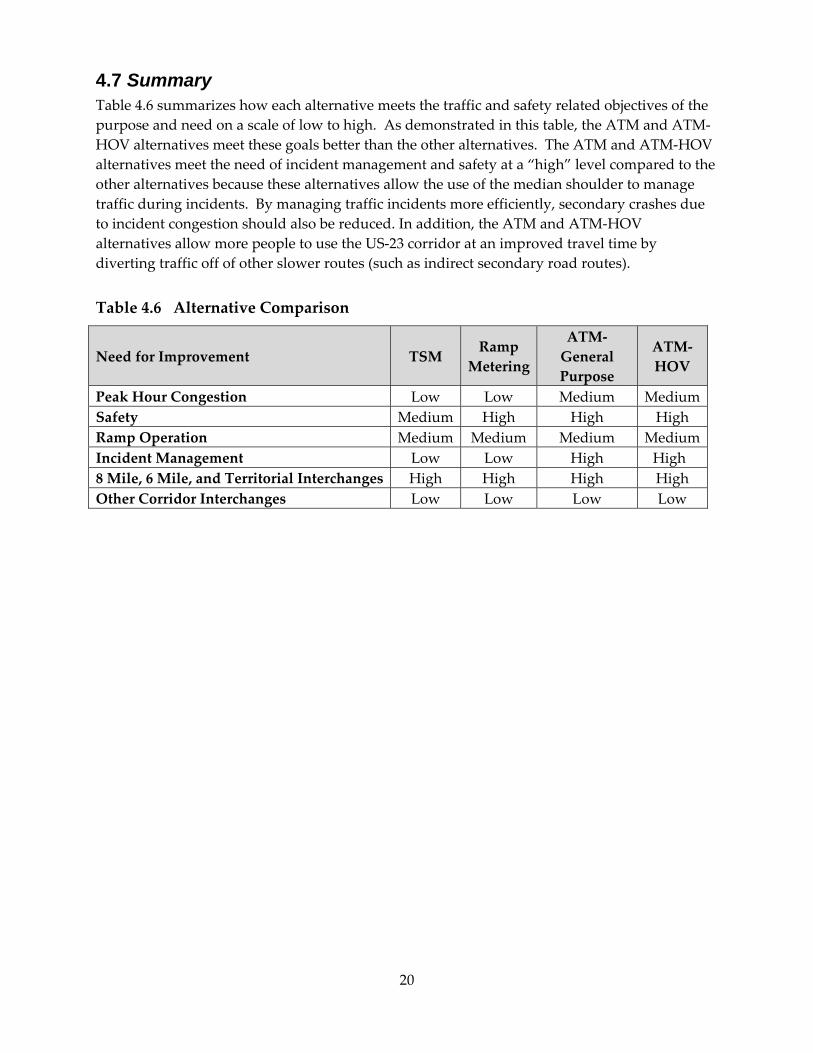
4.7 Summary Table 4.6 summarizes how each alternative meets the traffic and safety related objectives of the
purpose and need on a scale of low to high. As demonstrated in this table, the ATM and ATM‐
HOV alternatives meet these goals better than the other alternatives. The ATM and ATM‐HOV
alternatives meet the need of incident management and safety at a “high” level compared to the
other alternatives because these alternatives allow the use of the median shoulder to manage
traffic during incidents. By managing traffic incidents more efficiently, secondary crashes due
to incident congestion should also be reduced. In addition, the ATM and ATM‐HOV
alternatives allow more people to use the US‐23 corridor at an improved travel time by
diverting traffic off of other slower routes (such as indirect secondary road routes).
Table 4.6 Alternative Comparison
Need for Improvement TSM Ramp
Metering
ATM‐
General
Purpose
ATM‐
HOV
Peak Hour Congestion Low Low Medium Medium
Safety Medium High High High
Ramp Operation Medium Medium Medium Medium
Incident Management Low Low High High
8 Mile, 6 Mile, and Territorial Interchanges High High High High
Other Corridor Interchanges Low Low Low Low
21
5.0 PREFERRED ALTERNATIVE FEATURES
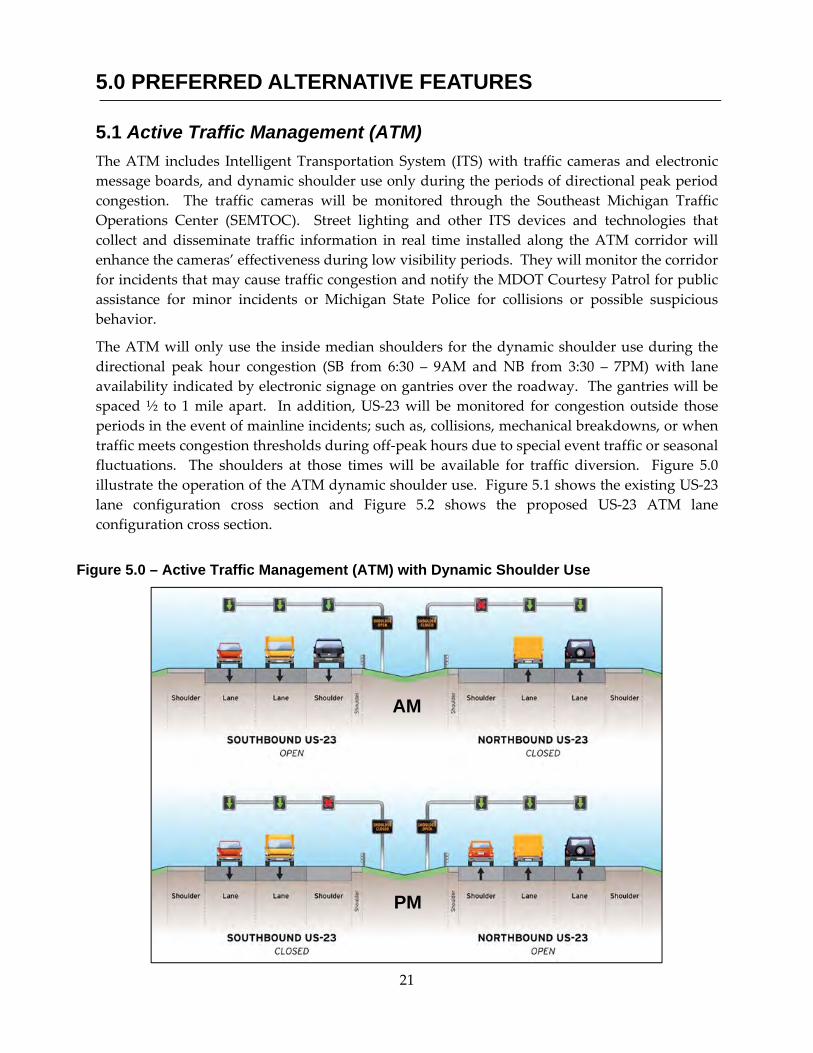
5.1 Active Traffic Management (ATM)
The ATM includes Intelligent Transportation System (ITS) with traffic cameras and electronic
message boards, and dynamic shoulder use only during the periods of directional peak period
congestion. The traffic cameras will be monitored through the Southeast Michigan Traffic
Operations Center (SEMTOC). Street lighting and other ITS devices and technologies that
collect and disseminate traffic information in real time installed along the ATM corridor will
enhance the cameras’ effectiveness during low visibility periods. They will monitor the corridor
for incidents that may cause traffic congestion and notify the MDOT Courtesy Patrol for public
assistance for minor incidents or Michigan State Police for collisions or possible suspicious
behavior.
The ATM will only use the inside median shoulders for the dynamic shoulder use during the
directional peak hour congestion (SB from 6:30 – 9AM and NB from 3:30 – 7PM) with lane
availability indicated by electronic signage on gantries over the roadway. The gantries will be
spaced ½ to 1 mile apart. In addition, US‐23 will be monitored for congestion outside those
periods in the event of mainline incidents; such as, collisions, mechanical breakdowns, or when
traffic meets congestion thresholds during off‐peak hours due to special event traffic or seasonal
fluctuations. The shoulders at those times will be available for traffic diversion. Figure 5.0
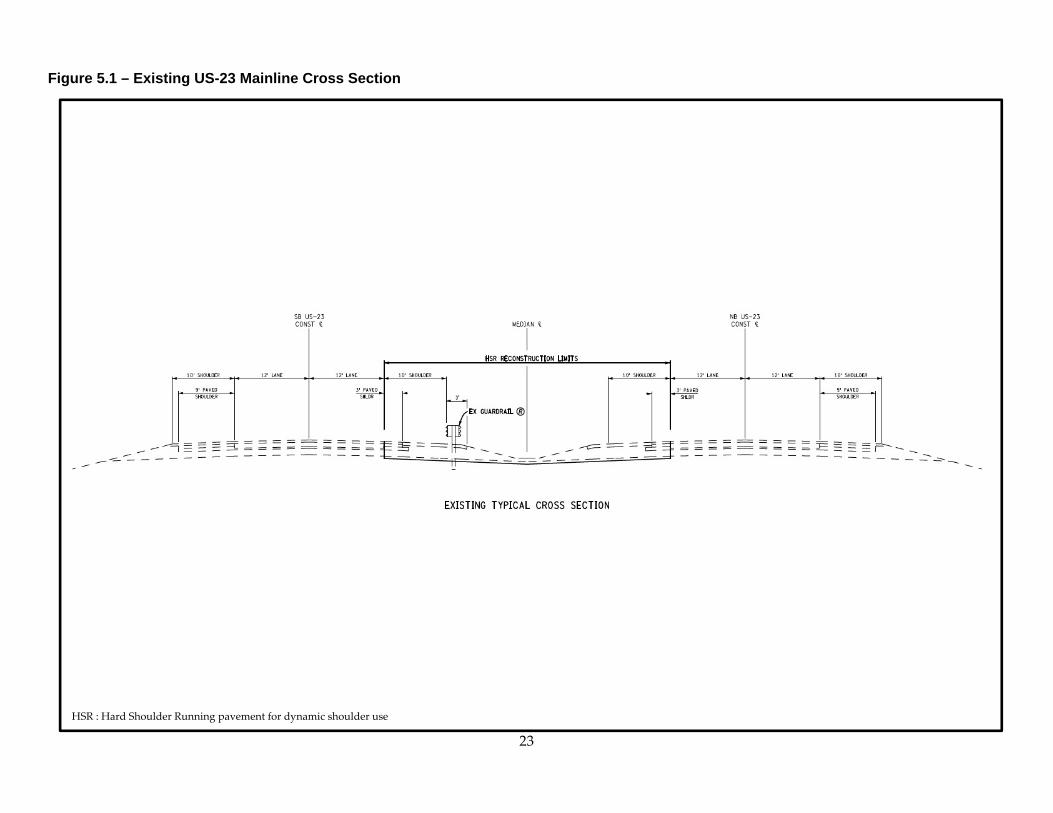
illustrate the operation of the ATM dynamic shoulder use. Figure 5.1 shows the existing US‐23
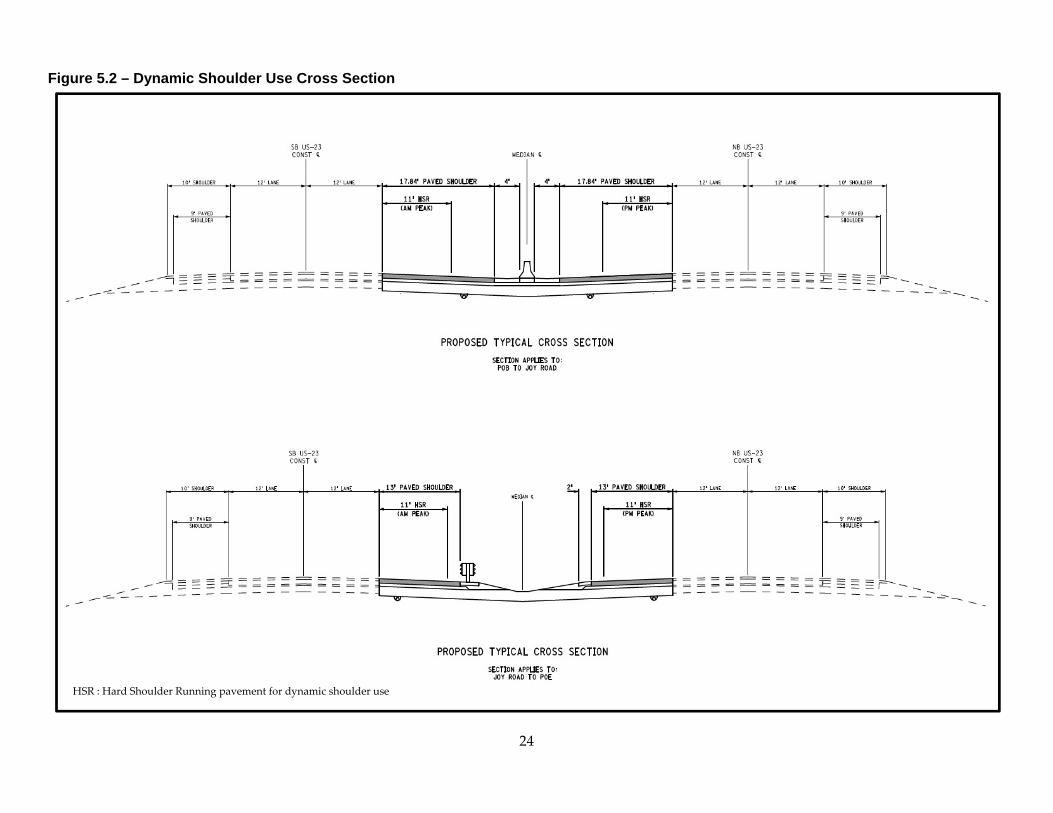
lane configuration cross section and Figure 5.2 shows the proposed US‐23 ATM lane
configuration cross section.
Figure 5.0 – Active Traffic Management (ATM) with Dynamic Shoulder Use
PM
AM

22
23
Figure 5.1 – Existing US-23 Mainline Cross Section
HSR : Hard Shoulder Running pavement for dynamic shoulder use
24
Figure 5.2 – Dynamic Shoulder Use Cross Section
HSR : Hard Shoulder Running pavement for dynamic shoulder use
25
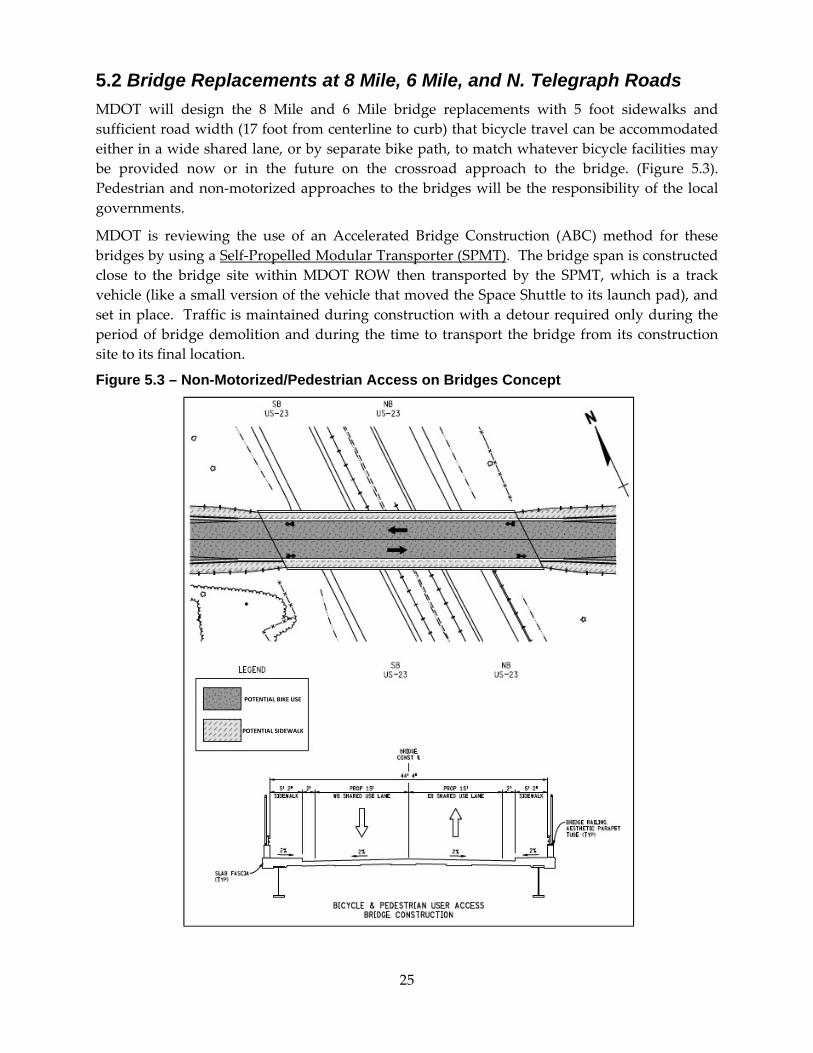
5.2 Bridge Replacements at 8 Mile, 6 Mile, and N. Telegraph Roads
MDOT will design the 8 Mile and 6 Mile bridge replacements with 5 foot sidewalks and
sufficient road width (17 foot from centerline to curb) that bicycle travel can be accommodated
either in a wide shared lane, or by separate bike path, to match whatever bicycle facilities may
be provided now or in the future on the crossroad approach to the bridge. (Figure 5.3).
Pedestrian and non‐motorized approaches to the bridges will be the responsibility of the local
governments.
MDOT is reviewing the use of an Accelerated Bridge Construction (ABC) method for these
bridges by using a Self‐Propelled Modular Transporter (SPMT). The bridge span is constructed
close to the bridge site within MDOT ROW then transported by the SPMT, which is a track
vehicle (like a small version of the vehicle that moved the Space Shuttle to its launch pad), and
set in place. Traffic is maintained during construction with a detour required only during the
period of bridge demolition and during the time to transport the bridge from its construction
site to its final location.
Figure 5.3 – Non-Motorized/Pedestrian Access on Bridges Concept
POTENTIAL BIKE USE
POTENTIAL SIDEWALK
26
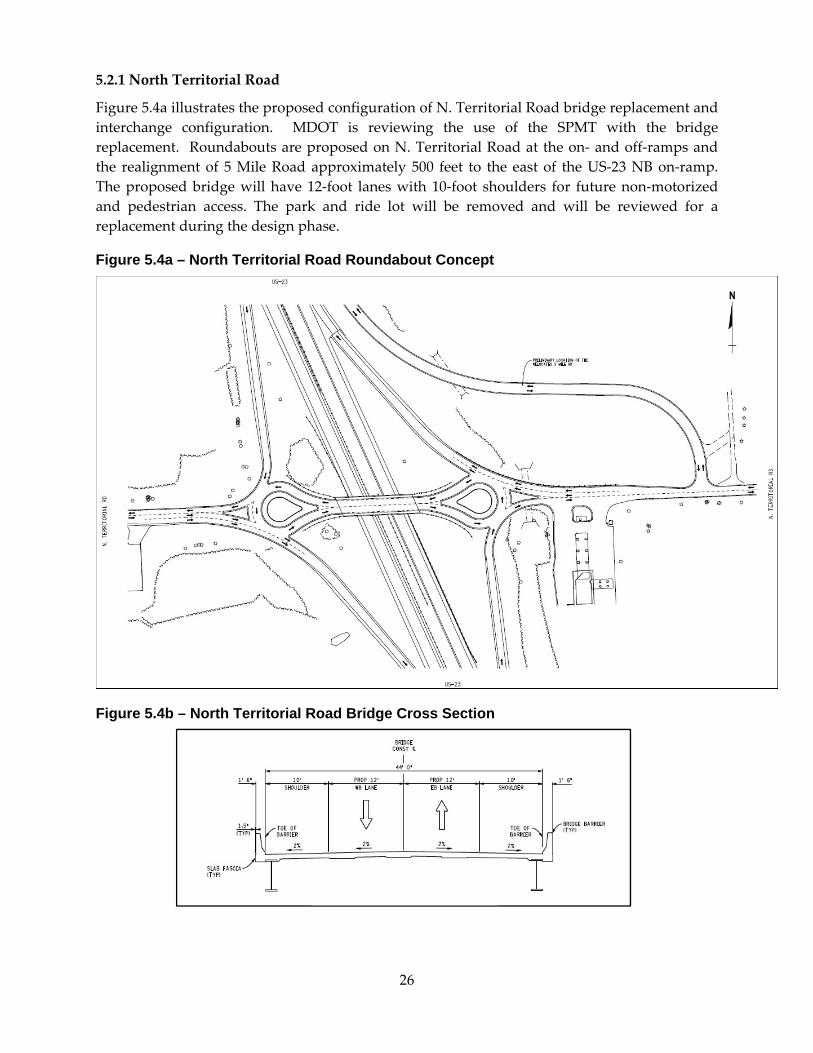
5.2.1 North Territorial Road
Figure 5.4a illustrates the proposed configuration of N. Territorial Road bridge replacement and
interchange configuration. MDOT is reviewing the use of the SPMT with the bridge
replacement. Roundabouts are proposed on N. Territorial Road at the on‐ and off‐ramps and
the realignment of 5 Mile Road approximately 500 feet to the east of the US‐23 NB on‐ramp.
The proposed bridge will have 12‐foot lanes with 10‐foot shoulders for future non‐motorized
and pedestrian access. The park and ride lot will be removed and will be reviewed for a
replacement during the design phase.
Figure 5.4a – North Territorial Road Roundabout Concept
Figure 5.4b – North Territorial Road Bridge Cross Section
27
5.2.2 8 Mile Road
Figures 5.5a and 5.5b respectively illustrate the proposed signal controlled intersection and
roundabout configuration options of the 8 Mile Road interchange. The specific option will be
chosen after public comment and further design analysis. The new bridge will be realigned
north of the current bridge in both options to accommodate the widened SB US‐23 bridge over
the railroad with the SB on‐ramp and dynamic shoulder use lane. Both US‐23 bridges over the
railroad (“A” in graphics) will be raised to meet the current under‐clearance specification.
MDOT is considering a future park and ride lot in the SW quadrant of the interchange in
partnership with the Ann Arbor Area Transportation Authority (AAATA). The site is rated
Low Risk for Environmental Contamination (Section 6.10) for this project, but will require a
detailed analysis if the partner agencies choose to pursue this site.
Figure 5.5a – 8 Mile Road Interchange with Signaled Intersections Concept
Figure 5.5b – 8 Mile Road Interchange with Roundabouts Concept
A A
28
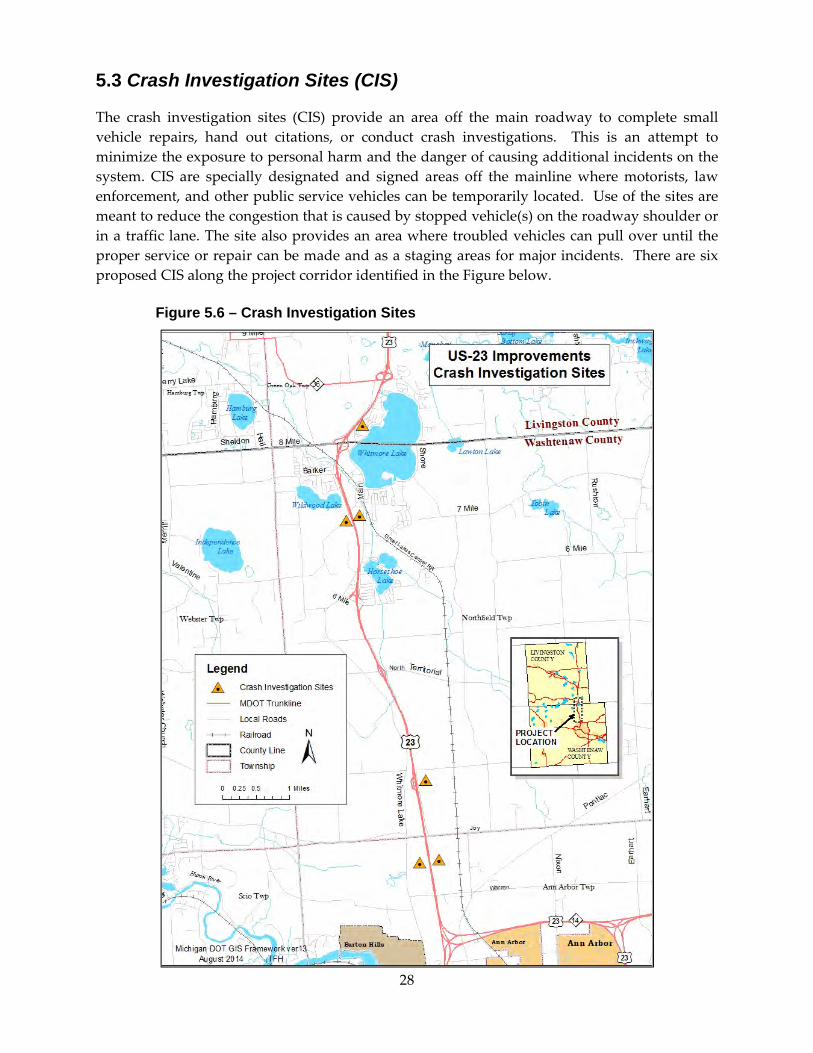
5.3 Crash Investigation Sites (CIS)
The crash investigation sites (CIS) provide an area off the main roadway to complete small
vehicle repairs, hand out citations, or conduct crash investigations. This is an attempt to
minimize the exposure to personal harm and the danger of causing additional incidents on the
system. CIS are specially designated and signed areas off the mainline where motorists, law
enforcement, and other public service vehicles can be temporarily located. Use of the sites are
meant to reduce the congestion that is caused by stopped vehicle(s) on the roadway shoulder or
in a traffic lane. The site also provides an area where troubled vehicles can pull over until the
proper service or repair can be made and as a staging areas for major incidents. There are six
proposed CIS along the project corridor identified in the Figure below.
Figure 5.6 – Crash Investigation Sites
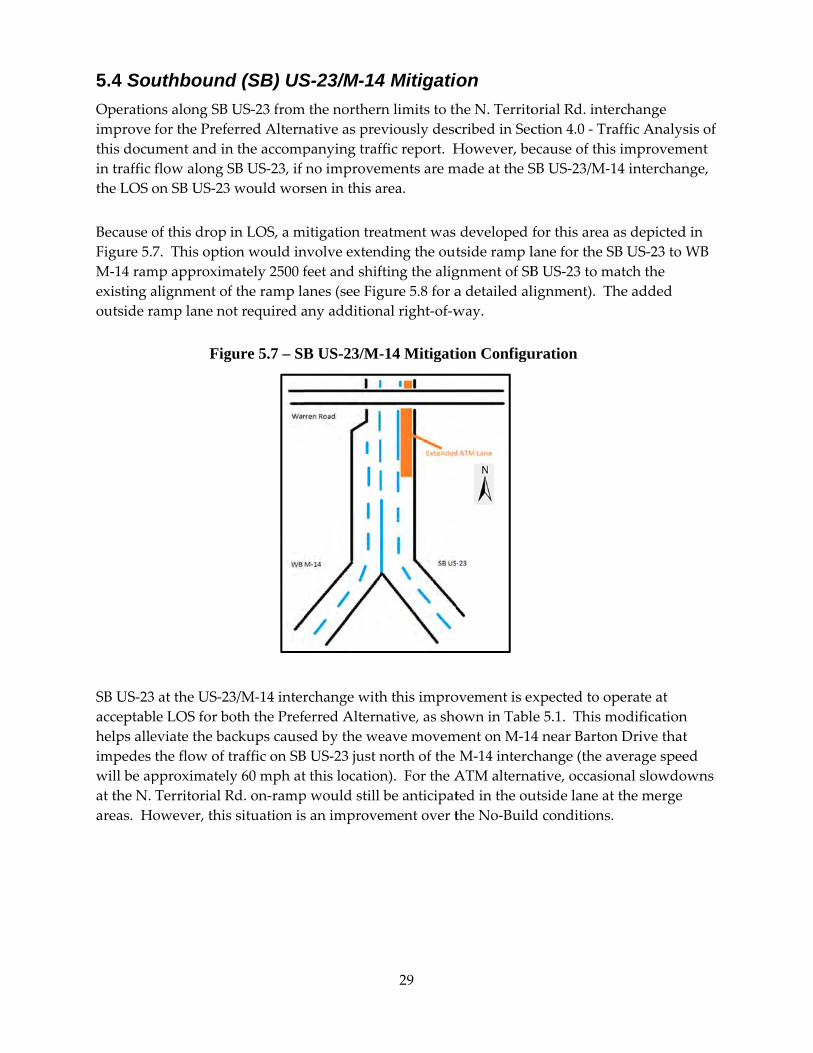
5.4 Sou
Operatio
improve
this docu
in traffic
the LOS
Because o
Figure 5.
M‐14 ram
existing a
outside r
SB US‐23
acceptab
helps alle
impedes
will be ap
at the N.
areas. H
uthbound
ons along SB
for the Prefe
ument and in
flow along S
on SB US‐23
of this drop
7. This opti
mp approxim
alignment of
ramp lane no
Fig
3 at the US‐2
le LOS for b
eviate the ba
the flow of
pproximatel
Territorial R
However, this
d (SB) US
US‐23 from
erred Altern
n the accomp
SB US‐23, if
3 would wor
in LOS, a m
on would in
mately 2500 f
f the ramp la
ot required a
gure 5.7 – SB
23/M‐14 inter
both the Pref
ackups cause
traffic on SB
ly 60 mph at
Rd. on‐ramp
s situation is
S-23/M-14
m the norther
native as pre
panying traf
no improve
rsen in this a
mitigation tre
nvolve exten
feet and shif
anes (see Fig
any addition
B US-23/M-
rchange with
ferred Altern
ed by the we
B US‐23 just n
t this location
p would still
s an improve
29
4 Mitigati
rn limits to th
eviously desc
ffic report. H
ments are m
area.
eatment was
nding the out
fting the alig
gure 5.8 for a
nal right‐of‐w
-14 Mitigati
h this impro
native, as sho
eave movem
north of the
n). For the A
be anticipat
ement over t
ion
he N. Territo
cribed in Sec
However, be
made at the S
developed f
tside ramp l
gnment of SB
a detailed al
way.
ion Configu
ovement is e
own in Tabl
ment on M‐14
M‐14 interc
ATM alterna
ted in the ou
the No‐Build
orial Rd. inte
ction 4.0 ‐ Tr
ecause of thi
SB US‐23/M‐
for this area
lane for the S
B US‐23 to m
lignment). T
uration
xpected to o
le 5.1. This m
4 near Barto
change (the a
ative, occasio
utside lane a
d conditions
erchange
raffic Analys
is improvem
‐14 interchan
a as depicted
SB US‐23 to
match the
The added
operate at
modification
on Drive that
average spee
onal slowdo
at the merge
s.
sis of
ment
nge,
d in
WB
n
t
ed
owns
30
Table 5.1: VISSIM Results for SB US‐23 for AM Peak Hour for ATM with US‐23/M‐14
Treatment (2040)
Description Facility Type
Average
Density
per lane
Average
Speed
LOS
SB US-23 at N. Territorial Rd. Segment 25.60 55 C SB US-23 Entrance Ramp at N. Territorial Rd. Ramp 40.29 31 E
SB US-23 Between N. Territorial Rd. and Warren Rd. Segment 26.02 (28.99*)
61 (59*)
D (D*)
SB US-23 Between Warren Rd. and M-14 Segment 25.07 (52.60*)
59 (34*)
C (F*)
SB US-23 to WB M-14 Ramp 77.89 33 F SB US-23 to EB M-14/(SB US-23) Ramp 25.63 61 C WB M-14 at Barton Dr./Main St. Weave 93.41 11 F *indicates performance of this segment without the mitigation treatment.
31
Figure 5.8 – US-23/M-14 Mitigation Detail

32
Page intentionally left blank
33
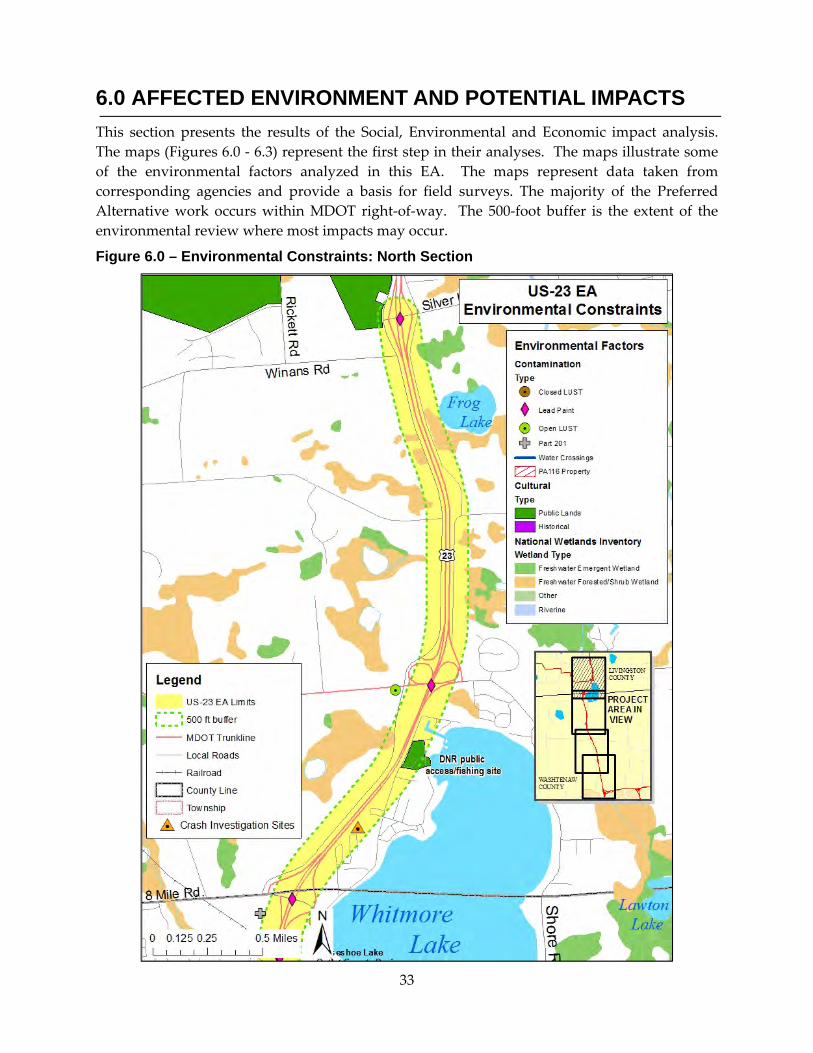
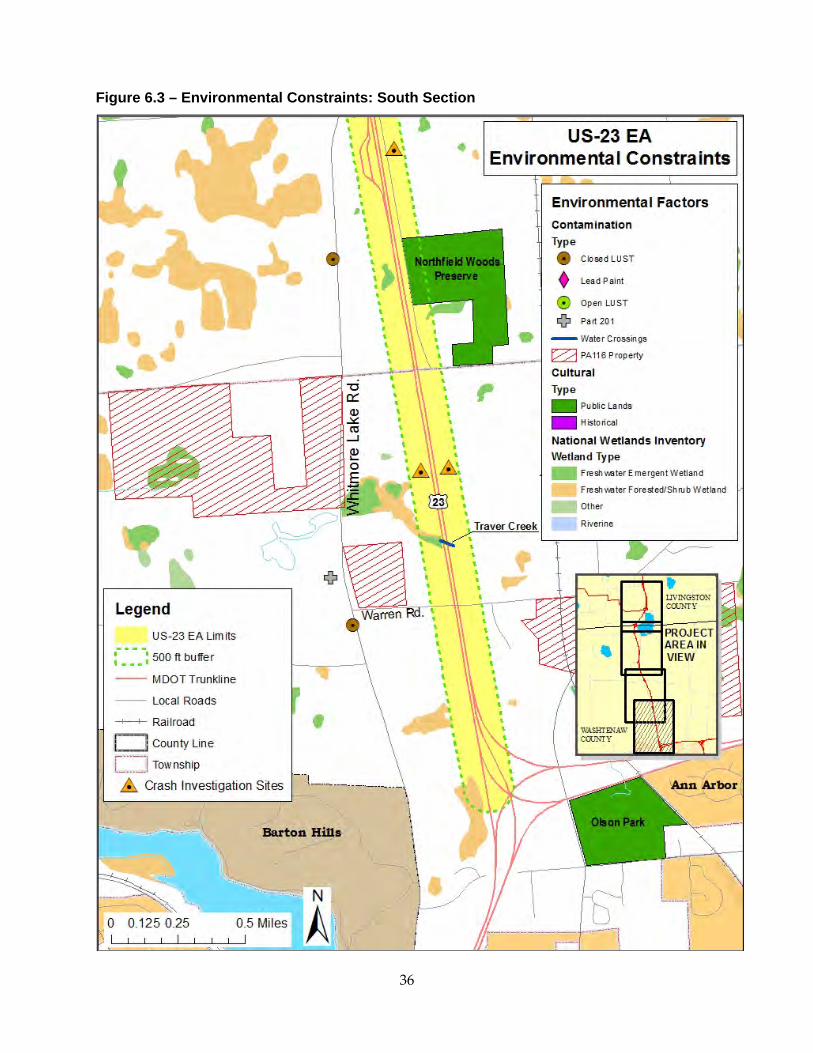
6.0 AFFECTED ENVIRONMENT AND POTENTIAL IMPACTS This section presents the results of the Social, Environmental and Economic impact analysis.
The maps (Figures 6.0 ‐ 6.3) represent the first step in their analyses. The maps illustrate some
of the environmental factors analyzed in this EA. The maps represent data taken from
corresponding agencies and provide a basis for field surveys. The majority of the Preferred
Alternative work occurs within MDOT right‐of‐way. The 500‐foot buffer is the extent of the
environmental review where most impacts may occur.
Figure 6.0 – Environmental Constraints: North Section
34
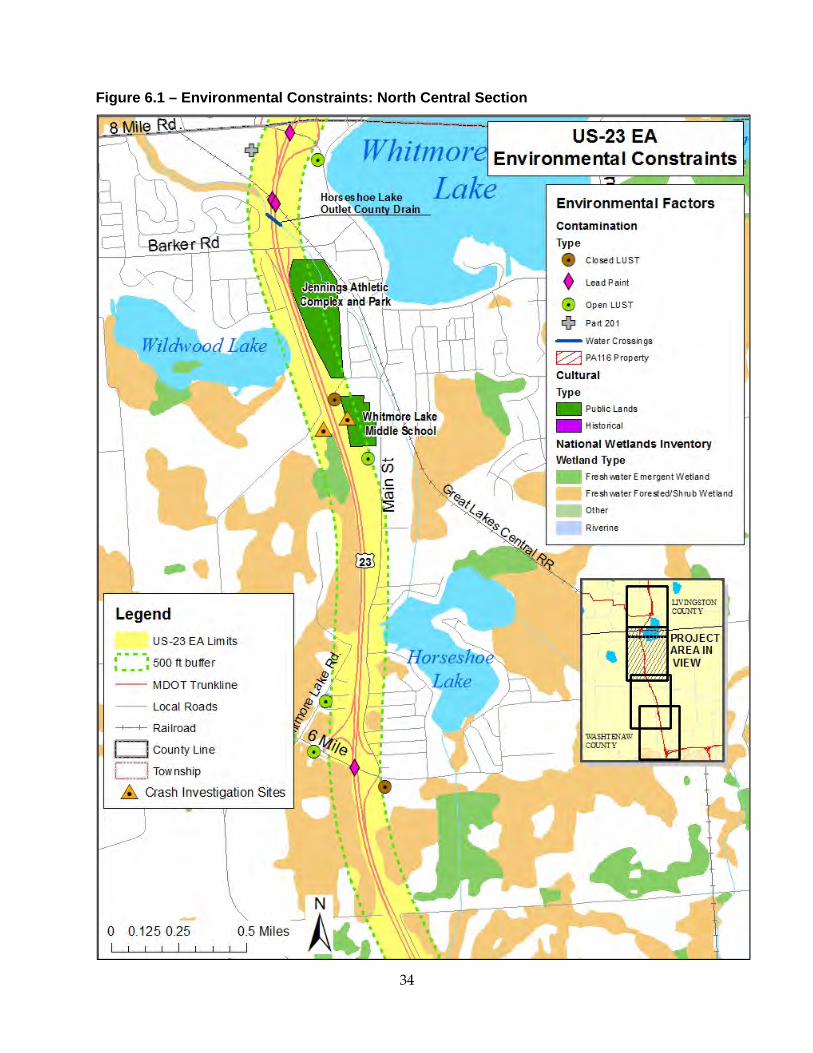
Figure 6.1 – Environmental Constraints: North Central Section
35
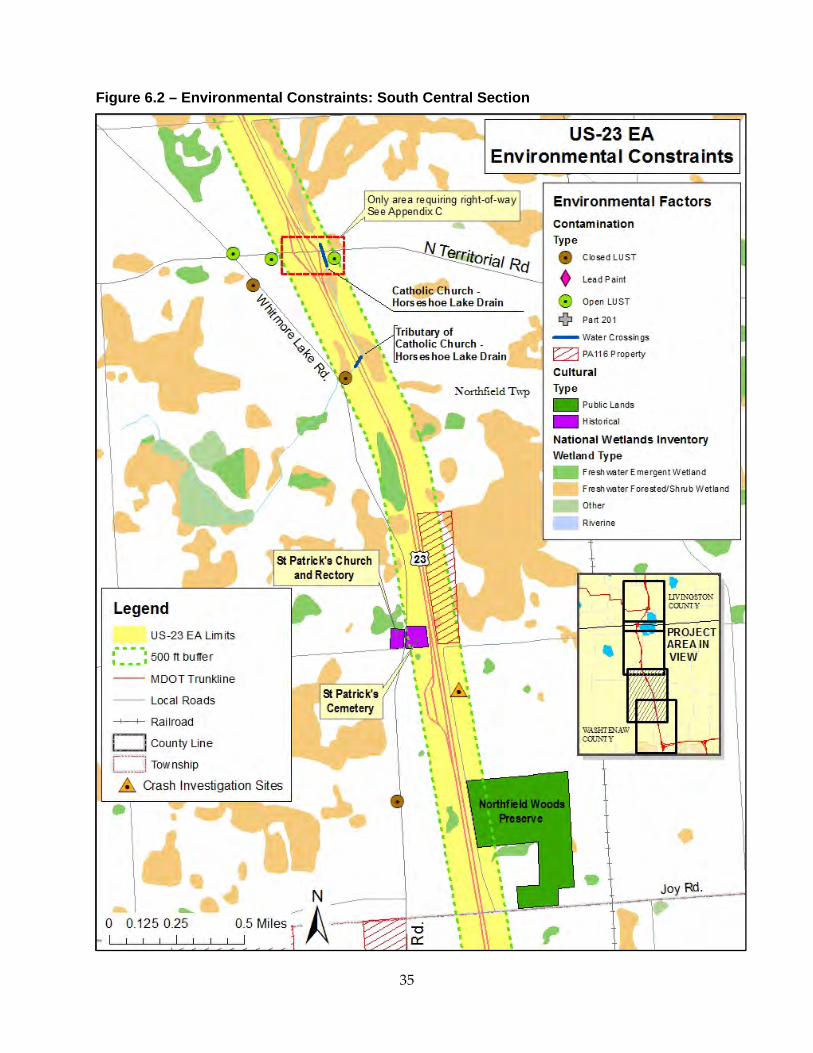
Figure 6.2 – Environmental Constraints: South Central Section
36
Figure 6.3 – Environmental Constraints: South Section
37
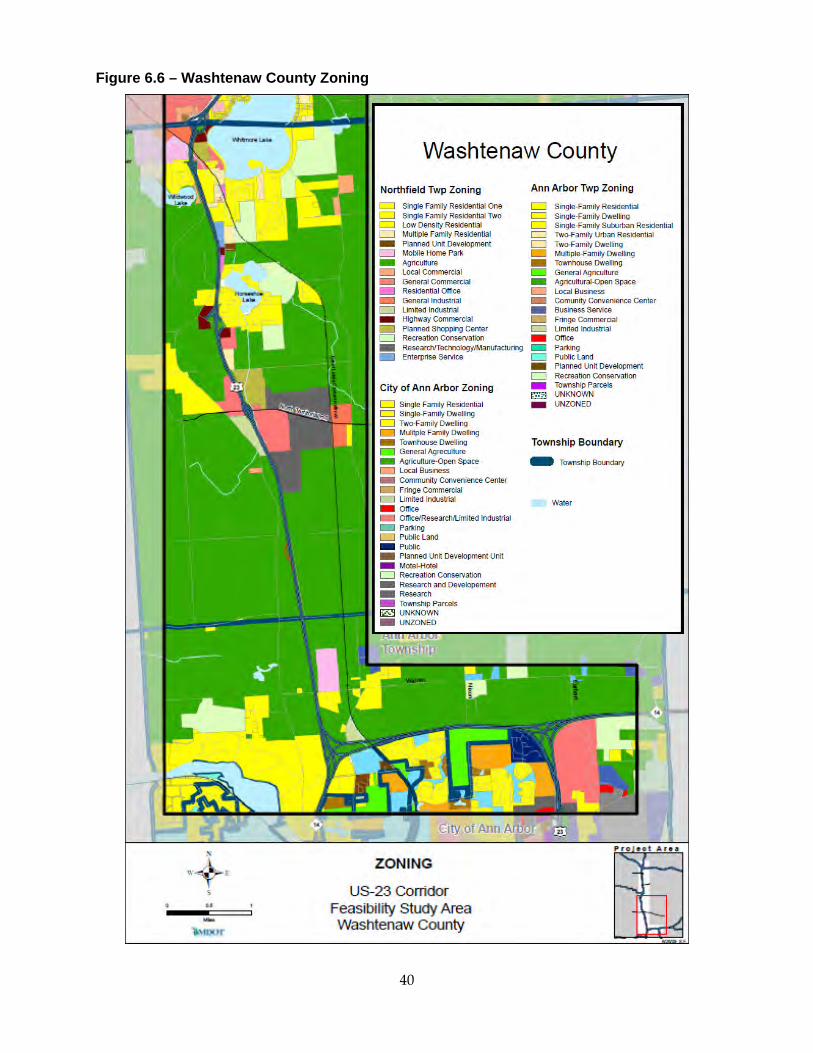
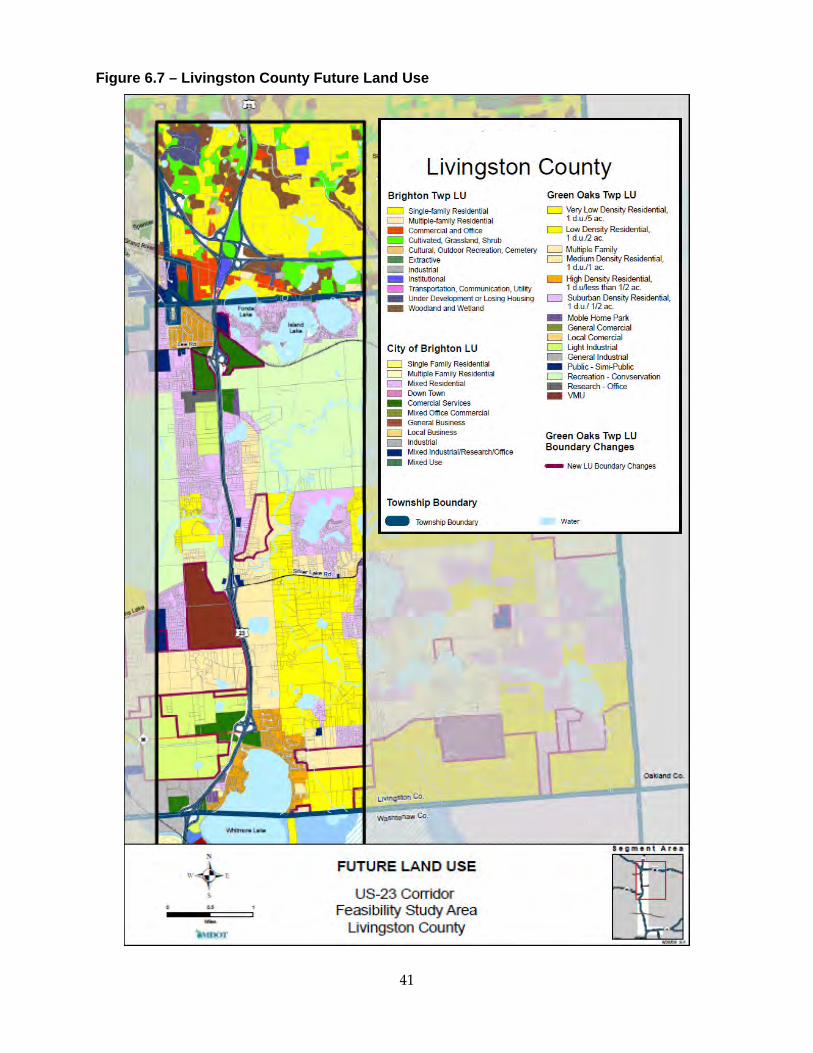
6.1 Land Use Impacts
The proposed project is located on the US‐23 corridor in Livingston and Washtenaw Counties.
The existing land use adjacent to the corridor in the project area consists of a broad range of
land uses. They range from natural open space and agricultural to industrial and commercial
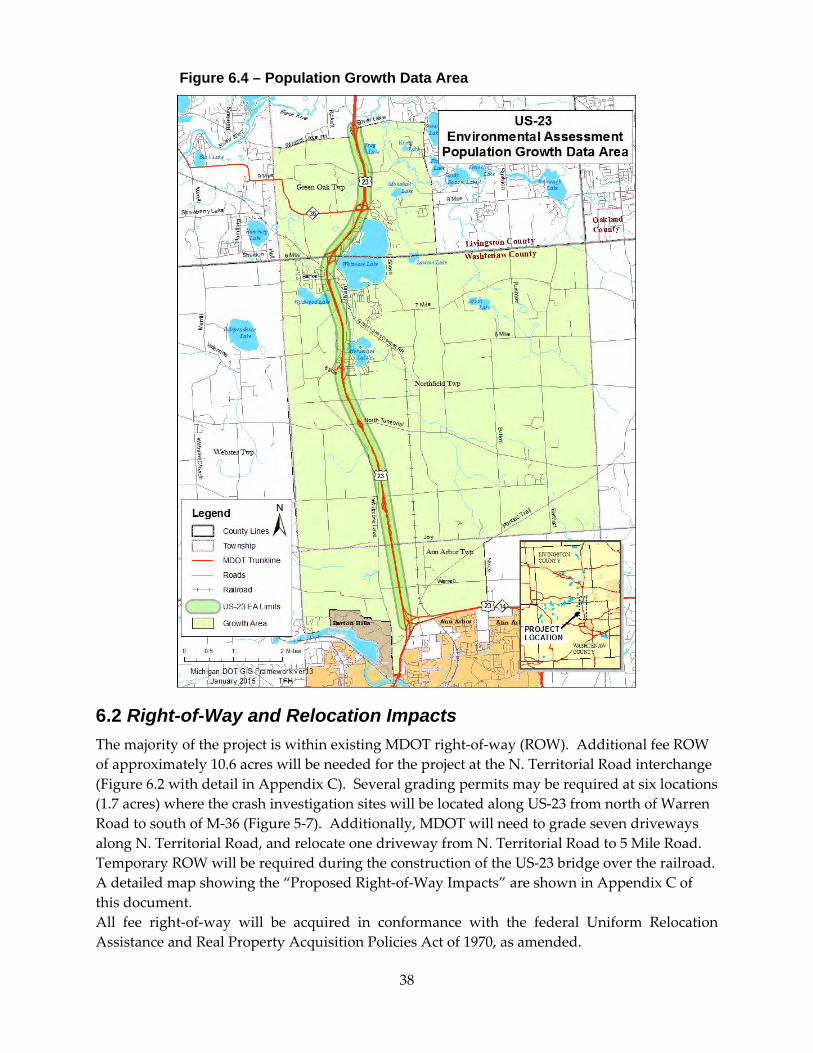
retail. Current zoning and future land use plans (Figures 6.5‐6.8)10 are in place for the local
jurisdictions along the route. The local units of government located north to south along the
corridor include Green Oak Township in Livingston County at the northern end of the project
and Northfield Township, Ann Arbor Township and the City of Ann Arbor in Washtenaw
County at the south terminus of the project area. Please see Figure 1.0 ‐ Environmental
Assessment Study Corridor, for a detail of the study limits.
The land uses in Green Oak Township section of the project area include a mix of commercial,
light industrial and residential uses. The area immediately adjacent to the highway is almost
completely developed.
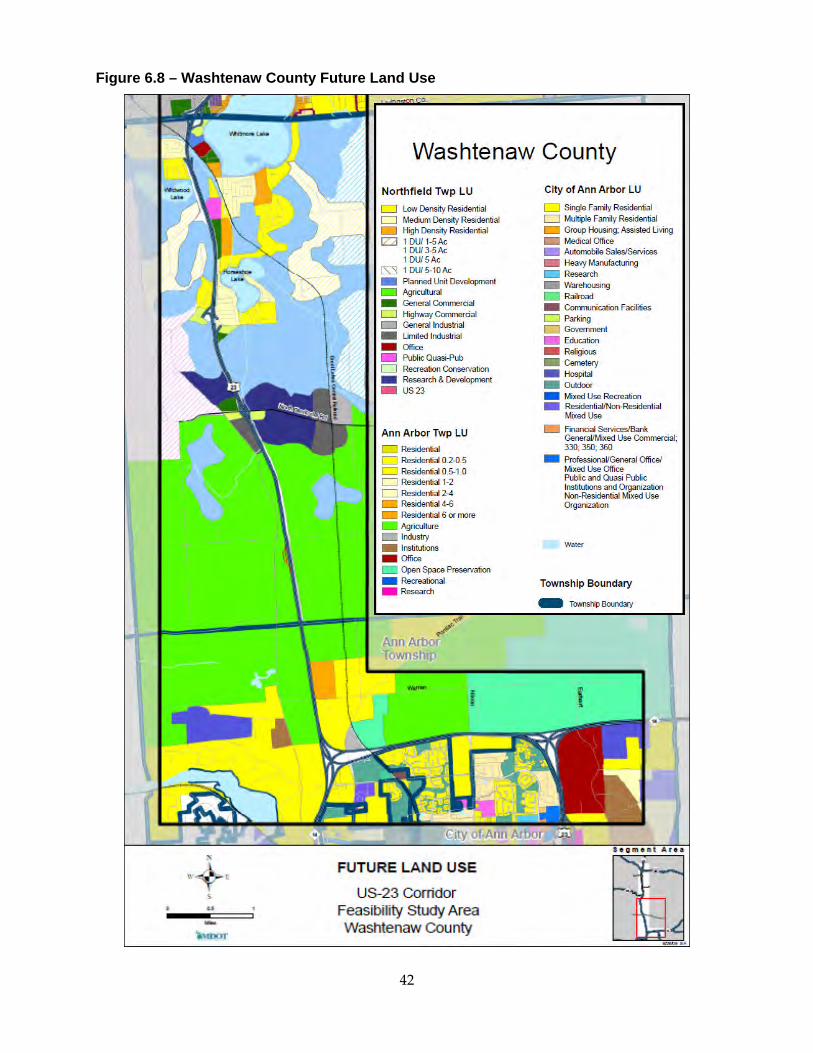
The Washtenaw County portion of the proposed project includes Northfield Township, Ann
Arbor Township and the City of Ann Arbor. The land uses along this segment of corridor are
more diverse than in Livingston County. The northern area of the county is made up of dense
residential and industrial uses. Moving south along the corridor the land use transitions into
open space and agricultural uses. As you approach the City of Ann Arbor the use then
transitions back to residential and commercial uses.
The review of the current zoning maps and future land uses plans showed that the proposed
project is consistent with land use patterns in the area and should have no impact on future
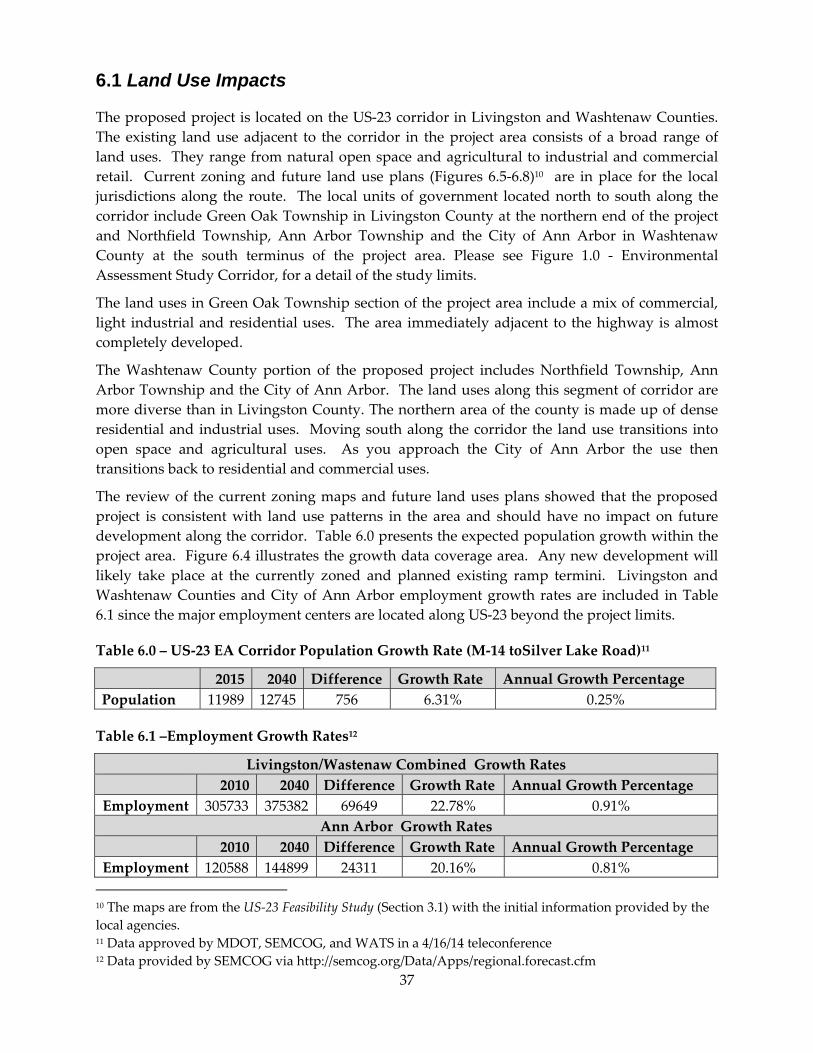
development along the corridor. Table 6.0 presents the expected population growth within the
project area. Figure 6.4 illustrates the growth data coverage area. Any new development will
likely take place at the currently zoned and planned existing ramp termini. Livingston and
Washtenaw Counties and City of Ann Arbor employment growth rates are included in Table
6.1 since the major employment centers are located along US‐23 beyond the project limits.
Table 6.0 – US‐23 EA Corridor Population Growth Rate (M‐14 toSilver Lake Road)11
2015 2040 Difference Growth Rate Annual Growth Percentage
Population 11989 12745 756 6.31% 0.25%
Table 6.1 –Employment Growth Rates12
Livingston/Wastenaw Combined Growth Rates
2010 2040 Difference Growth Rate Annual Growth Percentage
Employment 305733 375382 69649 22.78% 0.91%
Ann Arbor Growth Rates
2010 2040 Difference Growth Rate Annual Growth Percentage
Employment 120588 144899 24311 20.16% 0.81%
10 The maps are from the US‐23 Feasibility Study (Section 3.1) with the initial information provided by the
local agencies. 11 Data approved by MDOT, SEMCOG, and WATS in a 4/16/14 teleconference 12 Data provided by SEMCOG via http://semcog.org/Data/Apps/regional.forecast.cfm
38
Figure 6.4 – Population Growth Data Area
6.2 Right-of-Way and Relocation Impacts
The majority of the project is within existing MDOT right‐of‐way (ROW). Additional fee ROW
of approximately 10.6 acres will be needed for the project at the N. Territorial Road interchange
(Figure 6.2 with detail in Appendix C). Several grading permits may be required at six locations
(1.7 acres) where the crash investigation sites will be located along US‐23 from north of Warren
Road to south of M‐36 (Figure 5‐7). Additionally, MDOT will need to grade seven driveways
along N. Territorial Road, and relocate one driveway from N. Territorial Road to 5 Mile Road.
Temporary ROW will be required during the construction of the US‐23 bridge over the railroad.
A detailed map showing the “Proposed Right‐of‐Way Impacts” are shown in Appendix C of
this document.
All fee right‐of‐way will be acquired in conformance with the federal Uniform Relocation
Assistance and Real Property Acquisition Policies Act of 1970, as amended.
39
Figure 6.5 – Livingston County Zoning
40
Figure 6.6 – Washtenaw County Zoning
41
Figure 6.7 – Livingston County Future Land Use
42
Figure 6.8 – Washtenaw County Future Land Use
43
6.3 Farmland and Agriculture Impacts
There is not expected to be any impacts associated with the U.S. Department of Agriculture
7 CFR Part 658 ‐ Farmland Protection Policy Act (FPPA). There is expected to be right‐of‐way
(ROW) required for the 5 Mile Road relocation to North Territorial Road. This work will take
place in the northeast quadrant of the US‐23/North Territorial Road interchange. The amount of
ROW required may be well over one acre.
All of the property at the US‐23/North Territorial Road interchange is Prime, Unique or Locally
important. However, none of the parcels at the North Territorial Road interchange are zoned
Agriculture or Forestry. The zoning in the NE quadrant of the interchange is General
Commercial and Planned Shopping Center. There will not be any impact to Agriculture or
Forestry zoned parcels. Therefore, coordination with the USDA/NRCS will not be required.
There are seven Farmland and Open Space Preservation Program, Part 361 of the Natural
Resources and Environmental Protection act, 1994 Act 451(formerly known as PA116) enrolled
parcels in the vicinity of the project limits (Figures 6.2 and 6.3). Of these seven parcels, only one
of them is directly adjacent to the project limits. The adjacent parcel is located in Northfield
Township section 29 and is on the east side of US‐23. There is no anticipated fee ROW that will
be required at the parcel. PA116 enrolled parcels cannot be impacted by borrow or wetland
mitigation sites.
6.4 Social and Economic Effects
6.4.1 Social
The proposed project will not cause any long‐term negative impacts on low‐income, minority,
ethnic, elderly, people with disabilities, or on area schools, churches, or emergency services
(police, fire, ambulance). Currently, there are no non‐motorized paths adjacent to US‐23.
However, the proposed improvements to US‐23 will not preclude future opportunities for non‐
motorized paths along 5 Mile and 6 Mile Roads, and North Territorial Road. Any future non‐
motorized paths will be done in accordance with the 1990 Americans with Disabilities Act
(ADA). No neighborhoods within the project area will be permanently separated from
community facilities or services. Access for motorists, school buses, and emergency vehicles
will be maintained during construction. MDOT will coordinate with local officials in providing
updated information to assist all motorists and emergency service vehicles.
Construction on the US‐23 Mainline and the replacement of three structures over US‐23 is
expected to last two construction seasons. During construction, traffic will be maintained on
US‐23; however, there may be lane closures for short periods of time on US‐23. MDOT will
also need to replace three bridges (North Territorial Road, 6 Mile Road, 8 Mile Road) over US‐
23. During the replacement of the bridges, traffic will need to be detoured to the next bridge
crossing. In order to alleviate traffic back‐ups and travel distances, MDOT will have at least one
of the three bridges open to traffic while the other bridges are being constructed. MDOT is
44
replacing the US‐23 bridges over the railroad and will maintain traffic on US‐23 during their
replacement.
The construction of the proposed project will cause temporary impacts to the businesses,
community services, motorists and emergency services during the construction of the US‐23
mainline and the three bridges over US‐23. Thus, motorists (including emergency vehicles) will
incur longer travel times and distances in reaching their destinations. Access will be maintained
to area businesses and residents located on each side of the roadway during construction. The
proposed maintaining traffic concept is found in Appendix B.
Mitigation measures to address these temporary impacts include: minimizing disruption of
traffic in the construction area by coordinating with local agencies and the community; placing
signs in all of the construction areas notifying motorists and pedestrians; require construction
equipment to have mufflers in good working order and portable compressors must meet
federal noise‐level standards for equipment; and require contractors to use adequate dust‐
control measures during construction.
As part of an on‐going coordination effort, MDOT will continue to coordinate with the local
officials and the community in providing updated information about the proposed project,
including updates on lane closures or detour routes.
6.4.2 Economics
The construction for the proposed US‐23 project will likely take two years to complete the
improvements on US‐23 and to construct the three bridges that span over US‐23. The proposed
project will have no long‐term effect on the local economy or tax base in the area. The proposed
ATM with its dynamic shoulder use during the weekday directional peak travel times will
provide a savings of approximately $145 million dollars ($30M vs. $175M) over the construction
of a third general purpose travel lane. Access to area businesses and residents will be
maintained during construction.
6.5 Environmental Justice
The purpose of Executive Order 12898 on Federal Actions to address Environmental Justice in
Minority and Low‐Income Populations is to identify, address, and avoid disproportionately
high and adverse human health or environmental effects on minority and low‐income
populations.
An analysis of the U.S. Census Data (Table 6.2) along with field reviews of the project area
determined that there were minority and low‐income populations and non‐minority population
groups who reside in the townships and utilize the roadway and existing bridges in the project
area. The proposed project will not require residential or commercial displacements. Fee ROW,
grading permits and consent to grade driveways will only be required in front of commercial
properties in the vicinity of the N. Territorial Road bridge.
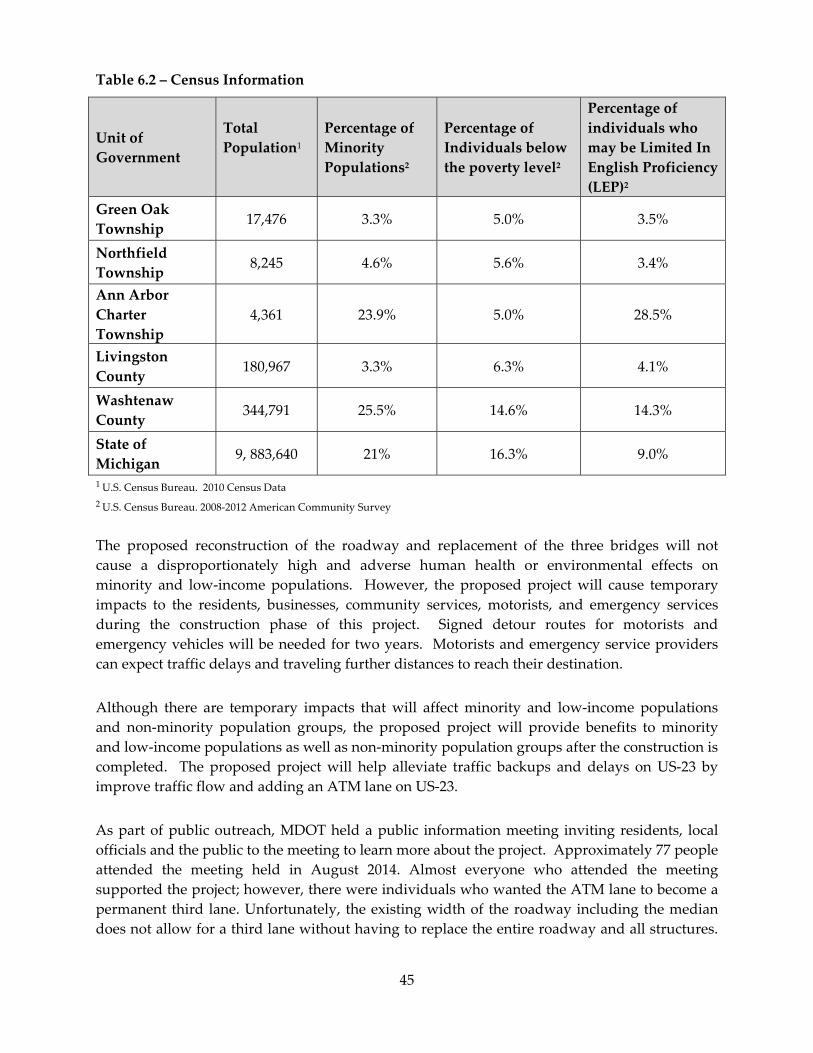
45
Table 6.2 – Census Information
Unit of
Government
Total
Population1
Percentage of
Minority
Populations2
Percentage of
Individuals below
the poverty level2
Percentage of
individuals who
may be Limited In
English Proficiency
(LEP)2
Green Oak
Township 17,476 3.3% 5.0% 3.5%
Northfield
Township 8,245 4.6% 5.6% 3.4%
Ann Arbor
Charter
Township
4,361 23.9% 5.0% 28.5%
Livingston
County 180,967 3.3% 6.3% 4.1%
Washtenaw
County 344,791 25.5% 14.6% 14.3%
State of
Michigan 9, 883,640 21% 16.3% 9.0%
1 U.S. Census Bureau. 2010 Census Data
2 U.S. Census Bureau. 2008‐2012 American Community Survey
The proposed reconstruction of the roadway and replacement of the three bridges will not
cause a disproportionately high and adverse human health or environmental effects on
minority and low‐income populations. However, the proposed project will cause temporary
impacts to the residents, businesses, community services, motorists, and emergency services
during the construction phase of this project. Signed detour routes for motorists and
emergency vehicles will be needed for two years. Motorists and emergency service providers
can expect traffic delays and traveling further distances to reach their destination.
Although there are temporary impacts that will affect minority and low‐income populations
and non‐minority population groups, the proposed project will provide benefits to minority
and low‐income populations as well as non‐minority population groups after the construction is
completed. The proposed project will help alleviate traffic backups and delays on US‐23 by
improve traffic flow and adding an ATM lane on US‐23.
As part of public outreach, MDOT held a public information meeting inviting residents, local
officials and the public to the meeting to learn more about the project. Approximately 77 people
attended the meeting held in August 2014. Almost everyone who attended the meeting
supported the project; however, there were individuals who wanted the ATM lane to become a
permanent third lane. Unfortunately, the existing width of the roadway including the median
does not allow for a third lane without having to replace the entire roadway and all structures.
46
There was another concern about traffic back‐ups at US‐23 and M‐36, once the ATM lane is
added. MDOT will continue to monitor traffic after the ATM is opened to traffic.
MDOT did not receive any requests to have translation services at the public information
meeting or to have brochures or other materials translated into another language. If MDOT
does receive a request for translation services during subsequent phases of this project, MDOT
will make translation services available.
Although the proposed project will not displace or cause disproportionate effects on minority
and low‐income populations within the project area, a continuing effort will be made to identify
any additional impacts that may have a disproportionately high and adverse effect on minority
and low‐income population groups during subsequent phases of this project. If additional
impacts are identified, every effort will be made to actively involve the impacted groups in the
project development process.
6.6 Pedestrian and Non-motorized Travel
There are no existing pedestrian/non‐motorized facilities on or approaching the bridges being
replaced at 6 Mile, 8 Mile, and N. Territorial Roads. The existing bridges respectively have
paved shoulders that are 3 feet 9 inches, 3 feet 5 inches, and 2 feet 8 inches. The Washtenaw
Area Transportation Study’s (WATS) Non‐Motorized Plan for Washtenaw County (2006) lists the
N. Territorial Road for bicycle access in the “Future Bike Improvements” table (Table 11, page
49). Moreover, the comments received at the December 12, 2013 and August 14, 2014 public
meetings suggested that the 8 Mile Road and 6 Mile Road bridges also be designed with
pedestrian and non‐motorized facilities. MDOT will design these bridge replacements with 15
foot shared use lanes with 2‐foot offsets allowing for bicycle travel, and 5 foot sidewalks (Figure
5.3). Pedestrian and non‐motorized approaches to the bridges will be the responsibility of the
local governments.
6.7 Parks and Recreation – 4(f) Properties
No impacts are anticipated to any public recreational property protected under Section 4(f) of
the Department of Transportation Act. Several public recreational properties have been
identified directly adjacent to and near the proposed project limits (Figures 6.0‐6.3):
1. Huron Meadows Metro Park is located on the west side of US‐23, north of
Winans Lake Road
2. DNR public access/fishing site is located on the east side of US‐23, south of 9
Mile Road (at Whitmore Lake)
3. Whitmore Lakes Public Schools and Jennings Athletic Complex and Park
property is located on the east side of US‐23 from south of Baker to south of
Jennings Road
47
4. Northfield Woods Preserve is located on the east side of US‐23, north of Joy
Road
And just outside the project limits:
5. Olson Park is located on the south side of M‐14/US‐23, east side of Pontiac
Trail
6. Island Lake State Recreation Area is located on the east side of US‐23, north
of Silver Lake Rd (north of the map’s extent in Figure 6.0)
The preferred alternative does not include ROW, grading permits, easements or consents to
grade from any of the properties described above. Access to all public recreational properties
will be maintained during construction. In addition, construction staging and storage is
prohibited at any public recreational property.
6.8 Effects on Air Quality
6.8.1 Project Conformity
The Clean Air Act (CAA) as amended in 1990 requires transportation project conform with the
approved state implementation plan. The CAA states in Section 176(c)(1):
Conformity to an implementation plan means ‐
(A) conformity to an implementation plan’s purpose of eliminating or reducing the
severity and number of violations of the national ambient air quality standards and
achieving expeditious attainment of such standards; and
(B) that such activities will not‐
(i) cause or contribute to any new violation of any standard in any area;
(ii) increase the frequency or severity of any existing violation of any standard in
any area; or
(iii) delay timely attainment of any standard or any required interim emission
reductions or other milestones in any area.
The US Environmental Protection Agency (EPA) has designated the project area in
attainment/maintenance for the 1997 8‐hour ozone and 1997 Annual fine particulate matter
(PM2.5) standards, and the 2006 24‐hour PM2.5 standard. The EPA repealed the ozone standard
for transportation conformity purposes effective on July 20, 2013.
The Preferred Alternative is in the process to be included in the Southeast Michigan Council of
Governments (SEMCOG) 2040 Regional Transportation Plan and 2014‐2017 Transportation
Improvement Plan.
The project or Preferred Alternative is not one of local air quality concern as defined by EPA
under 40 CFR 93.123(b)(1). The project does not involve the construction of a permanent
48
general purpose lane. In addition, the 2013 MDOT Sufficiency Report13 of the proposed project
corridor shows the highest roadway section within the project corridor with an annual average
daily traffic (AADT) of 65,000 with a 5,200 Commercial AADT (8% of the total AADT). These
traffic numbers are below the level of significance as presented in EPA’s Transportation
Conformity Guidance for Quantitative Hot‐Spot Analyses in PM2.5 and PM10 Nonattainment and
Maintenance Areas (November 2013). No microscale air quality analysis is required under 40
CFR 51 and 93.
6.8.2 Mobile Source Air Toxics (MSAT)
The Preferred Alternative has no potential for meaningful MSAT effects. The AADT as stated
in the previous paragraph and the predicted traffic volumes for 2040 will increase no more than
17.9%14 above the No Build Alternative. The projected ATM 2040 AADT is 77,900 given the
previously stated traffic information. These levels remain below the 140K – 150K AADT FHWA
threshold15 for a project of air quality concern for MSAT. The ATM will allow the free flow of
traffic on the mainline during the directional peak periods and reduce the concentration of
emissions. Free flow traffic conditions will continue outside of the peak periods. In addition,
regardless of the actions taken, emissions will likely be lower than the present levels in the
design year as a result of EPA’s national control programs that are projected to reduce the
annual MSAT emissions by over 80% between 2010 and 2050. Local conditions may differ from
these national projections in terms of fleet mix and turnover, vehicle miles traveled (VMT)
growth rates, and local control measures. However, the magnitude of the EPA‐projected
reductions is so great that MSAT emissions in the study area are likely to be lower in the future.
6.8.3 Greenhouse Gas (GHG)/Climate Change
There is general scientific agreement that greenhouse gas (GHG) emissions are contributing to a
long‐term warming trend of the earth. The climate impacts of GHG emissions are global in
nature. Analyzing how a transportation project in an EA might vary in its relatively small
contribution to a global problem will not better inform decisions. Further, due to the
interactions between elements of the transportation system as a whole, project level emissions
analysis would be less informative than one conducted at regional, state, or national levels.
FHWA does present some operational strategies for projects through Transportation System
Management (TSM) that can help, however small, reduce GHG emissions.
The preferred alternative will incorporate some effective TSM strategies suggested by FHWA to
aid in the reduction of GHG emissions. TSM refers to a set of strategies that largely aim to
reduce GHG emissions by reducing congestion, primarily by improving transportation system
capacity and efficiency. TSM strategies may also address a wide range of other externalities
13 A Sufficiency Report is an annual statewide evaluation of the conditions and operation of the state
trunkline (highway) system and some of the items it includes are: pavement conditions, number of lanes,
and traffic characteristics. 14 MDOT, US‐23 Envronmental Assessment Draft Traffic Report, January 8, 2015, pg. 29 15 FHWA Memorandum, Interim Guidance Update on Mobile Source Air Toxic Analysis in NEPA, December
6, 2012
49
associated with driving such as pedestrian/driver safety, efficiency, congestion, travel time, and
driver satisfaction. Some TSM strategies are designed to reduce total and systemic congestion
and improve system‐wide efficiency, while other strategies target particularly problematic areas
where improvements could greatly affect congestion, safety, efficiency, and GHG emissions.
The TSM strategies in the Preferred Alternative include:
Traffic signal optimization at the interchanges
Incident management, including active traffic management (ATM) to control the
directional peak hour congestion; intelligent transportation systems (ITS) to inform the
traveling public of travel times and traffic conditions; and crash investigation sites
(CIS) to remove disabled vehicles from the mainline and allow free flow of traffic
Roundabouts at the N. Territorial Road and possibly at the 8 Mile Road interchanges
Resurfacing roads through capital preventive maintenance (CPM) along the mainline
and on the Joy Road and Warren Road bridges
The construction period is of relatively short duration. Therefore, construction mitigation is not
required (40 CFR93.123(c)(5)). However, exposure to diesel exhaust by construction workers,
and those nearby a construction site can have serious health implications. Several measures
may be taken that include strategies that reduce engine activity or reduce emissions per unit of
operating time. Construction equipment should be kept clean, tuned‐up, and in good operating
condition. MDOT’s Standard Construction Specification Sections 107.15(A) and 107.19 would
apply to control fugitive dust during construction and cleaning of haul roads. All MDOT
vehicles and equipment must follow MDOT Guidance #10179 (2/15/2009) Vehicle and Equipment
Engine Idling.
6.9 Noise Impacts
The noise analysis presents the existing and future acoustical environment at various receptors
located along the project locations in the US‐23 corridor. The determination of noise abatement
measures and locations is in compliance with the Federal Highways Administration’s
(FHWA’s) Procedures for Abatement of Highway Traffic Noise and Construction Noise as presented in
the Code of Federal Regulations, Title 23 Part 772 (23 CFR 722), and the Michigan Department
of Transportation (MDOT): Highway Noise Analysis and Abatement Handbook, July 2011. The
MDOT: Highway Noise Analysis and Abatement Handbook is in compliance with the State
Transportation Commission Policy 10136 Noise Abatement, dated July 31, 2003.
The Preferred Alternative includes the construction of two enhanced median (inside) shoulders
for traffic flow (called dynamic shoulder use) during directional peak congestion periods,
southbound (SB) in the morning and northbound (NB) in the evening. The FHWA determined
that the Preferred Alternative requires a noise abatement analysis because the shoulders will be
used on regularly scheduled times as travel lanes during peak hour times and are considered
new travel lanes. The addition of new travel lanes fits under the definition of a Type I project
under 23 CFR 772.5 and such projects are required to undergo a noise analysis. Moreover,
under the Type I definition: “(8) If a project is determined to be a Type I project under this
definition then the entire project area as defined in the environmental document is a Type I
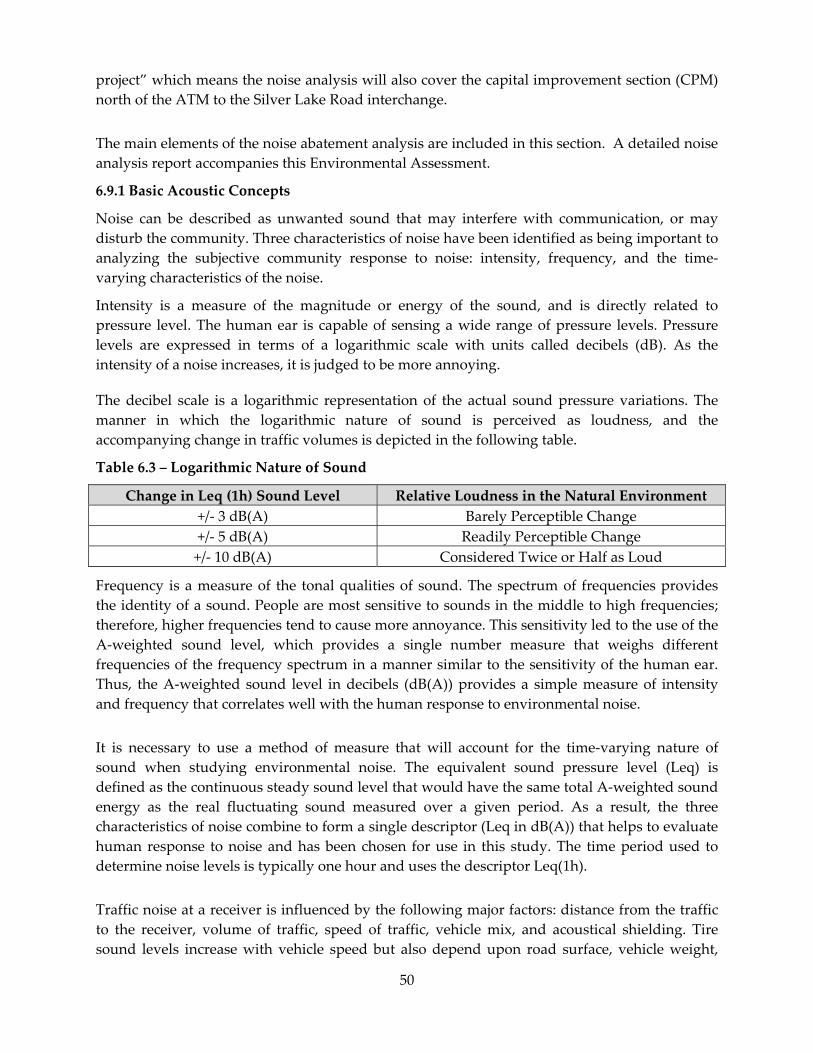
50
project” which means the noise analysis will also cover the capital improvement section (CPM)
north of the ATM to the Silver Lake Road interchange.
The main elements of the noise abatement analysis are included in this section. A detailed noise
analysis report accompanies this Environmental Assessment.
6.9.1 Basic Acoustic Concepts
Noise can be described as unwanted sound that may interfere with communication, or may
disturb the community. Three characteristics of noise have been identified as being important to
analyzing the subjective community response to noise: intensity, frequency, and the time‐
varying characteristics of the noise.
Intensity is a measure of the magnitude or energy of the sound, and is directly related to
pressure level. The human ear is capable of sensing a wide range of pressure levels. Pressure
levels are expressed in terms of a logarithmic scale with units called decibels (dB). As the
intensity of a noise increases, it is judged to be more annoying.
The decibel scale is a logarithmic representation of the actual sound pressure variations. The
manner in which the logarithmic nature of sound is perceived as loudness, and the
accompanying change in traffic volumes is depicted in the following table.
Table 6.3 – Logarithmic Nature of Sound
Change in Leq (1h) Sound Level Relative Loudness in the Natural Environment
+/‐ 3 dB(A) Barely Perceptible Change
+/‐ 5 dB(A) Readily Perceptible Change
+/‐ 10 dB(A) Considered Twice or Half as Loud
Frequency is a measure of the tonal qualities of sound. The spectrum of frequencies provides
the identity of a sound. People are most sensitive to sounds in the middle to high frequencies;
therefore, higher frequencies tend to cause more annoyance. This sensitivity led to the use of the
A‐weighted sound level, which provides a single number measure that weighs different
frequencies of the frequency spectrum in a manner similar to the sensitivity of the human ear.
Thus, the A‐weighted sound level in decibels (dB(A)) provides a simple measure of intensity
and frequency that correlates well with the human response to environmental noise.
It is necessary to use a method of measure that will account for the time‐varying nature of
sound when studying environmental noise. The equivalent sound pressure level (Leq) is
defined as the continuous steady sound level that would have the same total A‐weighted sound
energy as the real fluctuating sound measured over a given period. As a result, the three
characteristics of noise combine to form a single descriptor (Leq in dB(A)) that helps to evaluate
human response to noise and has been chosen for use in this study. The time period used to
determine noise levels is typically one hour and uses the descriptor Leq(1h).
Traffic noise at a receiver is influenced by the following major factors: distance from the traffic
to the receiver, volume of traffic, speed of traffic, vehicle mix, and acoustical shielding. Tire
sound levels increase with vehicle speed but also depend upon road surface, vehicle weight,
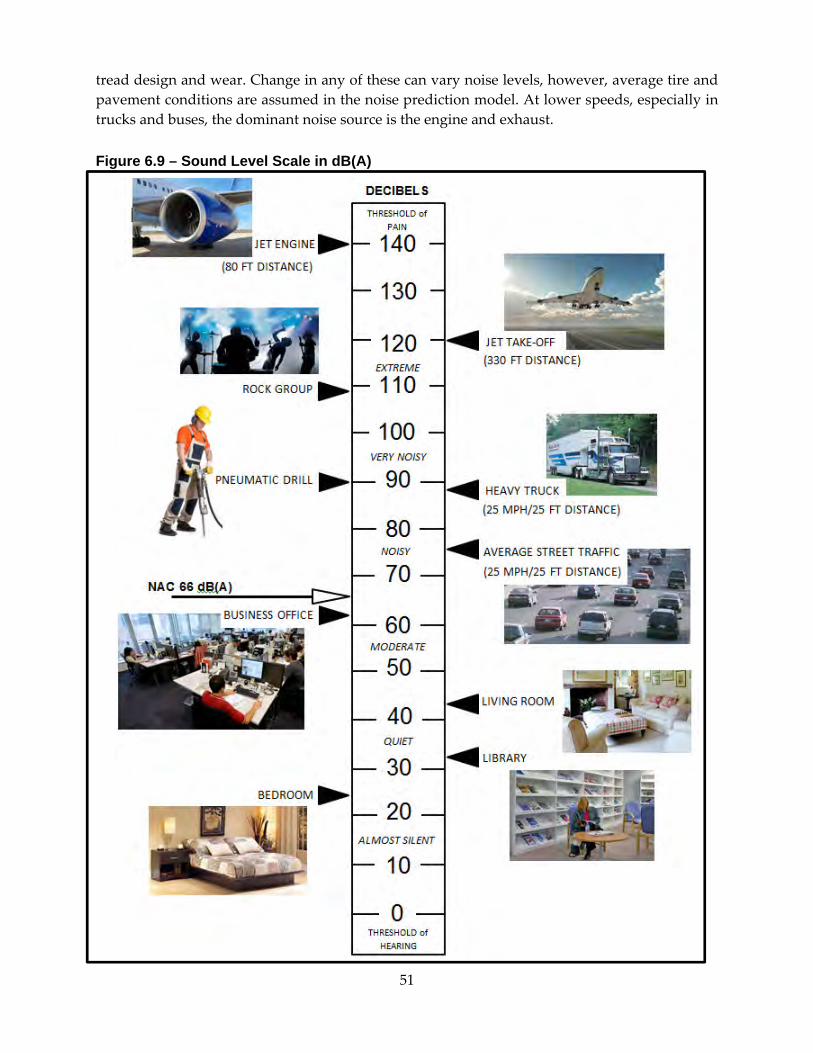
51
tread design and wear. Change in any of these can vary noise levels, however, average tire and
pavement conditions are assumed in the noise prediction model. At lower speeds, especially in
trucks and buses, the dominant noise source is the engine and exhaust.
Figure 6.9 – Sound Level Scale in dB(A)
52
6.9.2 Federal Regulations and Guidance
FHWAʹs Procedures for Abatement of Highway Traffic Noise and Construction Noise, 23 CFR 772,
requires the following during the planning and design of a highway project.
1) Identification of highway traffic noise impacts;
2) Examination of potential abatement measures;
3) Gather public input approval for reasonable and feasible abatement measures;
4) Incorporation of reasonable and feasible highway traffic noise abatement measures
into the highway project;
5) Coordination with local officials to provide helpful information on compatible land
use planning and control; and
6) Identification and incorporation of necessary measures to abate construction noise
The highway traffic noise impact identification process involves a review of the existing land
use activity categories that parallel the highway corridor and determining existing and future
noise levels within those areas. Existing land use of developed lands is identified by inspecting
aerial photography and performing site reconnaissance. Highway traffic noise analyses are also
performed for undeveloped lands when they are considered permitted developments.
After the existing and proposed land uses are established, the existing noise levels are
determined based on a noise model validation process that compares modeled noise levels to
actual measured noise levels. The existing noise environment is determined by gathering noise
measurements and concurrent site and traffic information. The FHWA mandates the use of the
most recent version of the Traffic Noise Model® (TNM) software be used to construct these
models. The noise model must predict noise levels that are within 3 dB(A) of the actual levels in
order to be considered valid. Future design year traffic is applied to a model that has been
validated for the existing condition to estimate future 2033 noise levels.
The FHWA Noise Abatement Criteria (NAC), which is presented in 23 CFR 772, establishes the
noise abatement criteria for various land uses, and is presented in Table 6.4. A traffic noise
impact is defined as a future noise level that approaches or exceeds the NAC; or a future noise
level that creates a substantial noise increase over existing noise levels. An approaching noise
level is defined as being at least 1 dB(A) less than the noise level value listed in the NAC for
Activity Category A through E. The FHWA allows states to define a substantial noise increase
as an increase of anywhere between 5 and 15 dB(A).
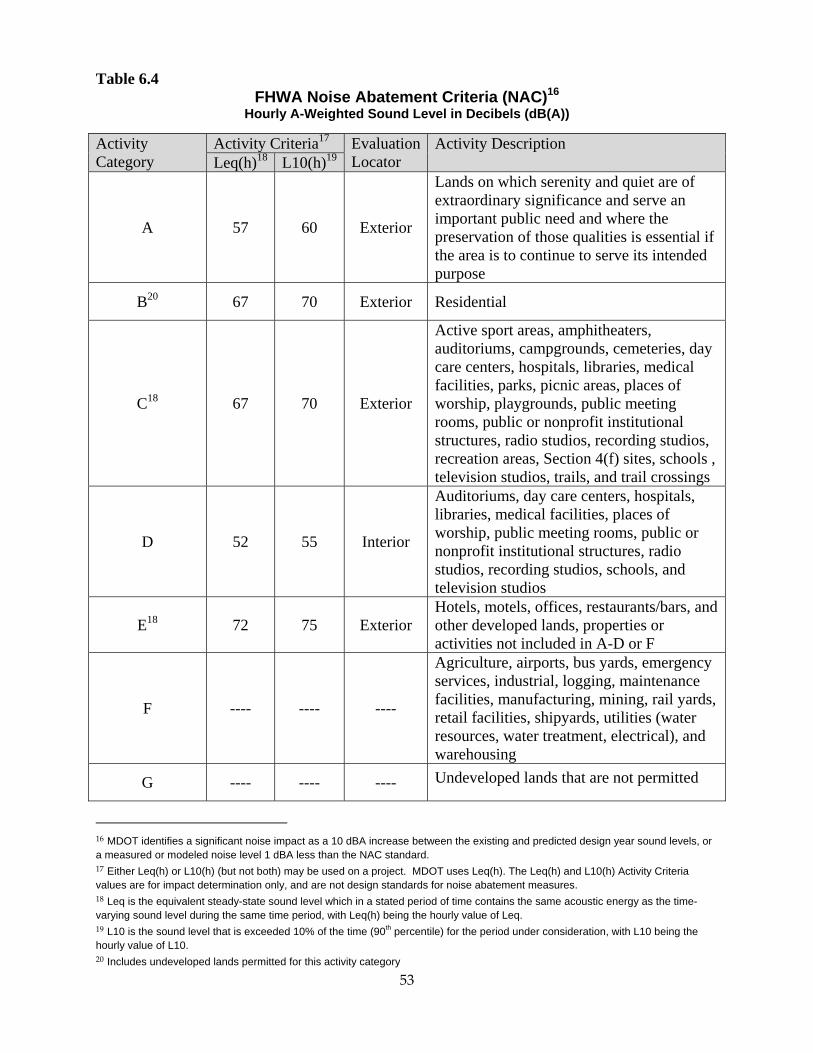
53
Table 6.4 FHWA Noise Abatement Criteria (NAC)16
Hourly A-Weighted Sound Level in Decibels (dB(A))
Activity Category
Activity Criteria17 Evaluation Locator
Activity Description Leq(h)18 L10(h)19
A 57 60 Exterior
Lands on which serenity and quiet are of extraordinary significance and serve an important public need and where the preservation of those qualities is essential if the area is to continue to serve its intended purpose
B20 67 70 Exterior Residential
C18 67 70 Exterior
Active sport areas, amphitheaters, auditoriums, campgrounds, cemeteries, day care centers, hospitals, libraries, medical facilities, parks, picnic areas, places of worship, playgrounds, public meeting rooms, public or nonprofit institutional structures, radio studios, recording studios, recreation areas, Section 4(f) sites, schools , television studios, trails, and trail crossings
D 52 55 Interior
Auditoriums, day care centers, hospitals, libraries, medical facilities, places of worship, public meeting rooms, public or nonprofit institutional structures, radio studios, recording studios, schools, and television studios
E18 72 75 Exterior Hotels, motels, offices, restaurants/bars, and other developed lands, properties or activities not included in A-D or F
F ---- ---- ----
Agriculture, airports, bus yards, emergency services, industrial, logging, maintenance facilities, manufacturing, mining, rail yards, retail facilities, shipyards, utilities (water resources, water treatment, electrical), and warehousing
G ---- ---- ---- Undeveloped lands that are not permitted
16 MDOT identifies a significant noise impact as a 10 dBA increase between the existing and predicted design year sound levels, or a measured or modeled noise level 1 dBA less than the NAC standard. 17 Either Leq(h) or L10(h) (but not both) may be used on a project. MDOT uses Leq(h). The Leq(h) and L10(h) Activity Criteria values are for impact determination only, and are not design standards for noise abatement measures. 18 Leq is the equivalent steady-state sound level which in a stated period of time contains the same acoustic energy as the time-varying sound level during the same time period, with Leq(h) being the hourly value of Leq. 19 L10 is the sound level that is exceeded 10% of the time (90th percentile) for the period under consideration, with L10 being the hourly value of L10. 20 Includes undeveloped lands permitted for this activity category
54
6.9.3 State Rules and Procedures
MDOT’s Highway Noise Analysis and Abatement Handbook is the State’s tool for
implementing 23 CFR 772, which was discussed in Section 4.2. The Highway Noise Analysis
and Abatement Handbook expands on 23 CFR 772 by refining definitions and establishing
milestones within the design phase for the completion of noise impact analysis and mitigation
development.
The MDOT Highway Noise Analysis and Abatement Handbook includes the following
definitions:
Common Noise Environment (CNE): A group of receptors within the same Activity Category
(Table 6.4) that are exposed to similar noise sources and levels; traffic volumes, traffic mix, and
speed; and topographic features. Generally, common noise environments occur between two
secondary noise sources such as interchanges, intersections, and cross roads.
Noise Impact: A substantial noise increase or a predicted design year noise level that is 1 dB(A)
less, equal to, or greater than the NAC level.
Substantial Noise Increase: A 10 dB(A) or greater increase between the existing noise level and
the design year predicted noise level.
Benefited Receptor: A receptor that receives a 5 dB(A) or greater insertion loss as a result of a
proposed noise barrier.
Feasible Noise Barrier: A barrier that has no construction impediments, meets safety
requirements for the traveling public, and provides at least 5 dB(A) noise reduction at 75% of
the impacted receptors.
Reasonable Noise Barrier: A barrier:
with a preliminary construction cost that is not more than 3% above the allowable
cost per benefited receptor unit (ACPBU) of $44,187 (year 2014).
that reduces design year traffic noise by 10 dB(A) for at least one benefited receptor
and provide at least a 7 dB(A) reduction for 50% or more of the benefited receptor
sites.
that is approved by a majority of the benefitting residents and property owners
during final design phase.
Permitted Development: Any presently undeveloped lands that have received a building
permit from the local township or city.
Dwelling Unit Equivalent (DUE): A dwelling unit (residence) counts as one receptor. A DUE is
the equivalent receptor count for public areas such as parks, schools, libraries and churches
(FHWA Activity Categories NAC C and D) and is determined based on the number of
employees and attendees, and the frequency of use.
55
6.9.4 FHWA Traffic Noise Model (TNM)
TNM is FHWA’s computer program for highway traffic noise prediction and analysis. The use
of the most recent TNM software, or any other model determined by the FHWA to be consistent
with the methodology of the FHWA TNM, is a mandatory requirement for all traffic noise
related projects under 23 CFR 772.9. The following parameters are used in this model to
calculate an hourly Leq at a specific receiver location:
Distance between roadway and receiver;
Relative elevations of roadway and receiver;
Hourly traffic volumes by classification;
Vehicle speeds;
Ground absorption;
Weather conditions; and
Topographic features, including retaining walls and berms.
Hourly traffic volumes have been divided into five vehicle classifications: automobiles (A);
medium trucks (MT); heavy trucks (HT); Buses (B); and Motorcycles (M). Each vehicle class is
defined by the FHWA Traffic Noise Model, User’s Guide, (February 1998); TNM v2.5 Update Sheet,
Technical Manual: Part 1 as follows:
Automobiles – all vehicles with two axles and four tires, includes passenger vehicles and
light trucks, less than 9,900 pounds.
Medium trucks – all vehicles having two axles and six tires, vehicle weight between
9,900 and 26,400 pounds.
Heavy trucks – all vehicles having three or more axles, vehicle weight greater than
26,400 pounds.
Buses – all vehicles designed to carry more than nine passengers.
Motorcycles – all vehicles with two or three tires and an open‐air driver/passenger
compartment.
6.9.5 Noise Impact and Abatement Analysis
6.9.5.1 Field Measurement and TNM Comparison
The project corridor was divided based on like land use and identified as common noise
environments (CNE) to facilitate the analysis of highway noise. The CNE and field
measurement sites are illustrated in Figure 6.10 and in detail in the Appendix F maps. A minimum fifteen minute measurement were taken at each site, during peak and off‐peak traffic
periods. The measurements were conducted in accordance with FHWA and MDOT guidelines
using an integrating sound level analyzer. Table 6.5 presents the data collected at the eleven (11)
field measurement sites.
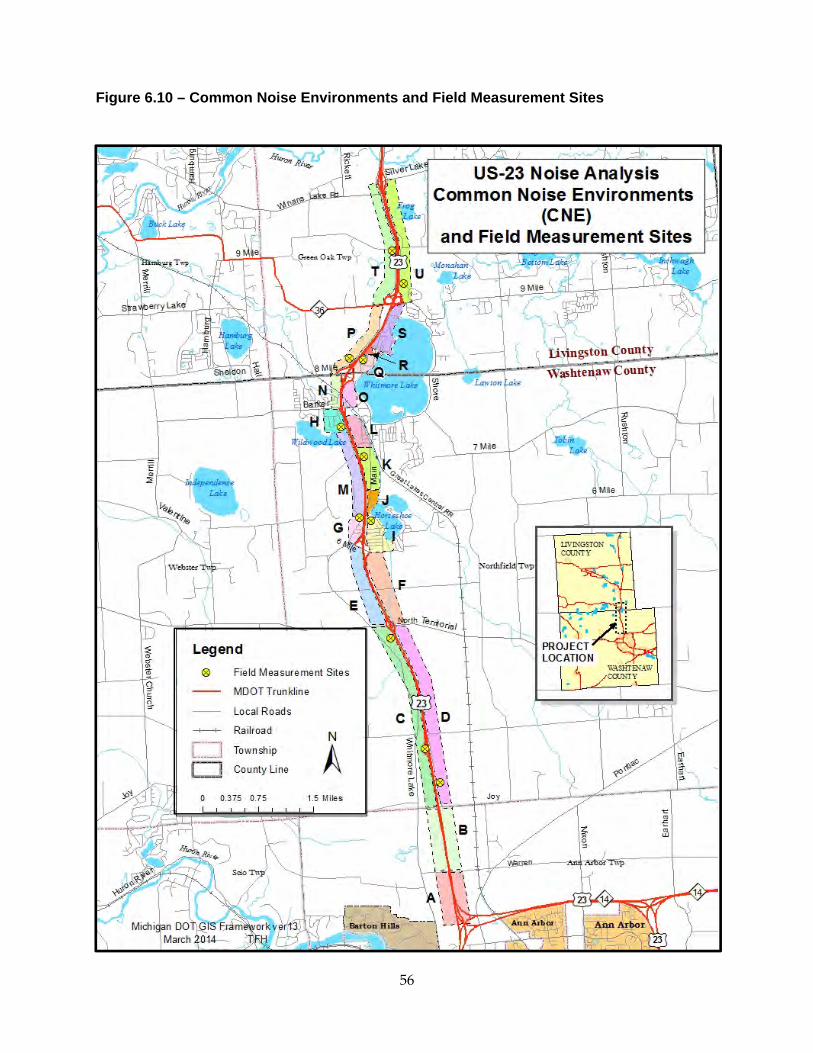
56
Figure 6.10 – Common Noise Environments and Field Measurement Sites
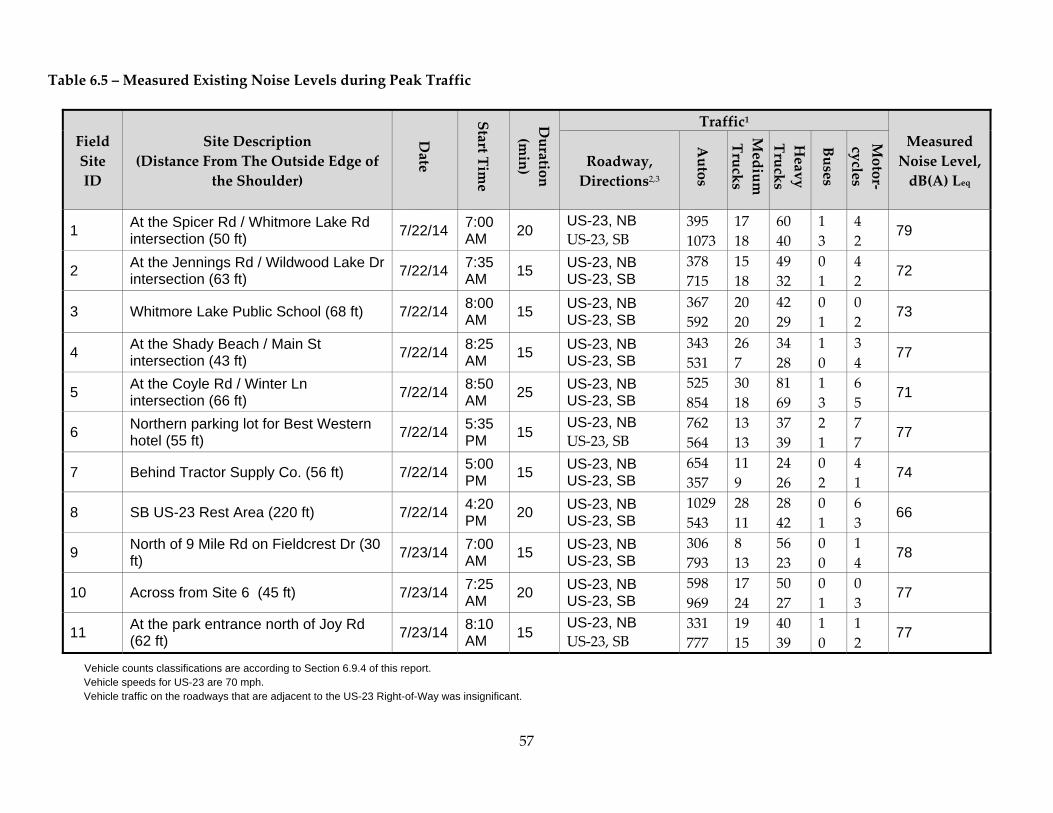
57
Table 6.5 – Measured Existing Noise Levels during Peak Traffic
Field
Site
ID
Site Description
(Distance From The Outside Edge of
the Shoulder)
Date
Start T
ime
Duratio
n
(min)
Traffic1
Measured
Noise Level,
dB(A) Leq
Roadway,
Directions2,3
Autos
Medium
Trucks
Heav
y
Trucks
Buses
Motor‐
cycles
1 At the Spicer Rd / Whitmore Lake Rd intersection (50 ft)
7/22/14 7:00 AM
20 US-23, NB US‐23, SB
395
1073
17
18
60
40
1
3
4
2 79
2 At the Jennings Rd / Wildwood Lake Dr intersection (63 ft)
7/22/14 7:35 AM
15 US-23, NB US-23, SB
378
715
15
18
49
32
0
1
4
2 72
3 Whitmore Lake Public School (68 ft) 7/22/14 8:00 AM
15 US-23, NB US-23, SB
367
592
20
20
42
29
0
1
0
2 73
4 At the Shady Beach / Main St intersection (43 ft)
7/22/14 8:25 AM
15 US-23, NB US-23, SB
343
531
26
7
34
28
1
0
3
4 77
5 At the Coyle Rd / Winter Ln intersection (66 ft)
7/22/14 8:50 AM
25 US-23, NB US-23, SB
525
854
30
18
81
69
1
3
6
5 71
6 Northern parking lot for Best Western hotel (55 ft)
7/22/14 5:35 PM
15 US-23, NB US‐23, SB
762
564
13
13
37
39
2
1
7
7 77
7 Behind Tractor Supply Co. (56 ft) 7/22/14 5:00 PM
15 US-23, NB US-23, SB
654
357
11
9
24
26
0
2
4
1 74
8 SB US-23 Rest Area (220 ft) 7/22/14 4:20 PM
20 US-23, NB US-23, SB
1029
543
28
11
28
42
0
1
6
3 66
9 North of 9 Mile Rd on Fieldcrest Dr (30 ft)
7/23/14 7:00 AM
15 US-23, NB US-23, SB
306
793
8
13
56
23
0
0
1
4 78
10 Across from Site 6 (45 ft) 7/23/14 7:25 AM
20 US-23, NB US-23, SB
598
969
17
24
50
27
0
1
0
3 77
11 At the park entrance north of Joy Rd (62 ft)
7/23/14 8:10AM
15 US-23, NB US‐23, SB
331
777
19
15
40
39
1
0
1
2 77
Vehicle counts classifications are according to Section 6.9.4 of this report. Vehicle speeds for US-23 are 70 mph. Vehicle traffic on the roadways that are adjacent to the US-23 Right-of-Way was insignificant.

58
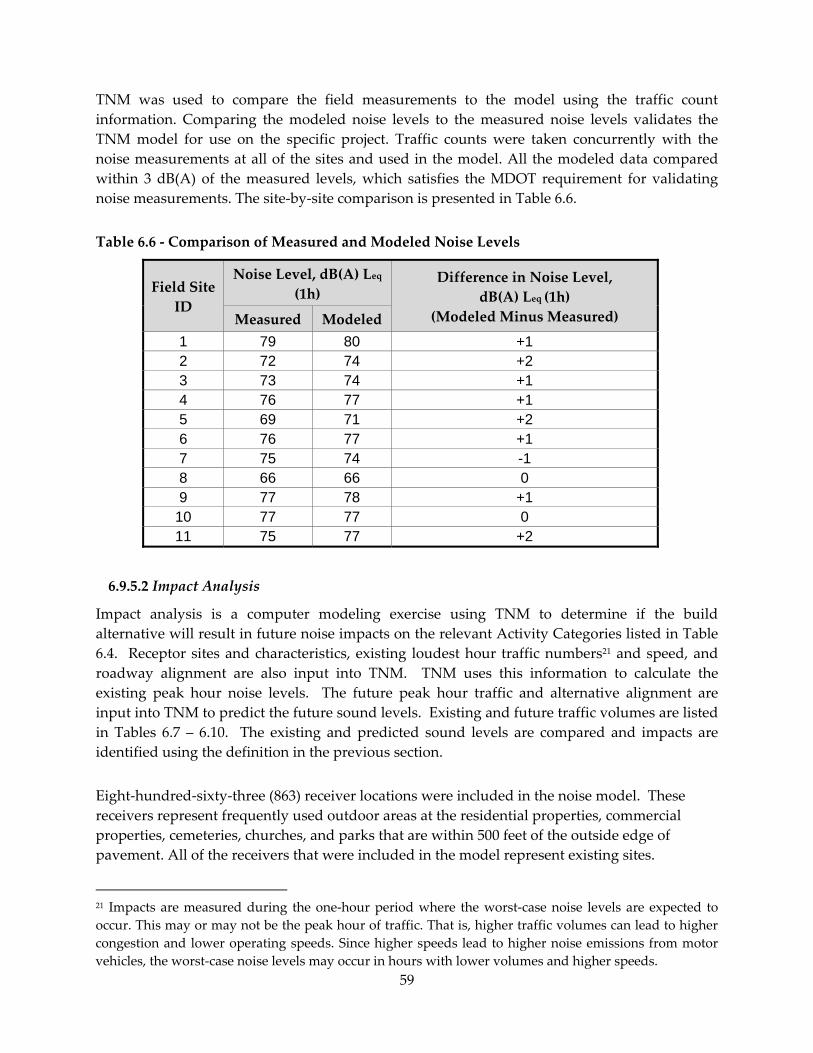
59
TNM was used to compare the field measurements to the model using the traffic count
information. Comparing the modeled noise levels to the measured noise levels validates the
TNM model for use on the specific project. Traffic counts were taken concurrently with the
noise measurements at all of the sites and used in the model. All the modeled data compared
within 3 dB(A) of the measured levels, which satisfies the MDOT requirement for validating
noise measurements. The site‐by‐site comparison is presented in Table 6.6.
Table 6.6 ‐ Comparison of Measured and Modeled Noise Levels
Field Site
ID
Noise Level, dB(A) Leq
(1h) Difference in Noise Level,
dB(A) Leq (1h)
(Modeled Minus Measured) Measured Modeled
1 79 80 +1 2 72 74 +2 3 73 74 +1 4 76 77 +1 5 69 71 +2 6 76 77 +1 7 75 74 -1 8 66 66 0 9 77 78 +1
10 77 77 0 11 75 77 +2
6.9.5.2 Impact Analysis
Impact analysis is a computer modeling exercise using TNM to determine if the build
alternative will result in future noise impacts on the relevant Activity Categories listed in Table
6.4. Receptor sites and characteristics, existing loudest hour traffic numbers21 and speed, and
roadway alignment are also input into TNM. TNM uses this information to calculate the
existing peak hour noise levels. The future peak hour traffic and alternative alignment are
input into TNM to predict the future sound levels. Existing and future traffic volumes are listed
in Tables 6.7 – 6.10. The existing and predicted sound levels are compared and impacts are
identified using the definition in the previous section.
Eight‐hundred‐sixty‐three (863) receiver locations were included in the noise model. These
receivers represent frequently used outdoor areas at the residential properties, commercial
properties, cemeteries, churches, and parks that are within 500 feet of the outside edge of
pavement. All of the receivers that were included in the model represent existing sites.
21 Impacts are measured during the one‐hour period where the worst‐case noise levels are expected to
occur. This may or may not be the peak hour of traffic. That is, higher traffic volumes can lead to higher
congestion and lower operating speeds. Since higher speeds lead to higher noise emissions from motor
vehicles, the worst‐case noise levels may occur in hours with lower volumes and higher speeds.
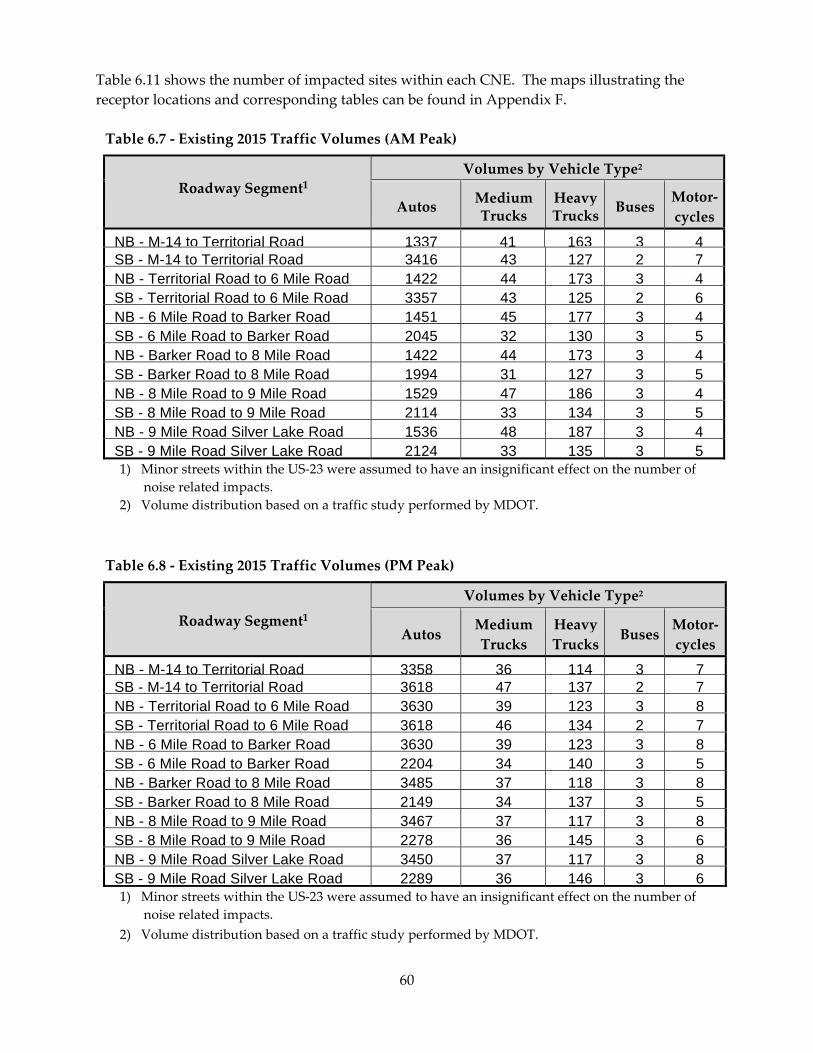
60
Table 6.11 shows the number of impacted sites within each CNE. The maps illustrating the
receptor locations and corresponding tables can be found in Appendix F.
Table 6.7 ‐ Existing 2015 Traffic Volumes (AM Peak)
Roadway Segment1
Volumes by Vehicle Type2
Autos Medium Trucks
Heavy Trucks
Buses Motor‐
cycles
NB - M-14 to Territorial Road 1337 41 163 3 4SB - M-14 to Territorial Road 3416 43 127 2 7NB - Territorial Road to 6 Mile Road 1422 44 173 3 4SB - Territorial Road to 6 Mile Road 3357 43 125 2 6NB - 6 Mile Road to Barker Road 1451 45 177 3 4SB - 6 Mile Road to Barker Road 2045 32 130 3 5NB - Barker Road to 8 Mile Road 1422 44 173 3 4SB - Barker Road to 8 Mile Road 1994 31 127 3 5NB - 8 Mile Road to 9 Mile Road 1529 47 186 3 4SB - 8 Mile Road to 9 Mile Road 2114 33 134 3 5NB - 9 Mile Road Silver Lake Road 1536 48 187 3 4SB - 9 Mile Road Silver Lake Road 2124 33 135 3 51) Minor streets within the US‐23 were assumed to have an insignificant effect on the number of
noise related impacts.
2) Volume distribution based on a traffic study performed by MDOT.
Table 6.8 ‐ Existing 2015 Traffic Volumes (PM Peak)
Roadway Segment1
Volumes by Vehicle Type2
Autos Medium
Trucks
Heavy
Trucks Buses
Motor‐
cycles
NB - M-14 to Territorial Road 3358 36 114 3 7SB - M-14 to Territorial Road 3618 47 137 2 7NB - Territorial Road to 6 Mile Road 3630 39 123 3 8SB - Territorial Road to 6 Mile Road 3618 46 134 2 7NB - 6 Mile Road to Barker Road 3630 39 123 3 8SB - 6 Mile Road to Barker Road 2204 34 140 3 5NB - Barker Road to 8 Mile Road 3485 37 118 3 8SB - Barker Road to 8 Mile Road 2149 34 137 3 5NB - 8 Mile Road to 9 Mile Road 3467 37 117 3 8SB - 8 Mile Road to 9 Mile Road 2278 36 145 3 6NB - 9 Mile Road Silver Lake Road 3450 37 117 3 8SB - 9 Mile Road Silver Lake Road 2289 36 146 3 61) Minor streets within the US‐23 were assumed to have an insignificant effect on the number of
noise related impacts.
2) Volume distribution based on a traffic study performed by MDOT.
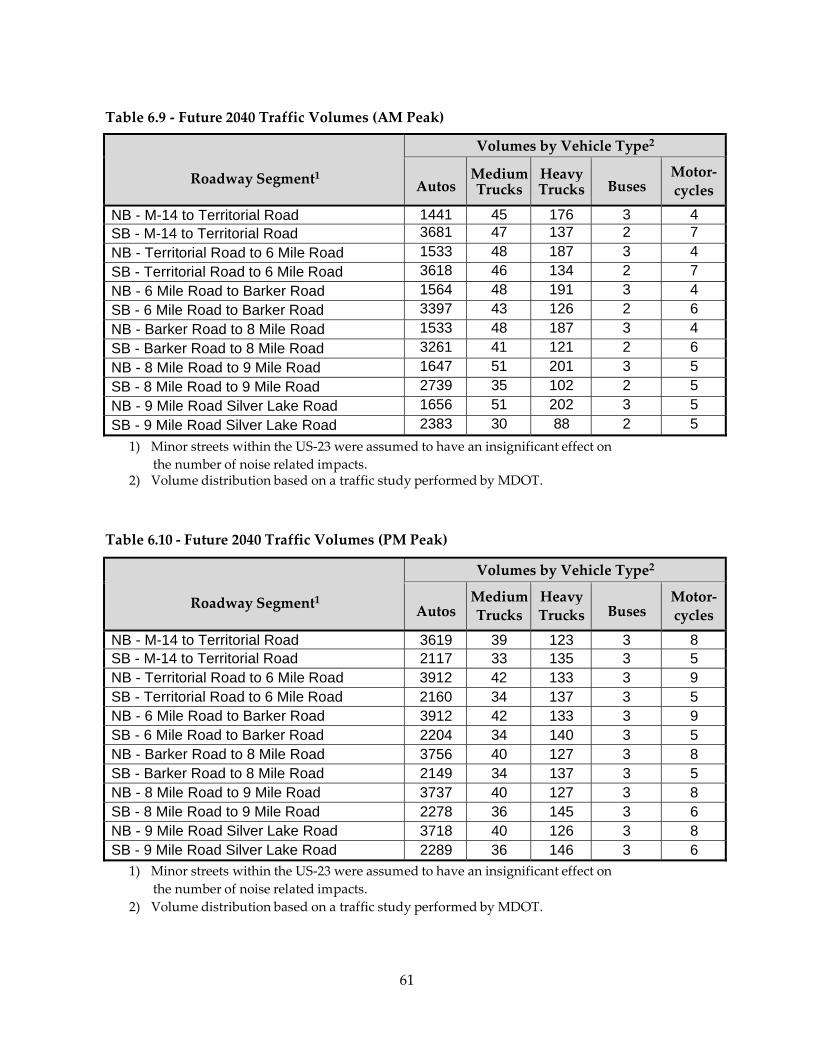
61
Table 6.9 ‐ Future 2040 Traffic Volumes (AM Peak)
Roadway Segment1
Volumes by Vehicle Type2
Autos MediumTrucks
Heavy Trucks
Buses
Motor‐
cycles
NB - M-14 to Territorial Road 1441 45 176 3 4SB - M-14 to Territorial Road 3681 47 137 2 7
NB - Territorial Road to 6 Mile Road 1533 48 187 3 4
SB - Territorial Road to 6 Mile Road 3618 46 134 2 7
NB - 6 Mile Road to Barker Road 1564 48 191 3 4
SB - 6 Mile Road to Barker Road 3397 43 126 2 6
NB - Barker Road to 8 Mile Road 1533 48 187 3 4
SB - Barker Road to 8 Mile Road 3261 41 121 2 6
NB - 8 Mile Road to 9 Mile Road 1647 51 201 3 5
SB - 8 Mile Road to 9 Mile Road 2739 35 102 2 5
NB - 9 Mile Road Silver Lake Road 1656 51 202 3 5
SB - 9 Mile Road Silver Lake Road 2383 30 88 2 5
1) Minor streets within the US‐23 were assumed to have an insignificant effect on
the number of noise related impacts. 2) Volume distribution based on a traffic study performed by MDOT.
Table 6.10 ‐ Future 2040 Traffic Volumes (PM Peak)
Roadway Segment1
Volumes by Vehicle Type2
Autos
Medium
Trucks
Heavy
Trucks
Buses
Motor‐
cycles
NB - M-14 to Territorial Road 3619 39 123 3 8 SB - M-14 to Territorial Road 2117 33 135 3 5 NB - Territorial Road to 6 Mile Road 3912 42 133 3 9 SB - Territorial Road to 6 Mile Road 2160 34 137 3 5 NB - 6 Mile Road to Barker Road 3912 42 133 3 9 SB - 6 Mile Road to Barker Road 2204 34 140 3 5 NB - Barker Road to 8 Mile Road 3756 40 127 3 8 SB - Barker Road to 8 Mile Road 2149 34 137 3 5 NB - 8 Mile Road to 9 Mile Road 3737 40 127 3 8 SB - 8 Mile Road to 9 Mile Road 2278 36 145 3 6 NB - 9 Mile Road Silver Lake Road 3718 40 126 3 8 SB - 9 Mile Road Silver Lake Road 2289 36 146 3 6
1) Minor streets within the US‐23 were assumed to have an insignificant effect on
the number of noise related impacts.
2) Volume distribution based on a traffic study performed by MDOT.
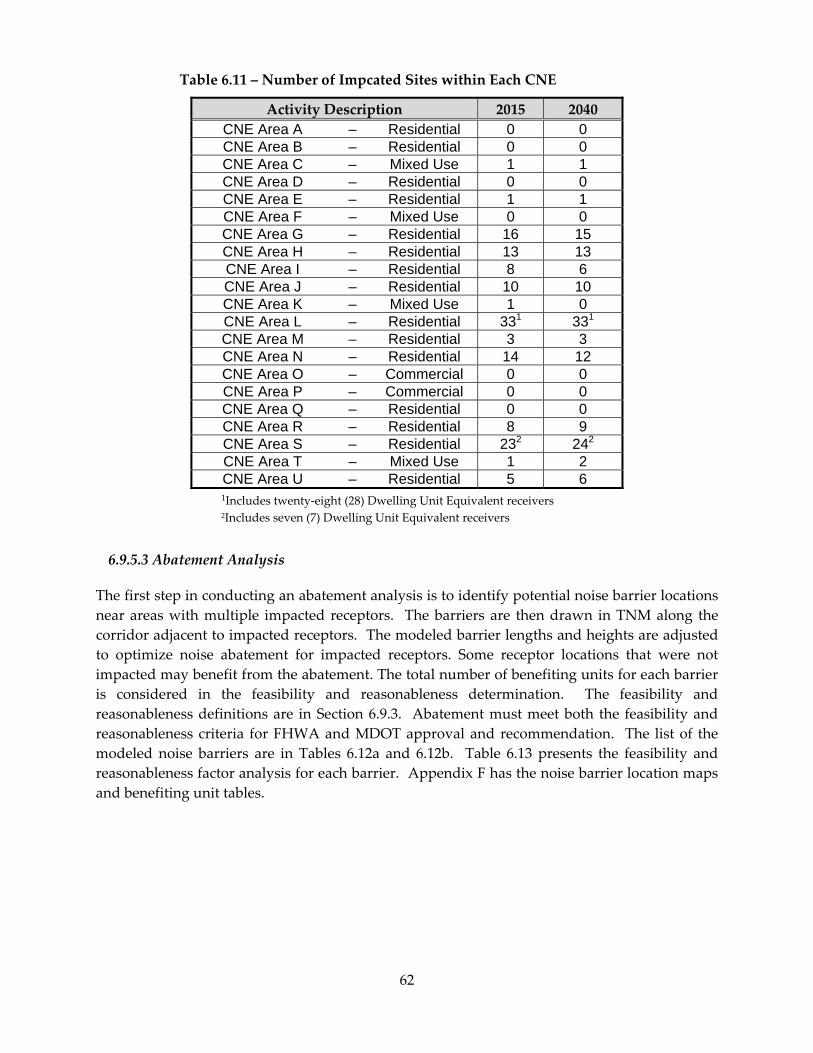
62
Table 6.11 – Number of Impcated Sites within Each CNE
Activity Description 2015 2040
CNE Area A – Residential 0 0 CNE Area B – Residential 0 0 CNE Area C – Mixed Use 1 1 CNE Area D – Residential 0 0 CNE Area E – Residential 1 1 CNE Area F – Mixed Use 0 0 CNE Area G – Residential 16 15 CNE Area H – Residential 13 13 CNE Area I – Residential 8 6 CNE Area J – Residential 10 10 CNE Area K – Mixed Use 1 0 CNE Area L – Residential 331 331 CNE Area M – Residential 3 3 CNE Area N – Residential 14 12 CNE Area O – Commercial 0 0 CNE Area P – Commercial 0 0 CNE Area Q – Residential 0 0 CNE Area R – Residential 8 9 CNE Area S – Residential 232 242 CNE Area T – Mixed Use 1 2 CNE Area U – Residential 5 6 1Includes twenty‐eight (28) Dwelling Unit Equivalent receivers 2Includes seven (7) Dwelling Unit Equivalent receivers
6.9.5.3 Abatement Analysis
The first step in conducting an abatement analysis is to identify potential noise barrier locations
near areas with multiple impacted receptors. The barriers are then drawn in TNM along the
corridor adjacent to impacted receptors. The modeled barrier lengths and heights are adjusted
to optimize noise abatement for impacted receptors. Some receptor locations that were not
impacted may benefit from the abatement. The total number of benefiting units for each barrier
is considered in the feasibility and reasonableness determination. The feasibility and
reasonableness definitions are in Section 6.9.3. Abatement must meet both the feasibility and
reasonableness criteria for FHWA and MDOT approval and recommendation. The list of the
modeled noise barriers are in Tables 6.12a and 6.12b. Table 6.13 presents the feasibility and
reasonableness factor analysis for each barrier. Appendix F has the noise barrier location maps
and benefiting unit tables.
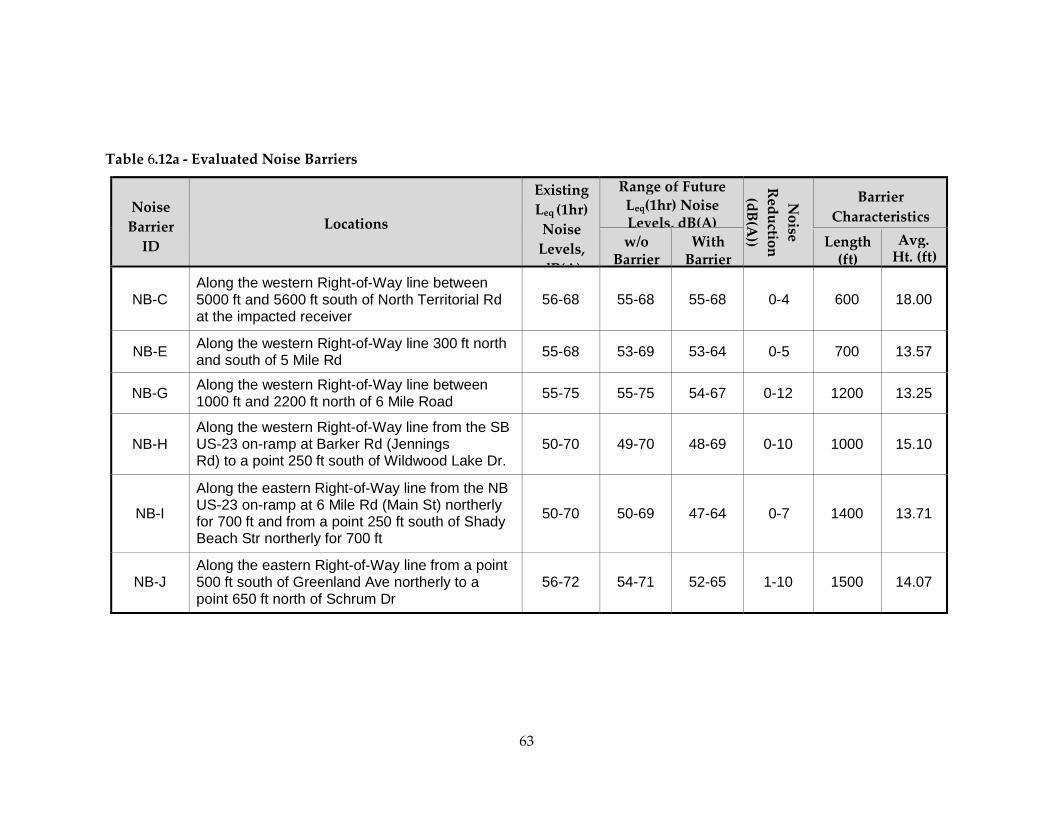
63
Table 6.12a ‐ Evaluated Noise Barriers
Noise
Barrier
ID
Locations
Existing
Leq (1hr)
Noise
Levels,
dB(A)
Range of Future
Leq(1hr) Noise Levels, dB(A)
Noise
Reductio
n
(dB(A))
Barrier
Characteristics
w/o Barrier
With Barrier
Length (ft)
Avg. Ht. (ft)
NB-C Along the western Right-of-Way line between 5000 ft and 5600 ft south of North Territorial Rd at the impacted receiver
56-68
55-68
55-68
0-4
600
18.00
NB-E Along the western Right-of-Way line 300 ft north
and south of 5 Mile Rd 55-68 53-69 53-64 0-5 700 13.57
NB-G Along the western Right-of-Way line between 1000 ft and 2200 ft north of 6 Mile Road 55-75 55-75 54-67 0-12 1200 13.25
NB-H Along the western Right-of-Way line from the SB US-23 on-ramp at Barker Rd (Jennings Rd) to a point 250 ft south of Wildwood Lake Dr.
50-70
49-70
48-69
0-10
1000
15.10
NB-I Along the eastern Right-of-Way line from the NB US-23 on-ramp at 6 Mile Rd (Main St) northerly for 700 ft and from a point 250 ft south of Shady Beach Str northerly for 700 ft
50-70
50-69
47-64
0-7
1400
13.71
NB-J Along the eastern Right-of-Way line from a point 500 ft south of Greenland Ave northerly to a point 650 ft north of Schrum Dr
56-72
54-71
52-65
1-10
1500
14.07
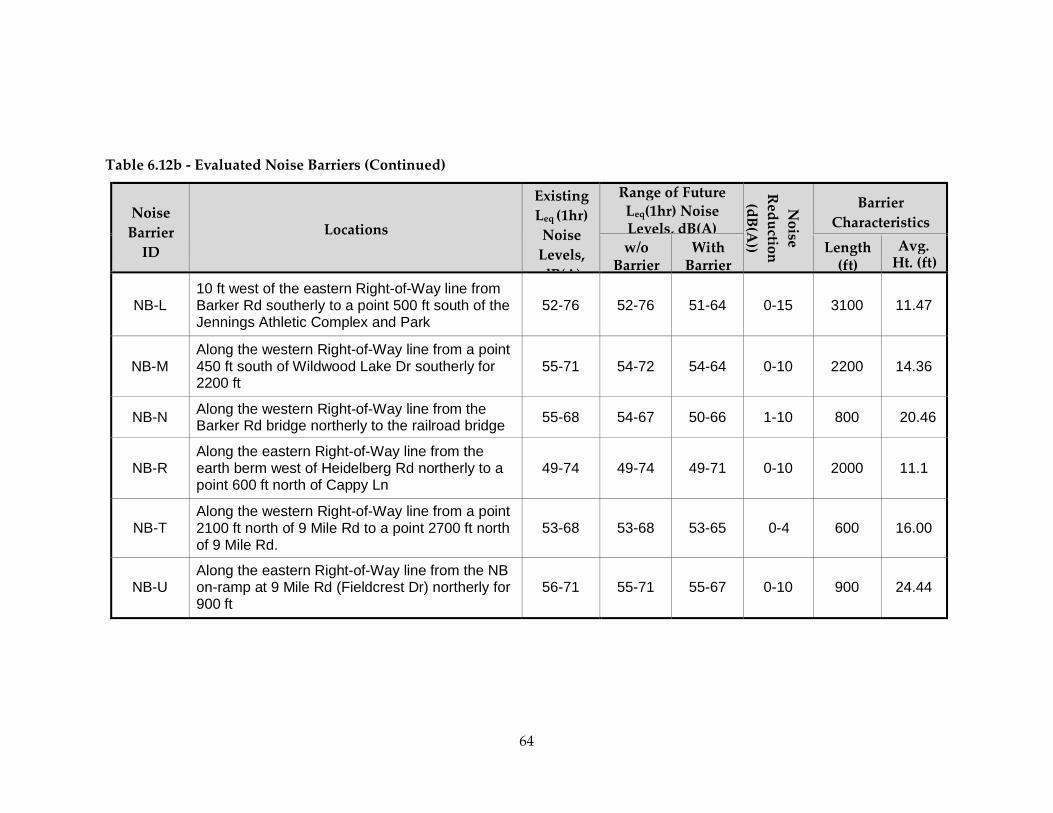
64
Table 6.12b ‐ Evaluated Noise Barriers (Continued)
Noise
Barrier
ID
Locations
Existing
Leq (1hr)
Noise
Levels,
dB(A)
Range of Future
Leq(1hr) Noise Levels, dB(A)
Noise
Reductio
n
(dB(A))
Barrier
Characteristics
w/o Barrier
With Barrier
Length (ft)
Avg. Ht. (ft)
NB-L 10 ft west of the eastern Right-of-Way line from Barker Rd southerly to a point 500 ft south of the Jennings Athletic Complex and Park
52-76
52-76
51-64
0-15
3100
11.47
NB-M Along the western Right-of-Way line from a point 450 ft south of Wildwood Lake Dr southerly for 2200 ft
55-71
54-72
54-64
0-10
2200
14.36
NB-N Along the western Right-of-Way line from the
Barker Rd bridge northerly to the railroad bridge 55-68 54-67 50-66 1-10 800 20.46
NB-R Along the eastern Right-of-Way line from the earth berm west of Heidelberg Rd northerly to a point 600 ft north of Cappy Ln
49-74
49-74
49-71
0-10
2000
11.1
NB-T Along the western Right-of-Way line from a point 2100 ft north of 9 Mile Rd to a point 2700 ft north of 9 Mile Rd.
53-68
53-68
53-65
0-4
600
16.00
NB-U Along the eastern Right-of-Way line from the NB on-ramp at 9 Mile Rd (Fieldcrest Dr) northerly for 900 ft
56-71
55-71
55-67
0-10
900
24.44
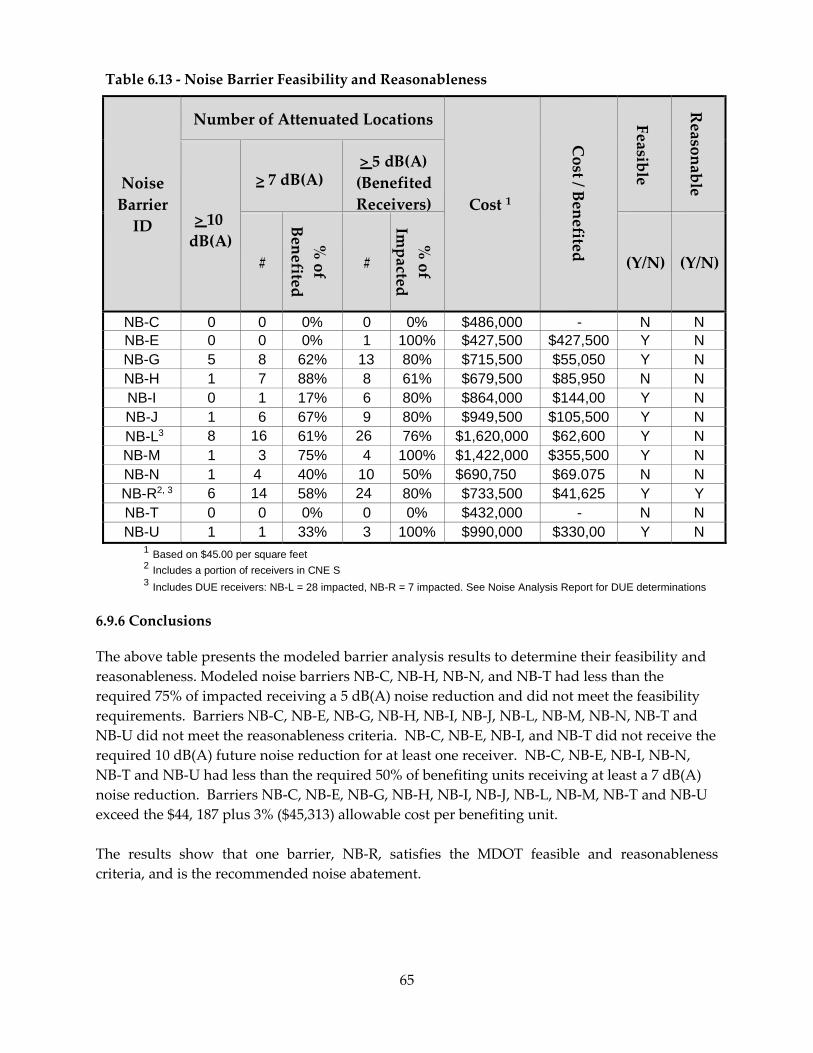
65
Table 6.13 ‐ Noise Barrier Feasibility and Reasonableness
Noise
Barrier
ID
Number of Attenuated Locations
Cost 1
Cost / B
enefited
Feasib
le
Reaso
nable
> 10
dB(A)
> 7 dB(A) > 5 dB(A)
(Benefited
Receivers)
#
% of
Benefited
#
% of
Impacted
(Y/N) (Y/N)
NB-C 0 0 0% 0 0% $486,000 - N NNB-E 0 0 0% 1 100% $427,500 $427,500 Y N NB-G 5 8 62% 13 80% $715,500 $55,050 Y N NB-H 1 7 88% 8 61% $679,500 $85,950 N N NB-I 0 1 17% 6 80% $864,000 $144,00 Y N NB-J 1 6 67% 9 80% $949,500 $105,500 Y N NB-L3 8 16 61% 26 76% $1,620,000 $62,600 Y N NB-M 1 3 75% 4 100% $1,422,000 $355,500 Y N NB-N 1 4 40% 10 50% $690,750 $69.075 N N NB-R2, 3 6 14 58% 24 80% $733,500 $41,625 Y Y NB-T 0 0 0% 0 0% $432,000 - N N NB-U 1 1 33% 3 100% $990,000 $330,00 Y N
1 Based on $45.00 per square feet 2 Includes a portion of receivers in CNE S 3 Includes DUE receivers: NB-L = 28 impacted, NB-R = 7 impacted. See Noise Analysis Report for DUE determinations
6.9.6 Conclusions
The above table presents the modeled barrier analysis results to determine their feasibility and
reasonableness. Modeled noise barriers NB‐C, NB‐H, NB‐N, and NB‐T had less than the
required 75% of impacted receiving a 5 dB(A) noise reduction and did not meet the feasibility
requirements. Barriers NB‐C, NB‐E, NB‐G, NB‐H, NB‐I, NB‐J, NB‐L, NB‐M, NB‐N, NB‐T and
NB‐U did not meet the reasonableness criteria. NB‐C, NB‐E, NB‐I, and NB‐T did not receive the
required 10 dB(A) future noise reduction for at least one receiver. NB‐C, NB‐E, NB‐I, NB‐N,
NB‐T and NB‐U had less than the required 50% of benefiting units receiving at least a 7 dB(A)
noise reduction. Barriers NB‐C, NB‐E, NB‐G, NB‐H, NB‐I, NB‐J, NB‐L, NB‐M, NB‐T and NB‐U
exceed the $44, 187 plus 3% ($45,313) allowable cost per benefiting unit.
The results show that one barrier, NB‐R, satisfies the MDOT feasible and reasonableness
criteria, and is the recommended noise abatement.
66
6.10 Environmental Contamination
A Project Area Contamination Survey (PACS), also known as a Phase I Environmental Site
Assessment, was performed to determine if known or potential sites of environmental
contamination exist that could affect the project’s design, cost, or schedule, and to meet the
requirements of Part 201 of the Michigan Natural Resources and Environmental Protection Act
(NREPA), 1994 PA 451, as amended. The PACS included a review of Michigan Department of
Environmental Quality (DEQ) files, interviews, and a site investigation.
The PACS identified three known and one potential site of environmental contamination within
or adjacent to the proposed project area:
two active gasoline stations located in the southwest and southeast quadrants of the
US‐23 and Territorial Road Interchange;
a former industrial facility located in the southwest quadrant of US‐23 and 8 Mile
Road;
and potential contaminated soil that may contain polynuclear aromatic
hydrocarbons (PNA) and metals at the Great Lakes Central Railroad crossing located
south of the US‐23 and 8 Mile Road Interchange.
No environmental contamination issues were identified with any proposed real estate
acquisition.
6.10.1 Mitigation
If excavation activities are to occur within the vicinity of the above noted known and potential
contaminated sites, an estimate for contaminated soil removal, and the Special Provision for
Non‐Hazardous Contaminated Material Handling and Disposal, should be included in the final
plan package. In addition, the Special Provision for Asbestos Removal and Disposal should be
included in the project package in anticipation of encountering asbestos conduits on bridges.
All contaminated media must be handled and disposed of appropriately in accordance with
state and federal regulations.
6.11 Wetlands
State and federal laws and regulations (Federal Executive Order 11990 and Part 303 of Michigan
Public Act 451 of 1994) protect wetlands and require that road construction avoid affecting
wetlands when prudent and feasible. If impacts to a wetland are unavoidable, impacts must be
minimized and mitigated by replacing lost acreage as closely as possible to and within the same
watershed as the impacted wetland.
The project will be conducted within the existing ROW with the exception of the newly
acquired ROW at North Territorial Road where 5 Mile Road will be relocated. This new stream
crossing will not impact wetlands. No impacts to wetlands have been identified within the
project limits.
67
6.12 Water Quality
6.12.1 Background
The Huron River Watershed is an approximately 900 square mile basin within Ingham, Jackson,
Livingston, Monroe, Oakland, Washtenaw, and Wayne Counties. It contains 10 Metroparks,
two‐thirds of all southeast Michigan’s public recreational lands, and many county and city
parks. The Huron River supplies drinking water to approximately 150,000 people and supports
an excellent smallmouth bass fishery. The Huron River is the only designated Scenic River in
southeast Michigan, and the Michigan Department of Natural Resources (MDNR) designated
27 miles of the Huron and three of its tributaries as “Country‐Scenic” River under the Natural
Rivers Act. The Huron River Watershed is further split into 29 “Creeksheds” or sub‐watersheds.
(Huron River Watershed Council, hrwc.org). This project is within “Upper Huron” and the
northern part of the “Middle Huron” portions of the Huron River Watershed.
The Upper Huron is a 545 square mile area that includes the headwaters of the Huron River and
several of its tributaries upstream of Portage Lake, constituting 60% of the Huron River
Watershed (Huron River Watershed Council, hrwc.org). The majority of the US‐23 ATM project
is within this portion. The Upper Huron is characterized by both urban and agricultural lands
and is experiencing intense development pressure. The Middle Huron Watershed contains 40
miles of the main stem of the Huron River with a drainage area of 217 square miles. Land cover
in the Middle Huron includes urban and sub‐urban residential, commercial and industrial uses,
low density residential and grasslands/old agricultural fields, forested lands, and scattered
wetlands primarily in the northern and western fringes (Lawson et al. 2011).
6.12.2 Legal Requirements
Federal ‐ Federal Water Pollution Control Act (FWPCA), as amended (33 U.S.C. 1251 et seq; the
ʺFederal Actʺ). The FWPCA provides the statutory basis for the NPDES permit program and the
basic structure for regulating the discharge of pollutants from point sources to waters of the
United States. Section 402 of the FCWA specifically requires EPA to develop and implement the
NPDES program.
State ‐ Michigan Act 451, Public Acts of 1994, as amended (the ʺMichigan Actʺ), Parts 31, and
Michigan Executive Orders 1991‐31, 1995‐4 and 1995‐18. MDOT has a statewide MS‐4
designation and is authorized to discharge from the separate storm water drainage system
operated by the Michigan Department of Transportation under NPDES Permit No. MI0057364.
Part 91, Soil Erosion and Sedimentation Control, of PA451 ‐ Natural Resources and Environmental
Protection Act (NREPA) provides for the control of soil erosion and protects adjacent properties
and the waters of the state from sedimentation.
68
6.12.3 Water Quality Impacts
6.12.3.1 TMDLs and Impaired Uses.
Total Maximum Daily Loads (TMDLs) are required by the FCWA for water bodies that do not
meet Water Quality Standards (WQS). A TMDL is developed by determining the maximum
daily load of a pollutant that a water body can assimilate and still meet the WQS. MDOT’s
statewide MS‐4 permit requires that the MDOT shall develop, implement, and enforce storm
water management programs designed to reduce the discharge of pollutants to the maximum
extent practicable, to protect the designated uses of the waters of the state, to protect water
quality, and to satisfy the appropriate state and federal water quality requirements. If a water
body has a TMDL, the maximum extent practicable includes the development, implementation,
and enforcement of storm water controls designed to meet the responsibilities established by
the TMDL. The MDOT Storm Water Management Program requires implementation of Best
Management Practices (BMPs) to comply with the minimum measures identified in the permit
and any TMDLs if applicable.
This project falls within three TMDL areas:
Strawberry Lake TMDL was developed due to excess phosphorus loading from
point and nonpoint sources in the Middle Huron River Watershed and covers the
entire project area.
Ford/Belleville Lakes TMDL was developed due to excess phosphorus loading from
point and nonpoint sources.
Geddes Pond (Huron River) TMDL is for E. coli and both Ford/Belleville Lake and
Geddes Pond (Huron River) TMDLs include the southern terminus of the project up
to 650 feet north of Joy Road.
In compliance with MDOT’s 2015 National Pollution Discharge Elimination System (NPDES)
permit, measures to avoid, minimize, and mitigate water quality impacts are compatible with
the long term goals for water quality for the Huron River Watershed.
The 2011 revised Watershed Management Plan for the Huron River in the Ann Arbor‐Ypsilanti
Metropolitan Area (Middle Huron) outlines quantitative and qualitative steps to restore and
protect the integrity of water quality and quantity of the Middle Huron River system (Lawson
et al. 2011). The long‐term goals of the plan are:
Reduce flow variability
Reduce nonpoint source loading and reduce soil erosion and sedimentation
Protect and mitigate loss of natural features for Stormwater treatment and wildlife
habitat
Increase public awareness and involvement in protecting water resources
Gain broad implementation of watershed management plan and associated plans, and
Continue monitoring and data collection for water quality, water quantity and
biological indicators
69
The Huron Chain of Lakes Watershed Management Plan (Huron Chain of Lakes Steering
Committee 2015) includes Strawberry Lake and has similar long term goals as listed above.
Additionally, the Strawberry Lake Phosphorus Management Plan’s (Livingston Watershed
Advisory Group, 2011) goal is to:
1. Restore and protect the water quality of the area with the goal of attaining the
Total Maximum Daily Load for Strawberry Lake.
Reducing sediment loading from post construction Stormwater will help in achieving these
goals.
6.12.3.2 Post‐Construction Impacts
The preferred alternative will result in a slight increase in impervious surface which will
increase the volume and flow rates of runoff from the roadway and sediment loads to
surface waters.
6.12.4 Mitigation Measures
To meet the goals of the TMDLs, stormwater will be treated for 80% sediment removal
using appropriate Best Management Practices (BMPs) before it enters any surface waters.
BMPs will also be used to reduce flow rates and volume to minimize potential erosion
issues.
MDOT shall phase out illicit connections to storm sewers, along with most previously
permitted storm sewer discharges and replaced with connections to sanitary sewers with
adequate pretreatment to the maximum extent practicable. All disturbed sewer lines will be
addressed in accordance with local ordinances. Beyond all these items, all other Michigan
Department of Community Health (MDCH), local health department and MDEQ
requirements designed to protect surface and groundwater quality will be met.
6.12.4.1 Soil Erosion and Sedimentation Control During Construction.
MDOT will control accelerated sedimentation caused by construction before it enters the
Huron River Watershed or leaves the right‐of‐way by the placement of temporary or
permanent erosion and sedimentation control measures. MDOT has developed a series of
standard erosion control items to be included on design plans to prevent erosion and
sedimentation. The design plans will describe the erosion controls and their locations. The
following is a partial listing of general soil erosion and sedimentation control measures that
will be carried out in accordance with permit requirements.
Restrict work in the water channels during periods of seasonally high water, except as
necessary to prevent erosion. Restrict work in the stream from March 1 through June 30
to protect fisheries in sensitive streams.
70
Provide adequate sedimentation controls around the shore work areas to provide the necessary
protection for mussels, fish, and other aquatic life forms.
Protect road fill side slopes, ditches, and other raw areas draining directly into the surface
waters with riprap (up to three feet above the ordinary high water mark), sod, seed and
mulch, or other measures, as necessary to prevent erosion.
Stabilize and vegetate areas disturbed by construction activities within five days after final
grading has been completed. Where it is not possible to permanently stabilize a disturbed
area, appropriate temporary erosion and sedimentation controls will be implemented. All
temporary controls will be maintained until permanent soil erosion and sedimentation
controls are in place and functional.
The contractor shall have the capability to perform seeding and mulching at locations within
150 feet of any streams or drains within 24 hours of being directed to perform such work by
the project engineer.
Protect the natural vegetative growth outside the projectʹs slope stake line from removal or
siltation. Natural vegetation, in conjunction with other sedimentation controls, provides
filtration of runoff not carried in established ditches.
Prevent the tracking of material onto local roads and streets. If material is tracked onto roads
or streets, it shall be removed by the Contractor.
6.13 Floodplains and Hydraulics
Federal laws and regulations require MDOT to determine whether a proposed project would
encroach upon any floodway or affect any floodplain (23 CFR 650 and Executive Order 11998).
Floodplain analysis must determine whether the project creates or increases a hazard to people
or property and whether there is an impact on natural and beneficial floodplain values. These
values include fish, wildlife, plants, open space, natural beauty, scientific study, outdoor
recreation, agriculture, aquaculture, forestry, natural moderation of floods, water quality
maintenance and groundwater recharge.
A new structure to carry 5 Mile Road over the Catholic Church Horseshoe Lake drain will have
approximately the same dimensions as the N. Territorial Road culvert and no harmful effect
will occur based upon modeling of the structure and surrounding features. The existing culvert
under North Territorial Road will be replaced with a design having no harmful effect based
upon additional hydraulics analysis.
The existing twin 6’ by 10’ culverts that carry the Horseshoe Lake Outlet Drain under at the US‐
23 bridges over the railroad will be extended approximately 10 feet on each side due to the
widening of the highway bridges. A hydraulic assessment is in process where the results will
affect the final culvert design to ensure no harmful effects will occur.
71
6.14 Wild and Scenic Rivers or State Designated Natural Rivers
The Wild and Scenic Rivers Act of 1968 prohibits federal support for actions, such as the
construction of dams or other instream activities that would diminish the riverʹs free flow or
outstanding resource values. Similarly, the goal of Michigan’s Natural Rivers Program,
formerly known as the Natural River Act and now known as Part 305 of Public Act 451 of 1994,
is to preserve and enhance a river’s value for a variety of reasons including aesthetics, free‐
flowing condition, recreation, boating, water conservation, floodplain and fisheries and wildlife
habitat.
There are no waterways that fall under the Wild and Scenic Rivers Act of 1968 or under the
State of Michigan Part 305 of Public Act 451 of 1994.
6.15 Stream and Drain Crossings
The project includes four stream crossings in Washtenaw County. One crossing is located in
Section 5 of Ann Arbor Township and three are located in Northfield Township in sections 6
and 20. There are no mapped floodplains for stream crossings within the project limits.
US‐23 crosses over the upper reach of Traver Creek (Figure 6.3) in Section 5 of Ann Arbor
Township. The existing 36” cross culvert will not be affected by the project as the crossing is
enclosed as it crosses the ROW.
A crossing of the Catholic Church Horseshoe Lake drain in Section 20 of Northfield Township is
located within the interchange of US‐23 and North Territorial Road (Figure 6.2). The existing
9’9”x 6’7” metal plate arch culvert located under North Territorial Road on the east side of the
interchange will be replaced with an 8’ x 14’ box culvert. A hydraulic analysis shows this
structure is adequately sized and this culvert will remain in place. A new crossing with an 8’ x
14’ box culvert will be located 467 feet north of the North Territorial Road culvert to carry the
relocated Five Mile Road to a new connection to North Territorial Road.
US‐23 crosses over a tributary of Catholic Church Horseshoe Lake drain (Figure 6.2) in Section
20 of Northfield Township. The existing 60” cross culvert will not be impacted by the project as
the crossing is enclosed as it crosses the ROW.
US‐23 crosses over Horseshoe Lake Outlet Drain (Figure 6.1) in Section 6 of Northfield
Township, Washtenaw County; this stream is known as Horseshoe Creek in Livingston County.
The 6’ x 10’ twin culvert lies between Barker Road on the south and the US‐23 railroad bridge to
the north. The existing twin culvert will be extended approximately 10 feet on each side. Flow
will be maintained in one of the culverts while the other culvert is extended.
72
6.16 Fish and Wildlife
The project corridor is located north of the City of Ann Arbor and ends north of the village of
Whitmore Lake in a fragmented landscape consisting of agricultural land, deciduous woodlots,
and areas devoted to business and residential land use. Preserved natural land is present in
Northfield Township (section 32) where the approximately 80‐acre Northfield Woods Preserve
is located directly east of the US‐23 ROW.
General wildlife surveys were conducted in conjunction with searches for threatened and
endangered species. An area within one half mile each side of the ROW was used to collect
information on animal communities that could be influenced by the project. A total of 52
vertebrate species were documented during five days of survey, with a total of four
amphibians, three reptiles, three mammals, and 42 birds observed. Additional observations
added 25 additional bird species to the species list (Wolinski, unpublished observations 2006 to
2013); most associated with the open water of Whitmore Lake. None of these species are listed
as a species of special conservation concern by the state of Michigan.
A Great Blue Heron colony consisting of five active nests was found west of US‐23 at the Six
Mile Road interchange in Northfield Township (section 18). The colony is located about 560 feet
west of the ROW and is not documented in the current MNFI database.
Stick nests of the Osprey (Pandion haliaetus), a species of special concern, are located on two cell
towers along the project corridor‐ Whitmore Lake Road at Joy Road and at Eight Mile Road
west of US‐23, both in Washtenaw County.
Inspection of the stream bottom downstream of the North Territorial Road culvert to the
location of the proposed new Five Mile Road crossing revealed a generally sandy,
unconsolidated bottom with some woody debris accumulation along sections of the stream
bank. Clear flowing water approximately 12 to 18‐inches deep was found on all of the dates
observations were conducted. The stream is shaded by trees and shrubs along most its length at
this location. No fish or mussels were observed in this reach of the stream, though the Green
Frog (Rana calmitans) was found on the shoreline in a wetland pocket along the east shoreline in
an open area north of the proposed road crossing.
6.16.1 Migratory Birds
Completed site inspections of bridges were completed within the corridor as part of the general
wildlife survey work. Use of two structures by migratory birds was found at the Barker Road
bridges and at the railroad bridge south of Eight Mile Road.
No impact will occur as long as the provisions of the Migratory Bird Treaty Act regarding nest
removal are followed when swallows or other migratory birds are present. The Special
Provision for Migratory Bird Protection will be part of the final plan package and implemented
during construction. Please contact the MDOT Wildlife Ecologist if you have any questions.
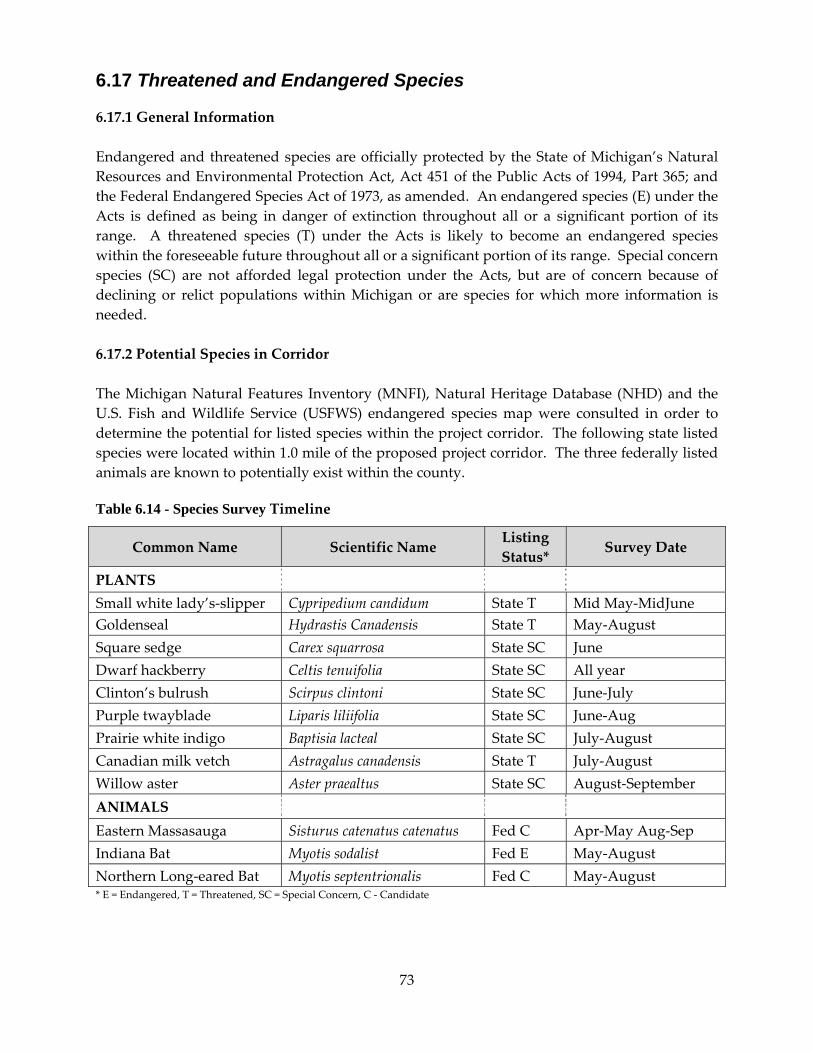
73
6.17 Threatened and Endangered Species
6.17.1 General Information
Endangered and threatened species are officially protected by the State of Michigan’s Natural
Resources and Environmental Protection Act, Act 451 of the Public Acts of 1994, Part 365; and
the Federal Endangered Species Act of 1973, as amended. An endangered species (E) under the
Acts is defined as being in danger of extinction throughout all or a significant portion of its
range. A threatened species (T) under the Acts is likely to become an endangered species
within the foreseeable future throughout all or a significant portion of its range. Special concern
species (SC) are not afforded legal protection under the Acts, but are of concern because of
declining or relict populations within Michigan or are species for which more information is
needed.
6.17.2 Potential Species in Corridor
The Michigan Natural Features Inventory (MNFI), Natural Heritage Database (NHD) and the
U.S. Fish and Wildlife Service (USFWS) endangered species map were consulted in order to
determine the potential for listed species within the project corridor. The following state listed
species were located within 1.0 mile of the proposed project corridor. The three federally listed
animals are known to potentially exist within the county. Table 6.14 - Species Survey Timeline
Common Name Scientific Name Listing
Status* Survey Date
PLANTS
Small white lady’s‐slipper Cypripedium candidum State T Mid May‐MidJune
Goldenseal Hydrastis Canadensis State T May‐August
Square sedge Carex squarrosa State SC June
Dwarf hackberry Celtis tenuifolia State SC All year
Clinton’s bulrush Scirpus clintoni State SC June‐July
Purple twayblade Liparis liliifolia State SC June‐Aug
Prairie white indigo Baptisia lacteal State SC July‐August
Canadian milk vetch Astragalus canadensis State T July‐August
Willow aster Aster praealtus State SC August‐September
ANIMALS
Eastern Massasauga Sisturus catenatus catenatus Fed C Apr‐May Aug‐Sep
Indiana Bat Myotis sodalist Fed E May‐August
Northern Long‐eared Bat Myotis septentrionalis Fed C May‐August * E = Endangered, T = Threatened, SC = Special Concern, C ‐ Candidate
74
6.17.3 Flora Review
During 2014, four separate field surveys were conducted in an effort to determine the
presence/absence of listed plant species within the project limits. The field surveys were
conducted on May 29, July 9, August 20, and September 5. These investigations focused on the
best survey windows for each species in an effort to determine their existence. These dates also
provided a wide survey window throughout the entire growing season to assure that any listed
species present would be observed. Due to the cold and wet spring that we encountered during
2014, the first survey was delayed till the end of May.
Within the corridor, much of the right‐of‐way (ROW) is mowed and maintained yearly. This
leaves a thick sod composed of typical ROW grasses that is unsuitable for most listed plant
species. Each of the species listed above will be discussed individually below in regards to their
preferred plant community and its availability within the project corridor.
Small white lady’s slipper ‐ This species prefers prairie fens or other alkaline ground water fed
sites, which are not present in the project corridor. The woodland edges seen throughout the
corridor are maintained as wet ditches and contain some native grasses. These areas were all
surveyed for the species and it was not located.
Goldenseal – This species prefers pockets of rich, shady, mesic southern forests often slopes
with little herbaceous growth. Most of the suitable habitat for this species falls just outside
MDOT ROW and is located on private property on the west side of the highway in the middle
of the project corridor. Since the ROW is cut and devoid of all large trees, the ROW fence
represents the edge of this plant community. Since these areas receive much more daylight and
a true forest canopy does not exist within MDOT ROW, most areas are unsuitable for the
species.
Square Sedge ‐ This species is typically located in floodplain forests, along the lower river
bottoms, seasonally wet pools, dry‐mesic forests, successional wetlands and pastures. As noted
above, most of the mesic wetlands and floodplain communities fall outside MDOT’s ROW and
all wet ditches and water crossings were surveyed for this species.
Dwarf hackberry ‐ This species prefers open and early successional communities and is often
seen at woodland edges and along the tops of backslopes associated with transportation
ROW’s. This species has a great deal of potential habitat within the corridor however; it was
not located during any of the field surveys.
Clinton’s bulrush ‐ This species prefers wet to mesic prairies in Lower Michigan. This
community is not present specifically within the corridor however; lower quality wetlands and
mowed ditches were surveyed for the species consistent with Small white lady’s slipper and
Square sedge.
75
Purple twayblade ‐ This species prefers deciduous forests, brushy thickets and mesic floodplain
forests. These communities are present predominantly in the middle of the proposed project
where the ROW edges are dominated by forested uplands and wetlands. Suitable habitat for
this species is also located at the southern end of the project where thickets dominate the ROW
edges. These areas were the targets for this species during field surveys.
Prairie false indigo ‐ This species prefers prairies, savannas and open woodland edges. Habitat
for this species exists throughout the corridor from the open grassy ROW to the edge of the
woodlands associated with over half of this project. There is also a specific record from 1990
located just northeast of the carpool lot located at the southern end of the corridor. These areas
were surveyed extensively but the species and old record were not located.
Canadian milk vetch ‐ This species occurs in a variety of communities including oak barrens,
moist openings over limestone, wet ground and sandy lakeshores. Most of these habitats do
not exist within the corridor with the exception of the existing ditches and a small oak savanna
located east of the highway in the middle of the project. This small savanna remnant is located
on school property and will not be impacted by the proposed project. The remaining wet
ditches were surveyed along with the other species and this species was not located.88
Willow Aster ‐ This species is primarily found in fields, thickets, weedy successional openings
and remnant lake plain prairies. While the first three community types are present within the
corridor, the lake plain prairie is not. Most of the suitable habitat for this species is located at
the north end of the corridor; however, this is all mowed and maintained on a yearly basis to
the ROW fence.
6.17.4 Fauna Review
A record for the Federal Candidate species Eastern Massasauga (Sisturus catenatus catenatus)
from section 20 of Northfield Township dated 1986 is about 0.56 mile from the ROW limits.
Suitable foraging habitat is located as close as 0.25 mile to the ROW. There are no other records
of listed Federal or state species near the project limits.
Tree removals associated with the project will occur mainly at the proposed relocation of Five
Mile Road north of North Territorial Road. This 3.32 acre wooded area holds trees that are
greater than 3‐inches in diameter and are located directly adjacent to the Catholic Church
Horseshoe Lake drain. These trees could offer suitable habitat for listed bat species, specifically
Indiana Bat (Myotis sodalis) and Northern Long‐eared Bat (Myotis septentrionalis).
An inspection of the area found no suitable roost or maternity trees for Indiana Bat, and with a
heavy, dense understory and margins, little access for Northern Long‐eared Bat. The stream
corridor and field edge offer some utility as a travel corridor and offer some value as foraging
habitat; though wooded areas away from the ROW offer superior roosting and foraging habitat
for both species. Given these observations, this wooded area would be considered of very low
76
quality and it is expected that bats would not occupy this small wooded fragment. Cutting of
trees in this area should be minimized to the greatest extent possible to conserve general
wildlife habitat.
6.17.5 Conclusion
During the field surveys, no state or federally listed T/E/SC plant or animal species were located
within the proposed project corridor. Based upon this review, no further field surveys or
coordination with the Michigan Department of Natural Resources or the U.S. Fish and Wildlife
Service is required. A Michigan Endangered Species Permit and/or USFWS Section 7
consultation is not required for this project.
6.18 Coastal Zones Resources
Coastal management in Michigan is part of a nationwide federal‐state partnership established
under the Coastal Zone Management Act (CZMA) of 1972. Coastal management means
achieving a balance between natural resources preservation and economic development along
our Great Lakes coasts.
This project is outside of the Coastal Zone Management Boundary. Federal consistency review
is not required.
6.19 Cultural Resources
MDOT must comply with Section 106 of the National Historic Preservation Act of 1966, as
amended, and Section 4(f) of the Department of Transportation Act of 1966, by identifying all
properties eligible for listing on the National Register of Historic Places within the Area of
Potential Effect (APE) for the project. The APE, always established in consultation with the
State Historic Preservation Office (SHPO), represents the maximum area potentially affected by
the project.
The National Register of Historic Places is the official list of the historic places worthy of
preservation across the United States. The Nation Park Service, a part of the U.S. Department of
the Interior, administers the National Register. To qualify for listing on the National Register,
properties must be at least fifty years old and meet one of the following criteria:
Be associated with a significant event;
Be associated with the life of a significant person;
Embody the distinctive characteristics of a type, period or method of construction; or
represent the work of a master; or
Have yielded or may be likely to yield historic or prehistoric information.
Amendments to the Historic Preservation Act in 1992 protect properties having traditional
religious or cultural importance to Native Americans.

77
6.20 Historic and Archaeological Resources
6.20.1 Historic
No historic properties will be affected by the proposed project based on a consultation meeting
with the State Historic Preservation Office (SHPO) on July 28, 2014. No effect is anticipated at
the one historic above ground resource within the project limits, namely the St Patrickʹs
Cemetery, which is adjacent to the Northfield Church/Isom Rest Area. St Patrickʹs Church and
Rectory are outside of the Area of Potential Effect for the proposed scope of work.
6.20.2 Archaeological
MDOT conducted an archaeological survey during June and July of 2014. One archaeological
site, assigned site number 20WA443 by the State Archaeologist, was identified. MDOT
determined, in consultation with the SHPO on September 11, 2014 that site 20WA443 is not
eligible for listing on the National Register of Historic Places. Therefore, no archaeological
properties will be affected by the proposed project. MDOT also consulted, on behalf of FHWA,
with the twelve federally recognized Indian Tribes of Michigan. A copy of MDOT’s consultation
letter can be found in Appendix D.
6.20.3 Traditional Cultural and Religious Properties
MDOT conducted research to determine if any Traditional Cultural and/or Religious Properties
are present within the study area. MDOT determined, in consultation with the SHPO on
September 11, 2014, that no such properties are known to be present. However, no such study
can be completed without input from the twelve federally recognized Indian Tribes of
Michigan. To that end, MDOT contacted each Tribe in writing; a copy of that letter can be
found in Appendix D.
6.21 Indirect Impacts and Cumulative Effects
CEQ regulations implementing NEPA define indirect effects as those that are caused by the
action and are later in time or farther removed in distance, but are still reasonably foreseeable.
Indirect effects may include growth‐inducing effects and other effects related to induced
changes in the pattern of land use, population density or growth rate, and related effects on air,
water, and other natural systems, including ecosystems (40 CFR 1508.8(b)).
CEQ regulations define cumulative effects as “the impact on the environment which results
from the incremental impact of the action when added to other past, present and reasonably
foreseeable future actions regardless of what agency (federal or non‐federal) or person
undertakes such other actions. Cumulative impacts can result from individually minor but
collectively significant actions taking place over a period of time” (40 CFR 1508.7). Thus,
cumulative effects include the direct and indirect impacts of a project together with the impacts
from reasonably foreseeable future actions of other projects.
78
Direct and indirect impacts of the proposed project, as well as other, past current or reasonably
foreseeable projects near the US‐23 corridor within the study area, are relevant for review of
cumulative effects. Other local projects not related to the corridor could also contribute to
cumulative effects on a resource.
6.21.1 Indirect Impacts
The potential for other development or other changes to the existing land use or the
environment potentially induced by the proposed project was assessed. The potential indirect
impacts include further development of land in the vicinity of the interchanges along US‐23 and
land adjacent to the US‐23 corridor within the project study area. The direct impacts on each
resource were considered, and the likelihood of the proposed project to induce additional
indirect changes was considered.
6.21.2 Cumulative Effects
The cumulative effects assessment considered projects that could incrementally affect the
existing environment along with the proposed project. The information reviewed for this EA
included, other transportation projects, known or planned residential and commercial
developments. Coordination with local and regional planning agencies took place to acquire
information for these potential types of developments. The effects of past actions were also
included as part of the cumulative effect analysis.
The Washtenaw Area Transportation Study (WATS) 2040 Long Range Plan does not indicate
any local transportation projects in the vicinity that would have an effect on the US‐23 corridor.
All of the local transportation projects that are planned in the area are preservation projects and
would not change the operations of the US‐23 corridor. The traffic growth rate was developed
with the use of the WATS and SEMCOG model and assesses and incorporates the 2040 forecast
year transportation network for the Washtenaw County and SEMCOG area.
With all the social, economic and environmental factors examined and considered in the review
of the Indirect Impacts and Cumulative Effects for this project it is determined that the project
will only have temporary impacts and will ultimately improve the flow of people, goods and
services throughout the corridor.
6.22 Maintaining Traffic during Construction
6.22.1 US‐23 Mainline
As such the maintain traffic concept for mainline requires that all lanes be open during peak
hours with a single lane allowed at night and off‐peak. This concept attempts to minimize the
congestion associated with the construction and impacts to local stakeholders.
79
Stage 1 involves a nighttime single lane closure to upgrade the outside shoulders. Detours and
daytime work would be impractical for this stage as there are no suitable detour routes for
US‐23. Any peak hour lane closures result in far too much delay to local stakeholders.
Stage 2 consists of shifting traffic to the newly upgraded outside shoulders and constructing
the new pavement for the Active Traffic Management system. No peak hour lane closures or
detours of US‐23 will be permitted.
6.22.2 Bridges
Several bridges over U‐23 we be reconstructed as a part of the project. These bridges will
maintain a minimum of one lane of traffic at all times. Utilizing directional detours, access can
be maintained for all roadway users. The local bridges over US‐23 that will be replaced
include N. Territorial, 6 Mile, and 8 Mile Roads. N. Territorial and 6 Mile road will be
constructed on the existing alignment. The 8 Mile Road replacement is anticipated to be
constructed north of the existing bridge.
MDOT is considering the use of Accelerated Bridge Construction (ABC) methods to minimize
the impacts to motorists at all bridge replacements as stated in Section 5.2.
The US‐23 bridges over Barker Road will be widened on the median side to accommodate the
ATM. This will be coordinated with the mainline road improvements while maintaining two
lanes of traffic in each direction.
The US‐23 bridges over the Great Lakes Central Railroad are anticipated to be replaced as part
of the project. The bridge replacement will be staged in three stages to maintain four lanes of
traffic during peak hours at this location and use an ABC method called a bridge slide. A
bridge slide entails building the new span next to the old span, temporarily diverting traffic
onto the new span while the old span is demolished. The new span is then slid into place
where the old span was located. The MDOT M‐50 bridge replacement is an example of a
bridge slid and can be viewed through this link: https://www.youtube.com/watch?v=Pa1audos1Uk.
Stage 1: A temporary roadway will be constructed east of the NB roadway with a temporary
bridge over the railroad.
Stage 2: NB traffic will be shifted to the temporary roadway. SB traffic will be shifted to the
old southbound roadway. The old NB roadway at this point will be reconstructed to
accommodate two lanes in each direction.
Stage 3: All US‐23 Traffic will be maintained on the newly constructed SB US‐23. The old
northbound bridge will be removed and the permanent bridge footings and substructure will
be constructed. The permanent bridge deck which was constructed in Stage 1 will be slid onto
the NB US‐23 substructure and the roadway will be reconstructed. NB traffic will then be
placed into their original lanes.
80
Short duration full detours are preferred for the construction of the ramp extensions.
Directional signage will detour drivers during these brief construction periods. Throughout all
stages message boards, signs, and website updates will be used to notify drivers of detours,
delay, and alternate routes. The US‐23 Maintaining Traffic Concept for the EA is located in
Appendix B.
6.23 Permits
Proposed construction activities may involve the need for permits in several areas. Impacts on
bodies of water such as lakes, streams, drains, and wetlands may require permits under:
State:
PA 451, Natural Resources and Environmental Protection Act, 1994, as amended
Part 31, Water Resources Protection of Act 451
Part 55, Air Pollution Control of Act 451
Part 301, Inland Lakes and Streams of Act 451
Federal:
Sections 401 and 404 of the Federal Water Pollution Control Act of 1972.
Water Quality Act Section 402 National Pollutant Discharge Elimination System
(NPDES) storm water permit under the Clean Water Act of 1972 as amended.
Executive Order 11990
Parts 31 and 301 are administered by the Michigan Department of Environmental Quality
(MDEQ). A Part 31 Water Resources Protection Permit (which is reviewed and issued with the
Part 301 application) is needed to place fill material within any part of a floodplain with a
drainage area of 2 square miles or greater. A Part 301 Inland Lakes and Streams Permit is
required for any work below the ordinary high water mark of any inland lake, stream or drain
including the placement of a permanent or temporary crossing, culvert or bridge, haul road, or
construction access pad.
Section 401 requires certification from the stateʹs water quality agency (MDEQ) to ensure that
the discharge of dredged or fill material complies with the provisions of the Federal Water
Pollution Control Act.
Water Quality Act Section 402 requires a National Pollutant Discharge Elimination System
Storm Water discharge permit for construction projects which involve earth disturbance of five
acres or greater. Permit application requirements include the name of receiving water,
identification of soil erosion controls during construction, and identification of measures to
control pollutants in storm water discharges that occur after construction has been completed.
The intent of these requirements is to reduce impacts on water quality during and after
construction of the project.
81
Executive Order 11990 states that when federal funds are used on a project, impacts on any
wetland (regardless of size) will require that no “Prudent or Feasible Alternative” exists that
would eliminate or reduce impacts on that wetland.
Final mitigation measures proposed in areas requiring the above permits will be developed in
consultation with the appropriate resource agencies, and will be included in the permit
application.
6.24 Construction Impacts and Measures to Minimize during Construction
The goal of project mitigation is to preserve, to the greatest extent possible, existing
neighborhoods, land use, and natural resources, while improving transportation. Although
some adverse impacts are unavoidable, MDOT through the project development, design,
environmental, and construction processes, takes precautions to protect as many social and
environmental systems as possible. Specific project mitigation items being considered at
this time can be found in the Project Mitigation Summary Green Sheet located at the end of this
section. A Final Green Sheet will be prepared and included in the project Finding of No
Significant Impact (FONSI). The Green Sheet may be modified during the final design, right‐
of‐ way or construction phases of this project.
Construction activities, which include the general mitigation measures listed below, are those
contained in the 2012 MDOT Standard Specifications for Construction. These measures
include:
1. The contractor shall locate all active underground utilities prior to starting work,
and shall conduct his operations in such a manner as to ensure that those utilities not
requiring relocation will not be disturbed. Relocated utilities may be temporarily
interrupted for short time periods.
2. Accelerated erosion and sedimentation caused by highway construction will be
controlled before it enters a water body or leaves the highway right‐of‐way by placing
temporary or permanent soil erosion and sedimentation control measures. MDOT has
developed a series of standard erosion/sedimentation control items to be included on
design plans to prevent erosion and sedimentation. The design plans will describe the
s o i l erosion and sedimentation controls and their locations.
3. All regulations on the MDEQ governing disposal of solid wastes must be complied
with. When surplus or unsuitable material is to be disposed of outside the right‐of‐
way, the contractor shall obtain and file with MDOT written permission from the owner
of the property on which the material is to be placed. If federal funds are used for
this project, Executive Order 11990 states that no surplus or unsuitable material is to be
temporarily or permanently disposed of in any public or private wetland area,
82
regardless of size. In addition, no surplus or unsuitable material is to be temporarily or
permanently disposed of in any watercourse or floodplain.
4. Disruption of traffic in the construction area will be minimized to the greatest extent
possible. Although the control of all construction‐related inconveniences is not
possible, motorist and pedestrian safety will be ensured by signing all construction
areas. All lane closures, traffic shifts, short term detours, and changed travel
patterns will be clearly marked. Access will be maintained to adjacent properties
during construction to the extent possible.
5. The contractor must comply with all federal, state, and local laws and regulations
governing the control of air pollution. During the construction of the project, the
contractor will be responsible for adequate dust‐control measures so as not to cause
detriment to the safety, health, welfare, or comfort of any person, or cause damage to
any property, residence or business. All bituminous and Portland cement concrete
proportioning plants and crushers must meet the requirements for the rules of Part 55
Air Pollution Control, of Act 451, Natural Resource and Environmental Protection.
Design plans will be reviewed by MDOT prior to contract letting in order to incorporate any
additional social, economic, or environmental protection items. The construction site will be
reviewed to ensure that the mitigation measures proposed are carried out, and to determine if
additional protection is required. More mitigation measures may be developed if additional
impacts are identified. Specific mitigation items are listed in the Project Mitigation Summary
Green Sheet and will be included on the design plans, project proposal, and permit
applications.
The final mitigation package will be reviewed by MDOT representatives, in cooperation with
concerned state, federal, and local agencies. Some changes in the early mitigation concepts
discussed in this document may be required when design begins or when in‐ depth soil borings
are taken and analyzed. These mitigation concepts will be implemented to the greatest extent
possible. Where changes are necessary, they will be designed and field reviewed before
permits are applied for and construction begins. Changes may also be necessary during the
construction phase, but they will reflect the early mitigation intent.
83
Project Mitigation Summary (Green Sheet) For the Preferred Alternative
January 16, 2015
Environmental Assessment
Proposed US-23 Improvements
From the West US-23/M-14 Interchange North 10.2 Miles to Silver Lake Road in Green Oak, Northfield, and Ann Arbor Townships,
Livingston and Washtenaw Counties, Michigan This Project Mitigation Summary “Green Sheet” contains project specific mitigation measures being considered at this time. An updated “Green Sheet” will be prepared and included in the Finding of No Significant Impact (FONSI) for this project. These mitigation items may be modified during the final design, right-of-way acquisition, or construction phases of this project. I. Social and Economic Environment
A. Relocations and Access to Residential and Commercial Properties - This project will require 10.6 acres of additional fee ROW for the N. Territorial Road interchange reconfiguration and 5 Mile Road realignment. Grading permits (1.7 acres) may be required at the six locations where crash investigation sites (CIS) will be located along US-23. Construction easements will be required for access through private property to build the barrier along the ROW. A consent-to-grade driveways permit will also be required on this project. Access to adjacent residential and commercial properties will be maintained during construction. All fee ROW will be acquired in conformance with the federal Uniform Relocation Assistance and Real Properties Acquisition Policies Act of 1970, as amended.
B. Noise Impacts – The Michigan Department of Transportation noise abatement analysis has identified one feasible and reasonable noise barrier location along the project corridor. The noise barrier will be located on the east side of US-23 from north of the US-23 on ramp at Eight Mile Road northerly to Dort Drive. The new noise wall will be approximately 2000 feet long with an average height of 11 feet and will provide noise abatement for 24 residences and a private school. The barrier will be concrete post and panel constructed 2 to 3 feet inside MDOT ROW along the ROW line. Grading permits (10 feet) will be required on the residential side of the ROW. An engineering level noise abatement analysis will be completed on the warranted abatement measure to ensure it meets final design phase feasibility and reasonableness criteria. If during final design these conditions have substantially changed, the abatement measures might not be provided. A final decision of the installation and aesthetics of the abatement measures(s) will be made upon
84
completion of the project’s final design and the Context Sensitive Design process. A meeting to discuss the noise wall aesthetics will be offered to all affected property owners.
C. Recreational Properties – There are four recreational properties directly adjacent to the proposed project and two other recreational properties just outside of the project limits. The Contractor shall not park any vehicles or store any equipment or materials on any public recreational property. Access to the recreational properties must be maintained at all times during construction. The “Special Provision for Construction Staging Areas” will be included in the project proposal.
D. Air Quality Impacts – The construction period is of short duration and construction mitigation is not required. However, several voluntary measures may be implemented by the Contractor to reduce engine activity or reduce emissions per unit of operating time. Construction equipment should be kept clean, tuned-up, and in good operating condition. MDOT’s Standard Construction Specification Sections 107.15(A) and 107.19 would apply to control fugitive dust during construction and cleaning of haul roads. All MDOT vehicles and equipment must follow MDOT Guidance #10179 (2/15/2009) Vehicle and Equipment Engine Idling.
II. Natural Environment
A. Stream Crossings – There are four stream culverts within Washtenaw County on this project. US-23 crosses over the upper reaches of Traver Creek through a 36” cross culvert. There is no median inlet and this stream will not be impacted by the construction of the US-23 ATM.
A tributary of the Catholic Church Horseshoe Lake County Drain crosses US-23 through a 60” cross culvert. The culvert does not have a median inlet and will not be impacted by the construction of the US-23 ATM.
The Catholic Church Horseshoe Lake Drain is carried under North Territorial Road in a 9’9” by 6’7” plate arch culvert which will be replaced with an 8’ by 14’ box culvert. A new 8’ by 14’ culvert crossing of the Catholic Church Horseshoe Lake Drain will be required for the relocated 5 Mile Road to the north. A staging plan will be developed to maintain stream flow during culvert replacements except for short periods of time required to place culvert sections.
The existing twin 6’ by 10’ culverts that carry the Horseshoe Lake Outlet Drain under US-23 between Barker Road and the US-23 railroad bridge to the north will be extended approximately 10 feet on each side. The drain flow will be maintained in one of the culverts while the other culvert is extended.
B. Agricultural Land – There are seven parcels of land enrolled in the Act 451, Part 361, Farmland and Open Space Preservation (old PA 116), within the project area but only one parcel is directly adjacent. These properties are not expected to be impacted by any type of ROW acquisition or grading permits. The Special Provision (SP) for PA 451, Part 361 (formerly PA 116) enrolled properties will be included in
85
the project proposal. This SP states “No borrow shall be taken from the PA 116 enrolled properties and no disposal of excess or unsuitable material will be allowed on these properties”.
C. Wetlands – No wetlands have been identified within the US-23 ROW within the project limits. Soil erosion and sedimentation controls will be implemented to protect adjacent wetlands outside of MDOT ROW.
D. Floodplains - Culvert sizes will be reviewed (and increased if necessary) in the design phase following completion of the hydraulic and scour analysis’s to ensure that culverts are able to pass the 100 year storm event without increasing backwater elevations.
E. Water Quality - Best Management Practices (BMP’s) will be used to treat storm water when designing the US-23 drainage systems. BMP’s such as routing road and bridge runoff through vegetated swales prior to discharge into project water courses will be included in this project. BMP’s will also be used to reduce flow rates and volume to minimize potential erosion issues.
F. Wildlife Resources - The “Special Provision for Migratory Bird Protection” will be set up on this project and be implemented during construction to avoid impacts to nesting birds for the proposed widening at the Great Lakes Central railroad overpass south of 8 Mile Road and also the bridge at Barker Road.
III. Hazardous/Contaminated Materials
A. Environmental Contamination - The Project Area Contamination Survey (PACS) identified three known and one potential site of environmental contamination within or adjacent to the proposed project area: two active gasoline stations located in the southwest and southeast quadrants of the US-23 and Territorial Road Interchange; a former industrial facility located in the southwest quadrant of US-23 and Eight Mile Road; and potential contaminated soil that may contain Polynuclear Aromatic Hydrocarbons (PNA’s) and metals at the Great Lakes Central Railroad crossing located south of the US-23 and Eight Mile Road Interchange. No environmental contamination issues were identified with any proposed real estate acquisition.
If excavation activities are to occur within the vicinity of the above noted known and potential contaminated sites, an estimate for contaminated soil removal, and the Special Provision for Non-Hazardous Contaminated Material Handling and Disposal, should be included in the final plan package. In addition, the Special Provision for Asbestos Removal and Disposal should be included in the project package in anticipation of encountering asbestos conduits on bridges. All contaminated media must be handled and disposed of appropriately in accordance with state and federal regulations.
86
IV. Construction
A. Maintaining Traffic – Both lanes of US-23 traffic in each direction will be kept open during peak hours and a single lane is allowed at night and during off peak hours. Traffic on US-23 ramps may be closed for short periods of time during reconstruction. Traffic on local roads where bridges (North Territorial, 8 Mile, and 6 Mile) will be replaced will be detoured over local roads to adjacent bridges crossing US-23. At least one local road bridge will be open while the other two are being replaced. Throughout all stages, message boards, signs, and website updates will be used to notify drivers of detours, lane closures, traffic shifts, and changed travel patterns. MDOT will coordinate with local officials to provide updated project information to assist all motorists including emergency vehicles (police, fire, and ambulance), school buses, and public transit.
B. Soil Erosion/Sedimentation Control - Strict soil erosion and sedimentation controls will be set up and maintained during construction.
C. Construction Noise and Vibration- Construction noise will be minimized by measures such as requiring construction equipment to have mufflers, that portable compressors meet federal noise-level standards for that equipment, and that all portable equipment be placed away from or shielded from sensitive noise receptors if at all possible. All local noise ordinances will be adhered to unless otherwise granted exception by the responsible municipality.
To document potential vibration damage from construction activities, residential structure foundation surveys will be offered in areas where vibration impacts could occur. Structures within 150 to 200 feet of construction operations such as bridge/pavement removal or piling/steel sheeting installation will be identified during final design. Vibration impacts are not anticipated at this time.
D. Construction Permits - Permits under Act 451, Parts 31 (Water Quality and Floodplains) and 301 (Inland Lakes and Streams) will be required from the MDEQ for this project. Coverage under the National Pollutant Discharge Elimination System (NPDES), which is administered by the MDEQ, is also required.
E. Railway Coordination – During design and construction of this project; MDOT will coordinate with the Great Lakes Central Railroad regarding the widening of the US-23 structure over the railway.
87
7.0 PUBLIC INVOLVEMENT AND AGENCY COORDINATION
7.1 Public Involvement
A public hearing will be conducted on the proposed project after the EA document is
distributed to the public. The hearing will allow citizens and local agencies an opportunity to
review and provide comment on specific aspects of the project. A copy of the EA document
will be available at public agencies for review prior to the public hearing date.
Public information meetings were held on December 12, 2013 and August 14, 2014 at the
Northfield Township Hall. The December meeting introduced the project along the corridor
between the M‐14/I‐94 and Silver Lake Road interchanges. Approximately 230 residents, users
and agency representatives attended the meetings. The open‐house‐style meeting featured a
presentation illustrating the elements of the proposed project, including the introduction of the
active traffic management (ATM) concept. The public provided verbal and written comments
during the meeting. MDOT shared the presentation and other related information on the public
web site at http://www.michigan.gov/mdot/0,4616,7‐151‐9621_11058‐316825‐‐,00.html. Based on
input from the public meeting, MDOT consulted with FHWA to reduce the length of the
proposed project corridor by moving the southern limits of the study to the west US‐23/M‐14
interchange. FHWA and MDOT determined that an Environmental Assessment would be
required for the revised corridor. The department updated the website and announced the
holding of a second public meeting.
The August public meeting also followed the open‐house/presentation format. The brief
presentation provided an update on the progress made since the previous public meeting,
including the decision to prepare an EA and the need for public comments to help guide the
development of the various elements. Approximately 80 members of the public and interested
agencies attended the meeting and provided several comments, all of which the study team
reviewed and considered in preparation of the EA document.
7.2 Agency Coordination
Early coordination letters were sent to Federal, State and local agencies as well as interested
organizations seeking comment on the proposed project. Copies of the early coordination letter
and responses are included in Appendix A.

88
89
8.0 PROJECT COSTS
The following are the US‐23 Improvements preliminary engineering and construction costs
projected in fiscal year 2016 funds:
Active Traffic Management (ATM), M‐14/US‐23 to south of M‐36: .......................... $29,540,000
Intelligent Transportation System (ITS), M‐14/US‐23 to south of M‐36: ................... $14,000,000
Bridge replacements at 6 Mile, 8 Mile and N. Territorial Roads: ............................... $14,017,000
Bridge replacements of US‐23 bridge over the railroad: ................................................ $4,639,047
Widening of US‐23 bridge over Barker Road: .................................................................... $639,483
Northbound and southbound on‐ramp extensions: ...................................................... $6,305,000
US‐23 CPM, M‐14/US‐23 to Silver Lake Road: ................................................................ $6,440,000
CPM on the Joy Road and Warren Road bridges: ............................................................. $602,000
