document of the world bankdocuments.worldbank.org/curated/en/678241467998505473/...document of the...
TRANSCRIPT

Document of The World Bank
Report No: ICR00003294
IMPLEMENTATION COMPLETION AND RESULTS REPORT
(IDA-49680, IDA-H3310, TF-90451)
ON A
IDA CREDIT 49680
IN THE AMOUNT OF SDR 6.8 MILLION (US$ 11 MILLION EQUIVALENT)
IDA GRANT H3310
IN THE AMOUNT OF SDR 7.3 MILLION (US$ 11 MILLION EQUIVALENT)
AND
ACGF GRANT TF 90451
IN THE AMOUNT OF US$ 38 MILLION
TO THE
REPUBLIC OF RWANDA
FOR A
TRANSPORT SECTOR DEVELOPMENT PROJECT
June 22, 2015
Transport and ICT Country Department AFCE2 Africa Region
Pub
lic D
iscl
osur
e A
utho
rized
Pub
lic D
iscl
osur
e A
utho
rized
Pub
lic D
iscl
osur
e A
utho
rized
Pub
lic D
iscl
osur
e A
utho
rized

CURRENCY EQUIVALENTS
(Exchange Rate Effective December 31, 2014)
Currency Unit = Rwandese Francs (FRW) SDR 1.00 = US$ 1.34906
US$ 1.00 = RWF 694
FISCAL YEAR July 1-June 30
ABBREVIATIONS AND ACRONYMS
AADT Annual Average Daily Traffic ACGF Africa Catalytic Growth Fund AF Additional Financing CAE Country Assessment Evaluation CGPT Transport Project Implementation Unit CPF Country Partnership Framework DRC Democratic Republic of Congo EAC East African Community EC European Commission EDPRS Economic Development and Poverty Reduction Strategy EIA Environmental Impact Assessment EIRR Economic Internal Rate of Return ESIA Environmental and Social Impact Assessment ESMP Environment and Social Management Plan EU European Union FA Financing Agreement FM Financial Management FRDP Feeder Roads Development Project GDP Gross Domestic Product GoR Government of Rwanda HDM Highway Development and Management Model HIV/AIDS Human Immunodeficiency Virus/ Acquired Immune-deficiency Syndrome ICR Implementation Completion and Results Report IDA International Development Association IEG Independent Evaluation Group IFR Interim Financial Report IRI Intermediate Results Indicators ISN Interim Strategy Note ISR Implementation Status and Results Reports KIST Kigali Institute of Science and Technology LCA Local Community Association M&E Monitoring and Evaluation MININFRA Ministry of Infrastructure

MIS Management Information System MoU Memorandum of Understanding MTEP Medium-Term Expenditure Program MTR Mid-Term Review NIS National Investment Strategy NPV Net present value NTB National Tender Board OP Operational Policy PAD Project Appraisal Document PDO Project Development Objective PMI Performance Monitoring Indicators PPCBU Policy Planning and Capacity Building Unit PPF Project Preparation Fund PPIAF Public-Private Infrastructure Advisory Facility PRSC Poverty Reduction Support Credit PRSG Poverty Reduction Support Grant PRSP Poverty Reduction Strategy Paper QAG Quality Assurance Group RA Road Agency RF Results Framework RMF Road Maintenance Fund RTDA Rwanda Transport Development Agency RTSP Rwanda Transport Sector Project RWF Rwanda Francs SDR Special Drawing Rights SPIU Special Project Implementation Unit VOC Vehicle Operating Cost
Vice President: Makhtar Diop
Country Director: Diarietou Gaye
Senior Global Practice Director: Pierre Guislain
Practice Manager: Supee Teravaninthorn
Project Team Leader: Muhammad Zulfiqar Ahmed
ICR Team Leader/Primary Author: Emmanuel Taban


REPUBLIC OF RWANDA TRANSPORT SECTOR DEVELOPMENT PROJECT
Table of Contents A. Basic Information ........................................................................................................................ i B. Key Dates .................................................................................................................................... i C. Ratings Summary ........................................................................................................................ i D. Sector and Theme Codes............................................................................................................ ii E. Bank Staff ................................................................................................................................... ii F. Results Framework Analysis ..................................................................................................... iii G. Ratings of Project Performance in ISRs .................................................................................. vii H. Restructuring (if any) ............................................................................................................... vii I. Disbursement Profile ............................................................................................................... viii 1. Project Context, Development Objectives and Design ............................................................... 1 2. Key Factors Affecting Implementation and Outcomes .............................................................. 6 3. Assessment of Outcomes .......................................................................................................... 13 4. Assessment of Risk to Development Outcome ......................................................................... 17 5. Assessment of Bank and Borrower Performance ..................................................................... 17 6. Lessons Learned........................................................................................................................ 19 Annex 1. Project Costs and Financing .......................................................................................... 21 Annex 2: Output by Component ................................................................................................... 23 Annex 3. Economic and Financial Analysis ................................................................................. 25 Annex 4. Bank Lending and Implementation Support/Supervision Processes ............................. 31 Annex 5. Beneficiary Survey Results ........................................................................................... 33 Annex 6. Stakeholder Workshop Report and Results ................................................................... 64 Annex 7. Summary of Borrower’s ICR and/or Comments on Draft ICR .................................... 65 Annex 8. Comments of Cofinanciers and Other Partners/Stakeholders ....................................... 77 Annex 9. List of Supporting Documents ...................................................................................... 78 Annex 10. Institutional Status of the RTDA ................................................................................. 79

i
A. Basic Information
Country: Rwanda Project Name: Rwanda Transport Sector Development Project
Project ID: P079414 L/C/TF Number(s): IDA-49680,IDA-H3310,TF-90451
ICR Date: 06/23/2015 ICR Type: Core ICR
Lending Instrument: SIL Borrower: REPUBLIC OF RWANDA
Original Total Commitment:
USD 11.00M Disbursed Amount: USD 20.87M
Revised Amount: USD 22.00M
Environmental Category: B
Implementing Agencies: Rwanda Transport Development Agency (RTDA)
Cofinanciers and Other External Partners: Africa Catalytic Growth Fund (ACGF) B. Key Dates
Process Date Process Original Date Revised / Actual
Date(s)
Concept Review: 10/27/2004 Effectiveness: 12/28/2007 12/28/2007
Appraisal: 05/24/2006 Restructuring(s):
9/10/2008 6/16/2011 7/8/2011
12/12/2013 12/16/2013
Approval: 08/28/2007 Mid-term Review: 01/31/2010 10/25/2010
Closing: 06/30/2012 12/31/2014 C. Ratings Summary C.1 Performance Rating by ICR
Outcomes: Moderately Satisfactory
Risk to Development Outcome: Moderate
Bank Performance: Moderately Satisfactory
Borrower Performance: Moderately Satisfactory

ii
C.2 Detailed Ratings of Bank and Borrower Performance (by ICR) Bank Ratings Borrower Ratings
Quality at Entry: Moderately Satisfactory Government: Satisfactory
Quality of Supervision: Satisfactory Implementing Agency/Agencies:
Moderately Satisfactory
Overall Bank Performance:
Moderately Satisfactory Overall Borrower Performance:
Moderately Satisfactory
C.3 Quality at Entry and Implementation Performance Indicators
Implementation Performance
Indicators QAG Assessments (if
any) Rating
Potential Problem Project at any time (Yes/No):
No Quality at Entry (QEA):
None
Problem Project at any time (Yes/No):
Yes Quality of Supervision (QSA):
None
DO rating before Closing/Inactive status:
Satisfactory
D. Sector and Theme Codes
Original Actual
Sector Code (as % of total Bank financing)
Central government administration 60 60
Rural and Inter-Urban Roads and Highways 40 40
Theme Code (as % of total Bank financing)
Administrative and civil service reform 17 17
Conflict prevention and post-conflict reconstruction 16 16
Infrastructure services for private sector development 17 17
Rural services and infrastructure 17 17
Trade facilitation and market access 33 33 E. Bank Staff
Positions At ICR At Approval
Vice President: Makhtar Diop Obiageli Katryn Ezekwesili
Country Director: Diarietou Gaye Pedro Alba
Practice Manager/Manager: Supee Teravaninthorn C. Sanjivi Rajasingham
Project Team Leader: Muhammad Zulfiqar Ahmed Kingson Khan Apara
ICR Team Leader: Emmanuel Taban
ICR Primary Author: Emmanuel Taban

iii
F. Results Framework Analysis
Project Development Objectives (from Project Appraisal Document) The objectives of the project are: (a) to improve the quality of Rwanda's paved road network and (b) to generate sustained employment in rural areas through road maintenance works. Revised Project Development Objectives (as approved by original approving authority) The PDO was not revised (a) PDO Indicator(s)
Indicator Baseline Value
Original Target Values (from
approval documents)
Formally Revised
Target Values
Actual Value Achieved at
Completion or Target Years
Indicator 1 : 50% of paved roads in good condition (average IRI less than 3.0 m/ km) (AAP) Value quantitative or Qualitative)
23% of 1,100 kilometers (as of January 2007)
50% of 1,100 kilometers
62% of 1,100 kilometers
Date achieved 01/31/2007 06/30/2012 12/31/2014 Comments (incl. % achievement)
Target surpassed (124% of the planned value). The actual output is 62% of paved roads were in good condition by December 2014.
Indicator 2 : Roads in good and fair condition as a share of total classified roads Value quantitative or Qualitative)
23% 50% 40%
Date achieved 01/03/2008 12/31/2013 12/31/2014 Comments (incl. % achievement)
Target substantially achieved (80% of the planned value). On average about 40% of all classified roads were in good condition by December 2014.
Indicator 3 : Size of the total classified network Value quantitative or Qualitative)
0 km 4,700 km 7,336 km
Date achieved 01/03/2008 12/31/2013 12/31/2014 Comments (incl. % achievement)
Target surpassed (156% of the planned value). In 2012, Rwanda Road Act classified roads in three categories and RTDA started the re-classification immediately. The classified road network was 7336km at December 2014.
Indicator 4 : Number of permanent jobs generated annually from road maintenance works Value quantitative or Qualitative)
0 3000 3041
Date achieved 01/31/2007 06/30/2012 12/31/2014

iv
Comments (incl. % achievement)
Target achieved (101% of the planned value at December 2014). The project has effectively created LCAs through which maintenance is carried out on national roads regularly.
Indicator 5 : Share of rural population with access to an all-season road Value quantitative or Qualitative)
0% 19% 19%
Date achieved 01/03/2008 12/31/2013 12/31/2014 Comments (incl. % achievement)
Target achieved (100% of the planned value). The project didn't construct a new road & the target was estimated using the estimated access to about 2.1 million rural population living within 2 km of the road.
Indicator 6 : Number of rural people with access to an all-season road Value quantitative or Qualitative)
0 2.1 million 2.1 million
Date achieved 01/03/2008 12/31/2013 12/31/2014 Comments (incl. % achievement)
Target achieved (100% of the planned value). After the completion of Kigali-Ruhengeri Rehabilitation, 2.1 million people of rural area have access to the road.
Indicator 7 : Direct project beneficiaries Value quantitative or Qualitative)
0 2.1 million 2.1 million
Date achieved 12/31/2008 12/31/2013 12/31/2014 Comments (incl. % achievement)
Target achieved (100% of the planned value). After the rehabilitation of the Kigali - Ruhengeri road, 2.1 million rural people living within 2 km have benefited.
Indicator 8 : Female beneficiaries Value quantitative or Qualitative)
47.6% 47.6% 48.5%
Date achieved 12/31/2008 12/31/2013 12/31/2014 Comments (incl. % achievement)
Target achieved (102% of the planned value). 48.5% of the people living in the vicinity of the Kigali-Ruhengeri road are females.
(b) Intermediate Outcome Indicator(s)
Indicator Baseline Value
Original Target Values (from
approval documents)
Formally Revised Target
Values
Actual Value Achieved at
Completion or Target Years
Indicator 1 : 100% of Kigali-Ruhengeri road in good condition (average IRI less than 3.0 m/km)
Value (quantitative or Qualitative)
Less than 20% 100% 100%
Date achieved 01/31/2007 06/30/2012 12/31/2014

v
Comments (incl. % achievement)
Target achieved (100% of planned value). Road rehabilitation completed and handed over to Client in September 2013.
Indicator 2 : % paved roads maintained in good condition (average IRI less than 3.0m/km) Value (quantitative or Qualitative)
0% 50% 62%
Date achieved 01/31/2007 06/30/2012 12/31/2014 Comments (incl. % achievement)
Target surpassed (124% of the planned value). 62% of the paved road network is in good condition.
Indicator 3 : Number of sector agencies implementing performance agreements signed with the government
Value (quantitative or Qualitative)
None At least four (4)agreements signed
At least two (2)agreements signed
Two (2) agreements signed
Date achieved 01/31/2007 06/30/2012 12/12/2013 12/31/2014 Comments (incl. % achievement)
Target achieved (100% of planned value) after revision of target from four to two agreements. Performance agreements between RTDA and MININFRA and RMF and MININFRA have been signed.
Indicator 4 : MoU, sector policy matrix and road maintenance strategy adopted according to schedule in FA and being implemented
Value (quantitative or Qualitative)
No-Draft MoU, sector policy matrix and Maintenance strategy prepared
Yes-Satisfactory implementation of all three instruments
Yes - Sector matrix approved as part of sector EDPRS and in place
Date achieved 01/31/2007 06/30/2012 12/31/2014 Comments (incl. % achievement)
Target achieved (100% of planned value). MoU signed between Donors and Ministry of Infrastructure. Final draft of Road maintenance strategy elaborated. This was recorded on 11/27/2009.
Indicator 5 : Completion and adoption of transport master plan Value (quantitative or Qualitative)
No Yes Yes
Date achieved 01/17/2011 06/30/2012 12/31/2013 Comments (incl. % achievement)
Target achieved (100% of planned value). Master plan prepared and validated by key sector stakeholders.
Indicator 6 : Statistics exist and reflected in sector planning
Value (quantitative or Qualitative)
None
Systems improvement completed in at least four agencies
Yes
Date achieved 01/31/2007 06/30/2012 12/31/2014 Comments (incl. % achievement)
Target achieved (100% of planned value). Road database established through TA provided by the EU and used for planning.

vi
Indicator 7 : At least 50 current and potential transport sector staff having Masters degrees or equivalent
Value (quantitative or Qualitative)
Draft terms of reference for university and course manager ready
50 52
Date achieved 01/31/2007 06/30/2012 12/31/2014 Comments (incl. % achievement)
Target achieved (104% of planned value). Training started in October 2011and completed in December 2014.
Indicator 8 : Functional RTDA- Managerial and Key staff positions filled and key standards and systems adopted
Value (quantitative or Qualitative)
New institution 70 98
Date achieved 01/17/2011 06/30/2012 12/31/2014 Comments (incl. % achievement)
Target surpassed (140% of planned value). The total number of RTDA staff stood at 98 at project completion, among which 61 were Engineers including managerial positions and the remaining 37 were in the corporate services.
Indicator 9: Adopted formulae for disaggregation of road maintenance fund amongst executing agencies
Value (quantitative or Qualitative)
None Yes Yes
Date achieved 01/17/2011 06/30/2012 12/31/2014 Comments (incl. % achievement)
Target achieved. Study to update the formulae started in June 2014 and was completed by December 30, 2014.
Indicator 10 : Road and bridge design standard, specifications and manuals completed Value (quantitative or Qualitative)
No Yes Yes
Date achieved 01/17/2011 06/30/2012 12/31/2014 Comments (incl. % achievement)
Target achieved. Target achieved. The study was completed and road and design manuals were finalized through a validation workshop in December 2014.
Indicator 11 : Project and program implemented according to PIP, disbursement and procurement plans; project audits are released timely.
Value (quantitative or Qualitative)
Draft Terms of Reference for baseline survey and auditors ready
EOP survey completed; project being implemented according to plans (Yes)
Yes
Date achieved 01/31/2007 06/30/2012 12/31/2014 Comments (incl. % achievement)
Target achieved. Some project implementation delay due to lag in procurement activities.

vii
G. Ratings of Project Performance in ISRs
No. Date ISR Archived
DO IP Actual Disbursements
(USD millions) 1 01/24/2008 Satisfactory Satisfactory 0.00 2 07/13/2008 Moderately Satisfactory Moderately Unsatisfactory 0.45 3 03/30/2009 Moderately Unsatisfactory Unsatisfactory 1.95 4 12/14/2009 Moderately Unsatisfactory Moderately Unsatisfactory 1.95 5 06/01/2010 Moderately Unsatisfactory Moderately Unsatisfactory 2.77 6 03/07/2011 Moderately Satisfactory Moderately Satisfactory 3.00 7 04/24/2011 Moderately Satisfactory Moderately Satisfactory 3.00 8 08/24/2011 Satisfactory Satisfactory 3.42 9 02/12/2012 Satisfactory Satisfactory 3.42
10 09/03/2012 Satisfactory Satisfactory 6.64 11 05/18/2013 Satisfactory Moderately Satisfactory 14.50 12 12/01/2013 Satisfactory Moderately Satisfactory 15.27 13 06/15/2014 Satisfactory Moderately Satisfactory 17.32 14 12/29/2014 Satisfactory Moderately Satisfactory 17.32
H. Restructuring (if any)
Restructuring Date(s)
Board Approved PDO
Change
ISR Ratings at Restructuring
Amount Disbursed at
Restructuring in USD millions
Reason for Restructuring & Key Changes Made
DO IP
9/10/2008 MS MU 0.45
Reallocation of percentage of expenditure from ACGF Grant for part 1(b) and removal of withdrawal condition for Part 1 (b).
6/16/2011 MS MS 3.42
Closing date extension by eighteen (18) months in order to complete various activities under original project and new activities under the Additional Financing (AF).
7/8/2011 MS MS 3.42
Amendment and restatement of Financing Agreement (FA) to provide AF and reflect extension of closing date.
12/12/2013 S MS 15.27
Closing date extension by one (1) year and included revision to results framework and re-allocation of funds.
12/16/2013 S MS 15.27 Amendment to amended and restated FA to reflect extension of closing date, revision to results

viii
Restructuring Date(s)
Board Approved PDO
Change
ISR Ratings at Restructuring
Amount Disbursed at
Restructuring in USD millions
Reason for Restructuring & Key Changes Made
DO IP
framework and reallocation of funds.
I. Disbursement Profile

1
1. Project Context, Development Objectives and Design
1.1 Context at Appraisal Country Background 1. Rwanda emerged from a genocide and civil war that took place from April to July 1994, which inflicted incalculable harm to the social and economic fabric of Rwanda, in particular the economic infrastructure. The ability of Rwanda’s economic infrastructure to fulfill the country’s needs was undermined by lack of maintenance for over 10 years after the end of the civil war, resulting to decline in quality of the country’s entire infrastructure. With the support of the donor community, some infrastructure was rehabilitated 10 years following the end of the conflict but much still remained to be repaired. Furthermore, direct effects of war and social disruption led to other indirect consequences in terms of loss of staff in utility companies and ministries, including many in senior managerial positions. The resulting loss of institutional memory, including the destruction of records and management systems, had not been fully replaced.
Sector Background 2. Rwanda is a landlocked country about 2,000 km away from the nearest sea port, and its transport costs represented as high as 40 percent of export and import values. Given its mountainous terrain and the excessive rain fall, erosion is particularly severe on the country’s road network, whose maintenance cost was twice higher than that of most Sub-Saharan countries. At appraisal, Rwanda had a road network of 14,000 km, spread over 27,000 square km of national territory, is among the densest in Sub-Sahara Africa, and its management far exceeds the country’s human and financial capabilities. Only 23 percent of the 1,100km of Rwanda’s asphalted network in 2005 was in good condition, while barely 5 percent and 2 percent of the secondary and communal networks were in good condition, respectively. As high as 85 percent of the paved network required heavy rehabilitation or periodic maintenance, and most of the secondary and communal roads had not been maintained for over a decade. 3. The Interim Strategy Note (ISN) of 2006 identified five transport sector objectives, namely to: (i) improve international transport connections; (ii) upgrade key road networks to paved standards to facilitate the country's access and its social and economic reintegration; (iii) ensure better management and financing of the road network in general; (iv) improve road safety; and (v) improve rural feeder roads to lower transport costs for farmers and facilitate the development of market-based agriculture. Rationale for Bank and Africa Catalytic Growth Fund (ACGF) Assistance 4. Rwanda had shown strong economic performance consistently since emerging from a devastating genocide. Since 1994, Rwanda had been able to maintain overall macro stability and implemented extensive reforms that contributed to the high levels of growth observed during the post-conflict decade of recovery and beyond. New borrowing had been less than was projected at the Heavily Indebted Poor Countries (HIPC) decision point. Most constraining trade barriers had

2
been lifted. Country Policy and Institutional Assessment ratings had been consistent over the years. Consolidating these gains depended on how policies in key sectors, like transport, were directed to support the macroeconomic agenda of the government. The TSDP supported transport policy development. 5. The involvement of both the Africa Catalytic Growth Fund (ACGF) and International Development Association (IDA) was in line with both the Country Assessment Evaluation (CAE) conducted by the Independent Evaluation Group (IEG) in 2003 and the Implementation Completion and Results Report (ICR) of the previous Bank-supported operation, the Rwanda Transport Sector Project (RTSP), which recommended that future IDA support should focus on rebuilding Rwanda’s depleted institutional and road maintenance capacities. The ICR proposed continued support by external donors in reducing the backlog of road maintenance and rehabilitation works. It further recommended the increased use of labor-based construction approaches in order to promote employment, particularly in rural areas. This would build partnerships with rural communities and guarantee the sustainability of roads maintenance by incorporating it in agricultural activities. The project was a direct response to a request by GoR for much needed assistance to the country coming out of a devastating civil war and genocide, both of which affected production and infrastructure, including transport.
1.2 Original Project Development Objectives (PDO) and Key Indicators (as approved) 6. The PDO of the Transport Sector Development Project (TSDP) were: (a) to improve the quality of Rwanda's paved road network and (b) to generate sustained employment in rural areas through road maintenance works. The project aimed to improve road quality by: (i) restoring parts of major road corridors to good conditions through rehabilitation works on the Kigali-Ruhengeri road and maintenance works on about 50 percent of the paved road network of 1,100 km; (ii) establishing a system for sustainable financing of road maintenance; and (iii) improving management and operational efficiency in sector institutions through the establishment of management information and statistical systems, and targeted training. 7. The key performance indicators as specified in the Project Appraisal Document (PAD) have been categorized into transport sector indicators and project indicators. The transport sector indicator was the average transport time between Kigali and the ports and cities of Mombasa, Dar es Salam and Goma. This indicator was based on the higher transport objective in support of Rwanda’s EDPRS. The key project indicators were: (i) improvements in the road network condition, (ii) permanent employment generation, and (iii) improved effectiveness and efficiency of use of public resources.
1.3 Revised PDO (as approved by original approving authority) and Key Indicators, and reasons/justification 8. Following the Mid-Term Review (MTR) and Additional Financing (AF) the project was restructured. The original PDO remained unchanged. The Results Framework (RF) was updated and revised as part of the restructuring to reflect the changes. The RF and Performance Monitoring Indicators (PMI) was revised and the following indicators were included: (i) functional RTDA, (ii) adopted formulae for disaggregation of road maintenance funds amongst executing agencies, (iii)

3
completed Road and Bridge Designs and Standard Specifications manuals, (iv) share of rural population with access to an all-season road (core indicator), and (v) direct project beneficiaries (core indicator). The changes mainly aimed to simplify the indicators better aligned with actual data collected, and targets that were achievable and made sense to work on under the existing state of transport sector in Rwanda.
1.4 Main Beneficiaries 9. The key beneficiaries to the project were identified as the GoR, the road industry (private sector), national and international road travelers, agricultural producers, local businesses, roadside communities and road workers.
1.5 Original Components (as approved) 10. The project consisted of four (4) components, namely: (i) Paved Road Rehabilitation and Maintenance; (ii) Sector Governance and Policy Support; (iii) Sector Analysis and Planning Support; and (iv) Project and Program Management Support. 11. Component 1: Paved Road Rehabilitation and Maintenance (US$62.4 million): This component supported the rehabilitation of approximately 83 km of Kigali-Ruhengeri section of Kigali-Ruhengeri-Gisenyi road and maintenance of approximately 550 kilometers of paved trunk roads, including sections of Gatuna-Bugarama, Gitarama-Kibuye, and Rusumo-Gisenyi roads, through execution of multi-year output-based management contracts. 12. Component 2: Sector Governance and Policy Support (US$2.6 million): This component supported Sector Governance improvement through the provision of technical assistance to the RA, following its establishment, the Road Maintenance Fund (RMF), the Vehicle Technical Inspection Center, the Rwanda Civil Aviation Authority, and the National Public Transport Agency, in support of preparation and implementation oversight of long-term performance agreements that were concluded between these agencies and the government. It also supported Transport Policy Implementation through (i) Stakeholder workshops and seminars relating to transport policy implementation and regional transport cooperation; (ii) Provision of technical assistance to the Ministry of Infrastructure (MININFRA) in support of program development and carrying out of strategic studies for transport policy implementation; (iii) Provision of technical assistance in support of development and implementation of road safety action plan, improvement of data collection, and establishment of accident database in the Planning, Policy, and Capacity Building Unit; (iv) Development and implementation of transport sector HIV/AIDS prevention strategy; and (v) Provision of technical assistance in support of establishment and training of LCAs of roadside dwellers in labor-intensive road maintenance. 13. Component 3: Sector Analysis and Planning Support (US$2.2 million): Transport Planning and Monitoring Systems (i) Provision of technical assistance to the Planning, Policies and Capacity Building Unit (PPCBU) in support of establishment of transport database and monitoring and evaluation systems relating to Project and Program performance, transport costs, transport industry standards, and other transport performance indicators; (ii) Transport data collection for planning and monitoring systems; (iii) Acquisition of information technology
4
equipment and materials for monitoring and evaluation systems established under Component 3(a) (i) above. Capacity Building (i) Financing of the services of an international university and a local university to provide long-term in-country training to professional staff of the road agencies, local entrepreneurs, and unemployed graduates, leading to Masters’ degrees in Road Engineering and Management and Transport Economics and Planning; (ii) Financing of a local consultant to provide management support to the in country training program. 14. Component 4: Project and Program Management Support (US$1.2 million): (i) Financing of Operating Costs of the Planning, Policies and Capacity Building Unit, the Transport Projects and Program Management Unit (CGPT), and the Road Agency (RA) following its establishment; (ii) Provision of technical assistance to Infrastructure Planning, Policies and Capacity Building Unit, Transport Projects Management Unit, RA following its establishment, and the Road Maintenance Fund in support of Project and Program technical audits; (iii) Provision of technical assistance to Infrastructure Planning, Policies and Capacity Building Unit, Transport Projects Management Unit, RA following its establishment, and Road Maintenance Fund in support of Project financial audits; (iv) Training of Project and Program management staff in accounting and financial management, procurement and contract management, and budget preparation and disbursement.
1.6 Revised Components 15. The revised project components comprised the following: 16. Component 1: Paved Road Rehabilitation and Maintenance: The maintenance of the Huye-Kitabi road was dropped and was rehabilitated through other financing arrangements undertaken by the GoR. 17. Component 2: Sector Governance and Policy Support. Remained unchanged 18. Component 3: Sector Analysis and Planning Support: The additional activities included: (i) human capital development through training on road management tools; (ii) preparation of design and specifications manuals for roads and bridges; (iii) introduction and customization of road management tools including Roads Economic Decision Model (RED), Highway Development and Management Model (HDM) and Road Network Evaluation Tool; (iv) provision of technical assistance (TA), training and Information Technology equipment for RMF, was transferred from Component 4 to Component 3, while RMF was expected to conduct technical audit of maintenance contracts from its own resources. 19. Component 4: Project and Program Management Support: (i) Provision of technical assistance (TA), training and Information Technology equipment for RMF, was transferred from Component 4 to Component 3, while RMF was expected to conduct technical audit of maintenance contracts from its own resources.
5
1.7 Other significant changes 20. Additional Financing (AF): The GoR, by a letter dated October 18, 2010, requested the World Bank for an Additional Financing (AF) to cover the financing gap due to cost overrun of the contract for the rehabilitation of Kigali-Ruhengeri road. The Bank provided an additional credit in the amount of US$11 million to help finance the costs associated with the financing gap. The AF was approved by the Bank on June 16, 2011, and became effective on December 20, 2011. The main changes to the project brought about by the AF were: (i) crystallization of activities carried out as part of the strategic studies and design of limited feeder roads under Component 3; (ii) reallocation of grant proceeds among components; (iii) vesting in the RTDA the responsibility of implementation of the project; (iv) extension of the closing date of the IDA Grant and the ACGF Grant; and (v) modification of the arrangement for handling the GoR’s contribution to the project. 21. Project Restructuring: The project was restructured five times. The first restructuring was conducted in order to reallocate percentage of expenditure from ACGF Grant for Part 1(b) and remove the withdrawal condition for Part 1 (b). An amendment to the ACGF Grant Agreement was done on September 10, 2008 to reflect these changes.
22. The second restructuring was prompted by provision of AF by the Bank. The closing date of the original IDA Grant (IDA-H3310) and ACGF Grant (TF090451) was extended from June 30, 2012 to December 31, 2013 and October 31, 2013 respectively, and it was approved on June 16, 2011. This was done in order to: (i) allow the maintenance activities under the project to be completed; (ii) cater for defects liability period and unexpected extension of the construction time because of rains and emergency works. The third restructuring was conducted on July 8, 2011for the amendment and restatement of the Financing Agreement (FA) to provide the AF and reflect extension of the project closing date. 23. The fourth restructuring was done to enable completion of all the remaining ongoing activities and thus achieving the PDO. A no-cost time extension of the closing date of the original project and AF for one year was approved on December 12, 2013 from December 31, 2014 to December 31, 2014, making a cumulative extension of 30 months. This was a Level Two restructuring, an approval in Principle for the request to extend the closing date was received on October 2, 2013. The restructuring also included revision to the results framework and reallocation of funds. The fifth and final restructuring was conducted on December 16, 2013 in order to amend the amended and restated FA to reflect the above changes. 24. Implementation Arrangements: MININFRA had the overall responsibility of the project during design and implementation. The responsibility of project implementation including all fiduciary aspects was transferred to the Rwanda Transport Development Agency (RTDA) following the AF. The RTDA became operational in 2011 and took over the functions of MININFRA and was assigned the responsibility of implementing the TSDP and other road projects and specifically performed the functions of an RA. Following the change in the implementation arrangement, a Subsidiary Agreement between GoR and the RTDA, and a Project Agreement between IDA and the RTDA was signed.

6
25. Final Project Cost: The final project cost at completion was US$83.54 million comprising US$38 million spent under ACGF Grant, US$20.87 million spent under IDA Grant/Credit and US$24 million GoR financing. This represents an overall increase of 21 percent at completion compared to the appraisal estimate of US$ 69 million.
2. Key Factors Affecting Implementation and Outcomes
2.1 Project Preparation, Design and Quality at Entry Soundness of the Background Analysis 26. The TSDP drew lessons from recommendations by the IEG review and the Implementation Completion and Results Report (ICR) of the previous Bank-supported operation (Rwanda Transport Sector Project -RTSP 2002), both of which emphasized the need for future IDA support to help rebuild Rwanda’s depleted institutional and road maintenance capacities following the conflict in 1994. Both assessments rated past IDA operations in the transport sector as satisfactory but concluded that they had been complex and had failed to accommodate the government’s financial and human absorption capacity. The TSDP was also prepared with the recommendation from the RTSP ICR of the increased use of labor-based construction methods as a means of promoting employment, particularly in rural areas. 27. The project design was also influenced by the growing focus on governance and workable public-private partnership arrangements in infrastructure maintenance and development. It out sourced road maintenance to the private sector and road-side communities based on experiences in Rwanda’s immediate neighbors Burundi and Uganda. The design drew lessons from best practices for second generation road funds and successful privatizations of road maintenance works in a good number of countries in Sub-Saharan Africa. The project design included a sub-component on governance improvement through which autonomous government agencies charged with the management of sector operations were rendered more accountable and result-oriented by the enforcement of performance agreements. This is consistent with the Africa Action Plan. Project Preparation 28. The project was prepared in such a way that MININFRA had the overall responsibility for implementation through the PPCBU, the CGPT, the RMF and the RA. The overall responsibility for road and transport policy in Rwanda was devolved to the MININFRA through the PPCBU which was also responsible for transport related regulation enforcement. The RMF was responsible for road maintenance financing. It programed, mobilized and disbursed funds for road maintenance. The RA was responsible for road transport investments and maintenance policy implementation. It also programed and oversaw the execution of road transport contracts. The CGPT was established in 2005 to fill a missing gap within MININFRA in project management. The PPCBU was responsible for the technical implementation of Components 1, 2(b) and 3 of the project until such a time as the RA would be established. The CGPT was responsible for the implementation of components 2(a) and 4 of the project, financial management under Parts 1(a), 2, 3, and 4 of the Project, and procurement for the entire project.

7
Assessment of the Project Design
29. The project design was Satisfactory. The TSDP was designed to support Rwanda’s Vision 2020 with a fundamental concept of restoring and improving the country’s core economic infrastructure. The EDPRS which is the medium term development strategy of Vision 2020, strived for the transformation of Rwanda from an agriculture-based economy to a knowledge-based service economy by 2020. The transport sector was identified as a mechanism for rural development and regional integration, hence the relevance of the TSDP. 30. This project was intended to be part of a five-year transport improvement program which was integral to the government’s EDPRS. The objectives of the program as defined in the government’s transport policy matrix were to: (i) improve transport links internally and internationally; (ii) reduce and keep transport costs under control; (iii) improve the institutional framework and strengthen the capacity of partners involved in the sector; (iv) improve road safety; (v) achieve sustainable financing of road maintenance; and (vi) sustain the preservation of roads rehabilitated or constructed. 31. To achieve growth targets that would help increase the standards of living of the population and therefore reduce poverty, the government focused on identifying key sources of growth and competitiveness. In this regard, the objective for transport was to ease related constraints that affect growth. The TSDP contributed to the achievement of this objective by improving the quality of key international and domestic road corridors as part of a wider strategy to reduce transit times for tradable goods and to improve regional connectivity. Adequacy of Government’s Commitment
32. The GoR was fully involved during design, preparation and implementation of the project. Key project staff took part right from design of the TSDP and after creation of the RA, implementation continued despite a number of challenges. The GoR through the RMF contributed about US$24 million counterpart funds towards the project. A detailed discussion of the GoR commitment is discussed under Government Performance in Section 5.2. Assessment of Risks
33. The project risk assessment and classification was carried out during preparation and the overall risk of project was rated high given the post conflict environment. The key risks identified are summarized as follows: (i) Political inertia and lack of political commitment which could have undermined or delayed the implementation of the policy arrangements targeted by the project; (ii) Counterpart funding shortfalls given the budgetary constraints in the country; (iii) War in the Great Lakes Region which could have disrupted project execution or compromised government financing; (iv) Weak and unstable institutional setup; (v) Weak fiduciary capacity; (vi) Weak Technical Implementation Capacity of the agencies envisaged to implement the project; (vii) Cost overruns in civil works contracts; and (viii) Weak Financial Management Capacity of the RMF. 34. The risk mitigations measures were as follows:: (i) preparation of a new transport policy and draft legislation intended to support the reforms targeted by the project; (ii) counterpart
8
contribution derived from RMF’s steady income of fuel levy and the government ensured that agreed amounts of the resources raised locally were maintained in a separate project account managed independently by the RMF; (iii) substantial provision for on-the-job training of project staff in areas relating to its implementation; (iv) the establishment of performance agreements between the government and the three sector agencies (RTDA, RMF and MININFRA; (v) recruitment of professional and experienced staff early enough so that they could receive appropriate training and gain exposure to Bank fiduciary and safeguard processes prior to project effectiveness. (vi) establishment of the RA; (vii) including specific requirements in the Memorandum of Understanding (MoU) which the government concluded with donors as part of a programmatic approach; (viii) recruitment of an environmental specialist and a procurement team to reinforce the team in CGPT, and the RA when established; (ix) limiting works to the improvement of the existing right-of-way, and in addition, the unit costs recommended under the project were derived from similar road works conducted prior to preparation of TSDP; and (x) the capacity of the RMF was strengthened under EC support, including ad hoc advisory support from outside consultants, to better prepare it for project start-up. The project’s overall risk rating was assessed as “Moderate”.
35. Quality at Entry: The project’s quality at entry was not reviewed by the Quality Assurance Group (QAG).
2.2 Implementation 36. The project was approved by the Bank on August 28, 2007 for an IDA Grant amount of US$11 million. The Financing/Grant Agreements (FA/GA) were signed on October 5, 2007 for both IDA-H3310 and TF-90451 and the project became effective immediately for TF-90451 and on December 28, 2007 for IDA-H3310. The project original closing date was June 30, 2012. The FA was amended and restated on July 8, 2011 to provide additional financial assistance (Credit IDA-49680) in support of the project. The amended and restated financing agreement became effective on December 20, 2011 with a closing date of December 31, 2013. Furthermore, at the request of the GoR in a letter dated September 13, 2013 requesting for extension of the closing date, reallocation of the proceeds of the financing and changes in its project activities, an amendment to the amended and restated agreement was made on December 16, 2013 with the closing date to the agreement extended to December 31, 2014. 37. Mid-Term Review (MTR): The MTR of the project was conducted on October 25, 2010. During the MTR a revised funds requirement for each activity was conducted and this was considered as the basis for the reallocation among components under the AF.
38. Additional Financing and Project Restructuring: These are covered under section 1.7 of this ICR.
39. Engagement of Local Community Associations (LCAs): MININFRA through the TSDP recruited two local consulting firms, in 2008, to set-up local community associations (LCAs) that were assigned the responsibility of routine maintenance of the national road network. This was at the same time meant to empower them economically and socially to alleviate mass poverty and health risks in rural areas. In addition, the selected firms were given the task of developing a routine

9
maintenance manual in Kinyarwanda, 1 an HIV/AIDS sensitization pocket book, a typical maintenance contract between districts and LCAs, a typical legal statute for the LCAs and the preparation of a list of LCAs/roads to include in the pilot phase of the routine maintenance works. The achievements realized through the use of LCAs is further discussed in Annex 2, Output by Components. 40. Technical Audit: A technical audit team engaged by the project conducted investigations to identify failures on the Kigali-Ruhengeri road and remedial measures. The defects/failures observed by the technical audit included: (i) rutting on steep gradients; (ii) major slides caused by heavy rain; and (iii) longitudinal and transversal cracks on specific locations on embankments along relatively flatter areas of the road and frequently affected by water infiltration. The recommendations included maintenance measures that would take the road to its design life time, including multi-year maintenance contracts, and long term suggestions that called for a complete redesign of the road to upgrade it to stand the challenges of slides, embankment retrofitting to stand the water infiltration problems, and coup-up with the fast increasing traffic level. 2.2.1 Major Factors Affecting Project Implementation 41. Slow Implementation and RTDA Capacity Building: Implementation of the project was initially hampered by the low capacity of MININFRA in terms of procurement, and contract management. The quality of documents submitted was often weak and MININFRA did not systematically follow up on ongoing contracts. In 2011, the RTDA was established with support from the TSDP AF. RTDA inherited a backlog of delayed procurement of the consultancy services. Furthermore, RTDA’s continued weak procurement capacity and its inability to hire procurement capacity initially continued to hamper implementation progress. A procurement specialist was finally engaged in 2013 to assist with the remaining procurement activities and to provide on-the-job training. 42. Retention of Trained Staff by RTDA: A number of staff moved from the RTDA to other public and private agencies in search for better paying jobs. RTDA has completed a Human Resource Development exercise that identified its short and long term developmental needs in-terms of staffing policies, training, and retention of the enhanced capacity. A Special Project Implementation Unit (SPIU) has been established by RTDA under its restructuring efforts to support all externally-funded projects. The establishment of the SPIU was aimed at improving efficiency of RTDA by attracting experienced staff with improved remuneration packages. It is anticipated that these measures may help RTDA sustain and retain enhanced capacity. 43. Cost Overrun: During the course of implementation of the project, the GoR requested to widen the Kigali-Ruhengeri road from 6.2m to 7m, to be within the standards of trunk roads in the region. The widening of the road and inflation due to delayed implementation, partly resulted to cost overrun. There was US$7.78 million financing gap for the road contract that was realized in December 2009 during the signing of the works contract, and for contingencies. The total contract
1 Kinyarwanda is the local language spoken in Rwanda.

10
price was US$45.78 million for both works and supervision against US$38 million that was earmarked for this activity at appraisal. The additional cost was related to unforeseen and extra works, including slide protection, raising the level of side drains, provision of culverts, sealing and widening of shoulders. Other causes of the cost overrun included indirect cost increases from inflation and exchange rate fluctuations and studies to support the preparation of future projects. 44. Price Escalation: The technical audit had recommended re-evaluation of contractor’s final price adjustment invoice, which had already been approved by the supervision consultant. The expert’s review was completed in May 2014 by an individual consultant, who recommended to reduce the final invoice from US$4.14 million to US$2.61 million. On August 13, 2014, the contractor responded to the revision with additional information and a claim that the review had misinterpreted the contract and miscalculated the price adjustment. The contractor claimed that actual invoice amount was Rwanda Francs (RWF) 2.74 billion (US$4.81 million). Based on the additional information provided, the claim was re-analyzed and a re-calculation resulted in RWF 2.11 billion (US$ 3.71 million), which was settled before closure of the project. 45. Landslides: Field inspections carried out during the preparation of the Environmental and Social Impact Assessment (ESIA) revealed that landslides/rockslides from the top of the hills would be a potential problem as a result of the geo-technical nature of the areas through which the Kigali-Ruhengeri road passes. Major slides occurred along the completed road and RTDA carried out repair works. Slides could still be a major challenge along the rehabilitated road. The landslide problem is a natural challenge that has to be dealt with through the programmed maintenance budget. RTDA conducted cleaning of culverts, maintained slide protection structures, and engaged a contractor to carry out slide clearing and repair works during the rainy seasons.
46. The RTDA has recruited an international consulting firm after closure of the project to prepare a post-construction maintenance program for the Kigali-Ruhengeri road as recommended by the independent technical auditor in 2013. The maintenance program covers works such as: (i) slope stabilization to prevent landslides from occurring; (ii) proper drainage to protect the road pavement structure; (iii) increase of road safety measures; and (iv) correct defects, if any.
2.3 Monitoring and Evaluation (M&E) Design, Implementation and Utilization 47. M&E Design: The project was designed in such a way that data collection to support the monitoring and results assessment of the project were to be conducted in the form of surveys at three intervals during implementation that is, at the beginning of the project, prior to the MTR, and in the last year of the project. The first survey together with data collected during project preparation, were to improve the baseline data for the project. The second survey was to facilitate the MTR, while the third was to provide material for end-of-project assessments, including for the ICR. It was expected that the three surveys would also have generated data required to complete the sector’s medium and long-term financial and physical indicators. In light of this, the project also included provision to help establish an M&E system within MININFRA. Given the weak capacity of MININFRA at the time of project preparation, it was agreed that data collection was to be administered by external consultants, notably a technical auditor whose primary role was to preemptively identify implementation issues and propose solutions. The project’s Results

11
Framework, as laid out in the PAD was adequate for monitoring progress towards achievement of the PDO. 48. M&E Implementation: Road Database has been established and condition data collection was regular during project implementation. The progress of the project was monitored monthly, quarterly and yearly by a team comprising members of RTDA, PPCBU, CGPT, technical auditors and consultants. During implementation the RF and PMI for the project was updated and revised as discussed in Section 1.3. The M&E performance rating of the project has been Satisfactory. 49. M&E Utilization: The road database that has been established including the data is being used by the RTDA in the planning, programming and management of interventions on the national road network.
2.4 Safeguard and Fiduciary Compliance
50. Environmental and Social Safeguards: No negative long term environmental and social impacts were foreseen with regard to this project. The project rating remained Category B as assessed during appraisal. An Environmental Specialist position was added to the project management team, within the implementing institution to monitor potentially adverse environmental and social impacts of project operations. The specialist was deployed and monitored environmental and social safeguards compliance for all road investment operations in the sector. The Contractor observed the Environment and Social Management Plan (ESMP) requirements and the implementing institution fulfilled its oversight responsibilities.
51. OP 4.11 (Physical Cultural Resources) was triggered for this project following the AF; the Environmental Impact Assessment/ESMP for the Kigali-Ruhengeri road was updated to ensure that the civil works carefully avoided existing cultural assets, such as burial and archeological sites. The widening of the road pavement from 6.2 to 7 meters was contained within the existing road width and right of way, and did not involve changes to the original ESIA. The rehabilitation and maintenance works were carried out along existing road alignment and there were no major social and environmental impacts and the AF did not involve land acquisition/involuntary resettlement (as was the case in the original project). Existing borrow/quarry sites were used for sourcing materials.
52. Guidelines for “chance finds” procedure was integrated into the contracts for construction and road maintenance consultants. These included development of a cultural property management plan if physical cultural resources were found, in accordance with the GoR’s policies and guidelines. This updated document was disclosed in country as well as in the InfoShop on April 21, 2011.
53. The ESIA prepared was disclosed in-country on January 15, 2006 and submitted to InfoShop on January 14, 2006. The overall safeguards compliance rating for the project is Satisfactory. Implementation of the ESMP was Satisfactory. The rehabilitation of the Kigali-Ruhengeri road did not cause any negative impacts, except for naturally occurring landslides observed along some sections of the road. All quarry sites were restored and replanting of vegetation was done. RTDA conducted an Environmental and Social Safeguards Audit. Overall,

12
the Environmental Audit was conducted quite well and it did not discover any major issues during project implementation. However, it did not address some points that were stated in the audit objectives. The report could have been improved by a more detailed discussion on the actual application on the ESIA such as whether the document was relevant to the project scope and whether there was a dedicated staff on the contractor site overseeing the environmental issues.
Fiduciary
54. Financial Management: An assessment of the financial management arrangements for the project was conducted at appraisal to determine whether the existing arrangements were suitable for the project and to determine whether the CGPT and the RMF had acceptable financial management arrangements. The financial management assessment identified a moderate risk for the project.
55. During implementation, the auditors expressed unqualified audit opinions of the financial statements for the project. They also expressed an unqualified opinion that the designated account statements presented a true and fair view in accordance with IDA and ACGF Grants requirements. The project continued to prepare and submit satisfactory unaudited interim financial statements. The Financial Management (FM) arrangements of the RTDA met the Bank’s minimum requirements for project FM as per OP/BP 10.02. The overall financial management ISR rating for the project was classified as Moderately Satisfactory. The overall financial management risk for the project was Substantial.
56. Procurement: The procurement activities of the project were initially carried out by CGPT and the PPCBU was responsible for the technical aspects of procurement and contract management. The National Tender Board (NTB) was also involved in project procurement and played roles in national procurement by directing the procurement process for contracts above a certain threshold and participated in the review of contracts below it. An assessment of the capacity of the implementing agencies involved in procurement for the project was carried out at appraisal and reviewed the organizational structure for implementing the project and the interaction between the project’s staff responsible for procurement and MININFRA’s relevant central unit for administration and finance. The overall project risk for procurement was high at appraisal. All aspects of procurement procedures were managed professionally during implementation. A procurement TA supported the project within the RTDA from 2013 to the close of the project. The overall procurement performance rating for the project was classified as Moderately Satisfactory.
57. Procurement and Anti-Corruption Guidelines: The original grant agreements (Grant H331-RW and TF090451) were amended to include the January 2011 procurement guidelines. The Recipient, through the implementing entities, carried out procurement activities in accordance with Section I of the “Guidelines: Procurement under IBRD Loans and IDA Credits” published by the World Bank in January 2011 (“Procurement Guidelines”), in the case of goods and works, and Sections I and IV of the “Guidelines: Selection and Employment of Consultants by World Bank Borrowers” published by the World Bank in January 2011 (“Consultant Guidelines”) in the case of consultants’ services. Review by the World Bank of Procurement Decisions was carried out in accordance with the new guidelines. The original grant agreements were also amended to include anti-corruption guidelines as follows: The Recipient, through the implementing entities,

13
shall carry out project activities in accordance with the provisions of Article II of the Standard Conditions, the “Guidelines on Preventing and Combating Fraud and Corruption in Projects Financed by IBRD Loans and IDA Credits and Grants”, dated October 15, 2006 and Revised in January, 2011.
2.5 Post-completion Operation/Next Phase 58. Given the strong need to maximize connectivity to rural areas, raise agriculture production and increase commercialization by the GoR, a new project funded by the Bank, the Rwanda Feeder Roads Development Project (FRDP), for a credit amount of US$45 million was prepared, approved by the Bank on March 21, 2014, and became effective on June 19, 2014. The new project continues to build upon the achievements made under this project with an objective to enhance all season road connectivity agricultural market centers in selected districts. It contributes to the overarching goal of increasing agricultural production, ensuring food security, and enhancing agricultural marketing.
59. The FRDP is building on the good experience under the TSDP of involving local communities and engaging micro-enterprises, which also use local population in road maintenance. The project will support training and organization of LCAs and promote community based multi-year output based maintenance contracts. The project will also build on the experience of the multi-year maintenance contracts under TSDP by applying such methods to the feeder road contracts in a form of construction including multi-year maintenance contracts in hilly terrain roads and back to back construction and maintenance contracts on flatter roads, and when the source of funding is separate for the construction and the maintenance.
60. A Multi-Donor Trust Fund (MDTF) for Feeder Roads has been established at the Bank. The Bank and United States Agency for International Development (USAID) have signed an Administration Agreement (AA) and USAID has contributed US$50 million to the MDTF to stimulate the large, multi-donor, coordinated effort necessary to undertake responsible feeder road development in Rwanda. The Bank will administer the funds on behalf of the USAID and other such contributing donors to prepare projects with the GoR using separate Grant Financing Agreements following Bank procedures.
3. Assessment of Outcomes
3.1 Relevance of Objectives, Design and Implementation 61. The relevance of the project development objective is Substantial. 86.6 percent of the population of Rwanda lives in rural areas; however transport connectivity to the domestic, regional and global markets remains a challenge. Rwanda has made significant progress in maintaining a stable macroeconomic framework, growth however is suffering from weak rural transport infrastructure in general. The project design incorporated the above key objectives and the completion of the project indicated that the relevance of design remained high. The project objectives remained relevant to the ongoing Country Partnership Framework (CPF) which was aligned to the government vision and strategy under the EDPRS 2 approved in March 2013. This therefore shows a clear linkage between the project objectives, GoR’s vision and the CPF.

14
62. The relevance of project design is Substantial. The project was designed in a simple and straight forward manner and included global priorities such as road safety and combating HIV/AIDS. The road safety management is relevant to the United Nations (UN) Decade of Action for Road Safety Improvement. Combating HIV/AIDS through creating awareness and public campaigns are as well relevant to the Millennium Development Goals. 63. The relevance of implementation is Substantial. The implementation of the project contributed to the improvement of the paved road network and provided reliable access. The Engagement of LCAs for the maintenance of the national road network provided employment opportunities for road side communities. The project provided support towards the formation of the RTDA which is aimed at ensuring sustainable management and monitoring of transport sector activities. The project also contributed to the higher level objectives of NIS and ISN (2006) by placing transport investments among the key priorities.
3.2 Achievement of Project Development Objectives 64. The achievement of the PDO is rated Substantial. The PDO of providing improved condition of the paved road network and generating sustained employment in the rural areas through road maintenance works has been substantially achieved. About 62 percent of the paved roads network continues to remain in good condition, and the project has surpassed its intended original target of 50 percent. The completion of the Kigali to Ruhengeri road rehabilitation has contributed to the objective of providing reliable access to about 2.1 million people living along this main regional corridor. A Transport Sector Master Plan has been prepared. A master’s program in transportation studies has been successfully delivered. The engagement of LCAs for the maintenance of the national road network has helped to provide employment opportunities for 3,041 inhabitants along the roads. A detailed implementation overview of the four components under the TSDP is presented in Annex 2, Output by Components. 65. The project has achieved more than the PDO. Given the high agricultural productivity and tourism potential of the project influence area, the rehabilitation of the Kigali-Ruhengeri road has contributed to agricultural development through improved utilization of land and hence output as well as tourism through provision of quick and reliable access to national parks. It has also boosted trade both within the territory of Rwanda and with neighboring Democratic Republic of Congo (DRC). The improved road network condition now generate time and cost savings to national and international road travelers, as well as additional savings to agricultural producers and local businesses relying on road transport. As demonstrated by the economic analysis, the project has resulted to increased traffic, hence rise in volumes of trade.
66. Furthermore, a beneficiary assessment survey (Annex 5) conducted after implementation of the project reveals that there has been significant improvement in wealth of the population in the project area, increase in number of education facilities and enrolment rates, increase in price of land and housing, and improved access to credit facilities and other employment opportunities inter alia.

15
3.3 Efficiency 67. The efficiency of the project is rated Modest. At appraisal a cost benefit analysis was conducted for the Kigali - Ruhengeri road rehabilitation works, using the Vehicle Operating Cost (VOC) model which is based on the HDM and which calculated VOCs based on the road roughness and other technical parameters. The costs were discounted at a rate of 12 percent, the net present value (NPV) was RWF 4,314 million; and the Economic Internal Rate of Return (EIRR) was 13.5 percent, which confirmed viability of the original planned investment. 68. The comparison of economic appraisal between pre and post project implementation analyses that despite the increase of project cost by 28.9% due to widening of the road, actual economic benefits after the implementation of the project are much higher in comparison to the predicted economic benefits at appraisal time in 2007. However, there were shortcomings despite achievement of the economic benefits and the Bank had to provide AF to cover financing gap and the project closing date was extended by thirty (30) months. Details of the economic analysis are presented in Annex 3.
3.4 Justification of Overall Outcome Rating 69. With relevance of rated Substantial, achievement of the PDO substantial and efficiency modest, the overall outcome rating is Moderately Satisfactory. As per guidance of the ICR review meeting, this evaluation does not merit a disbursement-weighted split rating for the PDO. This decision is based primarily on the fact that the PDO remained the same throughout the project. Further, only one indicator target was revised downward and the ICR does not rely on this indicator for the outcome rating.
3.5 Overarching Themes, Other Outcomes and Impacts (a) Poverty Impacts, Gender Aspects, and Social Development 70. Poverty Impacts: The development of the road network greatly enhanced the local economy and supported overall poverty reduction through creating job opportunities, increased access to agricultural markets, emergence and development of small local markets, establishment of businesses and promotion of tourism. 71. Gender Aspects: The project benefited females living along the rehabilitated road influence area. Out of the 2.1 million living along the Kigali-Ruhengeri road, 48.5 percent are females implying that the project positively impacted on their lives as well. 72. Social Development: The rehabilitation and maintenance works were carried out along existing road alignments and there were no negative impacts on human settlements and the AF did not involve land acquisition/involuntary resettlement. The project provided improved access to health centers, schools, markets, and enabled the development of business activities along the corridors. Road workers and road side communities also benefited from anti Human Immunodeficiency Virus/Acquired Immune-deficiency Syndrome (HIV/AIDS) campaign implemented by the project.

16
(b) Institutional Change/Strengthening 73. The project contributed to the long term in-country training in transportation studies delivered by Kigali Institute of Science and Technology (KIST) that was completed in December 2014. Overall 52 students completed master’s degree with 30 students in Highway Engineering and Management and 22 students in Transportation Studies. These graduates are now rendering valuable services to both the public and private sector. The project facilitated the establishment of Roads Act (2011) and the RTDA Act (2011). RTDA is lead agency responsible for implementation of transport infrastructure projects and is now fully operational with adequate number of professional staff. The project also contributed to the establishment and training of LCAs in maintenance of the national road network through the provision of technical assistance. The LCAs will continue to provide the longer-term road maintenance. The road maintenance has also restored and developed private sector capacity in the national road industry. (c) Other Unintended Outcomes and Impacts (positive or negative) Not Applicable.
3.6 Summary of Findings of Beneficiary Survey and/or Stakeholder Workshops
74. Below are the key findings of beneficiary assessment surveys, with detailed presented in Annex 5:
(a) The travel characteristics of all categories of motor vehicles in the zone of influence of the project area were increased whereas travel times and number of days lost due to bad weather decreased;
(b) The key parameters related to agricultural activities have shown remarkable improvement after the implementation of the project;
(c) The key non-agricultural activities and both on and off farm employment per household achieved significant improvement;
(d) Significant increase of overall wealth in the project area has occurred in the order of more than 100 percent;
(e) Both price of land and housing have increased significantly ranging from 95 to 250 percent providing indirect benefits of transport improvements to the people in the project areas;
(f) Significant improvements in access to credit and employment opportunities have taken place in the range of 225 to 422 percent;
(g) Numbers of schools, student enrollment rate, number of teachers and regular available supply for school have improved. Meanwhile, drop-out rates for both male and female students have decreased significantly;
(h) Effectiveness and efficiency of public resources, capacity for planning, budgeting and financing have improved significantly;
(i) Majority of the respondents did not totally agree that TSDP had improved participation of private sectors and timely implementation of programs;
(j) Most of the students of the postgraduate training programs were of the view that the program was successful. In regard to different components of the program, they opined that on balance overall courses were adequate, appropriate and useful for practical life; and

17
(k) The project was successful in ensuring better statistics for transport strategy and policy making, improving continuous M&E of road transport programs and projects, improving information sharing and effectiveness of M&E system and overall Management Information System (MIS) for the road transport sector of Rwanda
4. Assessment of Risk to Development Outcome 75. The risk to the development outcomes is considered Moderate. The project was initially implemented by MININFRA who had low capacity in procurement and contract management and often experienced delays in procurement. In 2011, under the AF support the RTDA was established and has taken over responsibility of transport infrastructure development in the country. RTDA continued to show weak procurement capacity and was not able to hire procurement support, which hampered progress of the activities under the project. More so, the RTDA is facing the challenge of retaining trained staff. In order to counter the issue of staff retention, RTDA has identified its short and long term development needs in terms of staffing policies, training and retention of enhanced capacity. An SPIU has been established to support all externally-funded projects and it is anticipated that these measures may help RTDA to sustain and retain enhanced capacity. The RMF successfully provided over US$24 million of government funding towards the maintenance of the paved road network under the project. The project has created cooperatives of roadside dwellers (LCAs) to carryout routine maintenance works. Funding of road maintenance will continue to be provided by the RMF through districts and the LCAs will be engaged for regular routine maintenance. Subsequent to the adoption of the law on axle load control, the traffic on the whole Rwanda paved road network will be subject to weight controls to avoid early defects resulting to overload.
5. Assessment of Bank and Borrower Performance
5.1 Bank Performance (a) Bank Performance in Ensuring Quality at Entry 76. The Bank performance in ensuring quality at entry is rated Moderately Satisfactory. The project design was highly relevant to the development priorities of the country. The project objectives and design were also supported by the CPF and aligned to the government vision 2020 and strategy under the EDPRS 2. The project design included the development of institutional and road maintenance capacities and relevant global priorities such as road safety and combating HIV/AIDS. There were adequate fiduciary and implementation arrangements provided at project design, given the weak institutional capacity at project preparation as it was a post conflict environment. The project design provided for the establishment of FM systems as a condition of effectiveness and the recruitment of environmental specialist and procurement team to reinforce the team at the CGPT. Social and environmental assessments were carried to ensure no livelihood and persons were affected as a result of implementation of the project. M&E arrangements were put in place including hiring the services of external consultants to identify implementation issues and propose solutions.

18
77. The overall project risk at appraisal was assessed as high and the Bank put in place adequate mitigation measures including institutional and capacity building activities, the establishment of a RTDA, project management support by external consultants and monitoring of projects by international firms including an independent technical auditor.
78. However, despite the effort of the Bank to provide adequate support at preparation, the implementation challenges faced by the project, such as landslides, could largely be attributed to inadequate geological investigations ex ante leading to suboptimal designs. Low impact, high frequency geo-hazards of this type are not unique to Rwanda. Further support as to how to identify and mitigate the risks, could have been provided to the implementing agency, , particularly in the design stage, could have negated some of the procurement and other implementation challenges which together resulted in significant time and cost overrun for the civil works. (b) Quality of Supervision 79. The Bank performance in ensuring quality of supervision is rated Satisfactory. The Bank team continuously provided technical, fiduciary and safeguards support to the client during project implementation. Regular implementation support missions were conducted and key issues were often highlighted with appropriate follow-up actions. The adequacy of the implementation support provide by the Bank team was clearly indicated by contracting of all the activities planned both under the original project and the AF and disbursement of 98 percent of the project funds. The intensive support from the Bank team resulted in satisfactory achievement of the PDO. 80. Substantial procurement delays at start of the project resulted in generalized overall delays in project time table. The Bank team was responsive and subsequently exerted extra effort to improve procurement performance of the project which pushed up disbursement ratio. There was increased project supervision by the Bank, and the Bank team commissioned external consultants who conducted independent technical and safeguards audits that resulted in improved implementation performance ratings of the project. (c) Justification of Rating for Overall Bank Performance 81. Given the support provided by the Bank both at entry and implementation of the project that resulted in satisfactory achievement of the PDO despite the major challenges experienced during implementation, the overall performance rating for the Bank is assessed as Moderately Satisfactory.
5.2 Borrower Performance (a) Government Performance 82. The performance of the government is rated Satisfactory. The GoR was committed to the project from inception and was fully involved during project design, preparation and implementation. The project was designed in such that the GoR would finance road maintenance through the RMF. The GoR committed US$20 million as co-financing to the project during preparation. By project closure, the RMF had contributed about US$24 million which exceeded

19
their commitment level during preparation. This was an indication of the government’s strong commitment in ensuring that the paved road network is in good condition. The GoR also showed commitment in implementing institutional reforms for better management of the road sector and enacted the Road Act in 2011. The GoR also established the RTDA in 2011 as an agency responsible for the development of transport infrastructure projects and is now operational. This ensured delivery of better transport infrastructure projects in the country. (b) Implementing Agency or Agencies Performance 83. The implementation agency performance is rated Moderately Satisfactory. Implementation of the project was initially hampered by the limitations in the capacity of MININFRA in terms of procurement and contract management. RTDA also suffered from limitations in procurement capacity and was unable to hire appropriate procurement capacity after its establishment, resulting in delay in procurement and implementation of the project. A procurement specialist was recruited towards project closure to assist with the remaining procurement activities and to provide on-the-job training, which led to a marked improvement. Similarly under financial management there were delays in some instances in submission of audit reports as well as inaccurate preparation of IFRs at some instances. 84. Despite the challenges, the project has attained its objectives with improvements in reforms by the RTDA. The issue of institutional capacity and staff retention was addressed by establishing an SPIU with the responsibility of implementing project mainly financed by development partners. The establishment of the SPIU was aimed at improving efficiency of RTDA, by attracting experienced staff with improved remuneration packages, to reduce staff turnover. The set-up of SPIU and upgrading the salary scheme, both symbols of the commitment of the GoR, have attracted new and competent staff. For instance, the procurement personnel has increased from 3 to 9 people including 3 consultants (2 locals and 1 international) and improvement is significant. The institutional status of the RTDA is attached as Annex 10. By project closure, the majority of RTDA staff (mostly newly recruited SPIU staff) underwent a procurement and contract management training for three weeks to build their project management capacity. RTDA still continues to provide on-job capacity building for procurement staff as well as for the Internal Tender Committee after closure of the project. (c) Justification of Rating for Overall Borrower Performance 85. Despite the commitment of the GoR in the project and substantial achievement of the PDO outcomes, there were concerns about the limitations in institutional capacity of the RTDA in financial management and procurement. The overall performance rating for the Borrower is assessed as Moderately Satisfactory.
6. Lessons Learned 86. Donor Engagement with RTDA: Drawing from findings discussed under various sections in this ICR, it is considered necessary that the Bank and other development partners should continue providing further institutional support to RTDA, to further improve its capacity and operational efficiency. Particular areas in need of further support include, financial management,

20
procurement and contract management. Such capacity-building and institution-strengthening should form an important component of any future projects, with development partners ensuring that approaches to capacity building are well coordinated on the donor side. 87. Engagement of LCAs/Job Creation: With already 62 percent of the paved road network in good condition, the GoR needs to sustain the engagement of LCAs in road maintenance to ensure that the gains obtained during project implementation are not lost after closure of the project. Rwanda has successfully implemented the use of LCAs in road maintenance, which is an important aspect they need to take forward, not only on the paved road network, but also on the unpaved roads network. The LCAs are currently employed by districts along the national road network to conduct routine maintenance.
88. Policy and institutional reforms: The lesson learned from this project is that institutional reforms conducted in parallel to project implementation causes delays. It is to be learned that establishment of new institutions require longer time than anticipated for transition, which greatly impacts on implementation progress, and needs policy consultations and commitment as part of the preparatory work by both the Bank and government. 89. Human Resource Capacity Development: Restructuring an agency at the same time of implementation is challenging. The development of human capital to an acceptable and stable stage is a continuous process. It is therefore essential for the GoR and development partners to continue providing support to build RTDA’s capacity as discussed in paragraph 86 above, to enable them establish sustainable management systems and help reduce the turn-around time for project implementation. It is also vital to keep the dynamics of human resource development, inclusive of recruiting and training staff in various disciplines in order to build better capacity for management of the transport infrastructure. This should not be only applicable to the SPIU but the entire RTDA structure. 90. Use of Innovative Longer-term Contracting: Applying innovative and cost saving methods, including contracting road rehabilitation works under Output and Performance-Based Road Contracting (OPRC) and/or contracting maintenance works for many years is an option that should be practiced to ensure continued maintenance of the classified roads. This is crucial in situations where there are no appropriate measures or adequate financial resources put in place for road maintenance funding, especially in post conflict countries.
7. Comments on Issues Raised by Borrower/Implementing Agencies/Partners (a) Borrower/implementing agencies: The Bank’s draft ICR was shared with the Borrower on May 22, 2015. Comments were received on May 29, 2015 and provided under Annex 7. (b) Cofinanciers: The draft ICR was shared on June 2, 2015. No comments were received by the time of finalization of this ICR. (c) Other partners and stakeholders: None (e.g. NGOs/private sector/civil society)

21
Annex 1. Project Costs and Financing
(a) Project Cost by Component - IDA-49680, IDA-H3310, TF-90451 (in USD Million equivalent)
Components Appraisal Estimate
(USD millions)
Actual/Latest Estimate (USD
millions)
Percentage of Appraisal
1: Paved Roads Rehabilitation and Maintenance
36.20 53.50 148%
2: Sector Governance and Policy Support
2.60 1.94 75%
3: Sector Analysis and Planning Support
2.20 2.92 133%
4: Project and Program Management Support
1.20 1.18 98%
Project Preparation/Refund of PPA 0.60 Total Baseline Cost 42.80 59.54 139%
Physical Contingencies (10% of Component 1a)
4.20
Price Contingencies (5% of Component 1a)
2.00
Total Project Costs 49.00 59.54 122% Front-end fee PPF 0.00 0.00 Front-end fee IBRD 0.00 0.00
Total Financing Required 49.00 59.54 122%
Notes: An undisbursed amount of US$416,412.88 was cancelled in May 2015 from the IDA Grant (H3310) and Credit (49680). US$ 15,385.11 was refunded from the designated account (DA) by the Client.

22
(b) Project Cost by Component – Government of Rwanda Financing (in USD Million equivalent)
Components Appraisal Estimate
(USD millions)
Actual/Latest Estimate (USD
millions)
Percentage of Appraisal
1: Paved Roads Rehabilitation and Maintenance
20.00 24.00 120%
2: Sector Governance and Policy Support
3: Sector Analysis and Planning Support
4: Project and Program Management Support
Project Preparation/Refund of PPA Total Baseline Cost 20.00 24.00 120%
Physical Contingencies (10% of Component 1a)
Price Contingencies (5% of Component 1a)
Total Project Costs 20.00 24.00 120% Front-end fee PPF 0.00 0.00 Front-end fee IBRD 0.00 0.00
Total Financing Required 20.00 24.00 120%
(c) Financing
Source of Funds Type of
Cofinancing
Appraisal Estimate
(USD millions)
Actual/Latest Estimate
(USD millions)
Percentage of Appraisal
Borrower - GoR Own source 20.00 24.00 120% Africa Catalytic Growth Fund (ACGF) – TF-90451
Grant 38.00 38.00 100%
IDA-H3310 Grant 11.00 10.57 96% IDA-49680 Credit 11.00 10.30 100%2 Total 69.00 83.54 121%
2 The percentage disbursed for the IDA Grant and Credit is calculated based on SDR amount disbursed by the disbursement deadline date.

23
Annex 2: Output by Component 1. The project consisted of four (4) components, namely: (i) Paved Road Rehabilitation and Maintenance; (ii) Sector Governance and Policy Support; (iii) Sector Analysis and Planning Support; and (iv) Project and Program Management Support. 2. Component 1 – Paved Road Rehabilitation and Maintenance: Handover of the Kigali – Ruhengeri road was carried out on September 18, 2012 and defects correction was completed during the defects liability period. The three multi-year maintenance contracts with a total length of 277 km were completed in November 2014. MININFRA, under the TSDP, has created a total of 283 cooperatives of road side dwellers and trained 11,322 rural people to carry out routine maintenance works since 2008. The engagement of LCAs, local communities and micro enterprises on 801 km of the national road network has helped to provide employment opportunities to 3,041 (51.5% men, and 48.5% women) road side dwellers exceeding the target (3,000). The Road Maintenance Fund (RMF) had deposited in the special project account, over US$24 million exceeding the commitment of the Government to contribute about US$20 million for maintenance under TSDP. 3. Component 2 – Sector Governance and Policy support: Establishment and training of LCAs; sector level HIV/AIDS prevention strategy; and Preparation of Transport Master Plan have been completed. Performance agreements between MININFRA and RTDA and MININFRA and RMF were signed. Provision of technical assistance in support of establishment and training of LCAs of roadside dwellers in labor-intensive road maintenance was done through use two (2) local consulting firms. The topics covered in the training were mainly routine maintenance, HIV/AIDS awareness and the environmental protection. A routine maintenance manual in Kinyarwanda, a draft legal statute and a typical maintenance contract between districts and cooperatives were prepared. Terms of reference were also developed to recruit a technical assistance to supervise the pilot phase of 1,035 km that are part of the national road network. In total 283 cooperatives of road side dwellers have been created and trained on the whole national classified road network. These cooperatives are made of a total manpower of 11,322 people and provided employment opportunities for about 3,041 inhabitants directly under Bank supported maintenance projects. 4. To sensitize central and local authorities as well as the public on the use of routine maintenance LCAs, radio programs were prepared and broadcasted. Moreover, MININFRA held several meetings with the Ministry of Local Government and district authorities and urged them to use LCAs in their road development programs. Official use of LCAs in routine maintenance started with the fiscal year of 2012/2013 in some districts of Rwanda. Since 2012, 119 LCAs were used in conducting routine maintenance in 26 districts on a section of the road network of 2,962 km including components financed by the Bank like the Kagitumba-Kayonza-Rusumo (208 km) and Gitarama-Kibuye (78km) periodic maintenance.
5. The LCAs are currently employed by districts along the national road network to conduct routine maintenance. Funding of their activities is done by the RMF through districts. In addition to the initial trainings conducted under TSDP, the RTDA regularly organizes refresher courses in road routine maintenance, environmental protection and protection against HIV/AIDS and sexual transmitted diseases. These trainings are organised through supervision mission contracts for

24
different on-going road projects. For instance, such training is underway for the just completed Kigali-Gatuna road project under the financing of the European Union (EU). 6. A road database has been established for the RTDA and is being used in the planning, programming and management of interventions on the national road network that will gradually gain in efficiency and efficacy with the completion of the national road design manual and standards. 7. Component 3 – Sector Analysis and Planning Support: The project contributed to the long term in-country training in transportation studies delivered by Kigali Institute of Science and Technology (KIST) that was completed in December 2014. Overall 52 students completed master’s degree with 30 students in Highway Engineering and Management and 22 students in Transportation Studies. The feasibility study and ESIA for feeder roads was completed in August 2013. Implementation of the activities, namely: (i) Reviewing the Road Maintenance revenue allocation formulae; (iii) preparation of roads and bridges design standards and specification, and introduction of road management tools; (iv) conducting Road Safety audit and preparation of an action plan; (v) Laboratory equipment for KIST; (vi) Technical Assistance for Price escalation, and (vii) Procurement training of RTDA staff were completed in December 2014. 8. Component 4 -Project and Program Management Support: This component was designed to support: (i) Operating Costs of the Planning, Policies and Capacity Building Unit, the Transport Projects Management Unit, and the RTDA, and (ii) provision of technical assistance to the same units and the Road Maintenance Fund in support of Project and Program technical audits. The issue of institutional capacity retention at RTDA has been addressed through the creation of a SPIU from July 2014 as part of the restructuring of the agency. The restructuring process was aimed at improving the efficiency of the institution by attracting experienced staff with improved remuneration package. The total number of RTDA staff stands at 98 among which 61 are Engineers including managerial positions and the remaining 37 are in the corporate services. Specifically, the SPIU will be in charge of implementing projects that are mainly financed by the Development Partners. The SPIU recruitment process was completed in end September 2014.

25
Annex 3. Economic and Financial Analysis 1. In order to compare post implementation economic benefits with respect to predicted economic benefits at the time of appraisal, a comparative Economic analysis was conducted using the typical and classical cost benefit method with determination of the internal rate of return and the NPV.
2. Economic analyses are based on real cost, that is, net of inflation for both pre and post project appraisal scenarios. The real discount rate applied is 12 percent. This rate is commonly applied to determine the rate of return of road projects funded by international donors, such as the European Development Fund and the World Bank. 3. Evaluation of the economic profitability indicators (NPV and EIRR) were evaluated by comparing situations of implementation of the project “Without” and “With” rehabilitant option based on the following factors:
Economic costs of investments; Economic costs of maintenance in the “without” and “with” situations of project
implementation; and VOC in the two situations (economic benefits).
Comparative analyses were done to assess actual benefits accrued due to the projects and hence to compare the actual results after the implementation of the project and hence to compare the same with the predicted benefits at the time of the appraisal. 4. The analysis was conducted using the 1.3 version of the HDM-4 software. Parameters of the Economic Analysis 5. At the time of appraisal, cost-benefit analyses for paved rehabilitation work for Kigali-Ruhengeri and Ruhengeri-Rubavu (Gisenyi) links were conducted using the VOC model which is based on the HDM. The model calculates vehicle operating costs based on the road’s roughness and other technical parameters. However, Ruhengeri-Rubavu section of the road network was built long before the start of the construction work of Kigali-Ruhengeri road in 2010. It might not be appropriate to include Ruhengeri-Rubavu portion in the post implementation economic appraisal of Kigali-Ruhengeri road. Alternatives 6. Post implementation economic evaluation was conducted using traffic data of 2010 and 2013. All the VOC parameters were updated using VOC surveys of different studies in 2013 and 2014 in the Ministry of Infrastructure and Rwanda Transport Development Agency. During the appraisal two alternative assumptions were considered for the economic and sensitivity analysis of the completed road. The alternatives scenarios considered were:

26
Alternative 1: Coating + reinforcement with BB + width 6.00 to 6.30 m + existing road geometry;
Alternative 2: Coating with BB and reinforcement with ES + width 6.00 to 6.30 m + existing road geometry;
For the post economic analysis only one alternative was considered as follows: Alternative 3: Coating with BB and reinforcement with ES + widening to 7.00 m +
existing road geometry. Economic coefficients 7. All economic costs and benefits are expressed in the USD representing actual resource costs and it does not transfer” payments such as taxes, charges and customs duties. The price of any tradable product is based on its international “border price”, that is Cost, Insurance and Freight for imports and Free on Board for exports. The conversion rate of 550 RWF with USD at March 2005 at appraisal. On the other hand the conversion rate of RWF with USD in April, 2015 is 710. The economic coefficients of different elements of costs, which were used in the present study, are given in Table 3.1.
Table 3.1: Economic coefficients of different elements of costs
Item Taxes and Duties
Ratios % of Works Weighted Co-efficient
Workers 8% 0.92 20% 0.18
Skilled Staff 30% 0.70 10% 0.07
Machines, Site Equipment 20% 0.80 35% 0.28
Fuel 41% 0.59 10% 0.06
Imported materials (bitumen) 15% 0.85 15% 0.13
Administrative expenses 30% 0.70 10% 0.07
Overall economic coefficient of investment cost 0.79
Vehicle Operating Costs 8. Calculation of vehicle operating costs is done using the HDM-4 model. At appraisal, parameters for calculating vehicle operating costs were defined in Rwanda by two previous studies, namely preparation of the Sector Framework and Scetauroute Investment Program (August 2001) and the Socio-Economic Report of the study on the Rehabilitation and completion of asphalting of the Gitarama - Ngororero - Mukamira road (September 2004), funded by the AfDB. For post implementation economic analysis, different elements of VOC costs were mainly obtained from the Vehicle Age Limit study of 20133. Again, the price of different elements of
3 MININFRA (2013) Study on the Impact Assessment of the Age Limit of Imported Motor Vehicles on Economy, Environment and Road Safety in Rwanda.
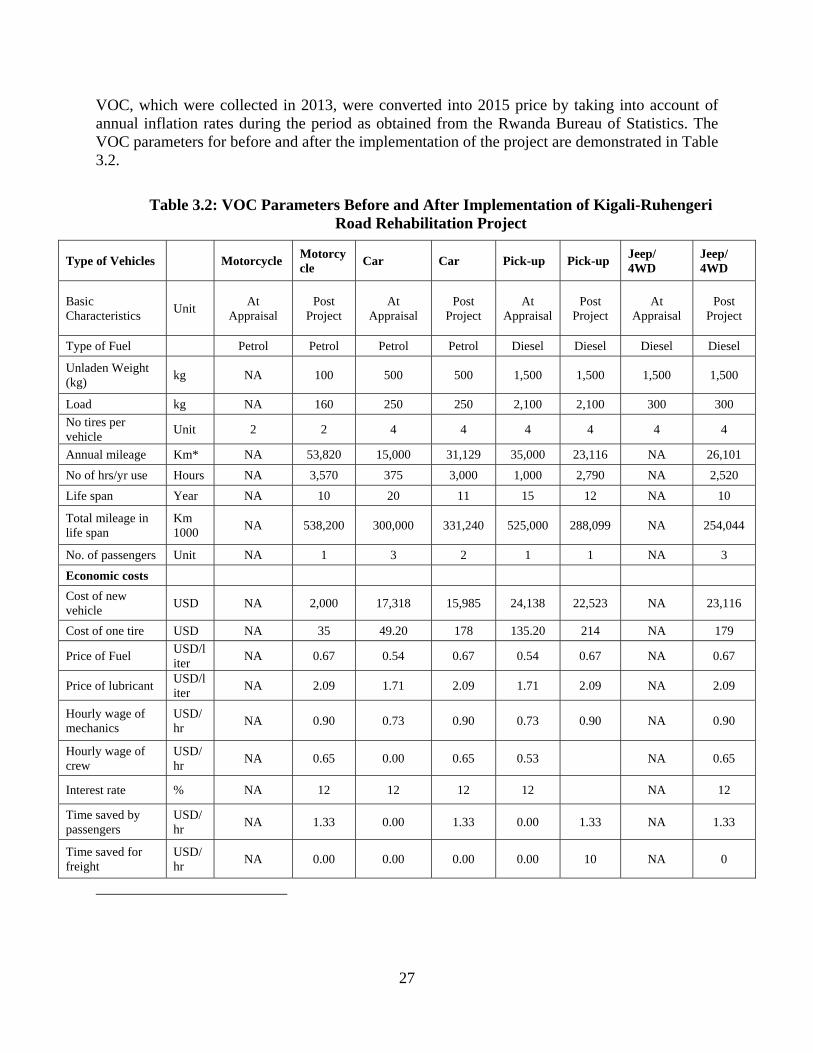
27
VOC, which were collected in 2013, were converted into 2015 price by taking into account of annual inflation rates during the period as obtained from the Rwanda Bureau of Statistics. The VOC parameters for before and after the implementation of the project are demonstrated in Table 3.2.
Table 3.2: VOC Parameters Before and After Implementation of Kigali-Ruhengeri
Road Rehabilitation Project
Type of Vehicles Motorcycle Motorcycle
Car Car Pick-up Pick-up Jeep/ 4WD
Jeep/ 4WD
Basic Characteristics
Unit At
Appraisal Post
Project At
Appraisal Post
Project At
Appraisal Post
Project At
Appraisal Post
Project
Type of Fuel Petrol Petrol Petrol Petrol Diesel Diesel Diesel Diesel
Unladen Weight (kg)
kg NA 100 500 500 1,500 1,500 1,500 1,500
Load kg NA 160 250 250 2,100 2,100 300 300
No tires per vehicle
Unit 2 2 4 4 4 4 4 4
Annual mileage Km* NA 53,820 15,000 31,129 35,000 23,116 NA 26,101
No of hrs/yr use Hours NA 3,570 375 3,000 1,000 2,790 NA 2,520
Life span Year NA 10 20 11 15 12 NA 10
Total mileage in life span
Km 1000
NA 538,200 300,000 331,240 525,000 288,099 NA 254,044
No. of passengers Unit NA 1 3 2 1 1 NA 3
Economic costs
Cost of new vehicle
USD NA 2,000 17,318 15,985 24,138 22,523 NA 23,116
Cost of one tire USD NA 35 49.20 178 135.20 214 NA 179
Price of Fuel USD/liter
NA 0.67 0.54 0.67 0.54 0.67 NA 0.67
Price of lubricant USD/liter
NA 2.09 1.71 2.09 1.71 2.09 NA 2.09
Hourly wage of mechanics
USD/hr
NA 0.90 0.73 0.90 0.73 0.90 NA 0.90
Hourly wage of crew
USD/hr
NA 0.65 0.00 0.65 0.53 NA 0.65
Interest rate % NA 12 12 12 12 NA 12
Time saved by passengers
USD/hr
NA 1.33 0.00 1.33 0.00 1.33 NA 1.33
Time saved for freight
USD/hr
NA 0.00 0.00 0.00 0.00 10 NA 0
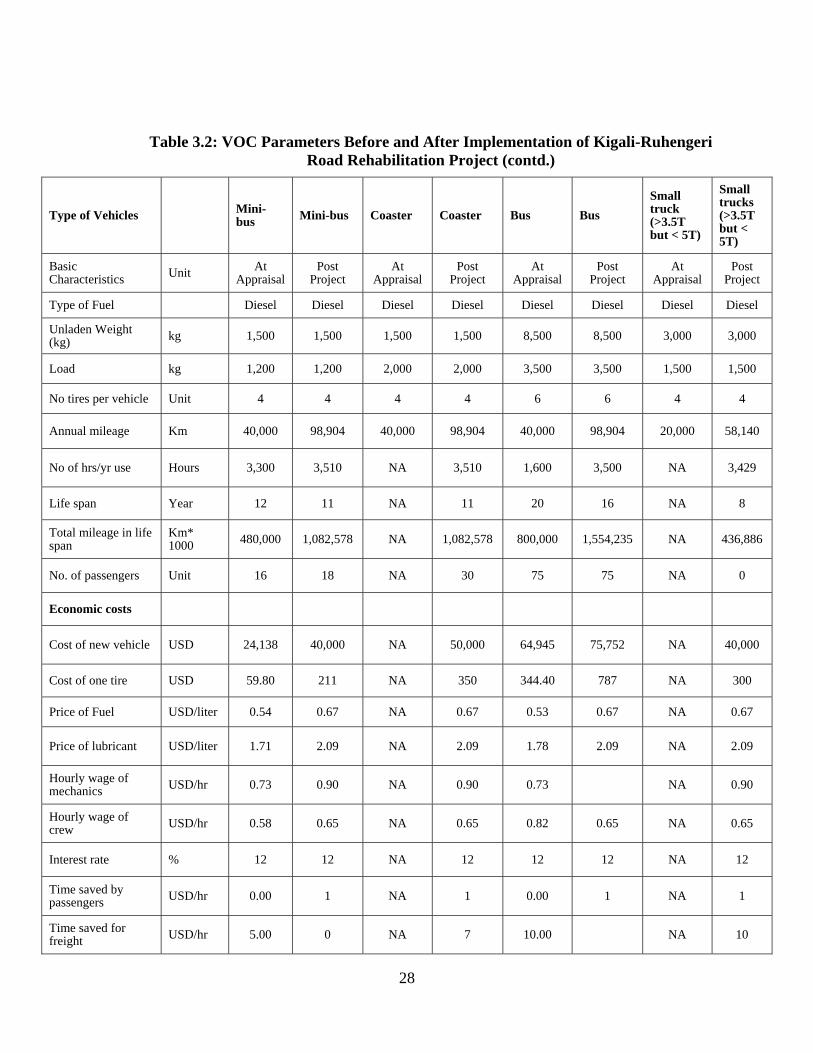
28
Table 3.2: VOC Parameters Before and After Implementation of Kigali-Ruhengeri Road Rehabilitation Project (contd.)
Type of Vehicles Mini-bus Mini-bus Coaster Coaster Bus Bus
Small truck (>3.5T but < 5T)
Small trucks (>3.5T but < 5T)
Basic Characteristics Unit At
Appraisal Post
Project At
Appraisal Post
Project At
Appraisal Post
Project At
Appraisal Post
Project
Type of Fuel Diesel Diesel Diesel Diesel Diesel Diesel Diesel Diesel
Unladen Weight (kg) kg 1,500 1,500 1,500 1,500 8,500 8,500 3,000 3,000
Load kg 1,200 1,200 2,000 2,000 3,500 3,500 1,500 1,500
No tires per vehicle Unit 4 4 4 4 6 6 4 4
Annual mileage Km 40,000 98,904 40,000 98,904 40,000 98,904 20,000 58,140
No of hrs/yr use Hours 3,300 3,510 NA 3,510 1,600 3,500 NA 3,429
Life span Year 12 11 NA 11 20 16 NA 8
Total mileage in life span
Km* 1000 480,000 1,082,578 NA 1,082,578 800,000 1,554,235 NA 436,886
No. of passengers Unit 16 18 NA 30 75 75 NA 0
Economic costs
Cost of new vehicle USD 24,138 40,000 NA 50,000 64,945 75,752 NA 40,000
Cost of one tire USD 59.80 211 NA 350 344.40 787 NA 300
Price of Fuel USD/liter 0.54 0.67 NA 0.67 0.53 0.67 NA 0.67
Price of lubricant USD/liter 1.71 2.09 NA 2.09 1.78 2.09 NA 2.09
Hourly wage of mechanics USD/hr 0.73 0.90 NA 0.90 0.73 NA 0.90
Hourly wage of crew USD/hr 0.58 0.65 NA 0.65 0.82 0.65 NA 0.65
Interest rate % 12 12 NA 12 12 12 NA 12
Time saved by passengers USD/hr 0.00 1 NA 1 0.00 1 NA 1
Time saved for freight USD/hr 5.00 0 NA 7 10.00 NA 10
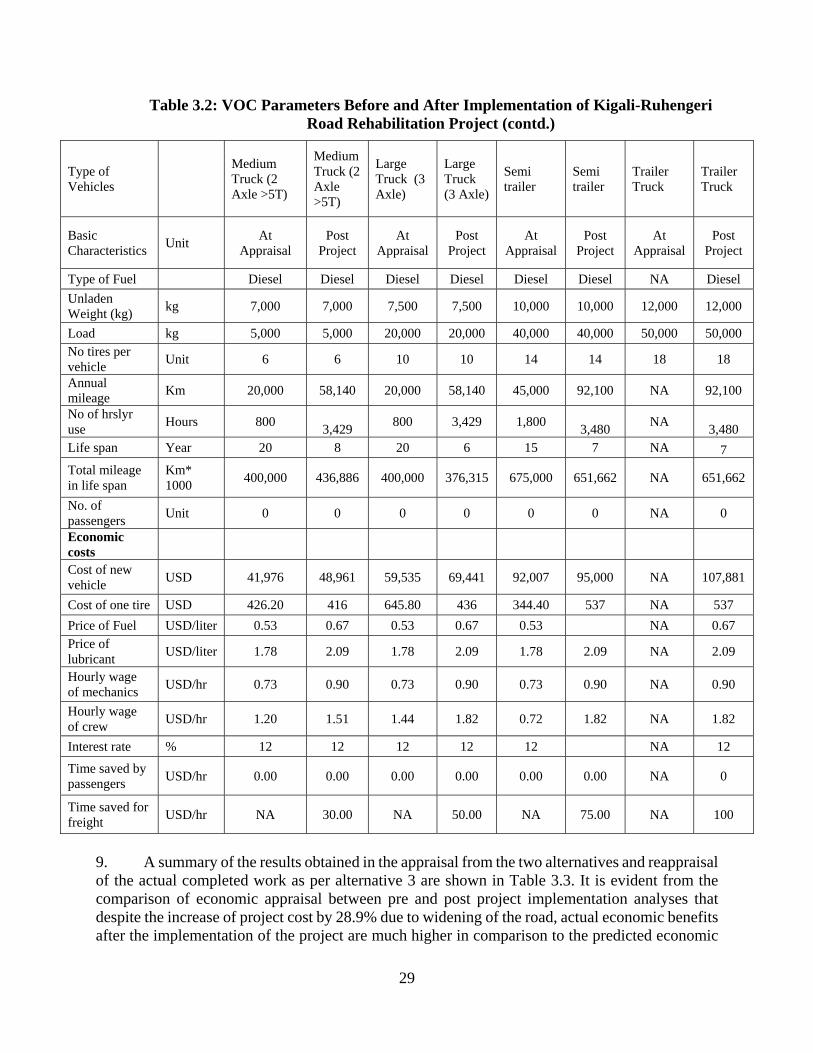
29
Table 3.2: VOC Parameters Before and After Implementation of Kigali-Ruhengeri Road Rehabilitation Project (contd.)
Type of Vehicles
Medium Truck (2 Axle >5T)
Medium Truck (2 Axle >5T)
Large Truck (3 Axle)
Large Truck (3 Axle)
Semi trailer
Semi trailer
Trailer Truck
Trailer Truck
Basic Characteristics
Unit At
Appraisal Post
Project At
Appraisal Post
Project At
Appraisal Post
Project At
Appraisal Post
Project
Type of Fuel Diesel Diesel Diesel Diesel Diesel Diesel NA Diesel
Unladen Weight (kg)
kg 7,000 7,000 7,500 7,500 10,000 10,000 12,000 12,000
Load kg 5,000 5,000 20,000 20,000 40,000 40,000 50,000 50,000 No tires per vehicle
Unit 6 6 10 10 14 14 18 18
Annual mileage
Km 20,000 58,140 20,000 58,140 45,000 92,100 NA 92,100
No of hrslyr use
Hours 800 3,429
800 3,429 1,800 3,480
NA 3,480
Life span Year 20 8 20 6 15 7 NA 7
Total mileage in life span
Km* 1000
400,000 436,886 400,000 376,315 675,000 651,662 NA 651,662
No. of passengers
Unit 0 0 0 0 0 0 NA 0
Economic costs
Cost of new vehicle
USD 41,976 48,961 59,535 69,441 92,007 95,000 NA 107,881
Cost of one tire USD 426.20 416 645.80 436 344.40 537 NA 537
Price of Fuel USD/liter 0.53 0.67 0.53 0.67 0.53 NA 0.67 Price of lubricant
USD/liter 1.78 2.09 1.78 2.09 1.78 2.09 NA 2.09
Hourly wage of mechanics
USD/hr 0.73 0.90 0.73 0.90 0.73 0.90 NA 0.90
Hourly wage of crew
USD/hr 1.20 1.51 1.44 1.82 0.72 1.82 NA 1.82
Interest rate % 12 12 12 12 12 NA 12
Time saved by passengers
USD/hr 0.00 0.00 0.00 0.00 0.00 0.00 NA 0
Time saved for freight
USD/hr NA 30.00 NA 50.00 NA 75.00 NA 100
9. A summary of the results obtained in the appraisal from the two alternatives and reappraisal of the actual completed work as per alternative 3 are shown in Table 3.3. It is evident from the comparison of economic appraisal between pre and post project implementation analyses that despite the increase of project cost by 28.9% due to widening of the road, actual economic benefits after the implementation of the project are much higher in comparison to the predicted economic

30
benefits at appraisal time in 2007. Out of the two alternatives during appraisal time, economic benefits of the alternative 1 was slightly better having EIRR and NPV(12 percent) of 12.80 percent and USD 1.77 million respectively. On the other hand, economic indicators in terms of EIRR and NPV (12 percent) for the alternative 3, which was implemented in the project, were 30.8 percent and USD 345.05 million respectively. This clearly demonstrates that the actual economic benefits from the project are significantly higher than predicted benefits during appraisal time.
Table 3.3: Comparison of the Summary Results of the Appraisal and Reappraisal after Completion of Kigali-Ruhengeri Road Rehabilitation Works
Parameters At Appraisal At Completion
Alternative Alternative 1:
(BB) Alternative 2: (ES)
Alternative 3: Widening &
Rehabilitation Road Width in meter 6.00 m to 6.30 m 6.00 m to 6.30 m 7.00 m
Financial Cost (USD Million)
37.31 36.62 48.09
Economic Cost (USD Million)
29.48 28.93 37.99
EIRR 12.80% 12.30% 30.80%
NPV (12%) 1.77 0.68 345.05
10. As demonstrated overall, the scenario option of Alternative 3, which represents the actual implemented option, recorded better results for the economic indicators in comparison to the two other alternatives of appraisal report. With regards to traffic, the original growth rate, which was employed at the appraisal, was only 4.8 percent in the year 2005. However actual growth rate during 2005 to 2010 before the commencement of the project was significantly higher, i.e. 7.2 percent. Moreover, the traffic growth rate between 2010 and 2013 was 13.3 percent, which is almost 3 times higher than the predicted traffic growth at the time of appraisal, i.e. 2005. Given that in the economic analysis only 5 percent generated traffic was assumed, it is clearly evident that much higher economic benefits of the Kigali-Ruhengeri road rehabilitation project was attributed to significant increase of traffic ranging from 7.2 to 13.3percent as shown in Table 3.4.
Table 3.4: AADT and Traffic Growth Rates in Different Time Periods in Kigali-Ruhengeri
Road
Year of Traffic Count AADT without Motorcycle
AADT with Motorcycle
Growth Rate
2005 949 4.80%2010 1,343 1,524 7.2%2013 1,954 2,195 13.3%
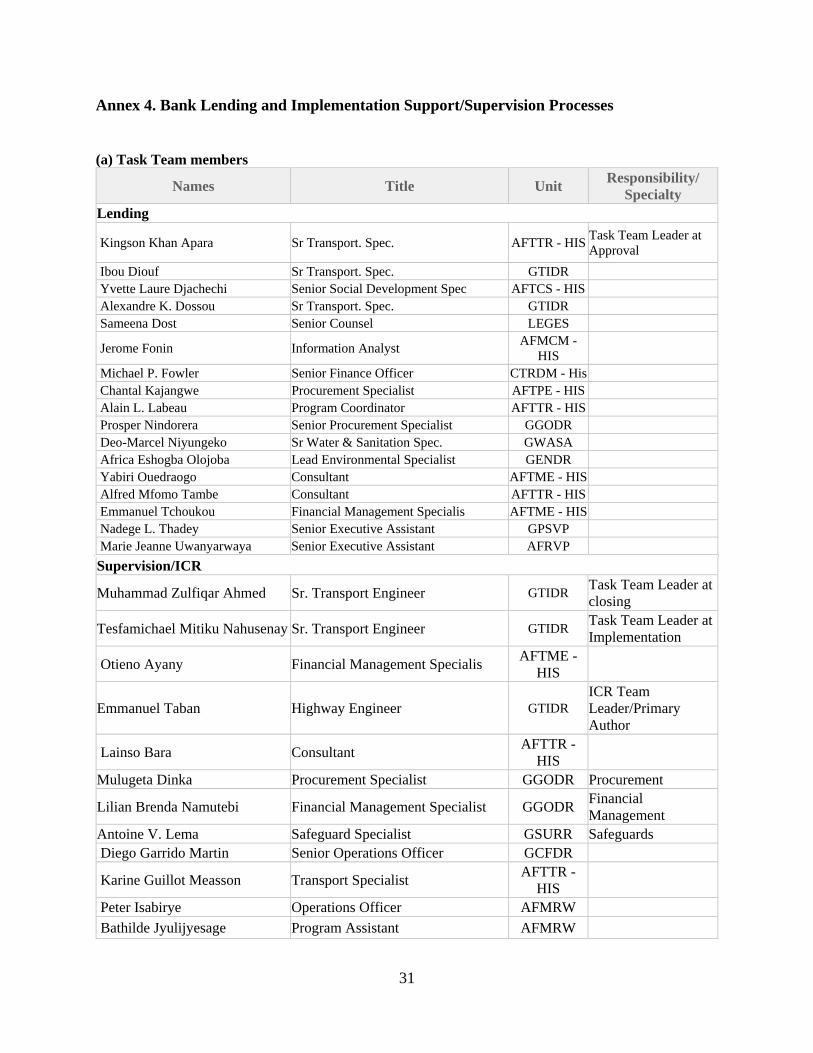
31
Annex 4. Bank Lending and Implementation Support/Supervision Processes
(a) Task Team members
Names Title Unit Responsibility/
Specialty Lending
Kingson Khan Apara Sr Transport. Spec. AFTTR - HIS Task Team Leader at Approval
Ibou Diouf Sr Transport. Spec. GTIDR Yvette Laure Djachechi Senior Social Development Spec AFTCS - HIS Alexandre K. Dossou Sr Transport. Spec. GTIDR Sameena Dost Senior Counsel LEGES
Jerome Fonin Information Analyst AFMCM -
HIS
Michael P. Fowler Senior Finance Officer CTRDM - His Chantal Kajangwe Procurement Specialist AFTPE - HIS Alain L. Labeau Program Coordinator AFTTR - HIS Prosper Nindorera Senior Procurement Specialist GGODR Deo-Marcel Niyungeko Sr Water & Sanitation Spec. GWASA Africa Eshogba Olojoba Lead Environmental Specialist GENDR Yabiri Ouedraogo Consultant AFTME - HIS Alfred Mfomo Tambe Consultant AFTTR - HIS Emmanuel Tchoukou Financial Management Specialis AFTME - HIS Nadege L. Thadey Senior Executive Assistant GPSVP Marie Jeanne Uwanyarwaya Senior Executive Assistant AFRVP
Supervision/ICR
Muhammad Zulfiqar Ahmed Sr. Transport Engineer GTIDR Task Team Leader at closing
Tesfamichael Mitiku Nahusenay Sr. Transport Engineer GTIDR Task Team Leader at Implementation
Otieno Ayany Financial Management Specialis AFTME -
HIS
Emmanuel Taban Highway Engineer GTIDR ICR Team Leader/Primary Author
Lainso Bara Consultant AFTTR -
HIS
Mulugeta Dinka Procurement Specialist GGODR Procurement
Lilian Brenda Namutebi Financial Management Specialist GGODR Financial Management
Antoine V. Lema Safeguard Specialist GSURR Safeguards Diego Garrido Martin Senior Operations Officer GCFDR
Karine Guillot Measson Transport Specialist AFTTR -
HIS
Peter Isabirye Operations Officer AFMRW
Bathilde Jyulijyesage Program Assistant AFMRW

32
Chantal Kajangwe Procurement Specialist AFTPE -
HIS
Martin Kum Bah Consultant AFTTR -
HIS
Alain L. Labeau Program Coordinator AFTTR -
HIS
Patricia Paula Macchi Junior Professional Associate AFTTR -
HIS
Nadege L. Thadey Senior Executive Assistant GPSVP
Solomon Muhuthu Waithaka Sr Highway Engineer GTIDR Task Team Leader at Implementation
Stephen Mugendi Mukaindo Counsel LEGAM Lawyer
Svetlana Khvostova Environmental Specialist GENDR Environmental Management
Teguest Demissie Program Assistant GTIDR
Samuel Iyasu Zerom Operations Analyst AFMRW
(b) Staff Time and Cost
Stage of Project Cycle Staff Time and Cost (Bank Budget Only)
No. of staff weeks USD Thousands (including travel and consultant costs)
Lending FY03 17.50 FY04 81.15 FY05 86.51 FY06 76.67 FY07 61.45 FY08 44.02
Total: 367.30 Supervision/ICR
FY03 0.00 FY04 0.00 FY05 0.00 FY06 0.00 FY07 0.98 FY08 55.59
Total: 56.57

33
Annex 5. Beneficiary Survey Results 1. Introduction: As part of the assessment of the beneficiary of TSDP, RTDA undertook a comprehensive questionnaire survey for all four components of the project, i.e. (i) Component 1 – Paved Road Rehabilitation and Maintenance, (ii) Component 2: Sector Governance and Policy Support, (iii) Component 3: Sector Analysis and Planning Support, and (iv) Component 4- Project and Program Management Support. A team of 15 engineers/enumerators coordinated by the Transport Adviser of RTDA (Team Leader) were employed to conduct the Beneficiary Assessment of the project. The team conducted the questionnaire surveys for the key beneficiaries of the project during March, 2015.
2. Purpose and Objectives: The main purpose of the project was to improve riding quality of the National road network and hence to generate employment opportunities and improvement of institutional and human resources capacity in road sector. The objectives of the project were: (a) to assess direct transport impacts of the rehabilitation of Kigali-Ruhengeri road on road users and other key stakeholders in zone of influence of the project areas, and (b) to determine indirect impacts on net social welfare for the stakeholders of the project.
3. Task 1: Description of the Proposed Project: At the time of Beneficiary Assessment in March, 2015 all the four components of the project were successfully completed within the project completion date, That is, December 31, 2014. However, it is not clear what the wider impacts of the project on stakeholders are. Efforts were made in the Beneficiary Assessment of the project to determine wider direct transport and socio-economic impacts of the project on intended beneficiaries.
4. Task 2: Description of the Historical, Institutional, Socio-Cultural and Political Context: The economy was at stagnant situation having only 4% Gross Domestic Product (GDP) growth during the time of appraisal. Since then remarkable progress have been made in both transport and socio-economic sectors. The key issue is therefore to isolate impacts of the project which were solely attributed to the project from other overall socio-economic growth of the country as a whole during the implementation period.
5. Task 3: Legislative and Regulatory Considerations: During the implementation period CGPT was restructured and converted into a full-fledged transport agency, which is Rwanda Transport Development Agency (RTDA). RTDA was assigned the responsibility of improvement and maintenance management of National Road network of Rwanda. With the establishment of RTDA, the Policy Planning and Capacity Building Unit (PPCBU) of MININFRA no longer acts both as a policy making and implementing agency. The role of the MININFRA is now limited to policy making and monitoring the activities of the implementing agencies, such as RTDA.
6. The Road Maintenance Fund (RMF) is an institution established by the law. Road Maintenance Fund is tasked with the responsibility to is to receive, effectively manage and disburse funds for the maintenance of National, District (Class 1) and Kigali City roads, as determined by an Order of the Ministry in charge of roads. Since 1998 when RMF was established, its mandate was limited to maintenance of only National roads. Road Act of 14/02/2011 governing roads in Rwanda included District roads Class 1 under RMF’s mandate. However, the expansion of mandate of RMF to cover District Class 1 roads was done without making provisions of additional financing for institution.

34
7. Task 4: Assessment of Key Impacts: Efforts were made to include all potential direct and indirect impacts of the all four components of the project in the beneficiary analysis.
8. Task 5: Data Collection and Assessment Methods: The study conducted a comprehensive analytical assessment of the beneficiaries of the project. In order to collect data related to different direct and indirect impacts of the project, six questionnaire surveys were undertaken to assess impacts on beneficiaries by all four components of the project. A stratified random sampling technique was employed for the questionnaire surveys. In order to maintain normal distribution, sufficient number of samples from each stratum, i.e. at least 30 samples for each vehicle type were collected. This means in total 270 interviews were conducted in the study as shown in Table 5.1. In total 15 numbers of surveyors and 2 data entry and transcription personnel were employed for period of 4 weeks to conduct the questionnaire surveys and Transport Advisor of RTDA supervised and coordinated the study as the Team Leader.
9. Design of Questionnaires: In order to design the questionnaire for different types of surveys for beneficiary assessment mainly three types of questions were considered as follows: (i) Informative or Descriptive Questions, (ii) Preference or ranking questions, and (iii) Before- and-after questions. There are three main ways of collecting information regarding preferences: (i) Choice, (ii) Rating, and (iii) Ranking. In choice experiments, the respondents are asked to select an option either from a pair or from a group. One of the attractions of ranking is that all the options can be presented simultaneously. Ranking was employed in the study to rank the relative impacts of some the key parameters due to implementation of the project. Nine points Likert scale were employed to rank different attributes of the project as shown in Table 5.1. A special kind of ‘before-and-after design’ was employed in this research. All the relevant parameters of the all four components of the project before and after the implementation were collected from the surveys. Depending on the nature of the questionnaires, either a single class or a combination was presented to the respondents.
10. Selection of Samples: There are two major factors, which underlie all sample design: the first is to avoid any bias in the selection process, and the second is to achieve maximum precision for a given resource. However, it was extremely important to collect at least statistically significant sample from each stratum. Considering limited resources available for the study it was not possible to collect statistically significant number of sample for each strata instead efforts were made to collect at least 30 sample from each strata to ensure a Normal distribution in responses. The sample sizes for different types of questionnaire surveys for the study are given in Table 5.2.
11. Task 6: Analysis of Impacts on Beneficiaries: The study conducted a comprehensive analytical assessment of the beneficiaries of the project. In order to collect data related to different direct and indirect impacts of the project, six questionnaire surveys were undertaken to assess impacts on beneficiaries by all four components of the project. A stratified random sampling technique was employed for the questionnaire surveys. In order to maintain normal distribution, sufficient number of samples from each stratum, i.e. at least 30 samples for each vehicle type were collected. This means in total 270 interviews were conducted in the study as shown in Table 5.1. In total 15 numbers of surveyors and 2 data entry and transcription personnel were employed for period of 6 weeks to conduct the questionnaire surveys and Transport Advisor of RTDA supervised and coordinated the study as the Team Leader.
12. Component 1- Paved Road Rehabilitation and Maintenance: Direct Impacts Related to Travel Characteristics: Direct impacts of the project on travel characteristics for different
35
types of drivers were collected in the questionnaire surveys related to travel characteristics using “Before and After” questionnaire approach. A brief description of the impacts for different vehicle types is given in the following section.
13. Impacts on Motorcycle Drivers/Passengers: The impacts of the project on Motorcycle drivers/users are shown in Table 5.3. It appears from the table that most the travel characteristics of the motorcycle drivers/passengers were improved in the positive direction due to implementation of the project. Starting from the ownership of motor vehicles, duration and length of trips have been increased after project but frequency of trips has been decreased. . This might be attributed to the fact that due to improvement of road condition motorcycle users can make relatively longer trips. However, motorcycle maintenance costs have increased. This might be due to inflation of price.
14. Impacts on Car Drivers/Passengers: The impacts of the project on Car drivers/users are shown in Table 5.4. It appears from the table that most the travel characteristics of the car drivers/passengers were improved in the positive direction due to implementation of the project. The car ownership and trip frequency have increased. On the other hand both trip time and length have decreased. All these are positive indicators of better travel characteristics after the implementation of the project. However, average fare per trip has increased probably due to inflation.
15. Impacts on Pick-up Drivers/Passengers: The impacts of the project on Pick-up drivers/users are demonstrated in Table 5.5. Most the travel characteristics of the pickup drivers/users were improved in the positive direction due to implementation of the project. It is evident from the table that for a pick-up driver/passenger all the indicators for travel characteristics like motor vehicle ownership, trip frequency, load per trip and number of working days in year, etc. have increased. Again, both average trip length and time have decreased considerably. All these demonstrated significant improvement of travel characteristics for a pick-up due to implementation of the project.
16. Impacts on Minibus Drivers/Passengers: The impacts of the project on Minibus drivers/users are shown in Table 5.6. It appears from the table that most the travel characteristics of the motorcycle drivers/users were improved in the positive direction due to implementation of the project. Key travel parameters like frequency of trip, duration of trip, trip per passenger and average working days in year all have increased. Again, travel time and number of working days lost due to bad weather have decreased. However fare charged and vehicle repair and maintenance costs have increased.
17. Impacts on Bus Drivers/Passengers: The impacts of the project on Bus drivers/passengers are shown in Table 5.7. It appears from the table that most the travel characteristics of the motorcycle drivers/users were improved in the positive direction due to implementation of the project. Key travel indicators like frequency of trip, duration of trip, trip per passenger and average working days in year all have increased. Again, travel time and number of working days lost due to bad weather have decreased significantly. Again fare charged, fuel consumption and vehicle repair and maintenance costs have also decreased indicating overall net positive benefits in almost all key trip parameters for bus drivers/passengers.
18. Impacts on 2-Axle Truck Drivers: The impacts of the project on 2-Axle Truck drivers are shown in Table 5.8. It appears from the table that most the travel characteristics of the 2-axle truck drivers/users were improved in the positive direction due to implementation of the project.

36
All key travel indicators like frequency of trips, load per trip, working hours have increased. Again, average trip length, trip time, days of work lost and fare all decreased due to implementation of the project.
19. Impacts on Trailer Truck Drivers: The impacts of the project on Trailer Truck drivers are shown in Table 5.9. It appears from the table that most the travel characteristics of the motorcycle drivers/users were improved in the positive direction due to implementation of the project. All key travel indicators like load per trip, working distance and working days in a year, etc. have increased after the project. Again both trip length and duration have increased. However, proportional change of trip time is only 5.4% in comparison to 31.6% increase of average trip lengths indicating average reduction of travel time per km.
20. Component 1- Indirect Impacts: Welfare Outcomes related to Income and Expenditure: Indirect impacts of the project on income and expenditure in the zone of influence are shown in Table 5.10 to 5.16. Although most the impacts were due to combined effects of overall socio-economic development of the region, some indirect impacts of the projects on income and expenditure cannot be overlooked.
21. Household Demographic Characteristics of Income & Expenditure Survey: It is evident from the survey that household demographic characteristics in the zone of influence of the project areas, such as family composition income have increased after the project as shown in Table 5.10.
22. Impacts on Agricultural Activities: It is evident from the Table 5.11 that all the key parameters related to utilization of land, outputs per hectare, use of fertilizers and other modern inputs, price of agricultural products, and advisory support agricultural activities have shown remarkable improvement after the implementation of the project.
23. Impacts on Non-agricultural Activities: Not only agricultural activities have shown improvements, all the key non-agricultural activities, such as, public storage facilities, ownership of non-agricultural enterprise and both on and off farm employment per household achieved significant improvement due to the project as demonstrated in Table 5.12.
24. Impacts on Income and Expenditure: Both income and expenditure per household have increased more than 100% after the project in comparison to the baseline data as shown in Table 5.13. This clearly demonstrated significant increase of overall wealth in the project area. Some of the additional prosperities were most likely to be due to the implementation of the project.
25. Impacts on Markets: It appears that due to improvement of road transport facilities in the project area distance to markets have decreased, number of trading activities, such as number sellers, number available products either bought or sold have increased significantly indicating positive impacts on markets (as shown in Table 5.14).
26. Impacts on Prices: It appears the Table 5.15 that due to improvement of road transport facilities in the project area both price of land and housing have increased significantly ranging from 95 to 250% providing indirect benefits of transport improvements to the people in the project areas. However, the price of traded commodities were also increased by 30% probably due to inflation.
27. Impacts on Opportunities for Credit and Employment: It appears the Table 5.16 that due to improvement of road transport facilities in the project area significant improvements in access to credit and employment opportunities have taken place in the range of 225 to 422%.

37
28. Component 1- Indirect Impacts: Welfare Outcomes related to Social Benefits: Indirect impacts of the project on social benefits in the zone of influence are shown in Tables 5.17 to 5.21. Although most the impacts were due to combined effects of overall socio-economic development of the region, some indirect impacts of the projects on social benefits were no doubt accrued due to implementation of the project.
29. It is evident from the survey that household demographic characteristics in the zone of influence of the project areas, such as family composition income have increased after the project as shown in Table 5.17.
30. It is evident from the Table 5.18 that all the key parameters for education developments, such as number of school, student enrollment rate, number of teachers and regular available supply for school have improved after implementation of the project. Again, drop-out rates for both male and female students have decreased significantly. All these clearly demonstrate overall indirect positive impacts of the project on development of education. It is evident from the Table 5.19 that due to improvement of road transport infrastructure both time use for firewood collection and tasks related to transport have decreased indicating positive indirect travel benefits of the project.
31. It is evident from the Table 5.20 that due to improvement of road transport infrastructure social interactions among the people in the project areas have increased significantly indicating positive indirect travel benefits of the project.
32. It is evident from the Table 5.21 that due to improvement of road transport infrastructure political among the people in the project areas have increased significantly. This clearly indicates positive indirect travel benefits of the project in promoting political participation among the general population.
33. Component 2- Sector Governance and Policy Support and Sector Analysis and Planning Support: Most of respondents were in the view that due to implementation of the TSDP, effectiveness and efficiency of public resources, capacity for planning, budgeting and financing have improved significantly as demonstrated in Tables 5.22 and 5.23. However, the respondents did not totally agree that TSDP had improved participation of private sectors and improve timely implementation of programs and projects as shown in Tables 5.24 and 5.25.
34. Component 3- - Capacity Building (MSc Program): Direct Impacts: Most of the students of the postgraduate training programs were in the view that the program was successful as shown from Tables 5.27 to 5.46. In regard to different components of the program, they opined that on balance overall courses were adequate, appropriate, and useful for practical life.
35. Component 3 and 4- Transport Planning and Monitoring System, Project and Program Management Support: Most of the respondents opined that TSDP was successful in ensuring better statistics for transport strategy and policy making, improving continuous M&E of road transport programs and projects, improving information sharing and effectiveness of M&E system and overall MIS for the road transport sector of Rwanda as demonstrated in Tables 5.47 to 5.51.
36. Task 8: Conclusions and Recommendations for Future Project: Key conclusions of the project are as follows:
i. It appears from the table that most the travel characteristics of all categories of motor vehicles in the zone of influence of the project areas including frequency of trips,

38
passenger/load carrying capacity were increased whereas travel times, number of days lost due to bad weather were decreased due to implementation of the project;
ii. All the key parameters related to agricultural activities such as utilization of land, outputs per hectare, use of fertilizers and other modern inputs, price of agricultural products, and advisory support agricultural activities have shown remarkable improvement after the implementation of the project;
iii. Not only agricultural activities have shown improvements, all the key non-agricultural activities, such as, public storage facilities, ownership of non-agricultural enterprise and both on and off farm employment per household achieved significant improvement due to the project;
iv. It appears that significant increase of overall wealth in the project area was occurred in the order of more than 100% after the implementation of the project;
v. Due to improvement of road transport facilities in the project area both price of land and housing have increased significantly ranging from 95 to 250% providing indirect benefits of transport improvements to the people in the project areas;
vi. Due to improvement of road transport facilities in the project area significant improvements in access to credit and employment opportunities have taken place in the range of 225 to 422%;
vii. All the key parameters for education developments, such as number of school, student enrollment rate, number of teachers and regular available supply for school have improved after implementation of the project. Again, drop-out rates for both male and female students have decreased significantly after the implementation of the project;
viii. Most of respondents were in the view that due to implementation of the TSDP, effectiveness and efficiency of public resources, capacity for planning, budgeting and financing have improved significantly;
ix. Majority of the respondents did not totally agree that TSDP had improved participation of private sectors and timely implementation of programs;
x. Most of the students of the postgraduate training programs were in the view that the program was successful. In regard to different components of the program, they opined that on balance overall courses were adequate, appropriate and useful for practical life; and
xi. Most of the respondents opined that TSDP was successful in ensuring better statistics for transport strategy and policy making, improving continuous M&E of road transport programs and projects, improving information sharing and effectiveness of M&E system and overall MIS for the road transport sector of Rwanda.
37. Recommendations for Future Project: Key recommendations for future the projects are as follows:
i. It is important to develop sustainable financing system for road maintenance management to reduce the backlog in maintenance and proper preservation of road network in Rwanda;

39
ii. It is recommended to continue human resources and institutional capacity development initiatives of TSDP so that transport sector of Rwanda could continue to improve building on the achievements of the project
Table 5.1: Sample Sizes for the Questionnaire Surveys
Table 5.2: Ranking Scale for the Questionnaire Surveys of the Study
Linguistic Likert Rating Scale
Strongly agree Extremely high 9
Agree Very high 8
Moderately agree High 7
Mildly agree Medium high 6
Undecided Medium 5
Mildly disagree Medium Low 4
Moderately disagree Low 3
Disagree Very Low 2
Strongly disagree Extremely low 1
Survey Type Number of Samples for Questionnaire Survey
Transport 99
Income and Expenditure 150
Social 150
Capacity Building: M&E 30
Capacity Building: MSc Program in Transport Studies 30
Sector Governance, policy and planning support 30

40
Table 5.3: Impacts on motorcycle drivers/passengers
Travel Attributes Before After % Change
Ownership of motor vehicles (by type and number) in household
0.26 0.37 40.0%
Ownership of bicycles in household (by number) 0.16 0.21 33.3%
Average number of trips taken outside village, for work purpose (per month)
39.06 31.50 -19.4%
Average number of trips taken outside village, for non-work purpose (per month)
3.32 3.37 1.6%
Average Trip Length (km) 3.90 4.58 17.3%
Average Trip Time (hour and minute) 10.27 10.20 -0.6%
Average Number of Passenger per Trip 0.83 1.00 20.0%
Average Frequency of trip per day 18.00 16.85 -6.4%
Average Fare for one-way trip (RWF per passenger) 818.75 915.00 11.8%
Average working hours per day (hour) 8.84 8.95 1.2%
Average working days in a year (day) 280.00 316.00 12.9%
Average tire consumption cost per year 254,333.33 49,625.00 -80.5%
Average repair and maintenance cost per year (excluding tires but including spare parts)
80,000.00 95,000.00 18.8%
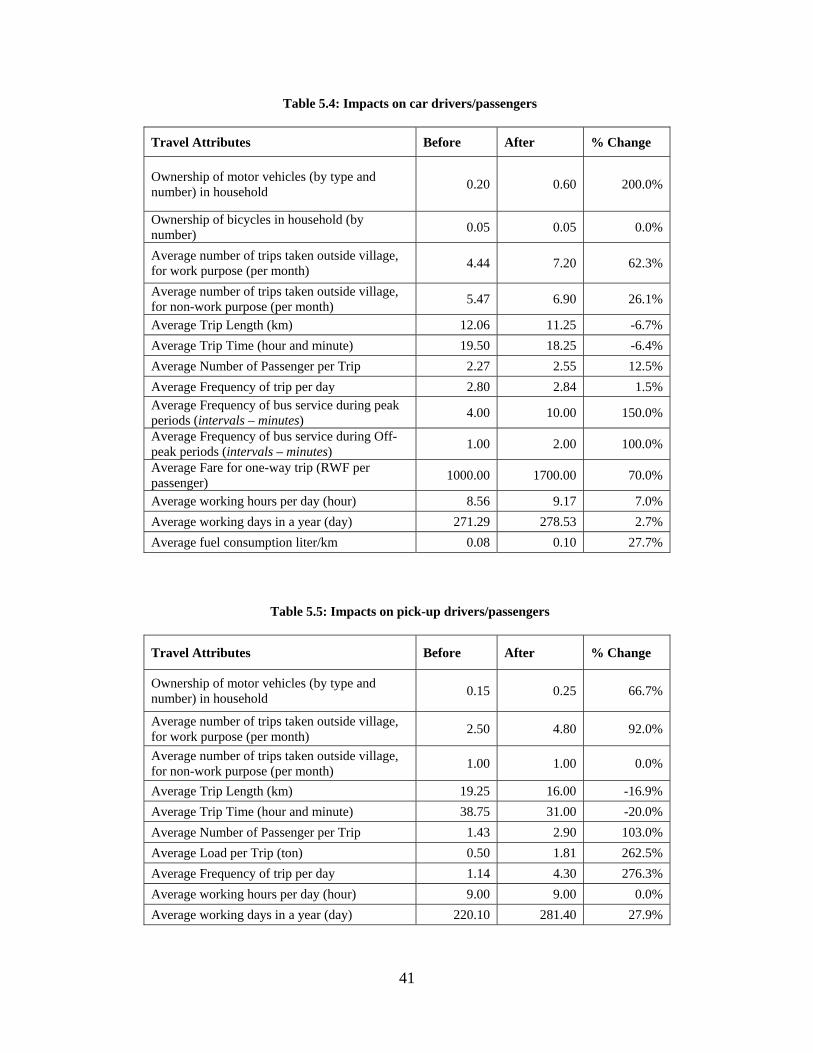
41
Table 5.4: Impacts on car drivers/passengers
Table 5.5: Impacts on pick-up drivers/passengers
Travel Attributes Before After % Change
Ownership of motor vehicles (by type and number) in household
0.15 0.25 66.7%
Average number of trips taken outside village, for work purpose (per month)
2.50 4.80 92.0%
Average number of trips taken outside village, for non-work purpose (per month)
1.00 1.00 0.0%
Average Trip Length (km) 19.25 16.00 -16.9%
Average Trip Time (hour and minute) 38.75 31.00 -20.0%
Average Number of Passenger per Trip 1.43 2.90 103.0%
Average Load per Trip (ton) 0.50 1.81 262.5%
Average Frequency of trip per day 1.14 4.30 276.3%
Average working hours per day (hour) 9.00 9.00 0.0%
Average working days in a year (day) 220.10 281.40 27.9%
Travel Attributes Before After % Change
Ownership of motor vehicles (by type and number) in household
0.20 0.60 200.0%
Ownership of bicycles in household (by number)
0.05 0.05 0.0%
Average number of trips taken outside village, for work purpose (per month)
4.44 7.20 62.3%
Average number of trips taken outside village, for non-work purpose (per month)
5.47 6.90 26.1%
Average Trip Length (km) 12.06 11.25 -6.7%
Average Trip Time (hour and minute) 19.50 18.25 -6.4%
Average Number of Passenger per Trip 2.27 2.55 12.5%
Average Frequency of trip per day 2.80 2.84 1.5% Average Frequency of bus service during peak periods (intervals – minutes)
4.00 10.00 150.0%
Average Frequency of bus service during Off-peak periods (intervals – minutes)
1.00 2.00 100.0%
Average Fare for one-way trip (RWF per passenger)
1000.00 1700.00 70.0%
Average working hours per day (hour) 8.56 9.17 7.0%
Average working days in a year (day) 271.29 278.53 2.7%
Average fuel consumption liter/km 0.08 0.10 27.7%

42
Table 5.6: Impacts on minibus drivers/passengers
Travel Attributes Before After % Change
Ownership of motor vehicles (by type and number) in household
0.30 0.50 66.7%
Ownership of bicycles in household (by number) 0.10 0.00 -100.0%
Average number of trips taken outside village, for work purpose (per month)
3.40 10.70 214.7%
Average Trip Length (km) 29.71 42.30 42.4%
Average Trip Time (hour and minute) 60.80 53.75 -11.6%
Average Number of Passenger per Trip 6.00 9.22 53.7%
Average Load per Trip (ton) 1.00 0.43 -57.1%
Average Frequency of trip per day 1.08 2.64 145.4%
Average Frequency of bus service during peak periods (intervals – minutes)
32.92 13.77 -58.2%
Average Frequency of bus service during Off-peak periods (intervals – minutes)
32.54 12.36 -62.0%
Average Fare for one-way trip (RWF per passenger)
396.88 631.11 59.0%
Average charge for one-way trip (RWF per ton of goods)
312.50 0.00 -100.0%
Average working hours per day (hour) 6.20 11.07 78.5%
Average working distance per day (km) 37.71 82.30 118.2%
Average number of days lost in year due to bad road or weather condition
3.38 1.43 -57.8%
Average working days in a year (day) 117.44 277.71 136.5%
Average fuel consumption liter/km 0.05 0.12 135.0%
Average fuel lubricant cost per month 284,700.00 185,800.00 -34.7%
Average tire consumption cost per year 287,500.00 801,500.00 178.8%
Average repair and maintenance cost per year (excluding tires but including spare parts)
176,000.00 560,500.00 218.5%

43
Table 5.7: Impacts on bus drivers/passengers
Travel Attributes Before After % Change
Average number of trips taken outside village, for work purpose (per month)
2.80 4.80 71.4%
Average Trip Length (km) 89.00 89.00 0.0%
Average Trip Time (hour and minute) 100.00 86.60 -13.4%
Average Number of Passenger per Trip 26.20 26.20 0.0%
Average Load per Trip (ton) 2.00 2.75 37.5%
Average Frequency of trip per day 2.50 4.50 80.0%
Average Frequency of bus service during peak periods (intervals – minutes)
3.00 5.67 88.9%
Average Frequency of bus service during Off-peak periods (intervals – minutes)
1.00 2.00 100.0%
Average Fare for one-way trip (RWF per passenger) 2,175.00 1,700.00 -21.8%
Average working hours per day (hour) 6.20 9.20 48.4%
Average working distance per day (km) 389.67 581.00 49.1%
Average number of days lost in year due to bad road or weather condition
7.25 0.00 -100.0%
Average working days in a year (day) 256.00 308.00 20.3%
Average fuel consumption liter/km 0.18 0.13 -29.9%
Average fuel lubricant cost per month 764,154.00 994,842.00 30.2%
Average tire consumption cost per year 787,500.00 1,542,000.00 95.8%
Average repair and maintenance cost per year (excluding tires but including spare parts)
776,666.67 630,000.00 -18.9%

44
Table 5.8: Impacts on 2-axle truck drivers
Travel Attributes Before After % Change
Ownership of motor vehicles (by type and number) in household
0.15 0.15 0.0%
Ownership of bicycles in household (by number)
0.10 0.05 -50.0%
Average number of trips taken outside village, for work purpose (per month)
2.36 2.55 7.9%
Average Trip Length (km) 34.58 25.70 -25.7%
Average Trip Time (hour and minute) 69.38 57.60 -17.0%
Average Number of Passenger per Trip 2.50 2.50 0.0%
Average Load per Trip (ton) 1.50 1.61 7.4%
Average Frequency of trip per day 2.36 2.45 3.7% Average charge for one-way trip (RWF per ton of goods)
33,750.00 24,500.00 -27.4%
Average working hours per day (hour) 8.13 8.50 4.6%
Average working days in a year (day) 291.82 295.40 1.2%
Table 5.9: Impacts on trailer truck drivers
Travel Attributes Before After % Change
Average Trip Length (km) 105.25 138.55 31.6%
Average Trip Time (hour and minute) 216.95 228.70 5.4%
Average Load per Trip (ton) 33.75 46.35 37.3%
Average Frequency of trip per day 1.00 1.00 0.0% Average charge for one-way trip (RWF per ton of goods)
9,575.00 8,150.00 -14.9%
Average working hours per day (hour) 6.65 8.80 32.3%
Average working distance per day (km) 119.95 143.40 19.5%
Average number of days lost in year due to bad road or weather condition
49.30 9.85 -80.0%
Average working days in a year (day) 143.70 177.60 23.6%
Average fuel consumption liter/km 0.38 5.82 1434.4%
Average fuel lubricant cost per month 455,500.00 391,860.00 -14.0%
Average tire consumption cost per year 1,167,250.00 979,800.00 -16.1%
Average repair and maintenance cost per year (excluding tires but including spare parts)
314,350.00 238,250.00 -24.2%

45
Table 5.10: Household demographic characteristics
Income and Expenditure Variables Before After % Change
No of Adults (above 16 years in the household) 2.30 3.07 33.3%
No of Dependent below 16 years in the household 1.27 1.71 35.3%
Number of Male in household 1.91 2.35 23.1%
Number of Female in household 2.08 2.57 23.7%
Number of earning members in household 1.80 2.30 27.8%
Table 5.11: Impacts on agricultural activities Variables Before After % Change
Land devoted to different crops in hectare (decimal) 0.63 0.84 32.8%
Produced quantities of crops (kg) per year 189.30 323.30 70.8%
Output of key crops per unit of cultivated land (kg/hectare) decimal
109.61 180.89 65.0%
Amount of harvest sold in markets (kg) per year 167.20 304.13 81.9%
Price of harvest sold in markets (RWF) per year 53,446.31 120,285.23 125.1%
Use of fertilizers (Y or N) 45.00 123.00 173.3%
Use of herbicides (Y or N) 23.00 69.00 200.0%
Use of pesticides (Y or N) 23.00 69.00 200.0%
Use of improved seeds (Y or N) 30.00 58.00 93.3%
Use of farm equipment (tractors, machines) (Y or N) 22.00 39.00 77.3%
Average Farm-gate prices of the key crop (RWF/ kg) 77.10 119.63 55.2%
Local market price of the key crop (RWF/ kg) 179.76 239.09 33.0%
Unit price of farm inputs (RWF/ kg) 46.31 99.16 114.1%
Number of people (household members, others) working on farm
36.54 63.83 74.7%
Agricultural day wage (RWF) 287.13 503.15 75.2% Number of yearly visits of agricultural extension agent
0.61 1.83 198.9%
Livestock ownership (No of Cattle) 0.73 1.26 71.8%
Number of Goat/Ship 0.20 0.64 220.0%
Table 5.12: Impacts on non-agricultural activities Variables Before After % Change
Number of public storages in village 0.37 2.21 495.6%
Ownership of non-agricultural household enterprise (Number)
0.34 0.87 154.9%
Number of days worked outside farm (per month) 6.63 10.37 56.4%
Number of On-Farm Employment in the household 1.91 2.98 56.3%
Number of Off-Farm Employment in the household 0.49 1.23 150.0%

46
Table 5.13: Impacts on income and expenditure
Variables Before After % Change
Total household income (RWF per month) 27,546.33 56,335.33 104.5%
Total household expenditure (RWF per month) 18,842.00 41,041.33 117.8%
Table 5.14: Impacts on markets Variables Before After % Change
Distance to market 4.36 2.44 -44.0%
Number of sellers/shops in nearest market 146.81 4,050.63 2659.1%
Number of products available at market 14.71 19.19 30.4%
Number of visits per month to market as consumer and products bought
3.68 11.83 220.9%
Number of visits per month to market as consumer and products sold
2.28 5.29 132.2%
Table 5.15: Impacts on prices Variables Before After % Change Average price of the key traded commodity (RWF/kg)
227.73 296.67 30.3%
Price of land (RWF/hectare) 516,800.00 1,812,666.67 250.7%
Price of housing (RWF/sqm) 1,288,533.33 2,519,000.00 95.5%
Table 5.16: Impacts on opportunities for credit and employment
Variables Before After % Change
Access to credit (Y or N) 9.00 47.00 422.2%
Number of persons/days of employment (per month) generated by road construction & maintenance
0.11 0.35 225.0%
Table 5.17: Household demographic characteristics Variables Before After
% Change
No of Adults (above 16 years in the household) 2.401 3.211 33.7% No of Dependent below 16 years in the household
1.243 1.599 28.6%
Number of Male in household 2.046 2.434 19.0%
Number of Female in household 2.145 2.586 20.6%
Number of earning members in household 2.099 2.724 29.8%

47
Table 5.18: Parameters for education developments Variables Before After
% Change
Number of primary schools in village 0.243 0.276 13.5%
Primary school enrollment rate (Male) 0.128 0.131 2.7%
Primary school enrollment rate (Female) 0.131 0.141 7.8%
Secondary school enrollment rate (Male) 0.081 0.082 1.4%
Secondary school enrollment rate (Female) 0.079 0.082 3.7%
Primary school drop-out rate (Male) 0.004 0.003 -20.5%
Primary school drop-out rate (Female) 0.005 0.004 -18.1%
Distance to nearest primary school (km) 2.096 2.096 0.0%
Distance to nearest secondary school (km) 3.040 3.040 0.0%
Average number of teachers with graduation degree per primary school
1.625 1.842 13.4%
Average number of teachers with graduation degree per secondary school
1.651 2.138 29.5%
Regular availability of school supplies (Y or N) 29 51 75.9%
Table 5.19: Time use for firewood collection and tasks related to transport Variables Before After
% Change
Time spent on firewood collection (hour and minute)
37.987 37.763 -0.6%
Time spend on other transport tasks (hour and minute)
77.534 66.554 -14.2%
Table 5.20: Social Interactions among people Variables Before After % Change Number of visits to nearest city/village per month
2.055 2.660 29.5%
Number of visits received from friends or relatives in other villages or cities per month
1.771 2.685 51.6%
Households receiving remittances (Y or N) 7 90 1185.7%
Attendance at social events (funeral, wedding, festival) not in village (number per month)
1.034 1.508 45.8%

48
Table 5.21: Political Activities among people
Variables Before After % Change
Attendance at public meetings not in village (number per year)
2.105 2.454 16.6%
Number of visits to village by government officials per year
1.671 2.007 20.1%
Use of court/police (number per year) 0.302 0.403 33.3%
Number of Membership in community or political organizations
0.579 0.822 42.0%
Number of government programs accessed per year
0.993 1.530 54.0%
Involvement of community in road maintenance (days per month)
0.526 0.546 3.8%
Table 5.22: Sector Governance Improvement: Q1. Do think effectiveness and efficiency of use of public resources have
improved after implementation of Transport Sector Development Project of Rwanda under WB funding?
Linguistic Likert Scale
Ranking No of Respondents
% Respondents
Strongly agree 1 0 0.0%
Agree 2 7 23.3%
Moderately agree 3 5 16.7%
Mildly agree 4 12 40.0%
Undecided 5 3 10.0%
Mildly disagree 6 3 10.0%
Moderately disagree 7 0 0.0%
Disagree 8 0 0.0%
Strongly disagree 9 0 0.0%
Total 30 100.0%

49
Table 5.23: Sector Governance Improvement: Q2. Improving capacity for planning, budgeting and financing have become
evident after implementation of Transport Sector Development Project of Rwanda under WB funding?
Linguistic Likert Scale
Ranking No of Respondents
% Respondents
Strongly agree 1 0 0.0%
Agree 2 0 0.0%
Moderately agree 3 7 23.3%
Mildly agree 4 16 53.3%
Undecided 5 7 23.3%
Mildly disagree 6 0 0.0%
Moderately disagree 7 0 0.0%
Disagree 8 0 0.0%
Strongly disagree 9 0 0.0%
Total 30 100.0%
Table 5.24: Sector Governance Improvement: Q3. The role of the Private Sector has strengthen after
implementation of Transport Sector Development Project of Rwanda under WB funding?
Linguistic Likert Scale
Ranking No of Respondents
% Respondents
Strongly agree 1 0 0.0%
Agree 2 4 13.3%
Moderately agree
3 0
0.0%
Mildly agree 4 7 23.3%
Undecided 5 7 23.3%
Mildly disagree 6 12 40.0%
Moderately disagree
7 0
0.0%
Disagree 8 0 0.0%
Strongly disagree
9 0
0.0%
Total 30 100.0%
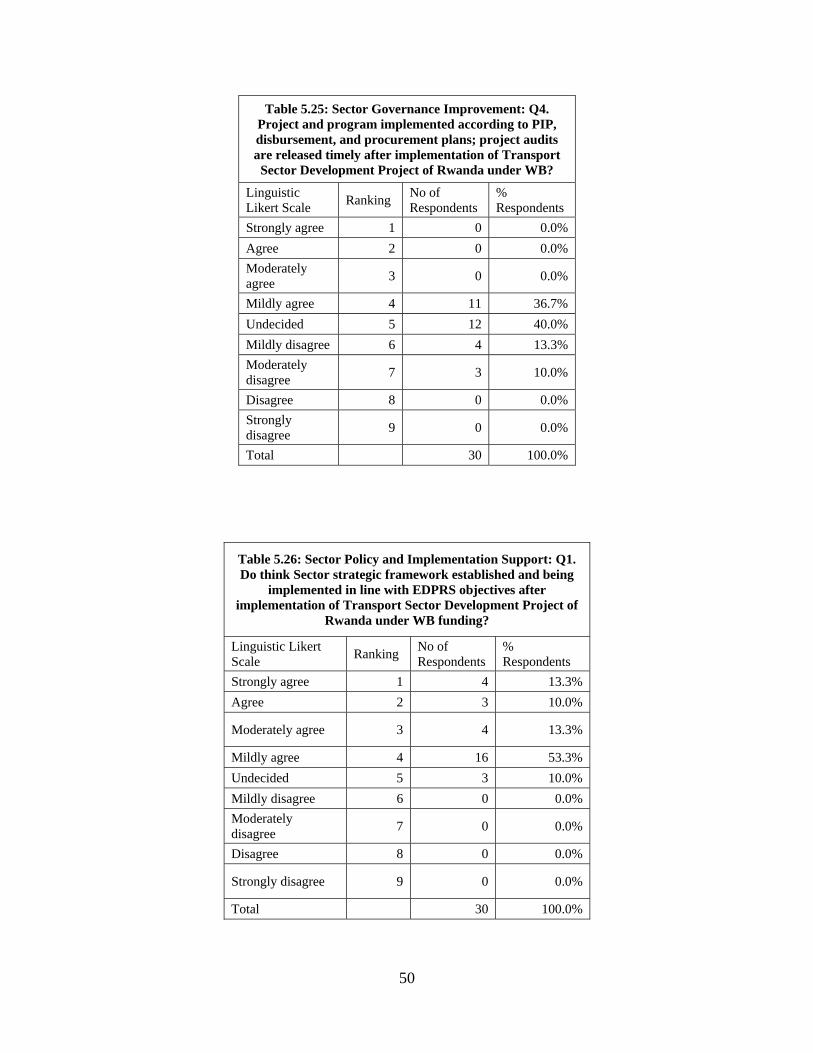
50
Table 5.25: Sector Governance Improvement: Q4. Project and program implemented according to PIP, disbursement, and procurement plans; project audits are released timely after implementation of Transport
Sector Development Project of Rwanda under WB?
Linguistic Likert Scale
Ranking No of Respondents
% Respondents
Strongly agree 1 0 0.0%
Agree 2 0 0.0%
Moderately agree
3 0 0.0%
Mildly agree 4 11 36.7%
Undecided 5 12 40.0%
Mildly disagree 6 4 13.3%
Moderately disagree
7 3 10.0%
Disagree 8 0 0.0%
Strongly disagree
9 0 0.0%
Total 30 100.0%
Table 5.26: Sector Policy and Implementation Support: Q1. Do think Sector strategic framework established and being
implemented in line with EDPRS objectives after implementation of Transport Sector Development Project of
Rwanda under WB funding?
Linguistic Likert Scale
Ranking No of Respondents
% Respondents
Strongly agree 1 4 13.3%
Agree 2 3 10.0%
Moderately agree 3 4 13.3%
Mildly agree 4 16 53.3%
Undecided 5 3 10.0%
Mildly disagree 6 0 0.0%
Moderately disagree
7 0 0.0%
Disagree 8 0 0.0%
Strongly disagree 9 0 0.0%
Total 30 100.0%
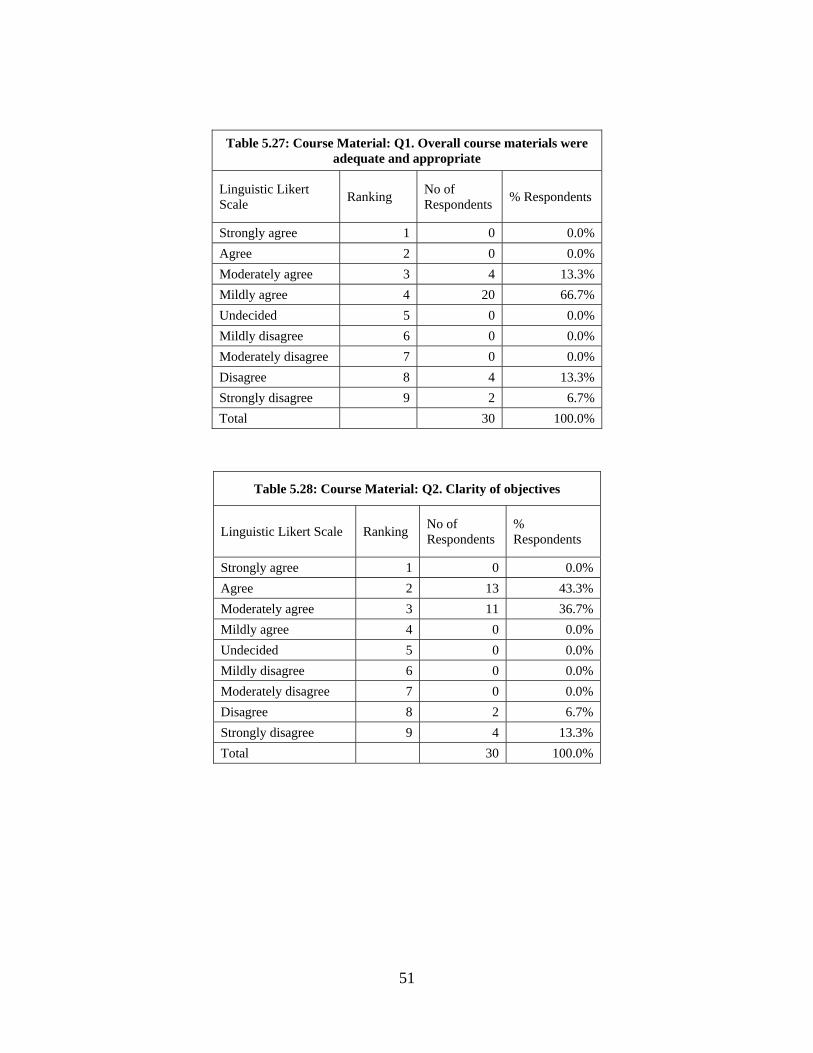
51
Table 5.27: Course Material: Q1. Overall course materials were adequate and appropriate
Linguistic Likert Scale
Ranking No of Respondents
% Respondents
Strongly agree 1 0 0.0%
Agree 2 0 0.0%
Moderately agree 3 4 13.3%
Mildly agree 4 20 66.7%
Undecided 5 0 0.0%
Mildly disagree 6 0 0.0%
Moderately disagree 7 0 0.0%
Disagree 8 4 13.3%
Strongly disagree 9 2 6.7%
Total 30 100.0%
Table 5.28: Course Material: Q2. Clarity of objectives
Linguistic Likert Scale Ranking No of Respondents
% Respondents
Strongly agree 1 0 0.0%
Agree 2 13 43.3%
Moderately agree 3 11 36.7%
Mildly agree 4 0 0.0%
Undecided 5 0 0.0%
Mildly disagree 6 0 0.0%
Moderately disagree 7 0 0.0%
Disagree 8 2 6.7%
Strongly disagree 9 4 13.3%
Total 30 100.0%

52
Table 5.29: Course Material: Q3. Explanation and Contents
Linguistic Likert Scale Ranking No of Respondents
% Respondents
Strongly agree 1 0 0.0%
Agree 2 4 13.3%
Moderately agree 3 0 0.0%
Mildly agree 4 20 66.7%
Undecided 5 0 0.0%
Mildly disagree 6 0 0.0%
Moderately disagree 7 0 0.0%
Disagree 8 0 0.0%
Strongly disagree 9 6 20.0%
Total 30 100.0%
Table 5.30: Course Material: Q4. Presentation and Comprehension
Linguistic Likert Scale Ranking No of |Respondents
% Respondents
Strongly agree 1 0 0.0%
Agree 2 2 6.7%
Moderately agree 3 13 43.3%
Mildly agree 4 9 30.0%
Undecided 5 0 0.0%
Mildly disagree 6 0 0.0%
Moderately disagree 7 0 0.0%
Disagree 8 0 0.0%
Strongly disagree 9 6 20.0%
Total 30 100.0%

53
Table 5.31: Instructors: Q1. Were all of the topics covered by your instructors?
linguistic Likert Scale
Ranking No of Respondents
% Respondents
Strongly agree 1 0 0.0%
Agree 2 0 0.0%
Moderately agree 3 2 6.7%
Mildly agree 4 11 36.7%
Undecided 5 11 36.7%
Mildly disagree 6 0 0.0%
Moderately disagree 7 0 0.0%
Disagree 8 4 13.3%
Strongly disagree 9 2 6.7%
30 100.0%
Table 5.32: Instructors: Q2.Were the instructions clear?
linguistic Likert Scale Ranking No of Respondents
% Respondents
Strongly agree 1 4 13.3%
Agree 2 0 0.0%
Moderately agree 3 20 66.7%
Mildly agree 4 2 6.7%
Undecided 5 0 0.0%
Mildly disagree 6 0 0.0%
Moderately disagree 7 0 0.0%
Disagree 8 2 6.7%
Strongly disagree 9 2 6.7%
30 100.0%

54
Table 5.33: Instructors: Q3. Did you find your classes interesting?
linguistic Likert Scale Ranking No of Respondents
% Respondents
Strongly agree 1 6 20.0%
Agree 2 2 6.7%
Moderately agree 3 0 0.0%
Mildly agree 4 20 66.7%
Undecided 5 0 0.0%
Mildly disagree 6 0 0.0%
Moderately disagree 7 0 0.0%
Disagree 8 2 6.7%
Strongly disagree 9 0 0.0%
30 100.0%
Table 5.34: Instructors: Q4. Did your instructors answered your queries?
linguistic Likert Scale Ranking No of Respondents
% Respondents
Strongly agree 1 2 6.7%
Agree 2 8 26.7%
Moderately agree 3 11 36.7%
Mildly agree 4 9 30.0%
Undecided 5 0 0.0%
Mildly disagree 6 0 0.0%
Moderately disagree 7 0 0.0%
Disagree 8 0 0.0%
Strongly disagree 9 0 0.0%
30 100.0%
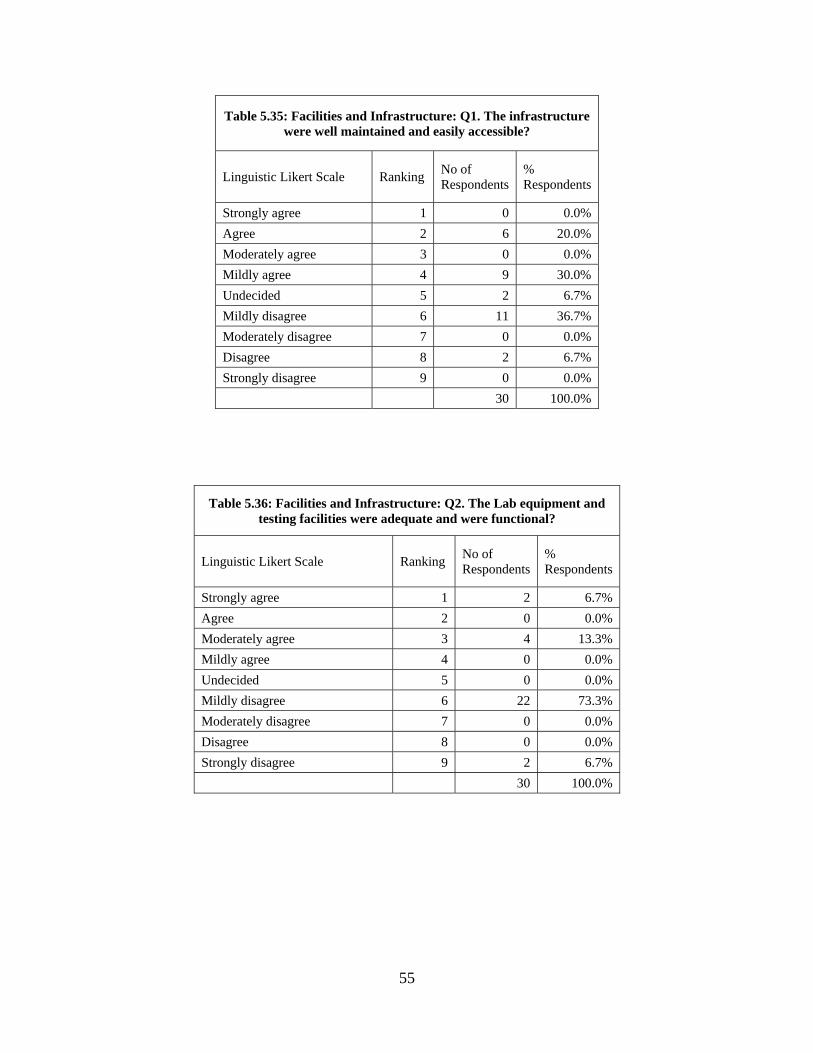
55
Table 5.35: Facilities and Infrastructure: Q1. The infrastructure were well maintained and easily accessible?
Linguistic Likert Scale Ranking No of Respondents
% Respondents
Strongly agree 1 0 0.0%
Agree 2 6 20.0%
Moderately agree 3 0 0.0%
Mildly agree 4 9 30.0%
Undecided 5 2 6.7%
Mildly disagree 6 11 36.7%
Moderately disagree 7 0 0.0%
Disagree 8 2 6.7%
Strongly disagree 9 0 0.0%
30 100.0%
Table 5.36: Facilities and Infrastructure: Q2. The Lab equipment and testing facilities were adequate and were functional?
Linguistic Likert Scale Ranking No of Respondents
% Respondents
Strongly agree 1 2 6.7%
Agree 2 0 0.0%
Moderately agree 3 4 13.3%
Mildly agree 4 0 0.0%
Undecided 5 0 0.0%
Mildly disagree 6 22 73.3%
Moderately disagree 7 0 0.0%
Disagree 8 0 0.0%
Strongly disagree 9 2 6.7%
30 100.0%
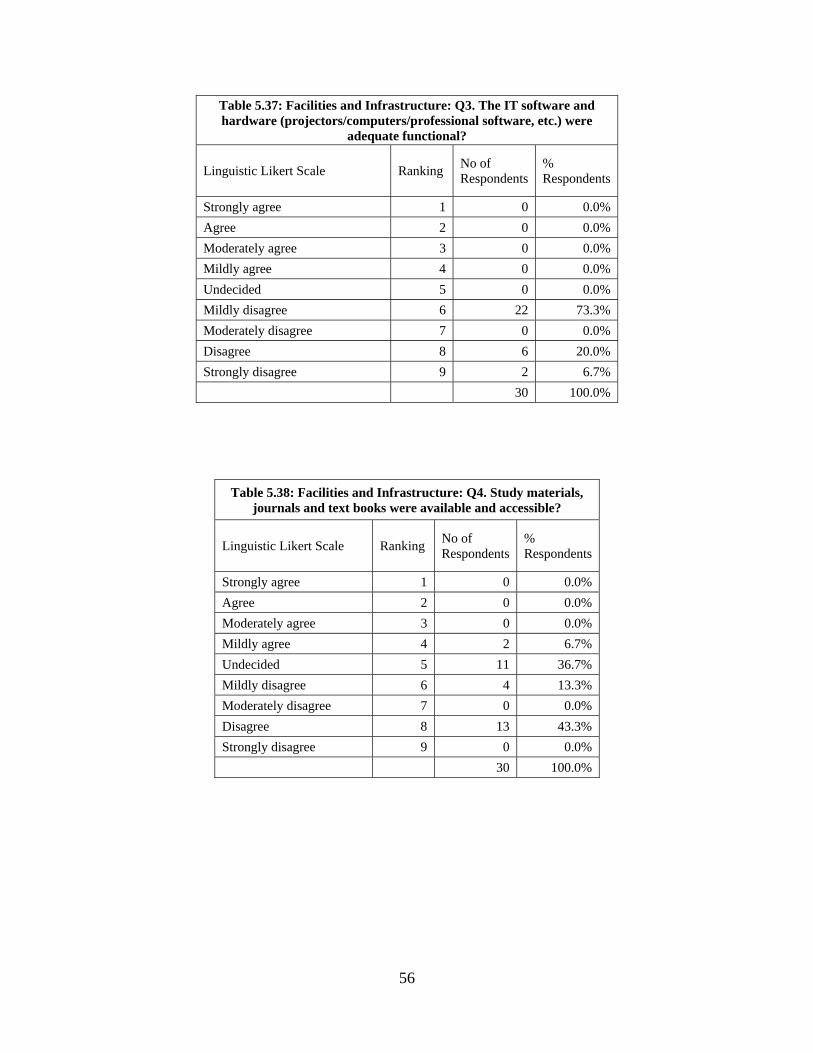
56
Table 5.37: Facilities and Infrastructure: Q3. The IT software and hardware (projectors/computers/professional software, etc.) were
adequate functional?
Linguistic Likert Scale Ranking No of Respondents
% Respondents
Strongly agree 1 0 0.0%
Agree 2 0 0.0%
Moderately agree 3 0 0.0%
Mildly agree 4 0 0.0%
Undecided 5 0 0.0%
Mildly disagree 6 22 73.3%
Moderately disagree 7 0 0.0%
Disagree 8 6 20.0%
Strongly disagree 9 2 6.7%
30 100.0%
Table 5.38: Facilities and Infrastructure: Q4. Study materials, journals and text books were available and accessible?
Linguistic Likert Scale Ranking No of Respondents
% Respondents
Strongly agree 1 0 0.0%
Agree 2 0 0.0%
Moderately agree 3 0 0.0%
Mildly agree 4 2 6.7%
Undecided 5 11 36.7%
Mildly disagree 6 4 13.3%
Moderately disagree 7 0 0.0%
Disagree 8 13 43.3%
Strongly disagree 9 0 0.0%
30 100.0%

57
Table 5.39: Usefulness of the Training Program: Q1. Did this program meet your expectations?
Linguistic Likert Scale Ranking No of Respondents
% Respondents
Strongly agree 1 0 0.0%
Agree 2 0 0.0%
Moderately agree 3 2 6.7%
Mildly agree 4 21 70.0%
Undecided 5 0 0.0%
Mildly disagree 6 0 0.0%
Moderately disagree 7 0 0.0%
Disagree 8 7 23.3%
Strongly disagree 9 0 0.0%
30 100.0%
Table 5.40: Usefulness of the Training Program: Q2. Is it relevant to your profession?
Linguistic Likert Scale Ranking No of Respondents
% Respondents
Strongly agree 1 2 6.7%
Agree 2 0 0.0%
Moderately agree 3 0 0.0%
Mildly agree 4 22 73.3%
Undecided 5 0 0.0%
Mildly disagree 6 0 0.0%
Moderately disagree 7 0 0.0%
Disagree 8 6 20.0%
Strongly disagree 9 0 0.0%
30 100.0%

58
Table 5.41: Usefulness of the Training Program: Q3. Is it appropriate to meet the needs of the transport sector Rwanda?
Linguistic Likert Scale Ranking No of Respondents
% Respondents
Strongly agree 1 2 6.7%
Agree 2 11 36.7%
Moderately agree 3 2 6.7%
Mildly agree 4 9 30.0%
Undecided 5 0 0.0%
Mildly disagree 6 0 0.0%
Moderately disagree 7 0 0.0%
Disagree 8 6 20.0%
Strongly disagree 9 0 0.0%
30 100.0%
Table 5.42: Usefulness of the Training Program: Q4. Did the program ensure adequate balance between taught courses and research projects?
Linguistic Likert Scale Ranking No of Respondents
% Respondents
Strongly agree 1 0 0.0%
Agree 2 2 6.7%
Moderately agree 3 22 73.3%
Mildly agree 4 0 0.0%
Undecided 5 0 0.0%
Mildly disagree 6 0 0.0%
Moderately disagree 7 0 0.0%
Disagree 8 4 13.3%
Strongly disagree 9 2 6.7%
30 100.0%

59
Table 5.43: Skill Acquisition and Knowledge Gain: Q1. Knowledge and Understanding of Road/transport engineering, economics and
management?
Linguistic Likert Scale Ranking No of Respondents
% Respondents
Strongly agree 1 0 0.0%
Agree 2 0 0.0%
Moderately agree 3 24 80.0%
Mildly agree 4 0 0.0%
Undecided 5 0 0.0%
Mildly disagree 6 0 0.0%
Moderately disagree 7 0 0.0%
Disagree 8 4 13.3%
Strongly disagree 9 2 6.7%
30 100.0%
Table 5.44: Skill Acquisition and Knowledge Gain: Q2.Cognitive/Intellectual Skills/Application of Knowledge in the
discipline?
Linguistic Likert Scale Ranking No of Respondents
% Respondents
Strongly agree 1 5 16.7%
Agree 2 1 3.3%
Moderately agree 3 24 80.0%
Mildly agree 4 0 0.0%
Undecided 5 0 0.0%
Mildly disagree 6 0 0.0%
Moderately disagree 7 0 0.0%
Disagree 8 0 0.0%
Strongly disagree 9 0 0.0%
30 100.0%

60
Table 5.45: Skill Acquisition and Knowledge Gain: Q3.Communication/ICT/Numeracy/Analytic Techniques/Practical Skills related to road/transport development planning, modeling,
construction, maintenance and management?
Linguistic Likert Scale Ranking No of Respondents
% Respondents
Strongly agree 1 4 13.3%
Agree 2 2 6.7%
Moderately agree 3 0 0.0%
Mildly agree 4 15 50.0%
Undecided 5 9 30.0%
Mildly disagree 6 0 0.0%
Moderately disagree 7 0 0.0%
Disagree 8 0 0.0%
Strongly disagree 9 0 0.0%
30 100.0%
Table 5.46: Skill Acquisition and Knowledge Gain: Q4. General transferable skills in the relevant field?
Linguistic Likert Scale Ranking No of Respondents
% Respondents
Strongly agree 1 3 10.0%
Agree 2 3 10.0%
Moderately agree 3 4 13.3%
Mildly agree 4 11 36.7%
Undecided 5 9 30.0%
Mildly disagree 6 0 0.0%
Moderately disagree 7 0 0.0%
Disagree 8 0 0.0%
Strongly disagree 9 0 0.0%
30 100.0%

61
Table 5.47: Transport Planning and Monitoring System: Q1. Are statistics for Transport /Strategy policy making and updating better after
implementation of Transport Sector Development Project of Rwanda under WB funding?
Linguistic Likert Scale Ranking No of Respondents
% Respondents
Strongly agree 1 0 0.0%
Agree 2 0 0.0%
Moderately agree 3 7 23.3%
Mildly agree 4 20 66.7%
Undecided 5 3 10.0%
Mildly disagree 6 0 0.0%
Moderately disagree 7 0 0.0%
Disagree 8 0 0.0%
Strongly disagree 9 0 0.0%
Total 30 100.0%
Table 5.48: Transport Planning and Monitoring System: Q2. Continuous monitoring and evaluation of the both financial and physical progress of
different programs with respect to key indicators improve after implementation of Transport Sector Development Project of Rwanda under
WB funding?
Linguistic Likert Scale Ranking No of Respondents
% Respondents
Strongly agree 1 0 0.0%
Agree 2 0 0.0%
Moderately agree 3 11 36.7%
Mildly agree 4 18 60.0%
Undecided 5 0 0.0%
Mildly disagree 6 1 3.3%
Moderately disagree 7 0 0.0%
Disagree 8 0 0.0%
Strongly disagree 9 0 0.0%
Total 30 100.0%

62
Table 5.49: Transport Planning and Monitoring System: Q3.Did various information for different users of Transport improve
after implementation of Transport Sector Development Project of Rwanda under WB funding?
Linguistic Likert Scale Ranking No of Respondents
% Respondents
Strongly agree 1 0 0.0%
Agree 2 0 0.0%
Moderately agree 3 7 23.3%
Mildly agree 4 20 66.7%
Undecided 5 3 10.0%
Mildly disagree 6 0 0.0%
Moderately disagree 7 0 0.0%
Disagree 8 0 0.0%
Strongly disagree 9 0 0.0%
Total 30 100.0%
Table 5.50: Transport Planning and Monitoring System: Q4. Effectiveness the M&E system much better after implementation of Transport Sector
Development Project of Rwanda under WB funding?
Linguistic Likert Scale Ranking No of Respondents
% Respondents
Strongly agree 1 0 0.0%
Agree 2 0 0.0%
Moderately agree 3 9 30.0%
Mildly agree 4 8 26.7%
Undecided 5 12 40.0%
Mildly disagree 6 1 3.3%
Moderately disagree 7 0 0.0%
Disagree 8 0 0.0%
Strongly disagree 9 0 0.0%
Total 30 100.0%

63
Table 5.51: Transport Planning and Monitoring System: Q5. Is Management Information System (MIS) in Transport sector much better
after implementation of Transport Sector Development Project of Rwanda under WB funding?
Linguistic Likert Scale Ranking No of Respondents
% Respondents
Strongly agree 1 0 0.0%
Agree 2 0 0.0%
Moderately agree 3 11 36.7%
Mildly agree 4 12 40.0%
Undecided 5 4 13.3%
Mildly disagree 6 2 6.7%
Moderately disagree 7 0 0.0%
Disagree 8 1 3.3%
Strongly disagree 9 0 0.0%
Total 30 100.0%

64
Annex 6. Stakeholder Workshop Report and Results
N/A

65
Annex 7. Summary of Borrower’s ICR and/or Comments on Draft ICR Introduction 1. In 2002, Rwanda was still in process of recovery from the invaluable damage to the social and economic fabric of the county by 1994 genocide and civil war. The Poverty Reduction Strategy Paper (PRSP) was completed in June 2002 after extensive consultations with civil society, is based on six strategic pillars: (i) rural development and agricultural transformation, (ii) human development, (iii) economic infrastructure, (iv) good governance, (v) private sector development, and (vi) institutional capacity building. By 2003 Rwanda’s domestic political situation was largely stabilized, and substantial progress was made toward rebuilding the institutions of an effective state, including through the adoption of a new constitution in May 2003, followed by a presidential election and legislative polls in the same.
2. At project appraisal in 2007, the poor state of infrastructure still remained a major barrier to Rwanda’s economic growth as it reduces competitiveness of exports and discourages investment. The government’s priority was not only to address the particular consequences of genocide and war but also to tackle longer term structural difficulties evident in the pre-war economy, particularly due to the pressure of population growth in a relatively small country with an economy primarily dependent on agrarian activity. During this time period, Rwanda also faced a key challenge in achieving its growth targets. Indications are that GDP growth is slowing to pre-1994 levels. Real GDP growth, which stood at 7 percent on average over 1995-2003, rose only by 4.2 percent over 2004-2005. In addition, an update of the growth simulations under the PRSP indicate that growth would need to be around 10 to 12 percent of GDP (compared to the previous estimate of 7 to 8 percent) for Rwanda to achieve middle-income country status by 2015.
3. At the time of appraisal, Rwanda’s transport costs were as high as 40% of the export import values. This attributed to long distance, i.e. about 1,600 km from the nearest sea port, Rwanda’s transport costs represent as high as 40 percent of export and import values. The average journey times via both Northern and Central corridors to seaports were affected by long processing times at the port due to inefficient terminal handling procedures, onerous transit preparations owing to Customs transit transport requirements, and poor truck access and egress at the terminal, followed by slow transit on the road as a result of compulsory stops at many weighbridge stations, numerous random police road checks and cumbersome border crossings resulting in long queues, including burdensome Customs bond cancellation procedures. These factors exacerbated the resources consumed (capital cost, driver and assistant, license, fuel, tires, repair and maintenance, truck, etc.) in providing the truck services due to the time to deliver a load to the destination. Furthermore, on the return trip the truck was frequently faced with empty backhauls due to trade imbalances (Rwanda imports exceed exports by a factor of 11 in terms of weight) and as a result the head haul was often required to bear the full cost burden of the round trip. For these reasons, freight logistics costs on both corridors exacted serious penalties on Rwandan producers and as a result blunt the competitiveness of the export sector. Again, because of its mountainous terrain, the excessive rainfall, erosion is particularly severe on the country’s road network, whose maintenance cost was twice higher than that of most Sub-Saharan countries. The country’s road network of 14,000 km, spread over barely 27,000 square km of national territory, was among the densest in Sub-Sahara Africa, and its management far exceeds the country’s human and financial capabilities. Recent sector surveys, conducted with the help of the European Commission (EC), the World Bank and

66
PPIAF,4 concluded that only 23 percent of Rwanda’s asphalted network in 2005 was in good condition, while barely 5 percent and 2 percent of the secondary and communal networks were in good condition, respectively. As high as 85 percent of the 1,100 km paved network requires heavy rehabilitation or periodic maintenance, and most of the secondary and communal roads have not been maintained for over a decade.
4. At appraisal in 2007 the Government took up a highly ambitious investment program in transport sector to rise steadily investment from Rwandan Francs (FRW) 12 billion (US$24 million) in 2005 to about FRW 19 billion (US$ 38 million) in 2010 under NIS. In addition, resources required to routinely maintain the country’s 14,000 km road network annually was estimated at US$24 million whereas the RMF, which was currently the only financing source, could only generate US$6 million.
5. During appraisal period, the transport sector was suffering from acute human resources problems. Most of the staff in the sector were young and inexperienced, while high staff turnover used to undermine efforts to build capacity. There was no road/transport agency in place to look after transport sector. Poor planning and the lack of proper budgetary practices, aggravated by cumbersome procurement procedures, tended to limit the impact of the little investments directed to the sector.
6. In line with Rwanda’s broader decentralization policy, the responsibility for maintaining the unpaved main roads and the unpaved rural roads was moved to the provinces and districts, respectively. Since 2004, in an effort to support the policy, the RMF distributed 50 percent of its resources to district and city councils in the form of subsidies. Unfortunately, this system has further impoverished road maintenance in two ways: First, the classified road network lost half of its maintenance resources while its maintenance gap became doubled. Second, the impact of the resources distributed to city and local governments was limited given the lack of capacity and experience to play this new role, and the absence of adequate control mechanisms.
7. During the appraisal period, the Government of Rwanda adopted highly ambitious a transport policy matrix supported by a three year Medium Term Expenditure Program (MTEP) for the five modes of transport (air, land, rail, river and lake) under the PRSC of the World Bank. However, its targets far exceeded those of the NIS and it did not take into account the human constraints or the technical absorption limitations of the country. In addition, most of the country’s transport legislation were from the colonial era and needed to be aligned with new and emerging challenges, including the country’s integration with the EAC. Original Project Development Objectives and Key Indicators 8. The objectives of the project were: (a) to improve the quality of Rwanda's paved road network and (b) to generate sustained employment in rural areas through road maintenance works. The project aimed to improve road quality by: (i) restoring parts of major road corridors to good conditions through rehabilitation works on the Kigali-Ruhengeri road and maintenance works on about 50 percent of the paved road network of 1,100 km; (ii) establishing a system for sustainable
4 Rwanda Country Framework Report for the Government of Rwanda and PPIAF, 2003

67
financing of road maintenance; and (iii) improving management and operational efficiency in sector institutions through the establishment of management information and statistical systems, and targeted training.
9. The key indicators included (i) 50% of paved roads in good condition (average IRI less than 3.0 m/km) and (ii) Number of permanent jobs generated annually from road maintenance works. Project Components 10. The project consists of the following components: Component 1: Paved Road Rehabilitation and Maintenance - US$62.4 million (a) Kigali-Ruhengeri Rehabilitation - US38 million
(i) Rehabilitation of approximately 83 km of the Kigali-Ruhengeri section of Kigali-Ruhengeri-Gisenyi road;
(ii) Provision of technical assistance in support of supervision of said rehabilitation.
(b) Paved Road Maintenance - US24.4 million (i) Maintenance of approximately 550 kilometers of paved trunk roads, including
sections of Gatuna-Bugarama, Gitarama-Kibuye, and Rusumo-Gisenyi roads, through execution of multi-year output-based management contracts.
(ii) Provision of technical assistance in support of supervision of said maintenance, Component 2: Sector Governance and Policy Support - US$2.6 million (a) Sector Governance Improvement
Provision of technical assistance to the Road Agency (RA), following its establishment, the RMF, the Vehicle Technical Inspection Center, the Rwanda Civil Aviation Authority, and the National Public Transport Agency, in support of preparation and implementation oversight of long-term performance agreements to be concluded between these agencies and the government.
(b) Transport Policy Implementation Support
(i) Stakeholder workshops and seminars relating to transport policy implementation and regional transport cooperation
(ii) Provision of technical assistance to the MININFRA in support of program development and carrying out of strategic studies for transport policy implementation.
(iii) Provision of technical assistance in support of development and implementation of road safety action plan, improvement of data collection, and establishment of accident database in the Planning, Policy, and Capacity Building Unit.
(iv) Development and implementation of transport sector HIV/AIDS prevention strategy. (v) Provision of technical assistance in support of establishment and training of local
community associations of roadside dwellers in labor-intensive road maintenance.

68
Component 3: Sector Analysis and Planning Support - US$2.2 million (a) Transport Planning and Monitoring Systems
(i) Provision of technical assistance to the PPCBU in support of establishment of transport database and monitoring and evaluation systems relating to Project and Program performance, transport costs, transport industry standards, and other transport performance indicators.
(ii) Transport data collection for planning and monitoring systems. (iii) Acquisition of information technology equipment and materials for monitoring and
evaluation systems established under Component 3(a) (i) above.
(b) Capacity Building (i) Financing of the services of an international university and a local university to
provide long-term in-country training to professional staff of the road agencies, local entrepreneurs, and unemployed graduates, leading to Masters’ degrees in Road Engineering and Management and Transport Economics and Planning.
(ii) Financing o f a local consultant to provide management support to the in-country training program.
Component 4: Project and Program Management Support - US$1.2 million
(i) Financing of Operating Costs of the Planning, Policies and Capacity Building Unit, the Transport Projects and Program Management Unit (CGPT), and the Road Agency following its establishment.
(ii) Provision of technical assistance to Infrastructure Planning, Policies and Capacity (iii) Building Unit, Transport Projects Management Unit, Road Agency following its
establishment, and the Road Maintenance Fund in support of Project and Program technical audits.
(iv) Provision of technical assistance to Infrastructure Planning, Policies and Capacity Building Unit, Transport Projects Management Unit, Road Agency following its establishment, and Road Maintenance Fund in support of Project financial audits.
(v) Training of Project and Program management staff in accounting and financial management, procurement and contract management, and budget preparation and disbursement.
Implementation 11. The Bank approved the project on August 28, 2007, and the credit became effective on December 28, 2007. The original closing date was June 30, 2012. However, in order to resolve issues related to widening of the carriageway of the Kigali-Ruhengeri Road from 6.15 m to 7.00 m project was delayed and subsequently revised closing date was on December, 31, 2014. Major Factors Affecting Implementation Factors outside the Control of the GoR or Implementing Agencies 12. Limited Construction Sector Capacity: It was evident that there was a low construction industry capacity in Rwanda, with very few contractors/consultants who had the capacity to handle

69
major construction and capacity development projects during implementation period. The nation’s construction industry is underdeveloped and plagued with problems, which include lack of management, integrated legal and regulatory regime, technical capacity, access to credit facilities and work opportunities. Further, there were contractors with limited financial and technical capacities, leading to limited competition and lengthy verification processes on the performance of previous projects in the procurement process of the project.
13. Global Economic Crisis: The global economic situation affected the prices of inputs. During the execution of the project, the global economy experienced both very high rise and fall of oil price. For example, while the average price of a barrel of oil was US$67.94 at appraisal in 2007. During the implementation of the civil works contracts, the price of a barrel of oil continued to fluctuate, generally with an upward trend and with a peak of around US$100.00 in during 2011 to 2013. In terms of contracts management, this resulted in higher than expected values of price adjustment. Again, the negative global growth prospect was mainly being based on the weak demand for oil at the flag end of the project in 2014 which forced prices to fall to below US$70 their lowest since 2009 and economists are attributing this trend to general weak economic activity in advanced economies. More than 60 per cent of Rwanda's budget is funded locally through domestic tax revenues with the rest coming from foreign aid. In 2012, donors suspended their support which led to a growth slowdown in 2013. However, most donors restored their support in 2014 which has helped to facilitate economic recovery with an anticipated growth of more than 6 per cent. However, to ensure financial stability, government has since put in place precautionary measures to guard against external shocks as well as ensuring steady flow of funding for priority areas such as energy. Despite these fluctuations in global economic situations, the project overcame most the obstacles and managed its overall expenditure more or less within budgetary limits. Factors Generally Subject to Government Control 14. The government was expected to contribute through the RMF some US$20 million over the five-year period of road maintenance contracts. In addition, and as a mitigating measure in case the fuel levy did not increase as expected, the government undertook during negotiations to ensure that agreed amounts of the resources raised locally through the RMF are maintained in a separate project account to be managed independently by the RMF. These amounts, which total US$24 million over the life of the project, were supposed to be deposited in the account at the beginning of every year starting in 2008. This commitment was a covenant in the Financing Agreement and was monitored closely during implementation. The fuel levy was introduced in 1991, at RWF20.23 (US$0.13) per liter for Petrol and RWF24.43 (US$0.16) for diesel. By 2008, whilst the levy had remained unchanged, its value had fallen to about 3% of the fuel pump price and was only worth about US$0.04. In 2009, the levy was increased to RWF62.37 (US$0.11) per liter (for both fuel types), representing about 9% of the fuel pump price. In 2014, the levy remains at RWF62.37 (now worth about US$0.09) and representing about 6% of the fuel pump price. Another source of revenue for RMF is International Transit Traffic. Existing revenue of RMF consists of US$21.114 million from Fuel Levy and US$12.70 million from International Transit Traffic, i.e. in total US$33.814 million per year. The RMF deposited in the special project account, over US$24 million in accordance with the commitment of the Government to contribute for road maintenance under TSDP.

70
Factors Generally Subject to the Implementing Agency’s Control 15. Weak Technical Implementation Capacity: During the implementation period CGPT was restructured and converted into a full-fledged transport agency, i.e. RTDA. The current organization structure of RTDA was established and approved in 2010. The implementation of the organization structure commenced in September 2011. Starting from 38 staff of CGPT, RTDA has now 98 staffs among which 61 are Engineers including managerial positions and the remaining 37 are in the corporate services. In addition to Road Maintenance Management Unit, a SPIU was established in RTDA from July 2014. The restructuring process is aimed at improving the efficiency of the institution by attracting skill professionals in the SPIU by offering better salary and other remunerations. Again PPCBU of MININFRA no longer act both as a policy making and implementing agency. The MININFRA has also gone through major restructuring relinquishing its implementing roles to a number of agencies such as RTDA, Rwanda Housing Authority (RHA) and Energy Water and Sanitation Authority (EWASA), etc. The role of the MININFRA is now limited to policy making and monitoring the activities of the implementing agencies, such as RTDA. With the restructuring of MININFRA and RTDA, the technical implementation capacity of the transport sector in Rwanda has improved significantly.
16. Cost overruns on road works would have undermined the project objectives and/or its expected impact. The initial contract for the civil work was awarded to China Henan International Cooperation Group Co. Ltd (CHICO) at a contract amount of RWF) 25, 060, 999, 796, equivalent to USD 43,966,666; and the addendum was RWF 2,349,844,553 equivalent to USD 4,122,534.30. The total contract amount is USD 48,089,199.The contract between the MININFRA and CHICO was signed on November 30, 2009 with a construction period of 27 months. This means the construction work of the project had a cost overrun of 9.4%. Assessment of Outcomes Relevance of Objectives, Design and Implementation 17. The project objectives were clear, relevant, and important to improve road maintenance management system and strengthening sector governance and policy, planning and program management. The program components had a good linkage with the project objectives. The project components are fully consistent with EDPRS 2 of Rwanda, which aims to accelerate private sector-led growth and further reduce poverty, including extreme poverty. It seeks to do so while reducing aid-dependency and increasing self-reliance. The project also contributed to the Bank’s CPS strategic principles used in defining future areas of engagement in Rwanda, comprising: (i) alignment with the twin goals of growth and poverty reduction; (ii) comparative advantage relative to other donors; (iii) opportunity to maximize internal WBG synergies and present a coherent ‘one Bank Group’ approach; (iv) client demand; (v) risk especially with respect to capacity constraints both on the side of Government and the WBG. The project objectives were also in line with the these CPS objectives of reducing capacity constraints, ensuring improvement in policy formulation, planning and program management, preservation of road asset to ensure efficient and reliable provision of road transport network, increasing agricultural production and accessibility, stimulating economic growth in the country, and enhancing linkages with neighboring countries.

71
Achievement of Project Development Objectives
18. The Project was successful to attain all PDO. About 62 percent of the paved roads network continues to remain in good condition, and the project has surpassed its intended original target (of 50 percent by the end of the project). After the completion of Kigail-Ruhengeri road, 100% of the road is in Good condition having IRI (m/km) less than 3. The completion of the Kigali to Ruhengeri road rehabilitation has contributed to the objective of providing reliable access to about 2.1 million people living along this main regional corridor. The objective of establishing a system for sustainable financing of road maintenance made some inroads when in 2009 fuel levy was increased from RWF 24.43 to RWF 62.37. The Existing revenue of RMF consists of US$21.114 million from Fuel Levy and US$12.70 million from International Transit Traffic, i.e. in total US$33.814 million per year. The RMF deposited in the special project account, over US$24 million in accordance with the commitment of the Government to contribute for road maintenance under TSDP. The engagement of LCAs for the maintenance of the national road network has helped to provide employment opportunities for about 3,041 inhabitants along the roads (against 3,000 targeted by the end of the project). RMF, RTDA and the Districts now need to sustain the engagement of LCAs to ensure that these gains are not lost after the closure of the project.
19. The postgraduate training program in transportation studies by University of Rwanda (UoR) was successfully completed by end December 2014. Under the program 30 students in Highway Engineering and Management (HEM) and 22 students in Transport Engineering & Economics (TEE) were trained leading to MSc degrees. Data collection to support the monitoring and results assessment of the project were conducted in the form of surveys at three intervals during implementation of the project as planned. These survey data helped the project to monitor all core and intermediate indicators with respect to its periodical or annual targets. In this connection, the project also helped RTDA, RMF and MININFRA to establish an M&E system to monitor all development projects within the transport sector. Justification of Overall Outcome Rating 20. The PDO of the project were to improve the quality of Rwanda's paved road network, to generate sustained employment in rural areas through road maintenance works, to restore Kigali-Ruhengeri road corridor, to develop sustainable road maintenance financing system and to improve human resources and institutional capacity for developing road transport sector policy, planning, monitoring & evaluation and project management. The project was very successful in materializing all PDO’s under the four components of the project. The Economic Efficiency of Indicators of the Kigali-Ruhengeri Road, which was the most capital intensive component of the project, were significantly better than predicted economic benefit at the time of project appraisal. The project is a deserving candidate to be rated as “Satisfactory” as far as implementation of PDO’s are concerned.
21. Despite successful implementation of all PDO’s the project was not free from short-comings. The original closing date of the project was 30 June, 2012 but it was delayed by almost two and a half year up to 31 December, 2014. In addition to about 20% increase of the project cost due to widening road carriage way from 6.15 m to 7m, the construction work of the project also had a cost overrun of 9.4%. In total the overall cost was increased by 28.9%.

72
22. During the implementation of the project, there was not accounting manual specific to RTDA. Whereas the RTDA has an internal audit department, they primarily focus on government funds, and therefore activities of the project were not audited by the internal audit unit. It was also not possible to prepare audit plans on the basis of risk rather than activity. Considering all these, the overall financial management ISR rating for the project may be classified as Moderately Satisfactory. The overall financial management risk for the project was Substantial. 23. Considering the time lose on actual implementation, escalation of construction costs and some problems of financial management, overall the ISR “Satisfactory” ratings were too generous. This is despite the fact that the project was generally successful in fulfilling all its PDO’s objectives. Based on an assessment of the overall performance, considering the above mentioned factors and weaknesses as an impetus for rating, the ICR assessed the overall performance outcome rating to be “Moderately Satisfactory”. Assessment of Bank and Borrower Performance Bank Performance (a) Bank Performance in Ensuring Quality at Entry Rating: Moderately Satisfactory 24. The project design was relevant, appropriate, and responsive to the client’s needs as it was directed to improve road maintenance management system and strengthening sector governance and policy, planning and program management. In the project design all potential key issues, such as (i) high transport costs, an oversized and poor road network, (ii) an ambitious investment program with limited resources, (iii) weak institutions, (iv) effects of decentralization, and (v) inadequate transport policy framework, etc. were dully taken into account and adequate measures were designed to address them. Again, all the targets for key PDO indicators were turned out to be relevant and realistic considering overall institutional, human resources and financial capabilities of the transport sector of Rwanda.
25. At project appraisal in 2007, the rehabilitation and maintenance works for Kigali-Ruhengeri road were supposed to be implemented for a road with a 6.15 m width for carriageway. However, in order to maintain continuity of the level of service between Kigali-Ruhengeri and Ruhenger-Rubavu (Gisenyi), which was constructed with a 7m of carriageway width and to enhance traffic safety, it was essential to maintain the same standard width of 7 throughout the entire road corridor, i.e. Kigali-Ruhengeri-Rubavu. Due to the deficiency in the design concept, the project was delayed by almost 2 years and 6 month with a substantial increase of costs (about 19%).
26. The overall risk at project appraisal was assessed to be Very High and as such several mitigation measures were proposed at entry. The key project risks were (i) weak Technical Implementation Capacity, (ii) Cost overruns on road works, and (iii) weak Financial Management Capacity. However, it appears that considering the very high risks associated with the project, some of the key risk mitigation plans were not very clearly defined at entry.

73
(b) Quality of Supervision Rating: Moderately Satisfactory 27. In order to facilitate the project supervision, a Project Implementation Plan (PIP) was prepared, which provided a good basis for the project supervision. The bank provided advisory support by employing a competent team having a wide array of skill-mix in accordance with the requirements of the project. The team worked in close cooperation with the RTDA, MININFRA, Ministry of Economic Planning and Finance (MINECOFIN); and had regular coordination meetings with key development partners in Rwanda in the road sector, namely, the African Development Bank (AfDB), the delegation of the European Union (EU), and the United States Agency for International Development (USAID). The team maintained a strategic vision not only on for implementation of the rehabilitation work of Kigali-Ruhengeri road but also took into account of issues related to road maintenance management, institutional and human resources capacity development as well as other cross cutting issues such as labor-base road maintenance, employment generation, gender equality, HIV/AIDS awareness and mitigation measures and governance. There was significant involvement of the Bank’s team to resolve day-to-day problems. The quality of the financial management reviews was found to be satisfactory and consistent with the Bank guidelines. The supervision aide-memoires for the implementation phase provided highlights on the key issues thus providing prompt information to the client and Bank management.
28. However, despite adequate supervision of the project, it was not possible to avoid long delays in commencement of the project due to debate on widening of the road carriageway width from 6.15m to 7m. Again, apparently because of inadequate supervision process the project suffered an overall escalation of by 19% and a long delay in implementation of postgraduate training program on transport sector in collaboration with University of Rwanda and number of studies in the project. (c) Justification of Rating for Overall Bank Performance Rating: Moderately Satisfactory 29. Although the World Bank provided adequate advisory and supervision support throughout the implementation process, the project was marred with significant delays and cost escalations of different components. Therefore overall performance of the bank can be rated as “Moderately Satisfactory”. (a) Government Performance Rating: Satisfactory 30. The Government of Rwanda showed firm commitment in implementing institutional reforms for improvement of service delivery and road maintenance management system. During the implementation period the original implementation unit at project appraisal, i.e. CGPT was restructured and converted into a full-fledged transport agency, i.e. RTDA. Starting from a weak administrative structure of 38 staff of CGPT, RTDA has now 98 staffs with an array of strong planning and management divisions. The PPCBU of MININFRA no longer play the dual role of policy making and implementation of development projects. The role of the MININFRA is now limited to policy making and monitoring the activities of the implementing agencies, such as RTDA. There is no doubt that the technical implementation and institutional capacity of the

74
transport sector in Rwanda have improved significantly after restructuring the same during the project implementation period.
31. The Government of Rwanda also fulfilled its commitment by providing over US$24 million to contribute for road maintenance under TSDP. Again, fuel levy for road maintenance was increased RWF 24.43 to RWF 62.37 in 2009 to mobilize more funds for road maintenance. Considering proactive approach of the Government of Rwanda for sustainable development of the road transport sector, the overall performance of the government may be considered as “Satisfactory”. (b) Implementing Agency or Agencies Performance Rating: Moderately Satisfactory 32. At the initial stage of the project CGPT and the PPCBU of MININFRA were the two main executing agencies of the project. They successfully assisted in revised planning and design of the rehabilitation of Kigali-Ruhengeri road with a carriage of 7m instead of 6.15 as originally planned at appraisal in 2007. After the establishment of RTDA in 2010, it became the main implementing agency of the project. RTDA successfully implemented all four components of the project and all PDO’s were fully achieved.
33. The rehabilitation work of the Kigali – Ruhengeri road was successfully completed and three multi-year maintenance contracts were also completed successfully. RTDA successfully engaged LCAs for the maintenance of the national road network which helped to provide employment opportunities for about 3,041 inhabitants along the roads (against 3,000 targeted by the end of the project). RTDA helped successful completion of long term in-country training in transportation studies in collaboration of University of Rwanda.
34. It appears that RTDA successfully maintained adequacy of the project's financial management arrangements and compliance with the legal covenants related to financial management. The project accounting system worked satisfactorily to process and record financial data.
35. Despite success in implementing all components of project, RTDA could not prevent significant delays and cost escalation of the project. The performance of the implementing agency can be regarded as “Moderately Satisfactory”. (c) Justification of Rating for Overall Borrower Performance Rating: Moderately Satisfactory 36. The government’s overall performance is rated as “Moderately Satisfactory”. Lessons Learned 37. Finalization of Key Design Parameters at Entry: Despite the fact the Rehengeri-Rubavu (Gyseni) section of Kigali-Ruhengeri-Gyeni road corridor was built with a carriageway width of 7m, initially Kigali-Ruhengeri section was proposed to build with a carriageway width of 6.15m at Appraisal in 2007. In order to remove the anomaly in the design and to maintain the same standard for all National road, it was redesigned to widen the carriageway from 6.15m to 7m.

75
However, because of lengthy process to change the design, the commencement of the project was delayed by almost two and a half year. In addition it resulted about 20% increase of construction cost. It is therefore essential to select the key design parameters at Project Entry to avoid unnecessary delays and cost overrun in the project.
38. Sector Governance, Policy and Planning Support: The institutional reforms conducted in parallel to project implementation by transforming CGPT into a full-fledged transport agency, i.e. RTDA was proved to be very effective in realizing all PDO’s of the project. An important lesson learned is that institutional reforms are essential to improve sector governance, policy and planning capacity of the road transport sector in Rwanda.
39. Involvement of Local Communities in Road Maintenance: The engagement of LCAs for the maintenance of the National road network not only helped to ensure routine maintenance of road network but also provided employment opportunities for about 3,041 inhabitants along the roads (against 3,000 targeted by the end of the project). It is therefore essential to continue to expand such programs to cover the entire road network Rwanda for sustainable maintenance management of road network.
40. Human Resource Capacity Development: The Project was success in creating a total of 283 cooperatives of road side dwellers and trained 11,322 rural people to carry out routine maintenance works. Again under the project about 52 professional were trained at postgraduate level road transport studies leading to MSc degrees. The development of human capital to an acceptable and stable stage is a continuous process. It is not clear whether the human resource development initiatives will continue after the completion of the project. For sustainability on the provision of sector governance, policy, planning support and institutional reform and technical assistance, the human capacity building process needs continuation and pick up by the follow-on TSDP.
41. Sustainability of the Road Maintenance Management: The total estimated maintenance requirements for the roads (and bridges) to be funded by the RMF is approximately US$130 million per year, approximately five times the existing total revenue of US$ 35 million raised from existing charges and sources. It is not clear how RMF will generate additional funds for the maintenance of National Road network in Rwanda. Again, the expansion of mandate of RMF to cover District Class 1 roads was done without making provisions of additional financing for institution. In order to retain the core functions of the Road Maintenance Fund, there is a necessity to provide it with a strong financial base commensurate to the mandate. It is therefore essential to devise clear strategy to mobilize additional funds for maintenance management of National road network in a sustainable manner.
42. Monitoring and Evaluation Indicators of the Projects: The project was successful in developing key indicators and targets for all four components of the project. However, there were some inconsistencies in definition of Good road between the Common Appraisal Performance Framework (CAPF) of RTDA and the Project Appraisal document. According to CAPF a paved road is considered to be in Good condition if average IRI is less than 4m/km. On the other hand, criterion for Good condition for a paved road in the Project Appraisal Document is IRI less than 3m/km. This anomaly in the definition of Good condition resulted in wrong information about the percentage of paved road in Good condition in all previous interim ICR of the project. It is

76
therefore essential to adopt a common criteria to define Good condition for paved road network of Rwanda.
COMMENTS OF BORROWER ON DRAFT ICR
1. We reviewed the document and found most of the text reflecting the reality of the project during implementation. However, on behalf of Director General (DG) RTDA we would like to attract your attention to Page 32, Paragraph 121 of the draft ICR talking about "Bank Engagement with RTDA". We believe this paragraph does not convey a fair assessment and hence request its re-phrasing and advice to further engage with RTDA basing on the following:
(a) Two components of the TSDP, namely Sector Governance and Policy Support and Sector Analysis and Planning Support were provided to assist the Transport Sector in Rwanda to grow and mature after the Tutsi Genocide and war, both of which had affected transport infrastructure and sector institutions. It is our understanding that the progress made through TSDP should be consolidated through future programs and projects that should further strengthen the Transport Sector in general and RTDA in particular. Not engaging with RTDA would rather be against the required objective of strengthening the Transport Sector by having a dedicated implementing agency for Transport Infrastructure Development.
(b) Since 2014, RTDA has embarked on a number of reforms to effectively implement its mandate of looking after Transport Infrastructure Development in Rwanda and respond to the obligatory requirements. These reforms resulted from experience in implementing different projects including TSDP and we believe they should rather be supported to produce expected outcomes. The set-up of SPIU and upgrading the salary scheme have attracted new and competent staff which is a solution to the high staff turnover at all levels of the RTDA structure during TSDP implementation. For instance, the procurement personnel has increased from 3 to 9 people including 3 consultants (2 locals and 1 international) and improvement is significant.
(c) In end 2014, the majority of RTDA staff (mostly newly recruited SPIU staff) underwent a contract management and procurement training for 3 weeks to build their project management capacity. From March 2015, an international procurement consultant with World Bank experience is working with RTDA to provide on-job capacity building for procurement staff as well as for the Internal Tender Committee.
2. In addition, in the paragraph 119 of the draft ICR, RTDA is rated as MODERATELY UNSATISFACTORY and we do not agree with the rating. The project has seen a number of challenges in implementation but it attained its objectives and improvement reforms were underway at the time of closure. This should have been taken into consideration in the assessment of RTDA. We provided our comments in the attached draft ICR for your consideration.

77
Annex 8. Comments of Cofinanciers and Other Partners/Stakeholders
No comments received.

78
Annex 9. List of Supporting Documents
1. Aide memoires (AMs): April/May 2008, February 2009, October 2009, June 2010, October/November 2010, January 2011, November/December 2011, June 2012, January/February 2013, October 2013, April 2014, October 2014.
2. Mid Term Review: October 2010. 3. Implementation and Status Results Reports (ISRs): January 2008, July 2008, March 2009,
December 2009, June 2010, March 2011, April 2011, August 2011, February 2012, September 2012, May 2013, December 2013, June 2014, December 2014.
4. Project Appraisal Document, July 2007. 5. Project Paper on Additional Financing, May 2011. 6. Restructuring paper, December 2013. 7. Financing Agreement, October 2007 (Grant Number: H331-RW). 8. Grant Agreement, October 2007 (Grant Number: TF090451-RW). 9. Financing Agreement (Amended and Restated), July 2011. 10. Financing Agreement (First Amendments), September 2008. 11. Financing Agreement (Amendment to the Amended and Restated Financing Agreement),
December 2013.

79
Annex 10. Institutional Status of the RTDA
Initial institutional arrangement for the TSDP
1. In 2007, the Transport Sector Development Project (TSDP) was initially designed to be implemented by the Program and Projects Management Cell (PPMC) that was under the Ministry of Infrastructure (MININFRA) created then to manage the East Africa Trade and Transport Facilitation Project (EATTFP) also financed by the World Bank. A separate Project Implementation Unit (PIU), under MININFRA, was in place to manage three projects financed by the African Development Bank. Transport infrastructure projects financed by the European Union (EU) were managed by a PIU established under the Ministry of Finance and Economic Planning. The government of Rwanda’s financed projects, mainly in maintenance operations, were managed under the Ministry of Infrastructure in the department of road maintenance. The overall World Bank portfolio managed by the PPMC was amounting to $US84million with 10 staff including a Coordinator, Procurement Specialist, M&E Specialist, 2 Road Engineers, Environmental Specialist, Financial Specialist, Accountant and Administrative Assistant. Salaries were ranging from around $US1,836 for specialists/engineers to $US2,209 for the coordinator and were paid through the World Bank funded projects.
Creation of RTDA and operational challenges
2. To better coordinate the transport sector, the Rwanda Transport Development Agency (RTDA) was created on 20th January 2010, under the Ministry of Infrastructure (MININFRA), with a mission to manage all day to day aspects of the transport sector in Rwanda. RTDA was given a legal personality as well as administrative and financial autonomy. The management of all transport projects, including TSDP, was then transferred to the newly created agency. Salaries were aligned to the Government of Rwanda payment scheme for civil servants that was then allocating around $690 to Specialists/Engineers and $US1,270 for Division Managers who were tasked to be the World Bank projects Coordinators. The RTDA structure included a Division of Development under which rehabilitation of the Kigali-Ruhengeri road was managed, Division of Planning under which studies and MSc program were managed, Division of Maintenance under which routine maintenance with Local Community Associations (LCAs) as well as periodic maintenance were managed and the Division of Corporate Services responsible for procurement and financial activities.
3. The reduction in remuneration resulted in the high turnover of RTDA staff in its early stage that negatively affected projects including TSDP. For instance, from 2010 to 2013 all previously projects management staff, including the coordinator, left RTDA except the M&E specialist and one road engineer who were assigned other RTDA managerial functions. In addition, other important posts of RTDA saw a turnover as well including the post of Director General that was occupied by four people between 2010 and 2013. The structural management of the TSDP, as well, was not smoothly integrated into the RTDA structure. Newly RTDA recruited and inexperienced staff, depending on their divisions, was given responsibility to manage standalone TSDP activities
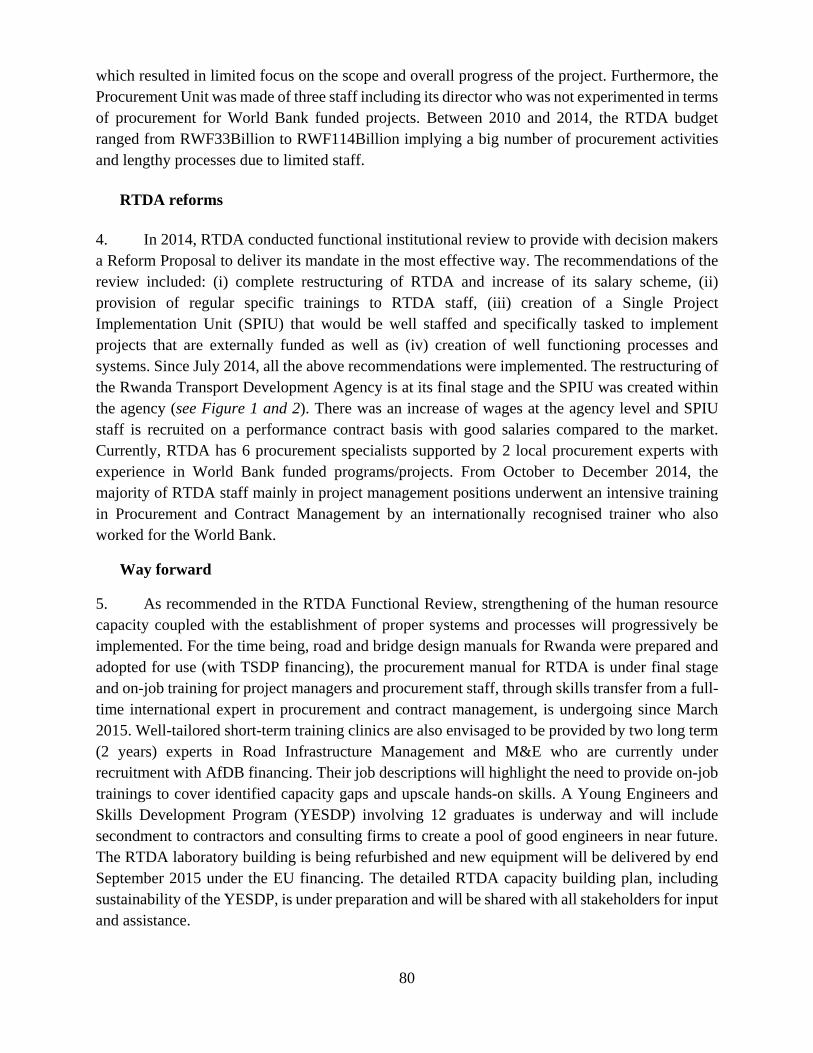
80
which resulted in limited focus on the scope and overall progress of the project. Furthermore, the Procurement Unit was made of three staff including its director who was not experimented in terms of procurement for World Bank funded projects. Between 2010 and 2014, the RTDA budget ranged from RWF33Billion to RWF114Billion implying a big number of procurement activities and lengthy processes due to limited staff.
RTDA reforms
4. In 2014, RTDA conducted functional institutional review to provide with decision makers a Reform Proposal to deliver its mandate in the most effective way. The recommendations of the review included: (i) complete restructuring of RTDA and increase of its salary scheme, (ii) provision of regular specific trainings to RTDA staff, (iii) creation of a Single Project Implementation Unit (SPIU) that would be well staffed and specifically tasked to implement projects that are externally funded as well as (iv) creation of well functioning processes and systems. Since July 2014, all the above recommendations were implemented. The restructuring of the Rwanda Transport Development Agency is at its final stage and the SPIU was created within the agency (see Figure 1 and 2). There was an increase of wages at the agency level and SPIU staff is recruited on a performance contract basis with good salaries compared to the market. Currently, RTDA has 6 procurement specialists supported by 2 local procurement experts with experience in World Bank funded programs/projects. From October to December 2014, the majority of RTDA staff mainly in project management positions underwent an intensive training in Procurement and Contract Management by an internationally recognised trainer who also worked for the World Bank.
Way forward
5. As recommended in the RTDA Functional Review, strengthening of the human resource capacity coupled with the establishment of proper systems and processes will progressively be implemented. For the time being, road and bridge design manuals for Rwanda were prepared and adopted for use (with TSDP financing), the procurement manual for RTDA is under final stage and on-job training for project managers and procurement staff, through skills transfer from a full-time international expert in procurement and contract management, is undergoing since March 2015. Well-tailored short-term training clinics are also envisaged to be provided by two long term (2 years) experts in Road Infrastructure Management and M&E who are currently under recruitment with AfDB financing. Their job descriptions will highlight the need to provide on-job trainings to cover identified capacity gaps and upscale hands-on skills. A Young Engineers and Skills Development Program (YESDP) involving 12 graduates is underway and will include secondment to contractors and consulting firms to create a pool of good engineers in near future. The RTDA laboratory building is being refurbished and new equipment will be delivered by end September 2015 under the EU financing. The detailed RTDA capacity building plan, including sustainability of the YESDP, is under preparation and will be shared with all stakeholders for input and assistance.

81
Figure 10.1: RTDA structure
Figure 10.2: SPIU Structure

82