document resume ir 016 560 author sabatino, melissa title · document resume ed 368 326 ir 016 560...
TRANSCRIPT

DOCUMENT RESUME
ED 368 326 IR 016 560
AUTHOR Sabatino, MelissaTITLE Elementary Technology Demonstration Schools: The
Third Year 1992-93. Publication Number 92.31.INSTITUTION Austin Independent School District, Tex. Office of
Research and Evaluation.PUB DATE Oct 93NOTE 64p.
PUB TYPE Reports Descriptive (141) ReportsEvaluative/Feasibility (142)
EDRS PRICE MF01/PC03 Plus Postage.DESCRIPTORS Academic Achievement; Achievement Tests; Community
Involvement; *Computer Assisted Instruction; ComputerCenters; *Demonstration Programs; *EducationalTechnology; Elementary Education; *Grants;Microcomputers; Parent Participation; Problems;Program Implementation; *School BusinessRelationship; Tables (Data); Teacher Attitudes;Technological Advancement; Writing Laboratories
IDENTIFIERS Apple Computer Inc; *Austin Independent SchoolDistrict TX; IBM Corporation; *Project A Plus ElemenTechn Demonstration Schools; Texas Assessment ofAcademic Skills
ABSTRACTThe 1992-93 school year was the third year of the
Elementary Technology Demonstration Schools program of the Austin(Texas) schools; the project is funded by International BusinessMachines Corporation (IBM) and Apple Computer Inc. Grants from thesecorporations were used to equip three elementary schools with IBMequipment and one with Apple equipment. The IBM schools pursued amixed instructional approach with computers in the classroom as wellas computer laboratories. The Apple program used computerlaboratories, one dedicated to writing and two for basic skillsacquisition. The program is nearing full implementation. Problemsinhibiting full participation include difficulties with the classreporting option, inconsistent implementation of the computertake-home policy, difficulties in teacher use of telephonetechnology, and the lack nf parent and community involvement.Recommendations are made to improve program implementation andavailability for students. The percentage of students passing theTexas Assessment of Academic Skills in writing did increase in theIBM schools. Thirty-one figures present study findings. Eightattachments, with an additional 10 tables and 4 figures, providesupplemental information about the program. (Contains fourreferences.) (SLD)
************************************************************************
Reproductions supplied by EDRS are the best that can be made *
* from the original document. *
***********************************************************************
-P.

S DEPARTMENT Of EDUCATIONOnce 01 Eclucan Onal Research and intorOvorninlElementary EDUCATIONAL RESOURCES INFORMATION
CENTER IERICI
thts document has been reprOduced es,et ewe° Irorn Ih person Or OrgenIZhOnnr,cknatlng itMi001 changes nave been Irmo' to "rpm,»,eoroclochon puahly
TechnologyDemonstration
PoinIS 01 vie* or opnions SICIO in thia 00Cu-rnonl 00 not neCOSSInly rOrririnl officialOE RI posmon or pohcy
Schools
The Third Year1992-93
I. 4
81=at
r;k
NVileSZIN1
10
- -
crtur-..m.2-- t=t
PERMISSION TO REPRODUCE THISMATERIAL HAS BEEN GRANTED BY
G. Ligon
\r) INFORMATION CENTER ERIC
Austin Independent School DistrictOffice of Research and Evaluation
TO 1HE EDUCATIONAL RESOURCES
BEST COPY MULL'

GLOSSARY
Byte - A unit of information consisting of eight grouped bits (binary digits). Each byte is typicallyused to represent a letter, number, special character, or computer instructions, according to a standard
; code. A kilobyte (KB) is 1,000 bytes. A megabyte (MB) is 1,000,000 bytes.
CD-ROM - Compact Disk, Read-only Memory. Read-only memory is accessible to the computer butincapable of being changed. ROM usually contains instructions and decoding information.
Disk - An information-storage device. A disk is a random access medium, which means thatinformation can be retrieved from any port of it without having to "read" through it from thebeginning, as is required with magnetic tape.
Hard Drive - A device used for storage of information on a permanent or semi-permanent basis. Ahard drive is a large rigid platter capable of storing base amounts of data.
LAN, Local Area Network Computers that are hooked together in series to form a network.
Laser Disk - Disk which allow for the storage and retrieval of pictures and sound.
Modem, Modulator-Demodulator Hardware which allows two computers to interact over telephonelines using electronic signals.
Networked server - In a series of networked computers, the network server holds the main operatingfiles for the network and is the main depository for systemwide files (e.g., the AISD network serverscollect and store the student log files).
Scanner - Device that will allow a person to convert hardcopy text or images into text or images thatcan be stored in a computer-readable format.
Software - The programs that control the operation of a computer.
Technology Technology in this report refers to any computer hardware, computer software,telephones, liquid crystal display (LCD), modems, and other peripherals.
Token Ring - Adapter for a LAN
BEST COPY AVAILABLE 3

92.31
le*.ieritary.:116:Third Year, 1992-93
Executive SummaryAustin Independent School DistrictOffice of Research and Evaluation
Program Description
The 1992-93 school year was the third year ofthe Elementary Technology DemonstrationSchools (E IDS) program. The program wasmade possible by two grants from IBM,having a retail value of $6.8 million, and agrant worth a retail value of $74,000 fromApple, Inc. These grant monies were used toequip three elementary schools (Andrews,Langford, and Patton) with IBM equipmentand one elementary school (Galindo) withApple equipment.
The schools involved in the project did notuse uniform instructional methods. The IBMschools pursued &mixed approach thatincluded placing computers in the classroom,in addition to computer laboratories. Theproject design called for the classroomcomputers to be integrated into instructionthrough a centers-based approach. The Appleschool pursued a strategy of placing comput-ers in laboratories. The Apple school hadthree computer labs, one dedicated to writingactivities, and two labs for basic skillsacquisition.
The primary purpose of the ETDS program isto restructure the classroom learningenvironment using technology as the catalystfor change. To demonstrate the effectivenessof technology in accelerating the learning oflow-achieving students and enhancing theeducation of high-achieving students, theprogram has four specific objectives:
1. In three years, reduce by 50% thenumber of students who are not in theirage-appropriate grade level;
2. In three years, reduce by 50% thenumber of students who are notachieving on grade level in reading,writing, and mathematics;
3. Develop a comprehensive teachertraining program to ensure effectiveimplementation and classroom use oftechnology; and
4. Demonstrate to the community theeducational benefits of technology,thereby obtaining support fordistrict-vide implementation.
Major Findings
IMMO,
I. The program is nearing full implemen-tation. Several problems that inhibitfull implementation include:
The class reporting option, which isnot consistently operating asrequired to provide reliablefeedback to teachers about studentcomputer usage;Many teachers not using thetelephones as recommended;The inconsistent implementation ofthe computer take-home program;andThe lack of parent and communityinvolvement in school activities.(Pages 7-12)
2. During the three years of the program,the percentage of overage student hasdecreased at dr: ETDS. However, thepercentage of overage students at thefour campuses exceeded the Districtaverage by two percentage points, 12%compared to 10%. (Page 3'..;)
3. Effectiveness analyses results aremixed on the effect of the impact oftechnology on student achievement.(Page 16)
4. The number of students failing asection of TAAS has decreased at theETDS. Two schools (Langford andPatton) reached the 50% reductiongoal in one subject area. (Page 34)
5. The percentage of students passing thegrade 3 TAAS writing sectionincreased an average of 13.3 percent-age points at the three IBM schools,compared to a six percentage pointDistrict increase. (Page 21)
6. Minority and economically disadvan-taged students at the EMS areperforming as well as or better inrelation to other District minority andeconomically disadvantaged students.(Page 23)
7. Information System Architectureprinciples for software selection arenot being followed at one school.(Page 8)
4
Author: Melissa Sabatino
Budget Implications
Mandate:Required by the School Board.
FundingAmount:$233,994 (annual operating cost)
Funding Source:Local and external (private)
Implications:The District is bound by an agreementwith the two major fund providers ofthis project (IBM and Apple) tocontinue supporting the project. Asthe District examines ways to use Stateand local money for technology, theinsights gained from the technologystrategies employed in this project willbe vital.
Recommendations
1. A districtwide evaluation of theavailability and use of technologyshould be conducted. The four ETDScould be evaluated in this context.
2. The class reporting option or anothermeasure should be used to providereliable feedback to teachers concerningdegree of student computer usage.
3. Additional telephone training forteachers is needed to demonstrate how torecord, change, and retrieve messages.
4. Additional efforts should be made byschool and A+ Coalition staffs toinclude parents and the community inthe school activities.
5. The AISD Information System Architec-ture principles must be followed whenselecting additional softwaye, so u,ctAISD will not have a collection ofrandom, unsupported, noneducationalsoftware.

92.31 Elementary Technology Demonstration School., The Third Year, 1992-93
PROGRAM EFFECTIVENESS SUMMARYElementary Technology Demonstration Schools
PROGRAM RatingAllocation(COST)
Number ofStudents Served
Cost PerStudent
Effect (inmonths)
Cost per Student for1 month gain(COST/EFFECT)
Andrews $63,253843 $75 : .5
Funding Source: External 0 $1,580,956Investment cost for : .75 51.19
Grades: Pre-K - 5 hardware, software,
Level of Service: All day/allyear
and wiring. Avg: .63
Galindo $44,235751 $59 : .5
Funding Source: External 0 $246,000Investment cost for : 1.25 $67
Grades: Pre-K - 5 hardware, software,
Level of Service: All day/allyear
and wiring. Avg: .88
Langford $63,253574 $94 R: -1.0
Funding Source: External 0 51,229,642Investment cost for M: -1.5 -
Gradea: he-K - 5 hardware, software,
Level of Service: All day/allyear
and wiring. Avg: -1.25
Patton $63,2531,307 $61 : .25
Funding Source: External 0 51,834,320Investment cost for : 1.25 $81
Grades: Pre-K - 5 hardware, software,
Level of Service: All day/allyear
and wiring. Avg: .75
The investment cost is the cost of getting the program "up and going"; it is distinguished from the annual cost ofmaintaining and operating the program once it is in place.
The investment cost for hardware, software, and wiring is calculated using the 40% educational discount that is affordedto all educational institutions.
Rating is expressed as contributing to any of thefive AISD strategic objectives
Positive, needs to be kept andexpanded
o Not significant, needs to be improvedand modifiedNegative, needs major modificationor replacement
IL
Cost is the expense over the regular District per-studentexpenditure of $4,000.
No cost or mininu.l coatIndirect costs and overhead, but no separate budgetSome direct costs, but under $500 per studentMajor direct costs for teachers, staff, and/orequipment in the range of $500 per student or more.

92.31 Elementary Technology Demonstration Schools, The Third Year. 1992-93
namoranmems
TABLE OF CONTENTS
Executive Summary
Program Effectiveness Summary ii
List of Figures iv
Conclusions and Recommendations 1
Introduction 3
Program Implementation Components 4
Progress Towards the "Ideal" States of Implementation 6
Student Achievement 12
ITBS/NAPT 13
ROPE/ROSE 13
TAAS Scores 17
Summer School 30
Progress Toward The A+ Coalition Goals 33
Bibliography 36
AttachmentsAttachment 1: Teacher Survey Responses 37Attachment 2: Feedback Provided to Administrators and Teachers 39
Attachment 3: Software Programs 44
Attachment 4: Average Minutes Per Day on Computer 47
Attachment 5: NAPT/ITBS Scores 1991-92 and 1992-93 50Attachment 6: Number and Percent of Overage Students at the ETDS, 1990-92
as of October 30 52
Attachment 7: Number and Percent of At-Risk Students at the ETDS, 1990-92as of October 30 53
Attachment 8: Lessons Learned by Program Staff During Three Y of Implementation . 54
i;

92.31 Elementery Technology Dernonetrerioa Schools. The Third Year. 1992-93
lenimmenni
LIST OF FIGURES
Figure 1: Theoretical Model for States of Technology Implementation 5
Figure 2: Average Student Minutes Per Day on Computers at All IBM Schools, 1992-93 . . 9
Figure 3: Observed Minutes Per Day on Computers at two IBM Schools, 1992-93 10
Figure 4: ROSE Scores by Test Area, ETDS, 1990-93 14
Figure 5: Comparison of ROSE Scores, ETDS, 1992-93 15
Figure 6: Three-Year ROSE Scores, 1992-93 16
Figure 7: TAAS Percent Mastery, Grade 3, ETDS, 1990-92 17
Figure 8: Difference from District, Percent of Students Mastering TAAS MinimumRequirements, Andrews, Grade 3, 1990-92 18
Figure 9: Difference from District, Percent of Students Mastering TAAS MinimumRequirements, Galindo, Grade 3, 1990-92 18
Figure 10: Difference from District, Percent of Students Mastering TAAS MinimumRequirements, Langford, Grade 3, 1990-92 19
Figure 11: Difference from District, Percent of Students Mastering TAAS MinimumRequirements, Patton, Grade 3, 1990-92 19
Figure 12: AEIS, Difference from Group of 100 Campuses, Percent of Students MasteringTAAS Minimum Requirement, 1991-93 20
Figure 13: TAAS Writing Percent Mastery, Grade 3, ETDS, 1990-92 21
Figure 14: Percent of Students Scoring 3 and 4 on TAAS Writing, Grade 3, ETDS, 1990-92 22
Figure 15: Percent of Grade 3 Students Taking TAAS, ETDS, 1990-92 22
Figure 16: Difference from District, Percent of Students Mastering TAAS MinimumRequirements for All Test Areas, Grade 3, 1990-92 23
Figure 17: Difference from District, Percent of African American Studen3 Mastering TAASMinimum Requirements for All Test Areas, Grade 3, 1990-92 24
Figure 18: Difference from District, Percent of Hispanic Students Mastering TAAS MinimumRequirements for All Test Areas, Grade 3, 1990-92 24
iv

92.31Ektnentary Technology Demonstration Schools, The Third Year. 1992-93
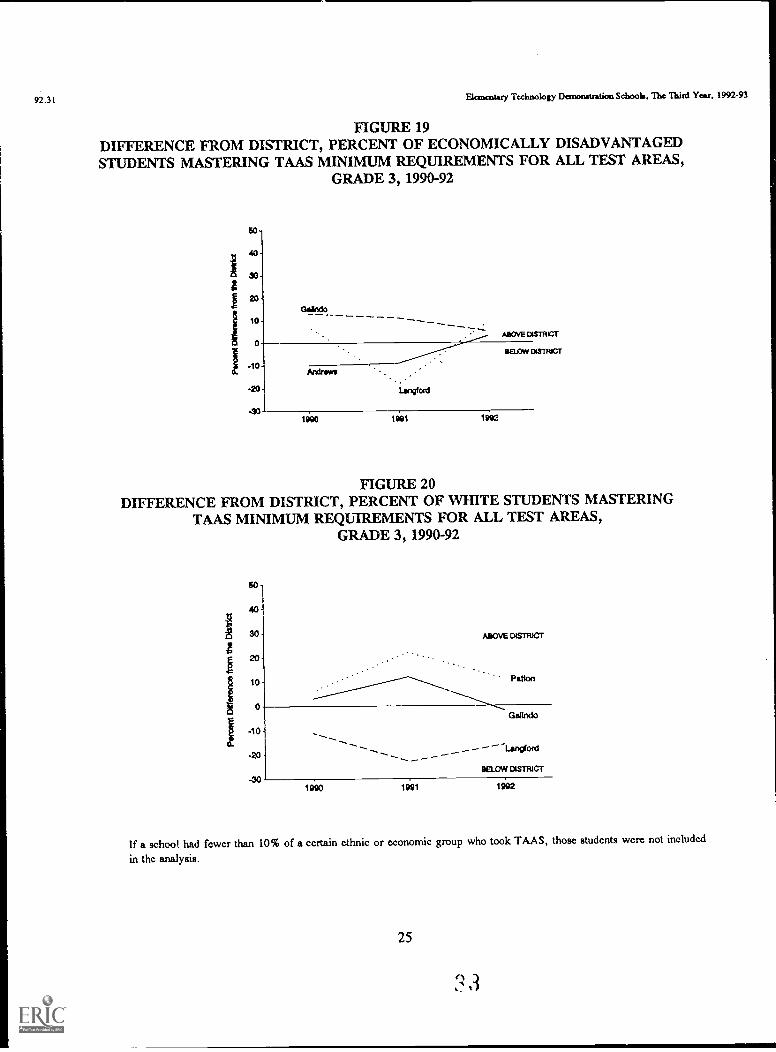
Figure 19: Difference from District, Percent of Economically Disadvantaged Students MasteringTAAS Minimum Requirements for All Test Areas, Grade 3, 1990-92 25
Figure 20: Difference from District, Percent of White Students Mastering TAAS MinimumRequirements for All Test Areas, Grade 3, 1990-92 25
Figure 21: TAAS Percent Mastery, ETDS and District, Grade 4, 1993 26
Figure 22: Difference from District, TAAS Results by Test Area, ETDS, Grade 4, 1993 . 26
Figure 23: Difference aom District, Percent of Students Mastering TAAS MinimumRequirements for All Test Areas, ETDS, Grade 4, 1993 27
Figure 24: Percent of Grade 4 Students Taking TAAS, ETDS, 1993 27
Figure 25: Difference from District, Percent of African American Students Mastering TAASMinimum Requirements for All Test Areas, ETDS, Grade 4, 1993 28
Figure 26: Difference from District, Percent of Hispanic Students Mastering TAAS MinimumRequirements for All Test Areas, ETDS, Grade 4, 1993 29
Figure 27: Difference from District, Percent of Economically Disadvantaged Students MasteringTAAS Minimum Requirements for All Test Areas, ETDS, Grade 4, 1993 29
Figure 28: Difference from District, Percent of White Students Mastering TAAS MinimumRequirements for All Test Areas, ETDS, Grade 4, 1993 30
Figure 29: At-Risk Percent Comparison 1992 Summer School Students and 1991 and 1992
School-Year Students 31
Figure 30: 1992 Summer School Students, ROPE Scores by Test Area, ETDS 32
Figure 31: ETDS Three-Year Program Goals 33

92.31 Ektnentary Technology Demonstration Schools, The Third Year. 1992-93
CONCLUSIONS AND RECOMMENDATIONS
The 1992-93 school year was the third year of the ETDS program and the second full year ofclassroom technology implementation. After three years of program implementation, 9 out of 10ETDS teachers thought that the technology benefitted their students, and 8 in every 10 wouldrecommend that technology be implemented districtwide. Overall, the ETDS are beginning to showpositive growth in student achievement and teacher attitude; however, additional effort will berequired to implement the program fully.
Portions of the program at the IBM schools are nearing full implementation. Several problems thatinhibit full implementation include: the class reporting option, which is not consistently operating asrequired to provide reliable feedback to teachers concerning degree of student computer usage; manyteachers not using the telephones as recommended, because of differing principal expectations; theinconsistent implementation of the computer take-home program; the incorrect procurement of newsoftware by one school; and the lack of parent and community involvement in school activities.
Results are mixed on the effect of the impact of technology on student achievement. Report onSchool Effectiveness (ROSE) results demonstrate that Galindo exceeded the predicted gain on threescores (30%) and equalled the predicted gain on seven scores (70%), while the IBM schools exceededthe predicted gain on three scores (10%), were below the predicted gain on six scores (20%), andequalled the predicted gain on 21 scores (70%). However, results were more positive on the TexasAssessment of Academic Skills (TAAS). The three IBM schools reduced the number of grade 3students failing a section of TAAS and increased the number of students passing the writing section.Two schools reached the 50% reduction goal in one subject area. Langford reduced the number ofstudents failing mathematics from 28% to 12%, and Patton decreased the number of students failingwriting from 20% to 8% during the three years of program implementation.
On the grade 3 TAAS, African American and economically disadvantaged students at Ar.drews andLangford, and Hispanic students at Andrews, Galindo, Langford, and Patton, were performing athigher levels on TAAS than other African American, Hispanic, and economically disadvantagedstudents districtwide. Grade 4 TAAS scores show that African American students at Andrews areperforming equally with African American students across the District. Hispanic students at Pattonare performing well above other Hispanic students districtwide. Economically disadvantaged studentsat Andrews, Langford, and Patton are performing better than other economically disadvantagedstudents across the District.
In addition to the A+ ETDS, most schools in AISD are using computers for instructional purposes.There are a variety of settings, modes, and levels of use at elementary, middle/junior high, and highschool levels. No effort has been made at the District level, to determine how technology is used and
how it affects student performance.
Based on the information contained in this report, ORE recommends:
1. A districtwide evaluation of the availability and use of technology should be conducted. The
four ETDS could be evaluated in this context.

92.31 Elementary Technology Demonstration Schools, The Third Year, 1992-93
2. The class reporting option or another measure should be used to provide reliable feedback toteachers concerning degree of student computer usage.
3. Additional telephone training for teachers is needed to demonstrate how to record, change,and retrieve messages.
4. Additional efforts should be made by administrators, teachers, and A+ Coalition staff toinclude parents and community stakeholders in the school decision-making process.
5. The Information System Architecture principles must be followed when selecting additionalsoftware, so that AISD will not have a collection of random, unsupported, noneducationalsoftware.
2
i ii

92.31 Elernennuy Technology Demonatration Schools. The Third Year. 1992-93
INTRODUCTION
The Elementary Technology Demonstration Schools (ETDS) program of Project A+ (now the A+Coalition) began in the Austin Independent School District (AISD) in the 1990-91 school year. Thisis the third evaluation report for the program. See Project A+ Elementary Technology DemonstrationSchools, 1990-91: The First Year (ORE Publication No. 90.32) and Project A+ ElementaryTechnology Demonstration Schools, 1991-92: The Second Year (ORE Publication No. 91.30) forevaluations of the first two years of the program.
The A+ Coalition, an AISD/IBM initiative established in the spring of 1989, is designed to improvethe District's educational environment by acting as a catalyst for change and marshalling communityresources. IBM became involved in the A+ Coalition, which is part of its nationwide efforts toimprove education, through its participation in the Washington-based Business Roundtable. TheRoundtable, an association in which the 200 largest corporations examine public policy issues, has
decided to focus on education.
The primary purpose of the ETDS program is to restructure the classroom learning environmentusing technology as the catalyst for change. To demonstrate the effectiveness of technology inaccelerating the learning of low-achieving students and enhancing the education of high-achievingstudents, the program plan contained four specific goals:
1. In three years, reduce by 50% the number of students who are not in their age-appropriategrade level;
2. In three years, reduce by 50% the number of students who are not achieving on grade level inreading, writing, and mathematics;
3. Develop a comprehensive teacher training program to ensure effective implementation and
classroom use of technology; and,
4. Demonstrate to the community the educational benefits of technology, thereby obtaining
support for districtwide implementation.
In 1990-91, Andrews, Langford, and Patton received computer equipment and software from IBMwith a retail value of $4.4 million. The three campuses also received an additional upgrade (retailvalue of $2.4 million) of wiring for a 16 megabyte token ring and additional hardware and softwarein 1992-93. These grants are the largest the company has ever made to a school district. Galindoalso received computer equipment and software with a retail value of $74,000 from Apple, Inc.
The original program plan stated that the ETDS program would continue for three years. However,when a technical upgrade was conducted at the beginning of the 1992-93 school year, the programwas extended. The extension will allow for the installation of Writing to Write' forms Ill and IV andKids Ware at the IBM schools during the 1993-94 school year. The program plan also mandated that
an Instructional Technology Coordinator be appointed to assist the ETDS. The coordinator developedand organized training, and provided technical, curricular, and managerial support to the schools.
3
1 1

92 .31 Elementary Tmlanology Demonstration Schools, The Third Year. 1992-93
Schools involved in the program do not use uniform instructional methods. The IBM schools pursueda mixed approach that included placing computers in the classroom, in addition to computerlaboratories. The program design called for the classroom computers to be integrated into instructionthrough a centers-based approach, where groups of four or five students rotate through severallearning stations. One of these stations is the computer station. Galindo pursues a strategy of placingcomputers in laboratories. Galindo had three computer labs, one dedicated to writing activities, andthe other two Minnesota Educational Computer Corporation (MECC) Management Master labsutilized for basic skills acquisition.
Information for this report was obtained from computer log data, Iowa Tests of Basic Skills(ITBS)/Norm-referenced Assessment Program for Texas (NAPT) and TAAS student achievementdata, staff interviews, observations by ORE staff, and the 1993 ORE Coordinated Survey.
The report is divided into three sections. The first section evaluates the implementation of theprogram based on the Level of Implementation Instrument developed by the A+ Coalition TechnologySchool Steering Committee. The second section will examine student achievement, and the finalsection will measure the progress toward the four specific ETDS program goals.
PROGRAM IMPLEMENTATION COMPONENTS
This section of the report examines the level of program implementation reached as of the 1992-93school year, using the Level of Implementation Instrument. This instrument provides a frameworkfor implementing technology into AISD schools. The instrument provides feedback to planners,decision makers, and teachers, which is helpful in planning strategies for achieving or maintaining fullimplementation of restructuring using technology. The instrument focuses upon components that mustbe affected by restructuring for increased learning to occur. These components not only areindicators of success but arP also egcert;-t goais of the program. The instrument is concerned withthe overall effects cf re,"--,:auring, and not any site-specific or hardware-dependent aspects ofrestructuring. This instrument is an attempt to get at the deeper processes occurring duringtechnology implementation and maintenance of the restructuring effort rather than surfacecharacteristics.
The instrument was developed by the A+ Coalition Technology School Steering Committee, whichconsisted of 10 teachers from the ETDS, the Instructional Technology Coordinator, an A+ Coalitionrepresentative, and two ORE staff. The instrument components were developed throughbrainstorming activities, and by a sorting and organizing procedure done by a smaller group.Descriptive paragraphs have been written about the theoretical beginning and ideal states ofimplementation (see Figure 1).
4

92.31 ameba ly Taint., logy Dancestratiaa Schook, Thc Third Ycar, 1992.93
FIGURE 1THEORETICAL MODEL FOR STATES OF TECHNOLOGY IMPLEMENTATION
Component Beginning State Ideal State
Teachers asLearners andFacilitators
Teachers are lecturers and controllersof information. The implementationof technology into the classroomrequires the teacher to change rolesfrom lecturer to facilitator, with thestudents as the learning motivators.
The teacher is comfortable with saying "I do not know,"and having the students fmd the answer to teach everyoneelse in the class. Computers become an integral part ofteaching, and most teachers find it difficult to imagineteaching without computers. Teachers also work in acollaborative format to design teaching strategics for allstudents.
Students asIndependent,Motivated,and Self-RegulatedLearners
Students are highly motivated, but areentirely teacher-dependent.
Students become software users and software- dependent.Continued progress leads students to explore softwareindependently. As they continue to develop theirindependence, students integrate the science of technologyinto their learning system, extend their knowledge into newand varied areas, and are accountable for their own workand outcomes.
Tools Computers are used minimally, as thehardware is not accessible to all.
A wide range of instructional technological tools isaccessible. The technology is reliable and transparent to theend user, and is available 24 hours a day. Also, severalpackages of age- appropriate software are available.
InstructionalEnvironment
The instructional environment isteacher- controlled and skill-driven,instruction remains textbook-driven,and whole group instruction ispredominant. The teacher frequentlylectures, asks questions, and elicitsanswers from one student at a time.The classroom is generany quiet andvery orderly with little movement, asinteraction between students isdiscouraged.
The instructional enviromnent shifts from being textbook-driven to being student- and technology- driven, andrevolves around thematic units and integrated subject areas.A higher level of noise is expected as cooperative learningoccurs. Student groupings are fluid and often nongraded.Students' natural curiosity is buoyed as they use availableresources to work on individual goals and needs. Allparticipants are learners and instructors.
Physical andLogicalStructureof theClassroom
The classroom is arranged with rowsof desks, and there are no learningcenters.
The classroom has been restructured with learning centers.The classroom should stimulate interest, and a wide varietyof resources is available so that 100% of the students willbe reached regardless of level or learning style.
5
t 3

92.31 Ekmentaxy Technology Demonstration Schools, The Third Year, 1992-93
FIGURE 1 (cont.)
Component Beginning State Ideal State
Necessary Training on how to implement Teachers receive formal training just prior to the installationSupport technology is minimal, and teachers of new hardware or software, and again as needed duringSystems rely on the computer lab instead of the school year. This training includes implementation of
restructuring classrooms. Teachers time-saving tips, new software applications, and otherreceive most of their measurement subjects deemed necessary by teachers. Informal trainingand evaluation information from also occurs as other teachers and students introduce newoutside sources, and this evaluation software programs or time-saving tips. Also, teachers willinformation is often regarded as a evaluate in an ongoing manner the effectiveness of theirjudgement and not as useful feedback. hardware, software, and instructional strategics as well as
receive useful evaluation information from other sources.This information will be used to make positive change: tothe ETDS program.
Parents, Parents are minimally involved in the A large number of parents is involved in all aspects of theCommunity,and Other
school. Parents participate mainlythrough discipline activities. There is
school. All classes have adequate parent volunteers, andparents with special areas of expertise are utilized
Stakeholders a small PTA executive committee,and the same small group of parents
campuswide. Teachers contact parents for positive as wellas negative information sharing. There is an active and fully
is involved in most school activities. functioning PTA that emphasizes parent training.Community members have minimalcontact with school personnel, mainly Community members have active representation on thethrough complaints about noise,parking, suspected vandalism, etc.
Campus Leadership Team and are contributing time,resources, and talents to the schools. They believe that
Other stakeholders such as adopters whether or not they have students in the school, the schooland mentors have minimal interaction is open to them. For example, neighborhood associationwith the school. Adopters mainly meetings arc held at the school, or night classes are offeredcontribute money and supplies and do that would be of interest to adults as well as children in thenot have much personal contact with community. Other stakeholders such as adopters interactteachers or studcnts. There are only more with the students on a personal basis (e.g., they act asa few mentors throughout the a substitute teacher for a teacher to attend in-scrvice trainingDistrict, or tutor students on a regular basis).
PROGRESS TOWARDS THE "IDEAL" STATES OF IMPLEMENTATION
The following section will evaluate the progress that the campuses have made towards attaining thetheoretical implementation ideals mentioned above. The data used to evaluate progress towards theideal states were gathered through teacher surveys and interviews, classroom observations, andcomputer log data. An attempt to attain observation data at the four ETDS and three non-ETDS usingseven University of Texas graduate students was inconclusive. No concrete conclusions may bedrawn from these observations because of their short duration and the nonrandom selection of theteachers observed. The teachers observed were not randomly selected by the researchers, but wereassigned by the Instructional Technology Coordinator.
Teachers as Learners and Facilitators
One study has shown that it takes "on average five to seven years for a teacher to become acomfortable, confident user of educational technology." By the fifth year, use of drill and practice
6

92.31 Ekenenhuy Technology Demounration Schools. The Third Year, 1992-93
and tutorial software decreases, and teachers begin to expand the number and types of classroomtechnologies (Telecommunications and Teachers, 1993).
Observations by ORE staff showed that some teachers at the ETDS seem to be learners andfacilitators. Many teachers create programs to extend and enrich lesson plans beyond textbooks, usestudents to solve hardware and software problems, and experiment if they do not know the answer.However, a few teachers remain lecturers and controllers of information.
The observations also showed that many teachers at the ETDS utilized the cooperative learningmethod to eacourage student learning. They gave information about the task and then guided thestudents if they drifted off-task. The teacher did not lead the students step by step through thelessons; guidance was provided by the computer, partners, worksheets, or the students' own initiative.
The teacher spent time tutoring students individually.
Many teachers were comfortable in the role of the facilitator, and thought that classroom technologyhas made their teaching more effective. Three in four teachers, 73%, agreed or strongly agreed onthe 1993 ORE Coordinated Survey that technology in the classroom made their teaching moreeffective, up from 61% and 69% in previous years' surveys. A few teachers, 5%, believed that thetechnology has not made their teaching more effective. See Attachment lA for survey results.
Students as Independent, Motivated, and Self-Regulated Learners
According to teachers, most students are in the middle of technology implementation. Students enjoyworking together to solve problems, explore software, and to develop answers to questions that theteachers cannot answer; however, they are not yet aware of their own learning styles which allowsthem to adjust assignments to meet their own needs.
Teachers believe that today's students at the ETDS are more independent and self-regulated learnersthan previous students. Observations by ORE staff show that students work in groups and are awareof what they are expected to accomplish. They accomplish tasks via computer, with peers, or ontheir own. When a problem arises they ask their classmates, utilize reference material, or as a last
resort, ask the teacher.
Tools
The hardware and software at Galindo have been fully installed for three years. The IBM schools arenearing the ideal state of hardware and software implementation; however, the limitations discussed
below inhibit full implementation.
Class Reporting Option
The IBM-networked equipment features a class reporting option (logging system) to track computerusage by students. Galindo, the Apple school, has class reporting capability, but it is not included inthis analysis because data could not be converted and uploaded onto the District local area network(LAN) for analysis. To use the class reporting option, teachers create student menus for theirclassrooms by selecting software and inserting it in the menu under the appropriate subject, such as
7

92.31 Elementary Technology Demonstration Schools. The Mint Year. 1992-93
mathematics or reading. The teacher then decides whether or not to log the software. When startinga computer session, students log on by entering their AISD identification number. The classreporting option then automatically records the time in, the time out, the name of software used, andthe accuracy of the student on a given task.
The laboratory technicians downloaded the class reporting option data every two weeks, and theevaluation associate analyzed the log data for administrators and teachers. The evaluation associateprovided feedback to teachers and administrators each six weeks. The feedback included informationon teacher time on computers by subject, total time on computers per student per six weeks, softwareanalysis, and nonschool hours analysis. See Attachment 2 for sample information provided toteachers and administrators.
The class reporting system (logging system) encountered several problems during the year. Themajority of the problems could be classified as technical problems which included rewiring downtime,system upgrades which erased logs, and loss of log data because of download failures and damagedcomputer disks.
The class reporting option has several other limitations. The reporting system can log only onestudent identification number for paired students, giving only one student at a time "credit." Studentscan log on under only one teacher's name (i.e., for teachers who team teach, only one teacherreceives the computer time). Schools are purchasing additional software and using stand-alonecomputers which are not networked or logged. Attachment 3A is a list of the 39 approved softwareprograms capable of being logged, while Attachment 3B is a list of the 34 programs which the IBMschouls have added and are attempting to log. Attachment 3C is a list of software available atGalindo.
Teachers at one school said additional software was being attained from different computer networksand computer stores by the laboratory technician and the school principal. During interviews,teachers said they were uncomfortable with the new software because a new program was added everyone or two weeks, they were unsure of how to use the software, and they were uncertain of thesoftware's educational benefit. The AISD Ir.formation System Architecture details principles forsoftware selection, and these principles were not being followed at this school. If the principles arenot followed AISD will have a selection of random, unsupported, noneducational software.
These limitations added uncertainty to the information provided by the class reporting system. Manyof the campus teachers and administrators expressed strong disagreement with the times the logsshowed. The class reporting option showed that average minutes per day on computers ranged from18.5 minutes to 5.8 minutes. See Figure 2 for the average minutes per day on computers at all IBMschools. Because of the uncertainty associated with the logs, the absolute times on task shown inFigure 2 and Attachment 4A-C should be interpreted with caution.
8
6

92.31 Elementary Technology Demonstration School.. The TWA Year, 1992-93
FIGURE 2AVERAGE STUDENT MINUTES PER DAY ON COMPUTERS
AT ALL IBM SCHOOLS, 1992-93
35
30 -
25
20
15
10
5
0
18.5
5.8
11.5
1St 2nd 3rd 4tti
Six-Weeks Period
5th 6th
Grade 1st six weeks* 2nd six weeks 3rd six weeks** 4th six weeks 5th six weeks** 6th six weeks
K 8.0 4.5 5.6 11.7 5.6 11.8
1 27.9 23.2 16.0 18.6 8.9 15.5
12.7 13.6 24.1 12.4 3.3 12.3
18.2 11.5 9.0 9.4 5.4 10.7
27.2 11.0 13.7 9.4 5.1 10.2
5 16.9 10.3 10.8 11.0 6.0 8.8
All 18.5 12.5 10.8 12.0 5.8 11.5
* Logging systems were operational for four to 18 days.** Teachers were removed from the analysis because of incomplete downloads, damaged disks, and downed servers.
Several attempts were made to obtain an accurate accounting of computer usage. In one attempt,several high-end-use teachers were selected by the Instrmtional Technology Coordinator, and theseteachers were observed for one day to determine use patterns. Figure 3 shows how these high-useteachers utilized computers during one day. Because of the brief observation period and thenonrandom selection of teachers, the numbers shown in Figure 3 should be treated with caution.These numbers suggest that students of high-end-use teachers averaged between 23 to 39 minutes per
day on the computer.
9
1 7

92.31 Elementary Technology Demonstration Schools, The Third Year, 1992-93
FIGURE 3OBSERVED MINUTES PER DAY ON COMPUTERS AT
TWO IBM SCHOOLS, 1992-93
Number of Students Minutes on Computer
1
Sch ol A
10 students 14 minutes
11 students 17 minutes
All students 15 minutes
All students 45 minutes (Lab,once a week).
School B
All students 45 minutes (Lab,once a week)
8 students 28 minutes
5 students 10 minutes
4 students 75 minutes
2 students 15 minutes
Take-Home Computers
The three IBM schools began implementing a parent take-home computer program during the 1991-92school year. The program allowed selected students to take home computers loaded with specificinstructional software designed to accelerate the students' learning. Each campus implements thisprogram differently.
Evaluation of the effectiveness of the take-home computers is difficult because the schools controlusage of these computers. According to the principals, however, the program has not beenimplemented as it was designed. Schools use the computers to train new students when they enter the
school, and one school had 25 families participate in a take-home computer program. However,another school has returned many of the computers designated for take-home use to the classroom.
Telephones
The original program plan proposed to place telephones in every classroom to facilitate parent-teachercommunications. The telephone system was operational in all ETDS at the beginning of the 1992-93school year. Patton encountered telephone problems beginning in December when lightning struck acircuit board that controlled telephone activity. The circuit replacement was a costly and time-consuming task, which was not completed by AISD staff until late May. Telephones in Patton's
10

9rc.31 Elementary TechootorDanociatratioaSchools. Thellird Year, 199245
portable buildings were not operational during spring 1993. However, teacher mailboxes were still
active for teachers to record and retrieve messages.
ORE conducted several surveys throughout the school year to determine how teachers were using thetelephones. Over 50% of teachers at Galindo and Langford used the telephones as intended, leavingdaily or weekly homework assignments and classroom activities on their voice mail message. Parentscould call into the voice mail message, listen to the assignments or activities, and leave a message forthe teacher. Only 18% of the teachers at Patton and very few teachers at Andrews recorded personalmessages containing homework assignments and classroom activities.
On the 1993 ORE Coordinated Survey, teachers were asked if a classroom telephone helped thembetter communicate with parents. The vast majority of teachers, 87%, agreed or strongly agreed thatthe telephone helped them to communicate better with parents. Because of the technical problemsmentioned above, 9% of the responding teachers did not have working phones (see Attachment 1B).
Instructional Environment
Observations and interviews revealed that, although the majority of teachers are implementingclassroom technology, some teachers are still resisting change. Several teachers said that the best useof computers was for practice problems, repetition, and the building of social skills. Attempting toincrease computer usage, these teachers believed, caused students to miss out on science and socialstudies units created by the teacKer. The teachers also said the lab time was the most effectiveutilization of the computers, because in class there was not enough time to take advantage of all thesoftware available, and when the class was divided into three groups, the groups not at the computer
needed attention or else they lost interest.
The ETDS program was designed to integrate the computers into the curriculum. Responses such asthe ones above indicate that more work is needed to integrate technology into the learningenvironment fully. Not all teachers thought the same as the previously mentioned teachers, however,and many portions of the classroom instructional environment were changing with technologyimplementation. Most teachers, 79%, thought that technology facilitated curriculum integration into
the learning environment (see Attachment 1B).
Observations by ORE staff showed that teachers were also using collaborative groups, and students
learned from each other as well as from the teacher. The majority of teachers said that the mosteffective group occurs when students have differing abilities. Teachers believed the implementationof technology also helped students in many other ways. The majority of teachers, 81%, believed thatthe addition of technology into the learning environment allowed them more time to provideindividualized instruction to students. Also, two out of three teachers thought that the technologycurrently facilitates effective evaluation of students. See Attachment 1B for survey results.
Physical and Logical Structure of the Classroom
This report examines the role of technology and computers in relation to student learning. Thecomputers are important to the success of the program, but they must properly be viewed as only one
11
!_9

92.31 Ekmentary Technology Dernonstration Schools. The Third Year. 1992-93
part of an overah effort to enhance stud?.nt learning. Another integral part of the overall programeffect is restructuring the classroom and the school to maximize technology in accelerating learning.
ORE staff observations showed that the classroom structure in the ETDS is changing. Manyclassrooms were open settings, with student desks grouped together. The main focus of the classroomwas not the blackboard or the teacher's desk, but the students. The learning centers were apparentand in use. In many classrooms, there were signs and figures for the usage of basic computerfunctions, such as how to log on and use the function keys. There were also bulletin boards forannouncing the weekly theme of Writing to Write and displaying writing samples.
Necessary Support Systems
Not all portions of necessary support systems have reached the ideal level of implementation.Teacher training is the most implemented portion of necessary support systems. Initial training wasprovided to teachers during 1990-91, with follow-up training provided as necessary. New ETDSteachers were trained prior to the new school year and once a month throughout the year. Informaltraining was also provided by campus experts. Teachers also reported that they often learned time-saving tips or new computer programs from students. Since November 1992, Andrews has alsoreceived weekly instruction from an Education Instruction Specialist to help teachers integratetechnology into the classroom.
On the 1993 ORE Coordinated Survey, most teachers, 72%, said they received sufficient training toincorporate technology appropriately into the classroom learning environment. This percentage washigher than the 66% and the 61% who believed they had received sufficient training in 1992 and1991, respectively. Only one in ten teachers said that he or she had not received sufficient training, adecrease from one in five teachers in 1991. See Attachment 1A for specific findings.
Several teachers said they believed more grade-specific training was needed (i.e., grade 1 teachersneed more specific training with grade 1 software). The District Instructional TechnologyCoordinator is available to organize specialized training activities.
Parents, Community, and Other Stakeholders
Principals reported increased parental interest in their children's scholastic activities, increasedparental visitation to the schools, and increased community interest since the program's initiation.However, the ideal implementation state has not been reached as several parents said that they weredisappointed with how slow the schools were to change to include parents and the community inschool activities.
STUDENT ACHIEVEMENT
This section details changes in student achievement through the three years of programimplementation using ITBS/NAPT, ROPE/ROSE, TAAS, and summer school data.
2

92.31 Elementnry Technology Demonstration Schools, The Third Year, 1992-93
ITBSINAPT
During the 1992-93 school year, elementary schools administered the Iowa Tests of Basic Skills(ITBS) and the Norm-referenced Assessment Program for Texas (NAPT), both norm-referenced tests(NRTs). The ITBS was given to grades 1-2, and the NAPT was given to grades 3-5. An NRT isdesigned to measure student achievement in broadly defined skill areas that cover a wide range ofachievement. Scores from NRTs (e.g., percentiles and grade equivalents) compare a student'sperformance with a nationwide sample of students at the same grade. National norms provided by thetest publisher are used. Attachment 5 displays 1991-92 and 1992-93 ITBS and NAPT test scores by
ethnic group at the four campuses (1992 norms).
At Andrews, grade 1, 2, and 5 students scored slightly lower than students in the previous year.Grade 3 and 4 students scored higher in 1992-93. At Galindo, grade 1, 2, and 4 students performedbetter than in previous years. Grade 3 students' scores decreased in reading and language whileincreasing one percentile point in mathematics. Grade 5 students' scores consistently decreased acrossall subjects and ethnic groups. At Langford, grade 1, 2, and 4 students' scores increased, whilegrade 3 and 5 students' scores decreased. Grade 1, 3, 4 and 5 students at Patton attained increased
scores, while grade 2 students demonstrated slightly decreased scores. Overall, at all four campuses,Hispanic students consistently scored higher on the ITBS/NAPT in 1992-93 than in previous years.
See Attachment 5.
ROPE/ROSE
The ETDS differ on many factors, and to compare achievement scores directly could be misleading.The Report on Program Effectiveness (ROPE) and the Report on School Effectiveness (ROSE)provide a more accurate interschool comparison of achievement results. ROPE/ROSE giveinformation on how each school's students perform on standardized tests (NAPT/ITBS) from one year
to the next in relation to similar students across the District. The reports combine the individualscores of each student in a school program. ROPE/ROSE adjust the scores for factors out of theschool's control (i.e., sex, previous achievement, ethnicity, income level, and age in grade) before
making the comparison.
ROPE/ROSE compare students' actual scores with a predicted score for each student. The difference,called a residual, is an indication of how far above or below prediction a student performed on a testcompared to students with similar characteristics. The residuals of all students in a program arecombined to create a program's ROPE score. The residuals ofall students at a school are combined
to create a school's ROSE score.
Three ROSE results are possible: exceeded predicted gain, achieved predicted gain, and belowpredicted gain. A score of achieved predicted gain indicates that an additional program (classroomtechnology) had no effect on student achievement above and beyond everyday classroom teaching. Ifthe results exceed predicted gain, one can conclude that the program had a significant impact onstudent achievement. If the results are continually belowpredicted gain, the program may need to bereexamined. A score exceeding or below predicted gain is based on a statistical test to determine if
the residual is significantly different from zero.
13

92.31 Elementary Technology Demonstration Schools. The Third Year. 1992-93
This section presents the ROPE/ROSE scores for the four campuses. ROPE/ROSE generate scoresonly on students who took standardized tests the previous year; therefore, kindergarten and grade 1students are not included in the results.
ROSE Scores and Comparisons
Figure 4 displays ROSE scores for the three years of program implementation. One way to analyzeROSE scores is to evaluate how a school performed in relation to the predicted gain for that school.
FIGURE 4ROSE SCORES BY TEST AREA, ETDS, 1990-93
ANDREWS GALINDO LANGFORD PATTON
90-91 91-92 92-93 90-91 91-92 92-93 93-91 91-92 92-93 90-91 91-92 92-93
Grade 2Reading 0 0 0 0 0 0 0 0 - 0 + -Mathematics 0 0 0 0 0 + + + - 0 0 -Language n/a n/a n/a n/a n/a n/a n/a n/a n/a n/a nla oh
Grade 3Reading + 0 0 0 0 0 + 0 0 0 0 0Mathematics + 0 0 0 0 + 0 0 0 - 0 +Language nla nit' n/a n/a n/a n/a n1a n1a nit n/a n/a lila
Grade 4Reading 0 0 0 0 0 0 0 0 0 0 0 0
Mathematics - - 0 0 0 + - 0 0 0 + +Language - - 0 0 - 0 - 0 0 - 0
Grade 5Reading 0 + 0 0 + 0 0 + 0 0 - 0Mathematics 0 0 0 0 + 0 0 0 0 0 0 0
Language 0 0 0 0 0 0 0 0 0 0 -
NOTE: The District switched to NAPT from 1TBS in 1991-92 for grades 3-5. The NAPT does not measurework.-itudy skills, so these scores from previous years have been dropped from this report.
KEY
0 Achieved Predicted Gain - Below Predicted Gain+ Exceeded Predicted Gain n/a Test not Given
Each school received 10 scores--two each in grades 2 and 3 and three each in grades 4 and 5. Thebreakdown of the scores is provided in Figure 5. Andrews equalled predicted gains on all 10 scores,Galindo exceeded predicted gains on three scores and equalled predicted gains on seven scores,Langford was below predicted gains for three scores and equalled predicted gains on seven scores,and Patton exceeded predicted gains on three scores, was below predicted gains on three scores, andequalled predicted gains on four scores.
14
0 9

92.31 Elementary Tecianokly Demonstration Schools, The Third Year, 1992-93
FIGURE 5COMPARISON OF ROSE SCORES, ETDS, 1992-93
ANDREWS GALINDO LANGFORD PATTON
Exceed Predicted 0 (0%) 3 (30%) 0 (0%) 3 (30%)
Below Predicted 0 (0%) 0 (0%) 3 (30%) 3 (30%)
Equal Predicted 10 (100%) 7 (70%) 7 (70%) 4 (40%)
191k2- Lgnjj_192e2,3_j_QSLC,gmparaQ_Z n
Another way to look at the ROSE scores is to compare this year's scores with last year's scores.This comparison indicates movement among the three possible categories (for example: groups thatmoved from below predicted gain to equal predicted gain). This group improved its score but did notexceed the predicted gain. A comparison of the two scores credits this improvement and showsprogress toward achieving the level of exceeding predicted gain.
Out of 10 comparisons at the Apple school (Galindo), from 1991-92 and 1992-93:4 were up (40.0%),2 were down (20.0%), and4 were same (40.0%).
Out of 30 comparisons at the IBM schools (Andrews, Langford, Paaon), from 1991-92 and 1992-93:5 were up (16.7%),8 were down (26.7%), and11 were same (56.7%).
No change occurred in most of the comparisons: 40% of Galindo comparisons remained constant,and 57% of the IBM school comparisons remained constant. Galindo registered a higher percentageof change (60%) than the IBM schools (43%).
There were more changes this year than last year at both groups of schools. At Galindo, the numberof positive changes doubled from two in 1991-92 to four in 1992-93; however, the number ofnegative changes also doubled to two in the same time frame. At the IBM schools, the number ofpositive changes decreased from seven to five, while the number of negative changes increased fromfive to eight. Overall, this comparison does not reveal an unqualified pattern of improvement.
Thakyor_ERE_Sorsaind_Cilmoirtuna
ROPE, by looking only at students who have been influenced by the technology program forconsecutive years, may be a better indicator of program effect than ROSE. To create the three-yearROPE score, a report for students who have recorded ROSE scores a: the same elementary schoolsfor three consecutive years, from 1990-91 to 1992-93, was generated. Under this condition, onlygroups of students in grades 4 and 5 in 1992-93 were large enough to meet the statistical requirementof having a minimum of 25 students to be included in this study. Figure 6 displays ROPE results.
15

92.31 Ekmentary Technology Demonstration Schools, The Third Year. 1992-93
The ROPE scores are mixed on the impact of computers on student achievement. Although 63% ofthe scores achieved the predicted gain, 25% were below the predicted gain, and 13% exceeded thepredicted gain. These percentages are down from 1991-92 when 84% of the scores achieved thepredicted gain, 4% were below the predicted gain, and 12% exceeded the predicted gain.
FIGURE 6THREE-YEAR ROSE SCORES, 1992-93
Andrews* Galindo Langford* Patton
Grade 4Reading 0 0 - 0Mathematics + 0 +Language o o - +
Grade 5Reading o o o oMathematics 0 0 - 0Language 0 0 - -
* In grade 4, at Andrews, only 22 students took reading and 24 took the language test for three consecutive years.In grade 5, at Langford, only 24 students took the reading and mathematics tests for three years. Because thesenumbers are below the minimum of 25, these results should be interpreted with more caution.
KEY
0 Achieved Predicted Gain - Below Predicted Gain+ Exceeded Predicted Gain
Correlation Between Computer Time and Student Achievement
To test the hypothesis that an increase in logged computer time led to achievement improvement,regression and correlation analyses with ROSE residuals as the dependent variable and loggedcomputer time in a particular subject as the independent variable were performed. This analysis wasrun for each subject at each school. The analysis should tell if any statistical relationship existsbetween the two variables. The expectation is that a positive relationship exists; that the higher astudent's time on the computer in a given subject, the better the student scores in relation to thepredicted gain.
The analysis showed no statistically significant relationship between the two variables. The failure ofthis analysis to confirm the expectations does not prove the expectations are invalid. Other factors,such as the uncertainty surrounding the logged computer times, and the small sample may havenegatively influenced the analysis.
In sum, the ROPE/ROSE comparisons are mixed regarding the effect of technology on studentachievement at the four campuses.
16

92.31 Becnentery Technology Demonstretion Schools, The Third Year, 1992-93
TAAS SCORES
The Texas Assessment of Academic Skills (TAAS) is a criterion-referenced test (CRT) which isdesigned to measure a well-defined set of skills and to reference students' scores to a masterycriterion for that set of skills. The skills are a subset of the Essential Elements adopted by the StateBoard of Education. TAAS was given to grade 3 students during fall 1992 and to grade 4 students in
spring 1993.
Grade 3 TAAS Scores
Grade 3 students took the TAAS in October of each year. Since the test was given so early in theyear, when students had been in their current grade level for only eight weeks, TAAS reflects thestudent achievement for the previous year more than the current year. Therefore, the fall 1992 grade3 TAAS scores may be considered as a measure of two years of program implementation.
Figure 7 presents TAAS mastery scores for 1990-91 through 1992-93. Scores should be comparedwith caution, as there are student factors beyond the schools' control, different students took the testeach of the three years, and problems have existed with scoring the writing section.
The three IBM schools increased the number of students passing all TAAS tests, while Galindodecreased the number of students passing all tests. Andrews, Galindo, and Langford were below theDistrict average and Patton was above the District average for the number of students passing allTAAS tests. See Figures 8-11 for school difference from the District.
FIGURE 7TAAS PERCENT MASTERY, GRADE 3, ETDS, 1990-92
IAndrews I Galindo Langford 1 Patton 1 A1SD
Writing
1990 54 67 62 75 64
1991 53 68 35 86 61
1992 61 66 62 92 67
Reading
1990 64 78 73 93 80
1991 62 81 81 93 81
1992 69 72 77 94 77
Mathematics
1990 71 85 70 93 82
1991 73 90 89 97 87
1992 72 90 88 96 82
17
t-)

92.31 Bementary Technology Demonstnnioe S,..6c,c1s, The Third Year. 1992-93
FIGURE 8DIFFERENCE FROM DISTRICT, PERCENT OF STUDENTS MASTERING TAAS
MINIMUM REQUIREMENTS, ANDREWS, GRADE 3, 1990-92
50
40
30 -
g 20
t10 -
ABOVE DIST1IICT0
BELOW DISTRICT
-10Math
a.-20
Reading
-301990 1491 1992
Andrews did not exceed the District average in any test area in 1990, 1991, and 1992.
FIGURE 9DIFFERENCE FROM DISTRICT, PERCENT OF STUDENTS MASTERING TAAS
MINIMUM REQUIREMENTS, GALINDO, GRADE 3, 1990-92
so
ao
30
20
10 Math
ABOVE DISTRICT_
Readlng BELOW DISTRICT
-10
-20 -
-301990 1491 1992
Galindo exceeded the DistTict averago ;,1 two test areas in 1990, two test areas in 1991 (equalled inone test area), and one test are:,
18
I 1

92.31 Ekmentary Technology Demonstration Schools, The Third Year, 1992-93
FIGURE 10DIFFERENCE FROM DISTRICT, PERCENT OF STUDENTS MASTERING TAAS
MINIMUM REQUIREMENTS, LANGFORD, GRADE 3, 1990-92
so-
40 -
30
20 -
10 -
-10
-23
-30
Flaading
1990
....... Math...... ...
WdtIng
1291 1092
ABOVE DISTRiCT
BELOW DISTRICT
Langford did not exceed the District average in any test area in 1990, exceeded in one test area in1991 (equalled in one test area), and exceeded in one test area in 1992 (equalled in one test area).
FIGURE 11DIF ERENCE FROM DISTRICT, PERCENT OF STUDENTS MASTERING TAAS
MINIMUM REQUIREMENTS, PATTON, GRADE 3, 1990-92
so -
40
30 -
2°10
0
-10
-20
-30
Math ABOVE DISTRICT
BELOW DISTRICT
1990 1991 1992
Patton exceeded the District average in three test areas in 1990, 1991, and 1992.
19
27 BEST CPY

92.31 Elementary Technology Demonstration Schools, The Third Year, 1992-93
In summary, Andrews is below the District average for all three test areas; however, during the lastthree years it has moved progressively closer to the District average in all test areas. During the lastthree years Galindo has moved from above the District average in writing to below the Districtaverage. In reading, Galindo students have moved from below the District average to equal theDistrict average in 1991 to below the District average again in 1992. In mathematics, Galindo hasremained above the District average. Langford has progressed from below the District average inreading and mathematics to equal the District average and above the District average, respectively. Inwriting, Langford remains below the District average. Patton remains above the District average inall test areas.
Academic Excellence Indicator System (AEIS)
AEIS produces two different reports concerning the academic progress of a school district. Ofconcern here is the second report, where each campus is compared to the 100 campuses in Texas thatare most "similar" to that campus. Each campus is compared to the average performance of thecomparison group. Figure 12 displays scores and changes from the four campuses.
FIGURE 12AEIS, DIFFERENCE FROM GROUP OF 100 CAMPUSES,
PERCENT OF STUDENTS MASTERING TAAS MINIMUM REQUIREMENTS, 1991-93
1991-92 1992-93 Change
AndrewsAll Tests -1.3 +8.4 +9.7Reading -11.6 -0.3 +11.3Writing -0.2 5.6 +5.8Mathematics -7.5 -5.6 +1.9
GalindoAll Tcsts +19.2 +5.9 -13.3Reading +7.4 0.0 -7.4Writing +13.9 +6.1 -7.8Mathematics +12.0 +10.4 -1.6
LangfordAll Tests -17.0 +5.7 +22.7Reading +6.1 +3.7 -2.4Writing -19.6 -0.9 +18.7Mathematics +6.7 +5.9 -0.8
PattonAll Tests +9.5 +7.5 -2.0Reading +0.3 +1.9 +1.6Writing +7.0 +7.9 +0.9Mathematics +1.4 +1.1 -0.3
For percent of students mastering the TAAS minimum requirements, from 1991-92 to 1992-93, allETDS were above their group average. Andrews and Langford increased student achievement whencompared with their groups' averages. Galindo and Patton lost ground when compared with their
20
e

92.31 Beracotary Technology Demonstration Schools, The Third Year. 1992-93
groups; however, they remained above the group average. For example, Andrews went from 1.3percentage points below its group in 1991 )2, to 8.4 percentage points above its group in 1992-93,for a net gain of 9.7 percentage points.
Writing Analysis
The 1992-93 TAAS results suggest improvement in writing achievement for grade 3 students atAndrews, Langford, and Patton. These improvements may be a positive sign for the ETDS and theWriting to Read' and Writing to Write" software. These grade 3 students are the first group ofstudents using classroom technology for two years. Figure 13 shows the growth of percent passingthe TAAS writing section.
When compared with the District average, Andrews' writing scores have steadily moved toward, butremain slightly below, the District average. Galindo's scores decreased to below the District average,while Langford's scores recovered from a significant decrease in 1991-92 to slightly below theDistrict average in 1992-93. The growth in Patton's scores equalled the growth of the Districtaverage.
FIGURE 13TAAS WRITING PERCENT MASTERY, GRADE 3,
ETDS, 1990-92
Andrews Galindo Langford Patton District
PA
Legend
1990-91
1991-92
1992-93
A closer look at the TAAS writing section from 1990-91 through 1992-93 suggests other writingimprovement. Figure 14 shows that from 1990-91 through 1992-93, Galindo and Langford increasedthe percentage of students scoring 3 or 4 on TAAS writing. A score of 4 is the highest scoreattainable on the TAAS writing test, and it shows mastery of all writing components. Galindo'sscores increased from 20% of students receiving a 3 or 4 score to 28%, while Langford rose from22% to 33%. Both campuses were above the 7 percentage point increase in District growth.Andrews' percentage of students scoring a 3 or a 4 decreased from 36% to 21%, while Pattondecreased from 72% to 67%.
21

92.31 Elementary Technology Demonstration Schools, The Third Year, 1992-93
FIGURE 14PERCENT OF STUDENTS SCORING 3 AND 4 ON TAAS WRITING, GRADE 3,
ETDS, 1990-92
Andrews Galkido Langford Patton
Ethnic and Economic Analysis
District
Legend
g 1990-911091-92
129-2-sa
In 1992-93, Andrews, Galindo, and Langford were below the District average of students masteringthe minimum TAAS requirements (see Figure 16). However, this comparison was not necessarilyequitable as the ethnic makeup of the District and these schools varies greatly. An analysis wasconducted which examined the number of minority and economically disadvantaged studentsmastering the minimum TAAS requirements at Andrews, Galindo, Langford, and Patton. If a schoolhad fewer than 10% of a certain ethnic or economic group who took TAAS, those students were notincluded in the analysis. Figure 15 shows the percent of students taking the TAAS test at each schoolfrom 1990 to 1992.
FIGURE 15PERCENT OF GRADE 3 STUDENTS TAKING TAAS, ETDS, 1990-92
Andrews Galindo Langford Patton District
1990 1991 1992 1990 1991 1992 1990 1991 1992 1990 1991 1992 1990 1991 1992
AfricanAmerican
73% 64% 59% 3% 7% 4% 20% 15% 14% 2% 4% 4% 19% 17% 19%
Hispanic 16% 24% 33% 56% 67% 76% 38% 49% 45% 13% 11% 12% 31% 33% 32%
White 7% 9% 8% 39% 20% 21% 42% 33% 38% 82% 82% 82% 47% 47% 47%
EconomicallyDisadvantaged
58% 38% 49% 66% 27% 69% 68% 44% 65% 4% 9% 1% 44% 39% 42%
All Students
(N)
84 80 75 94 70 118 65 75 65 166 148 156 4779 4812 4946
22
3 0

92.31 Elementary Technology Demonstration Schools, The Third Year, 1992-93
FIGURE 16DMERENCE FROM DISTRICT, PERCENT OF STUDENTS MASTERING TAAS
MINIMUM REQUIREMENTS FOR ALL TEST AREAS, GRADE 3, 1990-92
so-
40 -
30
20 -
id
-10
-20
-30
Galindo
_ ABOVE =TR=
aiELOw DISTRiCT
Andrews
1990 1991 1992
Comparing the African American, Hi5panic, and economically disadvantaged students at Andrewswith other African American, Hispanic, White, and economically disadvantaged students districtwide,the Andrews students showed improvement during the last three years, and were well above theDistrict average for 1992. Comparing Galindo's Hispanic and economically disadvantaged studentswith Hispanic and economically disadvantaged students districtwide, Galindo students showed adecrease in meeting the minimum TAAS requirements, but they were still above the District average.See Figures 17-20.
Comparing the African American, Hispanic, and economically disadvantaged students at Langfordwith African American, Hispanic, and economically disadvantaged students districtwide, Langfordstudents showed improvement to above the District average. Patton was closer in ethnic makeup tothe District than the above three schools. Comparing Hispanic students at Patton with the Districtaverage for Hispanic students, Patton was well above the District. White students at Patton were alsoabove the District for White students mastering the minimum TAAS requirements; however, thatpercentage decreased from 1991 to 1992. See Figures 17-20.
African American and economically disadvantaged students at Andrews and Langford; Hispanicstudents at Andrews, Galindo, Langford, and Patton; and White students at Patton were performing athigher levels on TAAS than other African American, Hispanic, and economically disadvantagedstudents districtwide. Andrews showed steady improvement in students mastering minimum TAASrequirements. At Galindo the percent of students mastering TAAS minimum requirements haddecreased during the last two years. In 1992, Langford increased the percentage of studentsmastering minimum requirements to 1990 levels. Patton showed a slight decrease during the last twoyears in students mastering the minimum requirements, but remained well above the District average.
23

92.M Elernanery Technology Demonstration Schools. The Third Year. 1992-93
FIGURE 17DIFFERENCE FROM DISTRICT, PERCENT OF AFRICAN AMERICAN STUDENTS
MASTERING TAAS MINIMUM REQUIREMENTS FOR ALL TEST AREAS,GRADE 3, 1990-92
so
40
30
20
10
-10 -
-20 -
-30
, langked
Andrews
ADOVE =AZT
. .. . . /./
/// BELOW 0131114T
1443 1991 142
FIGURE 18DIFF ERENCE FROM DISTRICT, PERCENT OF HISPANIC STUDENTS MASTERING
TAAS MINIMUM REQUIREMENTS FOR ALL TEST AREAS,GRADE 3, 1990-92
50 -
40 -
30 -
20-
10
0
-10
-20
-30
Plato
Galindo
MOW DISTRICT
AndrovraMOW DISTRICT
1990 1991 1992
If a school had fewer than 10% of a certain ethnic or economic group who took TAAS, those students were not includedin the analysis.
24
32
92.31 Elementary Technology Danoottration Schools, The Third Year, 1992-93
FIGURE 19DIIIIERENCE FROM DISTRICT, PERCENT OF ECONOMICALLY DISADVANTAGEDSTUDENTS MASTERING TAAS MINIMUM REQUIREMENTS FOR ALL TEST AREAS,
GRADE 3, 1990-92
so-
40 -
ao
20
10
ABOVE C1STRCT
-10 -
-20 -
-30
BELOW DISTRICT
Andrews
1990 1991 1992
FIGURE 20DIbliERENCE FROM DISTRICT, PERCENT OF WHITE STUDENTS MASTERING
TAAS MINIMUM REQUIREMENTS FOR ALL TEST AREAS,GRADE 3, 1990-92
30
20
10
0
-10
-20
-30
ABOVE DISTRICT
Patton
Gaando
BELOW DISTRICT
1990 1991 1992
If a school had fewer than 10% of a certain ethnic or economic group who took TAAS, those students were not included
in the analysis.
25

92.31 Elmentary Techoolozy Demooeuntioe Seboois. The Third Year. 199293
Grade 4 TAAS Scores
AISD grade 4 students took the TAAS in spring 1993. Since the grade 4 test was given later in theyear than the grade 3 TAAS, the grade 4 scores may more accurately reflect three years of programimplementation. However, since 1993 was the first year of grade 4 testing, there are no comparisonyears. As the grade 4 TAAS cannot legitimately be compared with any other test or any other groupof students, grade 4 TAAS scores can only be analyzed against the District average.
On the grade 4 TAAS writing section, Andrews, Galindo, and Langford were below the Districtaverage for percent mastery, while Patton was above the District average. In reading, Andrews,Galindo, and Langford were below the District average for percent mastery, while Patton was abovethe District average. For mathematics, Langford was below the District average for percent mastery,Andrews was equal to the District average, and Galindo and Patton were above the District averagefor percent mastery. See Figure 21 for TAAS percent mastery scores and Figure 22 for schools'difference from the District by test area.
FIGURE 21TAAS PERCENT MASTERY, ETDS AND DISTRICT, GRADE 4, 1993
Andrews Galindo Langford Patton District
Writing 71 69 70 98 83
Reading 42 37 35 89 57
Mathematics 60 61 38 94 60
FIGURE 22DIFFERENCE FROM DISTRICT, TAAS RESULTS BY TEST AREA, EMS
GRADE 4, 1993
26
Legend
Writing
111 I:loading
Ed Imo,

92.31 Einnentaty Technology Demonstration Schools, The Third Year. 1992-93
Ethnic and Economic Analysis
Compared with the District, Andrews, Galindo, and Langford are below the District average forgrade 4 students mastering the minimum TAAS requirements (see Figure 23). However, asmentioned above, this comparison may be misleading as the ethnic makeup of these three schoolsvaries from the District. This analysis looked at the number of grade 4 minority and economicallydisadvantaged students mastering the minimum TAAS requirements at the four campuses. If a schoolhad fewer than 10% of an ethnic or economic group who took TAAS, those students were notincluded in the analysis (see Figure 24).
FIGURE 23DIIFERENCE FROM DISTRICT, PERCENT OF STUDENTS MASTERING TAAS
MINIMUM REQUIREMENTS FOR ALL TEST AREAS, EMS, GRADE 4, 1993
1
so
40
30
20
10
-10
-20
-30
0
ABOVE =TACT
BEWW WTI:OCT
Andrews Galindo Langton' Patton
FIGURE 24PERCENT OF GRADE 4 STUDENTS TAKING TAAS, EThS, 1993
Andrews Galindo Langford Patton District
African Amcrican 51% 8% 18% 5% 17%
H ispanic 31% 70% 58% 11% 35%
White 16% 22% 20% 84% 45%
EconomicallyDisadvantaged
62% 77% 60% 7% 46%
All students (N) 61 83 85 142 4871
Grade 4 African American students at Andrews are performing on par with African Americanstudents districtwide in mastering TAAS minimum requirements, while more Andrews' Hispanic and
27
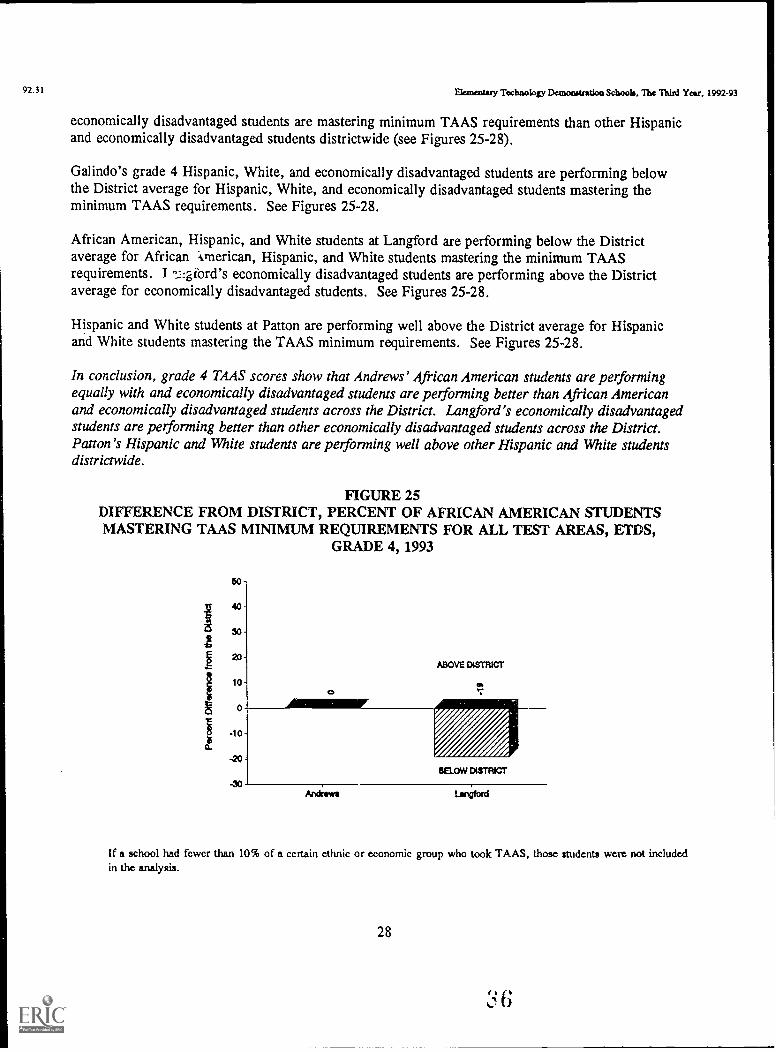
92.31 Elementary Technology Demonstration Schools, The Third Year, 1992-93
economically disadvantaged students are mastering minimum TAAS requirements than other Hispanicand economically disadvantaged students districtwide (see Figures 25-28).
Galindo's grade 4 Hispanic, White, and economically disadvantaged students are performing belowthe District average for Hispanic, White, and economically disadvantaged students mastering theminimum TAAS requirements. See Figures 25-28.
African American, Hispanic, and White students at Langford are performing below the Districtaverage for African .vnerican, Hispanic, and White students mastering the minimum TAASrequirements. I 0:gford's economically disadvantaged students are performing above the Districtaverage for economically disadvantaged students. See Figures 25-28.
Hispanic and White students at Patton are performing well above the District average for Hispanicand White students mastering the TAAS minimum requirements. See Figures 25-28.
In conclusion, grade 4 TAAS scores show that Andrews' African American students are pelformingequally with and economically disadvantaged students are peiforming better than African Americanand economically disadvantaged students across the District. Langford's economically disadvantagedstudents are petforming better than other economically disadvantaged students across the District.Patton's Hispanic and White students are peiforming well above other Hispanic and White studentsdistrictwide.
FIGURE 25DIFFERENCE FROM DISTRICT, PERCENT OF AFRICAN AMERICAN STUDENTSMASTERING TAAS MINIMUM REQUIREMENTS FOR ALL TEST AREAS, E11)S,
GRADE 4, 1993
z
so
40 -
so-
20
10
-20
-30
0
ABOVE DISTRICT
BELOW DISTR/CT
Andrews l-sneofd
If a school had fewer than 10% of a certain ethnic or economic group who took TAAS, those students were not includedin the analysis.
28

92.31 Elemezdaty Technology Demonstration School.. The Third Year, 1992-93
FIGURE 26DIN4ERENCE FROM DISTRICT, PERCENT OF HISPANIC STUDENTS MASTERINGTAAS MINIMUM REQUIREMENTS FOR ALL TEST AREAS, LIDS, GRADE 4, 1993
-20BELOW D4STRICT
Andrews Galindo Lan,;iford Patt'en
FIGURE 27DII4ERENCE FROM DISTRICT, PERCENT OF ECONOMICALLY DISADVANTAGEDSTUDENTS MASTERING TAAS MINIMUM REQUIREMENTS FOR ALL TEST AREAS,
ETDS, GRADE 4, 1993
1
Andrews Galindo Langford
If a school had fewer than 10% of a certain ethnic or economic group who took TAAS, those students were not includedin the analysis.
29
3 7

92.31 Elementary Technology Demonstration Schools. The Third Year, 1992-93
FIGURE 28DIN(ERENCE FROM DISTRICT, PERCENT OF WHITE STUDENTS MASTERING
TAAS MINIMUM REQUIREMENTS FOR ALL TEST AREAS, ETDS, GRADE 1, 1993
so
z 3°
20
10
0
-20
-30
'7
ABOVE DISTRICT
td
BELOW DISTRICT
McCraw* Gaihdo Langford Patton
SUMMER SCHOOL
This section of the report considers two aspects of the 1992 summer school program:
1) What types of students were selected to participate in the summer school program?2) Did the summer school students' test scores improve the subsequent year?
Student Selection
One of the strategies at the ETDS to keep students functioning successfully at or beyond grade level isto offer summer school classes to students not on grade level. Thus, student selection for summerschool is a major concern.
Ideally, 100% of the summer school students would be classified at-risk. Figure 29 displays thepercent of summer school students classified at-risk by campus. The figure displays at-riskpercentages for 1991-92 and 1992-93. The at-risk statistics are generated in October of each year, soby the time summer school student selection decisions are made in the spring, a student's actual at-risk status may have changed. Thus, the figure displays pre- and postsurnmer school at-risk statisticsin an effort to portray the status of the students more accurately.
At no campus were 100% of the summer school students classified at-risk. The postsummer schoolat-risk statistics were higher than the presummer school statistics, reflecting the change in at-riskstatus during the year. The percent of summer school students classified at-risk ranged from a low of71% at Galindo to 93% at Langford.
30
I 0

92.31 Ekmentary Technology Demonstration Schools, The Third Year, 1992-93
Another way to evaluate summer school selection is to compare the percent of summer schoolstudents classified at-risk with the percent of school-year students classified at-risk. Reflecting thereason for summer school, to offer classes to students not on grade level, the summer school at-riskpercentage should be higher than the school-year percentage.
The percent of summer school students classified at-risk was higher at all four campuses than thepercent of school-year students classified at-risk. At Langford the summer school percent was morethan twice as high as the 1992-93 school-year percent, and at Patton the summer percent was overthree times as high. Therefore, while 100% of the summer school students were not at-risk at anyschool, the percent at-risk in summer school was higher than the percent at-risk in the 1992-93 schoolyear at all schools.
FIGURE 29AT-RISK PERCENT COMPARISON
1992 SUMMER SCHOOL STUDENTS AND 1991 AND 1992 SCHOOL-YEAR STUDENTS
Year Andrews Galindo Langford Patton
1992 Summer School Students1991-92 53.3 57.5 81.0 47.5
1992-93 74.6 71.0 93.3 75.0
1991 School Year Students 1991-92 50.7 38.2 41.6 21.6
1992 School Year Students 1992-93 52.3 41.6 44.1 20.7
Test Scores of Summer School Students
The best way to analyze summer school students' test scores is to use the ROPE methodologydescribed on page 13. However, ROPE requires a minimum of 25 students for the results to acquiresufficient statistical confidence. The summer school student groups studied at the ETDS ranged froma low of 9 to a high of 17. Nonetheless, the trends in the summer school ROPE data are so clear andconsistent that they warrant review (see Figure 30).
No group of sununer school students in any grade at any school exceeded the predicted gain. Out ofthe 38 scores for all four campuses, 19 scores (50%) were below the predicted gain. At Galindo,three scores (30%) were below the predicted gain and seven scores (70%) equalled predicted gains.At the three IBM campuses, 16 scores (57%) were below the predicted gain and 12 scores (43%)
equalled predicted gains.
Again, these scores are not as statistically certain as would be preferred. However, the predictedgains are based on analyses of students with similar characteristics districtwide who had noconcentrated technology program and did not have the benefit of summer school. The pattern of nogroups exceeding the predicted gain and 50% being below the predicted gain indicates a need toexamine the purpose or activities of the summer school program.
31

92.31 Elementary Technology Demonstration Schools, The Third Year, 1992-93
FIGURE 301992 SUMMER SCHOOL STIJDENTS, ROPE SCORES BY TEST AREA, ETDS
ANDREWS GALINDO LANGFORD PATTON
Grade 2ReadingMathematicsLanguage n/a
-0
n/a
n/an/an/a
--
n/a
Grade 3ReadingMathematicsLanguage
0
n/a
00
n/a
0
n/a
-
n/a
Grade 4ReadingMathematicsLanguage
00
00
00-
-00
Grade 5ReadingMathematicsLanguage
00
0
0
0 0
-
NOTE: The Distrct switched to NAPT from ITBS in 1991-92 for grades 3-5. TheNAPT does not measure work-study skills, so these scores from previousyears have been dropped from this report.
KEY
0 Achieved Predicted Gain - Below Predicted Gain+ Exceeded Predicted Gain n/a Test not Given
32

42.31acmcntary Technology Demonstration Schools. The Third Year, 1942-93
41111111111111111111111111,
PROGRESS TOWARD THE A+ COALITION GOALS
'qv 1111115111111
The ETDS program plan spells out four specific goals for the computer technology program. Figure31 displays the goals and how progress toward their achievement is measured.
FIGURE 31EIDS THREE-YEAR PROGRAM GOALS
Program Goal Measure of Effectiveness
In three years, reduce by 50% the number ofstudents who are not in their age-appropriategrade level.
Number of students overage one or more years
In three years, reduce by 50% the number ofstudents who are not achieving on grade levelin reading, writing, and mathematics.
1) Number of students below 30th percentile inreading and mathematics on theITBS/NAPT
2) Number of students failing reading,mathematics, or writing sections ofTEAMS/TAAS
Develop a comprehensive teacher trainingprogram to ensure effective implementation anclassroom use of technology.
1) Employee surveys2) Teacher interviews
Demonstrate to the community the educationalbenefits of technology, thereby obtainingsupport for districtwide implementation.
Degree to which program is fully implementedand its goals are reached
GOAL 1 - REDUCE BY 50% THE NUMBER OF STUDENTS WHO ARE NOT IN THEIRAGE-APPROPRIATE GRADE LEVEL
Attachment 6 contains the number and percent of overage students as of October 30, for each ETDS.This measure counts all students in the school on October 30 of each year without considering if theyhave been in the school less than the entire time of the program. This method dilutes the measure ofprogram effect by looking at students who have not had time to be affected by the program.
During the three years of program implementation the percent of overage students hasdecreased. However, the percentage of overage students at the four campuses exceeded theDistrict average by two percentage points, 12% compared to 10%. The number and percentage ofoverage students has decreased at Andrews (110 to 67, 16% to 11%), Langford (73 to 68, 14% to11%), and Patton (111 to 104, 11% to 11%). Andrews and Patton had decreases in enrollment from883 to 616 and from 1,008 to 961, respectively. Langford's enrollment increased from 538 to 594.Galindo increased in the number and percent of overage students from 106 to 109, 13% to 15%.
Galindo also had an increased enrollment from 678 to 753.
33
4t

92.31 Eementary Technology Demonstration Schools, The Third Year, 1992-93
Sometimes overage students move into and out of schools, thereby changing the school's number ofoverage students. To control partially for these circumstances, any overage student who entered theschool from another school was removed from the analysis; however, overage students who left theschool were not removed from the analysis. The analysis showed that from 1991-92 to 1992-93,Andrews and Patton each retained one student, Langford retained four students, and Galindo retained10 students.
Teachers are also beginning to believe that the introduction of classroom technology can reduceretention rates. During the 1993 ORE Coordinated Survey, 73% of teachers agreed or stronglyagreed (up from 68% and 61% in previous years) that technology would decrease retention rates.Only 6% of teachers disagreed or strongly disagreed with this statement. See Attachment 1A forthree-year trends.
In conclusion, the number of overage students has decreased, but not by 50% to meet theprogram goal. The program goal may have been unrealistic. In order to meet the goal of reducingby 50% the number of students who are not in their age-appropriate grade level, no new retaineesshould be created, and half of the overage students that currently exist need to be promoted twogrades (e.g., an eight-year-old student in grade 2 in 1991-92 would need to be promoted to grade 4 in1992-93). There were no provisions in the ETDS plan to advance students. Without otherspecialized accelerated programs, that goal may not be attainable. However, the schools are movingin the right direction by decreasing the number of overage students they are creating each year andaccelerating several students. From 1990-91 to 1991-92, one student at Patton was accelerated, andfrom 1991-92 to 1992-93, four students were accelerated two grades (three at Andrews, and one atLangford). Teachers also believe, more now than ever, that the implementation of classroomtechnology will reduce retention rates.
GOAL 2 - REDUCE BY 50% THE NUMBER OF STUDENTS WHO ARE NOT ACHIEVINGON GRADE LEVEL IN READING, WRITING, AND MATHEMATICS
The ETDS reduced the number of students failing a section of grade 3 TAAS over the three-yearprogram. However, the student failure rates did not decrease the 50% set by the program goal.Two schools did reach the 50% reduction goal in one test subject area. Langford reduced the numberof students failing mathematics from 28% to 12%, and Patton decreased the number of studentsfailing writing from 20% to 8% during the three years of program implementation.
Even though the number of students achieving on grade level in reading, writing, and mathematicshas not increased by 50%, many teachers believed that the technology has increased students'academic progress. During 1992-93, 91% of teachers at the EIDS believed that technology increasedthe academic progress of their students. This is a positive shift in attitude, as only 59% of teachers in1991, and 77% in 1992, believed technology increased academic progress. See Attacnment 1A.
GOAL 3 - DEVELOP A COMPREHENSIVE TEACHER TRAINING PROGRAM TO ENSUREEFFECTIVE IMPLEMENTATION AND CLASSROOM USE OF TECHNOLOGY
The District's Instructional Technology Coordinator organized all technology training. Teacherscompleted the original training in the software delivery system during extensive hands-on training
34
42

92.31 amorality Technology Dunoratritice Schools, The Third Year, 199243
sessions in the summer of 1990. Additional formal follow-up training was conducted during the1991-92 school year. Seventeen additional follow-up training sessions were provided on Writing toRead and Writing to Write' during the 1992-93 school year. New ETDS teachers were trainedprior to the new school year and received additional training once a month throughout the year.
Informal training was also being provided by teachers, students, and education instruction specialists.On-campus experts were developed to assist teachers when problems arose. Students oftentimesbecame more familiar with a program than a teacher and would often teach the teacher about time-saving tips or new computer programs. Since November 1992, Andrews received specializedinstruction from an Education Instruction Specialist once a week. The Education instructionSpecialist, a former teacher at Patton, paid for by IBM, worked with teachers to integrate technologyinto classroom activities.
On the 1993 ORE Coordinated Survey, the majority of teachers, 72%, thought that they had receivedsufficient training to incorporate technology appropriately into their teaching. This percentage ishigher than the 66% in 1992, and the 61% in 1991, who thought they had received sufficient training.Only one in 10 teachers said that he or she had not received sufficient training to incorporatetechnology appropriately into the classroom, a decrease from one in five teachers in 1991. SeeAttachment 1A for detailed findings.
A vast amount of formal training has been implemented; however, several teachers noted that theythought more training was needed. The teachers would like additional training to include more grade-specific software (i.e,, grade 1 teachers need more specific training with grade 1 software).
GOAL 4 - DEMONSTRATE TO THE COMMUNITY THE EDUCATIONAL BENEI !TS OFTECHNOLOGY, THEREBY OBTAINING SUPPORT FOR DISTRICTWIDEIMPLEMENTATION
To reach the goal of demonstrating to the community the educational benefits of technology andobtaining support for districtwide implementation, it is necessary to increase parental and communityinterest and involvement in the schools. Many community members visited the four ETDS during thethree years of program implementation. These community members included Congressman JakePickle and representatives from his Washington, D.C. office, representatives from the Austin Project(a group of local business and government leaders), and representatives from IBM Corporation.Representatives from school districts across Texas and the nation also visited the ETDS, andinformation concerning the schools was aired during an interview on National Public Radio.
On the 1993 ORE Coordinated Survey, teachers at the four campuses were asked whether they wouldrecommend technology as it was implemented on their campuses to schools districtwide. Of the 133teachers who responded, 79% strongly agreed or agreed that they would recommend technology toother schools districtwide. This response was up from 66% and 71% in previous years. SeeAttachment IA for three-year trends.
35
4 3

92.31 Elementary Technology Demonetration Schools, The Third Year. 1992-93
BIBLIOGRAPHY
Marable, P., & Frazer, L. (1991). Project A+ Elementary Technology Demonstration Schools.1990-91: The first year (ORE Publication No. 90.32). Austin, TX: Austin Independent SchoolDistrict, Office of Research and Evaluation.
Nichols, T., & Frazer, L. (1992). Project A+ Elementary Technology Demonstration Schools,1991-92: The second year (ORE Publication No. 91.30). Austin, TX: Austin IndependentSchool District, Office of Research and Evaluation.
Telecommunications and Teachers. (1993, February). News from the Center for Children andTechnology and the Center for Technology in Education. Bank Street College of Education.Vol. 2, No. 2.
Wilkinson, D., Mangino, E., & Ligon, G. What works, and can we afford it? Programeffectiveness in AISD, 1991-92 (ORE Publication No. 91.43). Austin, TX: Austin IndependentSchool District, Office of Research and Evaluation.
36
44

92.31 Ektneatazy Technology Demonstratice School., The Third Year, 1992-93
ATTACHMENT lATEACHER SURVEY RESPONSES
The ORE Coordinated Survey was conducted in the spring of 1993. This survey marks the third timeETDS staff has responded to the same set of core questions (numbers 1-5). This year, four additionalitems were added concerning telephone usage and other technology factors. Of the 159 surveys sentto teachers, 135 completed the survey, a return rate of 85%.
Quattico Nuoket
Valid Responses Simnel/ Atm* Alt$* Neutral Disagree Strongly Disagree
1991 1992 1993 1991 1992 1993 1991 1992 1993 1991 1992 1943 1991 1992 1993 1991 1992 1993
1. The academic terogniss of studeets onmy campus hos been increased becauseof technology.
189 176 134 30.1 36.5 43.3 3.4 40.1 47.8 34.4 17.4 7.5 4.4 4.2 1.5 2.7 LB 0.0
2. Tht, impicerentatke of the tectrologywill help mduce reatesien rates on mycampus.
190 179 135 26.2 20.6 30.4 41-5 40.0 43.0 26.2 32.9 20.7 5.5 5.3 4.4 0-5 1.2 1-5
3. 1 received sufficient training toincorporate techookgy apprepriately iatomy onriculum.
193 176 130 21.0 27.4 24.6 40.3 38.7 46.9 24.2 14.3 17.7 8.1 13.7 9.2 6-5 6.0 1-5
4. The addition of tecimoSogy into myclassroom has made my Seachi.og mom
tlfective.
193 174 133 23.1 31.1 37.6 32.8 37.7 35.3 34.4 70.4 72.6 7.5 7.11 4.5 2.2 3.0 0.0
5. 1 would rearm:need leclaiology ma it193 175 133 25.3 33.5 42.1 40.9 37.1 36.8 22.0 18.0 12.0 9.1 8.4 8.3 2.7 3.0 0.8
was inciemenied en my campus.
ve4
Legend
1991 Strongly Agree/Agree
Is 1992 Strongly Agree/Agree
1993 Strongty Agree/Agree
1991 Strongty Disagree/DIsagre
1992 Strongly Disagree/Disagree
1993 Strongly Disagree/Dlsagree
Question 1 Question 2 Question 3 Question 4 Question 5
37
4 5
BEST COPY AVAILABLE
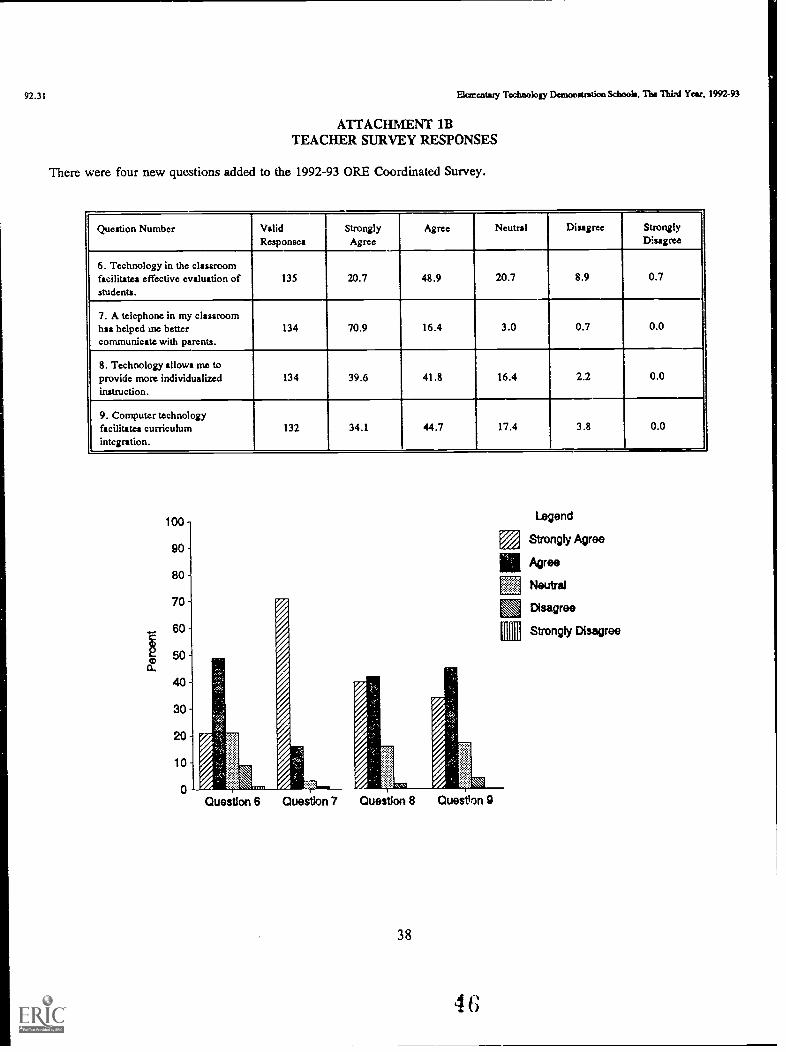
92.31 Elementary Technology Demonstration &hook. The Third Year. 1992-93
ATTACHMENT 1BTEACHER SURVEY RESPONSES
There were four new questions added to the 1992-93 ORE Coordinated Survey.
Question Number ValidResponses
StronglyAgree
Agree Neutral Disagree StronglyDisagree
6. Technology in the classroomfacilitates effective evaluation ofstudents.
135 20.7 48.9 20.7 8.9 0.7
7. A telephone in my classroomhas helped me bettercommunicate with parents.
134 70.9 16.4 3.0 0.7 0.0
8. Technology allows me toprovide more individualizedinstruction.
134 39.6 41.8 16.4 2.2 0.0
9. Computer technologyfacilitates curriculumintegration.
132 34.1 44.7 17.4 3.8 0.0
100
ao
80
70
60
50
ao
30
20
10
0
Legend
Strongly Agree
1111 Agree
Neutral
Disagree
Strongly Disagree
11::: il:11
IIIIIIl
Question 6 Question 7 Question 8
38
Question 9
4 6
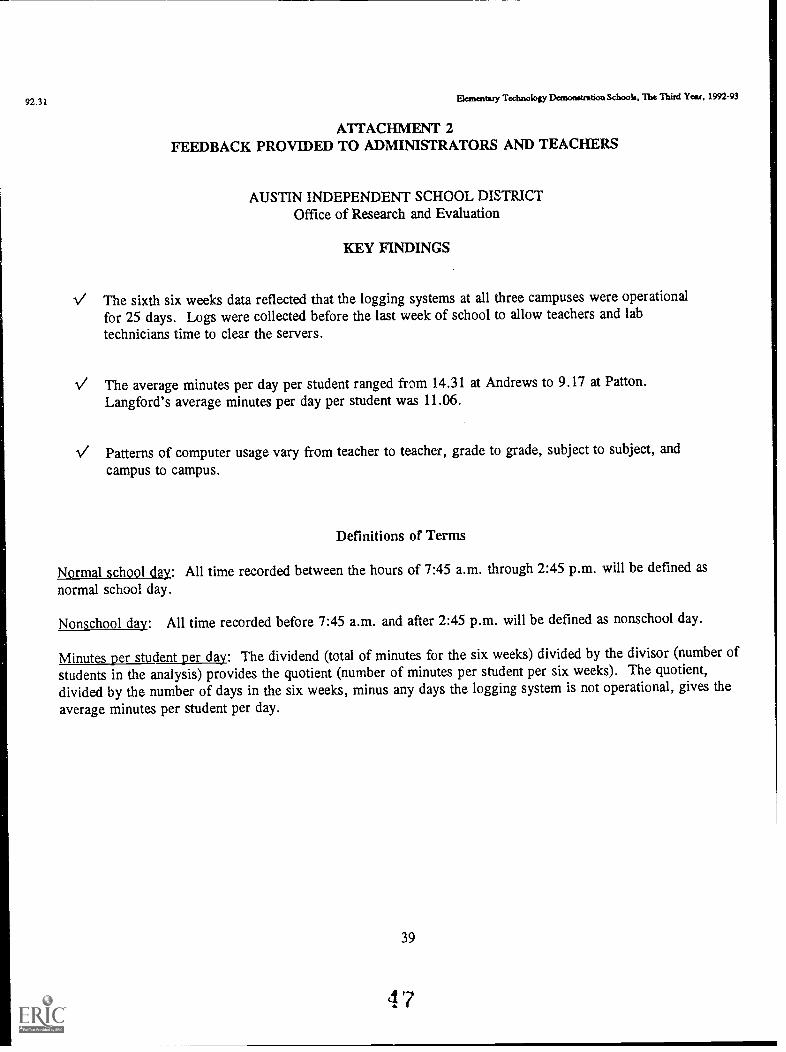
42.31 Elementary Technology Danonetration School., The Third Year, 1992-93
ATTACHMENT 2FEEDBACK PROVIDED TO ADMINISTRATORS AND TEACHERS
AUSTIN INDEPENDENT SCHOOL DISTRICTOffice of Research and Evaluation
KEY FINDINGS
The sixth six weeks data reflected that the logging systems at all three campuses were operationalfor 25 days. Logs were collected before the last week of school to allow teachers and labtechnicians time to clear the servers.
.1./ The average minutes per day per student ranged from 14.31 at Andrews to 9.17 at Patton.Langford's average minutes per day per student was 11.06.
Patterns of computer usage vary from teacher to teacher, grade to grade, subject to subject, andcampus to campus.
Definitions of Terms
Normal school day: All time recorded between the hours of 7:45 a.m. through 2:45 p.m. will be defined as
normal school day.
Nonschool day: All time recorded before 7:45 a.m. and after 2:45 p.m. will be defined as nonschool day.
Minutes per student per day: The dividend (total of minutes for the six weeks) divided by the divisor (number ofstudents in the analysis) provides the quotient (number of minutes per student per six weeks). The quotient,divided by the number of days in the six weeks, minus any days the logging system is not operational, gives the
average minutes per student per day.
39
4 7

42.31 Elementary Technology Demonstration Schools, The Third Year. 1992-93
ATTACHMENT 2 (cont.)
AUSTIN INDEPENDENT SCHOOL DISTRICTOffice of Research and Evaluation
Key Information ChartPart ATime on Computer Analysis, Andrews Elementary
Sixth Six Weeks, 1992-93
Average Minutes Per Day Per Student on Computer atAndrews Elementary
Grade Sixth Six Weeks10.89
1 18.67
2 14.46
3 9.69
4 14.795 19.00
All 14.31
In Grade:
1
23
4
5
All
Subject Students Spent Most and Least Time at Andrews
Excluding tools, studentsspent the most time on:
6th Six WeeksReadingTypingMathTypingTypingTypingTyping
Sixth Six Weeks
Excluding tools, of the subjectsthat the grade used, studentsspent the least time on:
6th Six WeeksTypingLanguageLanguageReadingReadingReadingLanguage
Software With Highest Average at Andrews
Minutes Per DaySoftware Per Student
Writing & Publishing Center 1556.92
40
4 8

92.31 Elemennuy Technology Dernotatration Schools. The Third Year. 1992-93
ATTACHMENT 2 (cont.)
Key Information Chart
Part B - Time on Computer Analysis, IBM Elementary Technology Demonstration SchoolsAverage Minutes Per Day Per Student on Computer
Sixth Six Weeks, 1992-93Andrews Elementary
Grade Sixth Six Weeks10.89
1 18.672 14.463 9.694 14.795 19.00
All 14.31
Langford ElementaryGrade Sixth Six Weeks
9.841 19.822 10.733 13.504 8.505 4.57All 11.06
Patton ElementaryGrade Sixth Six Weeks
14.681 8.072 11.663 8.804 7.325 2.74All 9.17
Nonschool DayTime on Computer Analysis, IBM Elementary Technology Demonstration Schools
Sixth Six Weeks, 1992-93
Total Number of Avg. Minutes Avg. No. of MinutesMinutes Students Per Six Weeks Per Day Per Student
6th Six WeeksAndrews 399 104 3.84 .15
Langford MS 40 2.65 .11
Patton 84 I 472 1.78 .07
41
4 9

92.31 Dementary Technology Demonstration Schools, The Third Year, 1992-93
Minutes
9
8
7
6
5
4
3
2
1
0
ATTACHMENT 2 (cont.)
Average Student Minutes Per DayBy Subject (6th six weeks)
Langford Patton
Average number of minutes per day, per student, by subject for all grades.
42
VA
Legend
Mathematics
III Reading
Language
Typing
mTools

92.31 Elementary Technology Demonstration Schools, The Third Year, 1992-93
ATTACHMENT 2 (cont.)
AUSTIN INDEPENDENT SCHOOL DISTRICTOFFICE OF RESEARCH AND EVALUATION
A+ EVALUATIONPROGRAM NAME: APLTEACH
ANDREWS 5TH SIX WEEKSGROUP 1 : COMPUTER USAGE FROM 3/1/93 TO 4/9/93
A
************************************************************ TOTAL 10689 19 563 25 22.50************************************************************
MATH 2225 19 117 25 4.68
READING 3 1 3 25 0.12
LANGUAGE 5506 11 501 25 20.02
TYPING 741 8 93 25 3.71
TOOL 2214 14 158 25 6.33
PRIM ED 0 0 0 25 0
A = TOTAL MINUTES FOR THE SIX WEEKS
B = NUMBER OF STUDENTS IN ANALYSIS
C = MINUTES PER STUDENT FOR THE SIX WEEKS
D = NUMBER OF DAYS IN THE ANALYSIS
E = AVERAGE MINUTES PER DAY, PER STUDENT
43
51

42.31 Elementary Technology Demonstration Schools, The Third Year, 1992-93
ATTACIMENT 3ASOFTWARE PROGRAMS
The core software listed below was networked at Andrews, Langford, and Patton.
MathematicsAlgebraComparison KitchenMath ConceptsMath PracticeMath Number SenseMath RabbitMath with ManipulativesMeasurement, Time, and
MoneyNumber FarmSF Math FractionsSF Math GeometrySF Math Graphing and ProbabilitySF Math Money and TimeSF Math Primary Geometry
ToolsDisplayWrite AssistantExpress PublisherLANSchoolLink WayMi Editor PrimarioMicrosoft WorksPrimary Editor PlusThe Writing and Publishing
Center
LanguageAlphabet CircusBouncy Bee Learns LettersBouncy Bee Learns WordsCombining SentencesParts of SpeechPunctuationReading for MeaningReading for InformationSESOS: DinosaursSpellingStories and MoreThe PlayroomVocabularyVoy A Leer EscribiendoWriting to ReadWriting to Write
TypingTouch Typing for Beginners
44
52

92.31Elementary Technology Demonstration Schools, Tbe Third Year. 1992-93
ATTACHMENT 3BSOFTWARE PROGRAMS
The IBM schools have introduced noncore software programs to the curriculum. Many of the softwareprograms were networked; however, a few were used on stand-alone computers. Below is a list ofadditional software added by the IBM schools.
LanguageBert's DinosaursBoggle Spelling GameDinosaur Picture Data BaseEl CircoHangman GameJeopardy for ChildrenKID PIXMazes: Make Your Own MazeMickey's ABC'sPreschool PackPreschool Sounds LikeReader Rabbit for 1st GradeStickey Bear ReadingStory Book WeaverTalking ABC'sTexttris Word GameThe CircusTree HouseUltimate GeographyUSA States, Geography, CapitalsWord Gallery 3.0Word Game of Initial Sounds and
MoreWordsearch with TopicsZentris
MathematicsBerenstein Bears CountingCheckersEl Horno MagicoLugnut Math GameMath Hunt GameMath Rescue: Word ProblemsNew Math Blasters PlusThe Magic OvenThe Piñatas3-D Chess
45;-.) 3

42.31 Elemestary Technology Desnoostratioo Schools. The Third Yost. 199243
ATTACHMENT 3CSOFTWARE PROGRAMS
Below is a list of software programs available at Galindo Elementary.
LanguageBalloon TripBank Street Writer 1.03Build an AirplaneClown MakerFirst-Letter FunFun from A to ZGROUPwriterKid PixPhonics Prime TimePicture ChompersPuppet ShowSpace Station FreedomSpelling Puzzles & TestsSpelling WorkoutStone SoupSound IdeasTalking Text WriterThe Magic PainterThe Malt ShopThose Amazing Reading MachinesTouch 'N WriteType to LearnWord HerdWord WizardWords at Work
ToolsKids TimeSuper Print
MathematicsCircus MathClock WorksConquering DecimalsConquering FractionsConquering Whole NumbersCountering CrittersDecimal ConceptsFractions ConceptsFraction PracticeFraction MunchersNumber MunchersMeasurementsMoney WorksProblem SolvingRace TimeSpace SubtractionSpeedway & Spanish MathSubtraction Puzzles
ScienceInvisible BugsLunar GreenhouseMurphy's MineralsMystery ObjectsMystery MattersSun & SeasonsWeeds & TreesWood Car Rally
Social StudiesJenny's JourneyThe Market PlaceThe Oregon TrailThe Navigator Leaps Back
46
5 4

92 31 Bemestary Technology Demonstration Schools, Tbe Third Year. 1992-93
ATTACHMENT 4AAVERAGE MINUTES PER DAY ON COMPUTER
39.5
35
130 -25
'515
10
5
0
ANDREWS ELEMENTARY
14.411.4
15.4
7.9
14.3
1st 2nd 3;d 4thr 5th' 5th
Six-Weeks Periods
Six-Weeks PeriodsFor All Grades
Grade lst six weeks* 2nd six weeks 3rd six weeks 4th aix weeks 5th six weeks 6th six weeks
K 17.0 3.8 5.5 10.8 5.4 10.9
1 60.0 27.6 13.3 27.9 10.9 18.7
2 26.4 15.2 12.7 13.0 3.9 14.5
3 34.4 14.9 7.2 14.0 6.8 9.7
4 64.3 17.9 15.3 12.7 8.2 14.8
5 38.7 14.7 16.7 14.6 13.0 19.0
All 39.5 14.4 11.4 15.4 7.9 14.3
Logging systems were operational for only four days.
47
5 5''";i COPY NAME
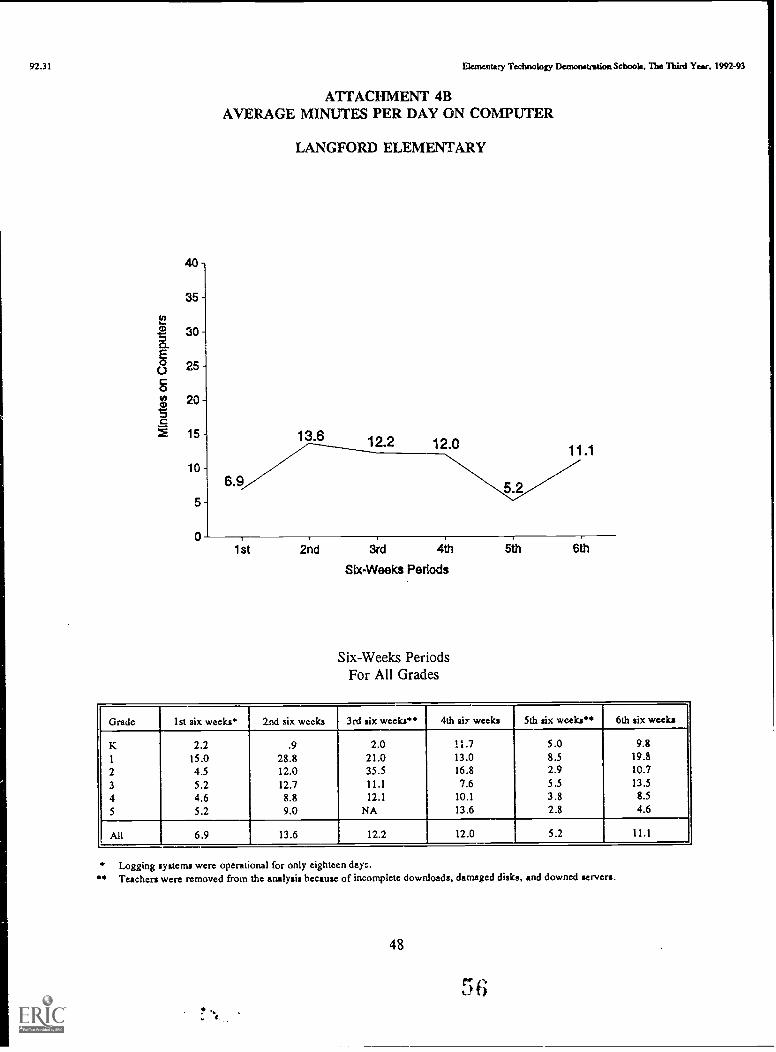
92.31
40
35
30.6.
25
2052 15
10
5
0
Elementary Technology Demonstration Schook, The Third Year, 1992-93
ATTACHMENT 4BAVERAGE MINUTES PER DAY ON COMPUTER
LANGFORD ELEMENTARY
1 'st 2nd 3i'd 4th' 5th. 6th'
Six-Weeks Periods
Six-Weeks PeriodsFor All Grades
Grade 1st six weeks* 2nd six weeks 3rd six weeks** 4th sir weeks 5th six weeks** 6th six weeks
K 2.2 .9 2.0 11.7 5.0 9.8
1 15.0 28.8 21.0 13.0 8.5 19.8
2 4.5 12.0 35.5 16.8 2.9 10.7
3 5.2 12.7 11.1 7.6 5.5 13.5
4 4.6 8.8 12.1 10.1 3.8 8.5
5 5.2 9.0 NA 13.6 2.8 4.6
All 6.9 13.6 12.2 12.0 5.2 11.1
Logging systems were operational for only eighteen days.** Teachers were removed from the analysis because of incomplete downloads, damaged disks, and downed servers.
48

92.31 Ekmentaty Technology Demonstration Schools, The Thissl Year, 1992-93
40
35
g 30
0.E 25 -
a20
15Z
10-
5
0
ATTACHMENT 4CAVERAGE MINUTES PER DAY ON COMPUTER
PATTON ELEMENTARY
9.1 9.4 8.8 8.6
4.4
9.2
1st 2nd 3rd 4th 5th 6th
SIx-Weeks Periods
Six-Weeks PeriodsFor All Grades
Grade lst six weeks* 2nd six weeks 3rd six weeks** 4th six weeks 5th six weeks** 6th six weeks
K 4.7 8.9 9.2 13.0 6.5 14.7
1 8.7 13.3 13.7 14.9 7.2 8.1
2 7.1 13.6 NA 7.4 3.0 11.7
3 15.1 6.8 8.8 6.5 3.9 8.8
4 12.8 6.4 NA 5.5 3.2 7.3
5 6.9 7.3 4.8 4.8 2.1 2.7
All 9.1 9.4 8.8 8.6 4.4 9.2
* Logging systems were operational for only thirteen days.** Teachers were removed from the analysis because of incomplete downloads, damaged disks, and downed servers.
49
5 7

92.31 Elementary Technology Demonattation Schools, The Turd Ydr. 1992-93
ATTACHMENT 5NAPT/ITBS SCORES 1991-92 and 1992-93
Composhe Mathematics Reading . Language
All H AA 0 All H AAJO All H AA 0 All H AA
ANDREWSGrade 1 .
1991-92 64 51 64 87 63 65 60 84 52- 46 51 74 60 46 62 69
1992-93 50 . .36 53 §§, 46 38 48 54 .46. .33 50 4 55 37 62
Grade 2 .
1991-92 54 46 53 a 47 47 43 76 46 38 46 '67 61 48 63 77
1992-93 50 62 42 84 44 60 33 84 45 55 38 0 64 67 60 85
Grade 31991-92 32 32 29 60 38 42 31 66 32 30 30 8 51 45 51 74
1992-93 42 40 38 78 45 49 39 82 41 . 35 39 a 49 48 47 ZZ
Grade 41991-92 28 27 25 65 34 36 29 0 . 26 24 24 59 41 38 42 56
1992-93 43 43 35 67 49 50 42 83 .37 36 .3 i 11, 54 59 48 76
Grade 51991-92 36 21 32 n 40 23 36 75 34 21 31 a 44 30 42 71
1992-93 34 37 31 45 35 40 30 53 37 39 36 4j., 45 46 44 49
GALINDoGrade 1
1991-92 65 61 41 76 69 67 65 73 53 52 li. 62 72 69 62 81
1992-93 81 78 a 87 74 73 45 79 66 60 12 76 84 84 68 86
Grade 21991-92 64 61 73 61 58 51 73 56 52 -52 68 72 7! a 75
1992-93 76.6270 1,1 8.6 74 70 57 81 65 63 12,.. 74 75 69 66 85
Grade 31991-92 48 40 54 68 58 51 60 73 42 35 49 64 60 58 76 62
1992-93 48 45 33 72 59 56 44 81 41 38 26 63 55 56 51 58
Grade 41991-92 43 30 a 62 50 40 63 63 39 23 tsi 62 42 30 53 61
1992-93 56 49 53 76 63 57 51 80 49 41 49 71 52 46 70 62
Grade 51991-92 53 50 59 59 54 -- 70 47 46 -- 46 55 52 60
1992-93 41 35 46 56 43 37 53 56 41 35 41 57 46 42 55 54
Underlined numbers signify that fewer than 10 students were tested.
BEST COPY AVAILABLE

92.31 Elementary Teamology Dammatratioa Schools, The Third Year, 1992-93
ATTACHMENT 5 (cont.)
Com liosice- .. Mathematics ...Ha& language
: A11' :. H .AA All H AA 0 0. All H AA 0
LANGFORDGrade 1 . ::. .... . . .
:
1991-92 43 3 6 32 56. 35 33 23 41 40 ' .32 . 36 50 57 53 52 63
1992-93 50 . 42 58 66 50 44 41 67 48 .. 43 . 52:...: $7 64 57 77 70
Grade 2.
.. . . ...
1991-92 40. . .29.- 38 .. .47 39 33 30 45 43 28 44 53 44 31 51 491992-93 66 38 27 59 36 38 21 47 '40. 38 24 54 49 48 43 56
Grade 31991-92 43 43 33 46 46 45 44 48 40 43 26 45 52 54 39 52
1992-93 37 . 27 . 28 5.1 41 29 31. 58 37, 30 30 46 37 29 31 48
Grade 4 .
1991-92 43 : 50 13 61 46 49 19 64 42 ,; 53 12 55 50 56 36 53
1992-93 45 42 40 55 44 41 40 53 46 44 39 55 46 45 44 50
Grade 51991-92 46 35 39 . 63 45 37 35 61 .46 36 '. 44 . 61 44 39 39 54
1992-93 41 42 19 63 37 38 16 60 45 47 26 64 39 41 20 54
PATTONGrade 1
1991-92 81 §.2 J 82 75 55 69 76 72 §2 73 78 67 72 78
1992-93 87 86 87 79 72 66 81 76 68 !a 77 85 86 95 84
Grade 2 .
1991-92 83 79 21 -, 84 79 72 63 80 82 75 69 83 78 84 91 77
1992-93 84 85 84, 78 74 55 79 SO 81 64 80 83 89 95 81
Grade 31991-92 78 73. 56 80 79 75 64 80 75 70 50 77 88 83 73 89
1992-93 82 77 46 83 85 82 47 86 75 70 40 77 78 81 68 77
Grade 41991-92 81 75 70 82 81 73 72 82 78 69 67 79 86 86 84 86
1992-93 86 85 12 88 87 81 46 89 81 79 59 83 85 76 70 87
Grade 51991-92 70 42 §1 73 73 52 60 75 65 39 . §2 68 75 63 65 77
1992-93 78 67 5,2 80 77 69 54 79 75 62 50 77 75 68 53 76
Underlined numbers signify that fewer than 10 students were tested
51
5 3
BEST COPY MVP'

92.31 Elementary Technology Demonstration Schools, The Third Year, 1992-93
ATTACHMENT 6NUMBER AND PERCENT OF OVERAGE STUDENTS AT THE ETDS, 1990 - 1992
AS OF OCTOBER 30
Andrews Elementary
Grade
October 30, 1990# %
Enrollment Overage Overage
October 30, 1991# %
Enrollment Overage Overage
October 30, 1992# %
Enrollment Overage Overage
K 110 5 4.5 136 0 0.0 107 1 .9
1 113 8 7.1 124 9 7.3 93 9 9.72 105 15 14.3 126 15 11.9 97 7 7.23 108 23 21.3 111 24 21.6 97 13 13.4
4 111 34 30.6 111 31 27.9 77 16 20.8
5 92 2.5 27.2 125 37 39.6 76 20 26.3Total 709 110 15.5 833 116 13.9 616 67 10.9
Galindo Elementary
Grade
October 30, 1990# %
Enrollment Overage Overage
October 30, 1991# %
Enrollment Overage Overage
October 30, 1992# %
Enrollment Overage Overage
K 125 1 0.8 120 0 0.0 130 0 0.0
1 128 18 14.1 119 5 4.2 137 12 8.8
2 99 16 16.2 122 18 14.8 123 13 10.6
3 113 31 27.4 90 22 24.4 125 27 21.6
4 79 20 25.3 93 24 25.8 98 24 24.5
5 85 20 23.5 86 21 24.4 98 33 33.7
Total 678 106 15.6 702 90 12.8 753 109 14.5
Langford Elementary
Grade
October 30, 1990# %
Enrollment Overage Overage
, October 30, 1991# %
Enrollment Overage Overage
October 30, 1992# %
Enrollment Overage Overage
K 79 2 2.5 74 5 6.8 95 4 4.2
1 78 11 14.1 92 8 8.7 81 7 8.6
2 85 11 12.9 82 14 17.1 90 8 8.9
3 79 15 19.0 83 13 15.7 84 13 15.5
4 72 20 27.8 81 16 19.8 106 19 17.9
5 57 14 14.6 67 17 25.4 82 17 20.7
Total 510 73 14.3 538 73 13.6 594 68 11.4
Patton Elementary
Grade
October 30, 1990# %
Enrollment Overage Overage
October 30, 1991# %
Enrollment Overage Overage
October 30, 1992# %
Enrollment Overage Overage
K 151 7 4.6 153 5 3.3 162 8 4.9
1 190 25 13.2 188 22 11.7 140 4 2.9
2 164 21 12.8 185 24 13.0 175 22 12.6
3 159 27 17.0 163 24 14.7 169 21 12.4
4 160 10 6.3 161 25 15.5 159 25 15.7
5 181 21 11.6 158 12 7.6 156 24 15.4
Total 1005 I I I 11.0 1008 112 11.1 961 104 10.8
52
60
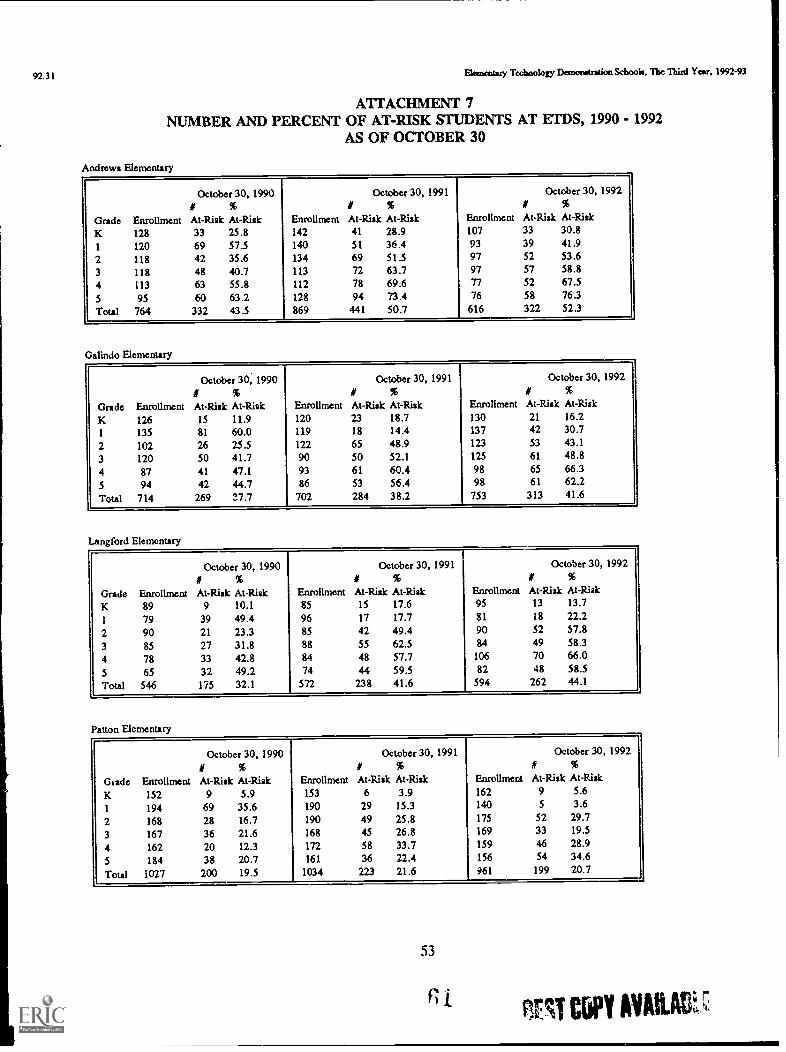
92.31 Flancatary Technology Demonstration Schools. The Third Year. 1992-93
ATTACHMENT 7NUMBER AND PERCENT OF AT-RISK STUDENTS AT ETDS, 1990 - 1992
AS OF OCTOBER 30
Andrews Elementary
Grade
October 30, 1990# %
Enrollment At-kisk At-Risk
October 30, 1991# %
Enrollment At-Risk At-Risk
October 30, 1992# %
Enrollment At-Risk At-Risk
K 128 33 25.8 142 41 28.9 107 33 30.8
1 120 69 57.5 140 51 36.4 93 39 41.9
2 118 42 35.6 134 69 51.5 97 52 53.6
3 118 48 40.7 113 72 63.7 97 57 58.8
4 113 63 55.8 112 78 69.6 77 52 67.5
s 95 60 63.2 128 94 73.4 76 58 76.3
Total 764 332 43.5 869 441 50.7 616 322 52.3
Galindo Elementary
October 30, 1990# % #
October 30, 1991% #
October 30, 1992%
Grade Enrollment At-Risk At-Risk Enrollment At-Risk At-Risk Enrollment At-Risk At-Risk
K 126 15 11.9 120 23 18.7 130 21 16.2
1 135 81 60.0 119 18 14.4 137 42 30.7
2 102 26 25.5 122 65 48.9 123 53 43.1
3 120 50 41.7 so 50 52.1 125 61 48.8
4 87 41 47.1 93 61 60.4 98 65 66.3
5 94 42 44.7 86 53 56.4 98 61 62.2
Total 714 269 37.7 702 284 38.2 753 313 41.6
Langford Elementary
October 30, 1990# % #
October 30, 1991% #
October 30, 1992%
Grade Enrollment At-Risk At-Risk Enrollment At-Risk At-Risk Enrollment At-Risk At-Risk
K 89 9 10.1 85 15 17.6 95 13 13.7
1 79 39 49.4 96 17 17.7 81 18 22.2
2 90 21 23.3 85 42 49.4 90 52 57.8
3 85 27 31.8 88 55 62.5 84 49 58.3
4 78 33 42.8 84 48 57.7 106 70 66.0
5 65 32 49.2 74 44 59.5 82 48 58.5
Total 546 175 32.1 572 238 41.6 594 262 44.1
Patton Elementary
October 30, 1990# % #
October 30, 1991% #
October 30, 1992%
Grade Enrollment At-Risk At-Risk Enrollment At-Risk At-Risk Enrollment At-Risk At-Risk
K 152 9 5.9 153 6 3.9 162 9 5.6
1 194 69 35.6 190 29 15.3 140 5 3.6
2 168 28 16.7 190 49 25.8 175 52 29.7
3 167 36 21.6 168 45 26.8 169 33 19.5
4 162 20 12.3 172 58 33.7 159 46 28.9
5 184 38 20.7 161 36 22.4 156 54 34.6
Total 1027 200 19.5 1034 223 21.6 461 199 20.7
53
fl tPriT CCIPY AVAILAF

92.31 Elementary Technology Demonstration Schalk. The Third Year. 1992-93
ATTACHMENT 8LESSONS LEARNED BY PROGRAM STAFF DU-RING THREE YEARS OF IMYLEMENTATION
During the three years of program implementation, the four campuses have gained valuable experience and havelearned many lessons on how to implement classroom technology and restructure classrooms successfully. The fourETDS principals and other involved staff developed the lessons learned listed below.
The lessons learned are organized into five areas: technical, training, program implementation, educationalstrategies, and program evaluation. These lessons learned are presented in the form of recommendations that schoolsand school districts considering classroom technology implementation should incorporate into their planning process.
Technical
Understand the technical implications and complexities of the program. It is important that everyone involved in theprogram understand the technical implications and complexities of a program of this scope. The three IBM schoolslost a full year of technology implementation because computer installation took one year to complete.
Technology (e.g., networks and hardware) must be available at all times. Broken equipment must be fixed quickly.Teachers must know that if they have the use of technology written into their lesson plans, the technology will beavailable.
Carefully select a technology vendor. Buy computers that are capable of being upgraded and supported.
Training
Training is the key for helping teachers through the implementation process effectively. The training must be focused,hands on, and combine a common vision with hardware/software/curriculum integration. Establish computer trainingfor new teachers, and provide follow-up coaching to established teachers to enhance success.
Time the training to coincide with computer delivery. If possible, training should be delayed until the equipment isinstalled and operable at the campus. Training for teachers at the IBM schools began in July 1990, and training forthe Apple school began in September. Training was scheduled at this early date because the training required mayhours, and the hardware was scheduled to be completely installed by October. However, the student computers werenot fully installed until April 1991. The lag between the training and complete hardware installation diminished thevalue of the training.
Program Implementation
Allow schools time and resources to develop a vision and an implementation plan. Schools need the opportunity todevelop their own vision and implementation plan. Time and plans for vision development and the planning processwere included in the original plan but were not utilized.
Systemic change takes longer than expected. The systemic change of implementing technology into the classroom andrestructuring the classroom takes longer than one or two years to accomplish.
54
62

92.31 Flomeatary Technology Denionetration Schools. The Third Year. 1992-93
ATTACHMENT 8 (cont.)
Assure teachers of the program's fiiture. Some teachers are reluctant to "buy into" change because they think it willonly exist for a few years and then disappear, like so many other educational programs. Assuring them of theprogram's future is very important to increase program success.
Educational Strategies
Integrate the computer in curriculum. The technology alone does not bring about improvements in student learningand achievement. To accomplish these goals, the technology must be effectively incorporated into instructionaldelivery. At the three IBM schools, the Teaching and Learning with Computers (TLC) delivery system is employed.This paradigm shift, away from the direct teaching method towards a centers-based learning approach, requires adedicated staff, strong leadership from the principal, considerable time and effort, staff development, and awillingness to change.
Carefully consider additional software purchases. Additional software purchases should be carefully considered, incontext with the educational benefit of the currently available software. Teachers should also be included in thesoftware selection.
Program Evaluation
Define reasonable goals based on what the schools are realistically able and allowed to do. The goals of the ETDSwere more far reaching than the time schedule or instructional structures put in place to accomplish them. To meetthe goals schools would have had to advance students a grade level, and there was no provision in the plan to do that.
Record a 'before and after" portfolio at the school. Recording a before and after portfolio at the school level wouldcapture the differences in the learning environment and the experiences of students and teachers during the three yearsof technology implementation.
1353 BEST COPY AVAILABLE

Austin Independent School District
Office of Research and EvaluationDr. Evangeline Mangino, Assistant Director
Systemwide EvaluationDavid Wilkinson, Senior Evaluator
Author:Melissa Sabatino, Evaluation Associate
Contributing Staff:Vicente Paredes, Research Analyst
Stacy Buffington, Programmer/AnalystRuth Fairchild, Secretary
Board of TrusteesDr. Beatriz de la Garza, President
Kathy Rider, Vice PresidentDr. Gary McKenzie, Secretary
Diana CastafiedaBernice HartLiz Hartman
Melissa KnippaJohn Lay
Ted Whatley
Superintendent of SchoolsDr. Terry N. Bishop
Publication Number 92.31Oct -ber, 1993
64 BEST COPY AVAILUE