document resume ud 026 191 - eric · document resume. ud 026 191. bruno, ... and 1984. u s...
TRANSCRIPT

ED 294 963
AUTHORTITLE
INSTITUTION
PUB DATENOTEAVAILABLE FROM
PUB TYPE
JOURNAL CIT
EDRS PRICEDESCRIPTORS
DOCUMENT RESUME
UD 026 191
Bruno, Rosalind R.School Enrollment--Social and EconomicCharacteristics of Students: October 1985 and 1984.Current Population Reports: PopulationCharacteristics.Bureau of the Census (DOC), Suitland, Md. PopulationDiv.Apr 88151p.Superintendent of Documents, U.S. Government PrintingOffice, Washington, DC 20402.Statistical Data (110) -- Collected Works - Serials(022)Current Population Reports; Series P-20 n426 Apr1988
MF01/PC07 Plus Postage.College Students; Educational Attainment; ElementarySecondary Education; Enrollment; *Enrollment Rate;*Enrollment Trends; Ethnic Status; Family Status;Marital Status; Postsecondary Education; PreschoolEducation; Socioeconomic Status; *Statistical Data;*Student Characteristics
ABSTRACTUsing data from the October supplements to the
Current Population Survey (CPS), collected in 1984 and 1985, thisreport presents statistical information on students in the UnitedStates attending nursery school through college by age, race, Spanishorigin, sex, marital status, household relationship, residence, andfamily income. The data are limited to the enrollment of civiliannoninstitutional population in regular schools, and thus excludeenrollments in vocational schools, adult education classes, andspecial schools. The report also includes summary data from earlierCPS surveys, and a discussion of recent enrollment trends. Thefollowing highlights are included: (1) elementary and high schoolenrollment was 40.8 million in 1985, down from 46.1 million in 1975;(2) enrollment rates of 6- to 15-year-olds remained essentially thesame, while the enrollment rates of 16- and 17-year olds grewslightly; (3) there were 12.5 million college students in 1985, 15percent above enrollment in 1975; (4) the college enrollment rate ofblack 18- to 21-year-olds remained at 25 percent from 1975 to 1985,and the proportion of tI4 age group who were high school dropoutsdeclined by 10 percentage points to 17 percent; (5) preprimaryenrollment of 3- to 5-year-olds was 5.9 million in 1985, an 18percent increase from 1975 (due partially to a rise in the number of3- to 5-year-olds); (6) in 1985, 38 percent of kindergarten studentsattended all day, IT from 14 percent in 1970; and (7) in 1985, 34percent of nursery school students attended all day, compared with 27percent i% 1970. Tables and figures illustrate the data. Appendicesprovide supplementary tables, definitions and explanations, and adiscussion of the source and reliability of the estimates. (BJV)

CURRENT POPULATION REPORTS
Population CharacteristicsSeries F-20, No. 426
t41v0
-4* School! Enrollment-2C:1
0.Economic(./ Social and onomic
LI/ Characteristicsof Students:October 1985and 1984
U S DEPARTMENT OF EDUCATIONOffice of Educational Research and improvement
EDUCATIONAL RESOURCES INFORMATION
yyCENTER (ERIC)
This document has been reproduced asreceived from the person or organizationoriginating it
0 Minor changes have been made to improvereproduction quality
Points Of view Or opinion$ statedin this document do not necessarily represent officialOE RI position or policy
U.S. Department of CornmerceBUREAU OF THE CENSUS
2 BB.' cur' AVAILABLE

Acknowledgments
This report was prepared in the Education and Social Stratification Branch, underthe general direction of Paul M. Siegel, Chief. Brenda R. Jeffries contributed to tablepreparation, and Andrea E. Adams conducted the statistical review of the text.Survey operations and data processing were coordinated by Kathlean P. Creighton,Demographic Surveys Division. Sampling review and appendix C were provided byLloyd Hicks, Statistical Methods Division. Robert Kominski, Education and SocialStratification Branch and Steve W. Rawlings, Marriage and Family Branch, Popula-tion Division, reviewed the contents of the report. Overall direction was provided byArthur J. Norton, Assistant Chief, Population Division. Data collection was con-ducted by Bureau of the Census interviewers under the overall direction of StanleyD. Matchett, Chief, Field Division.
The staff of Publication Services Division, Walter C. Odom, Chief, performedpublication planning, design, composition, editorial review, and printing planningand procurement. Linda H. Ambill performed publication coordination and editing.
CURRENT POPULATION REPORTS
Population Characteristics
Series P-20, No. 426Issued April 1988
School Enrollment--Social and Economic
Characteristicsof Students:
October 1985and 1984
by Rosalind R. Bruno
val OF coaf
S. V Stt.1.0
.470 tfr
U.S. Department of CommerceC. William Verity, Secretary
Robert Ortner, Under Secretaryfor Economic Affairs
BUREAU OF THE CENSUSJohn G. Keane, Director

BUREAU OF THE CENSUSJohn G. Keane, Director
C. L. Kincannon, Deputy DirectorWilliam P. Butz, Associate Director
for Demographic FieldsRoger A. Herriot, Senior Demographic
and Housing Analyst
POPULATION DIVISIONPaula J. Schneider, Chief
SUGGESTED CITATION
U.S. Bureau of the Census, Current Population Reports, Series P-20,No. 426, School Enrollment Social and Economic Characteristics ofStudents: October 1985 and 1984', U.S. Government Printing Office,Washington, D.C., 1988
5

Contents
iii
Page
Introduction 1
Highlights 1
Overall enrollment trends 1
Preprimary enrollment 1
Kindergarten 2Nursery school 2
Is preprimary schoo; also day care? 3Enrollment of ioung adults 3
TEXT TABLES
tt. Preprimary enrollment c: children 3 to 5 years old by full-day attendance, publiccontrol and race: October 1970 to 1985 5
B. Preprimary enrollment rate of 3- to 5-year-olds by age, race, region, andmetropolitan status: Octobe, .985 5
C. Enrollment characteristics of preprimary students 3 to 5 years. old, by region andmetropolitan status: October 1985 6
D. Preprimary enrollment status and full-day attendance for children 3 to 5 yearsold, by labor force status of mother and age: October 1985 6
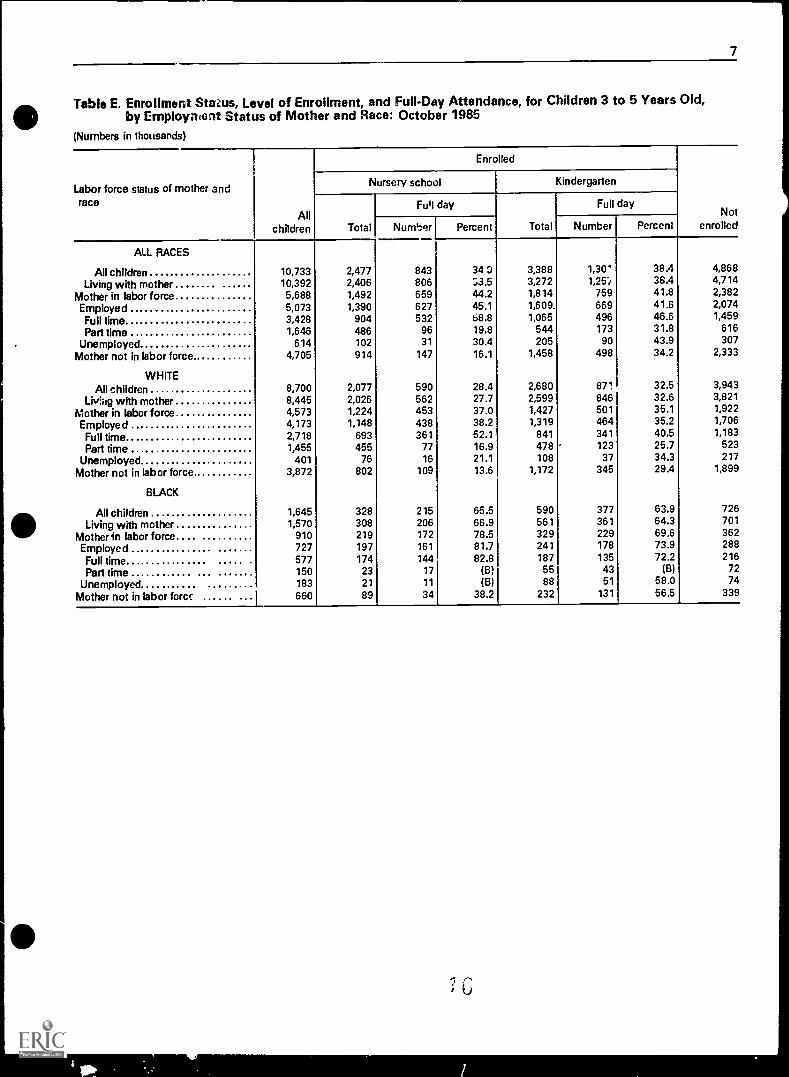
E. Enrollment status, level of enrollment, and full-day attendance, for children 3 to 5years old, by employment status of mother and race: October 1085 7
F. Enrollment status of persons 18 to 21 years old by race,.Hispanic origin and sex:October 1985 and 1975 8
FIGURE
1. Enrollment status of persons 18 to 21 years old by race: October 1975 and 1985. 4
DETAILED TABLES
1. Enrollment status for persons 3 to 34 years old, by age, sex, ram, Hispanicorigin, and Mexican origin: October 1985 9
2. Enrollment status for persons 3 to 34 years old by residence, age, race, Hispanicorigin, and Mexican origin: October 1985 12
3. Level of enrollment for persons 3 to 34 years old by control of school, residence,sex, race, Hispanic origin, and Mexican origin: October 1985 16
4. Level of enrollment for persons 3 years old and over, by age and sex: Octobe%1985 19
5. Attendance status for nursery school and kindergarten students 3 t; 6 years oldby level and control of school, residence, age, race, and Hispanic origin:October 1985 20
6. Attendance status for college students 16 to 34 years old by sex, age, residence,year and control of college, race, and Hispanic origin: October 1985 21
6

iv
7. Enrollment status in 1984 for persons 14 to 24.years old by educationalattainment, age, sex, race, and Hispanic origin: October 1985 22
8. Year of high school graduation for persons 16 to 34 years old by educationalattainment, enrollment status, sex, and race: October 1985 25
9. Enrollment rates for persons 3 to 34 years old by age, race, Hispanic origin, andregion: October 1985 27
10. Marital status for persons 14 to 34 years old by level and status of enrollment,attendance status, age, sex, and race: October 1985 28
11. Enrollment status of primary family members 3 to 34 years old by educationalattainment of family householder, le eel and control of school, sex, race, andHispanic origin: October 1985 30
12. College attendance of primary family members 18 to 24 years old, by familyincome, race, and Hispanic origin: October 1985 35
13. Primary family members 18 to 24 years old by family income, enrollment status,control of school, marital status, sex, race, and Hispanic origin: October 1985 36
14. Primary family members 3 to 17 years old by family income, enrollment statas,level and control of school, sex, race, and Hispanic origin: October 1985 40
15. Single grade of enrollment and high school graduation status for persons 3 to 34years old by age, sex, race, and Hispanic origin: October 1985 44
16. Modal grade of enrollment and age for persons 3 to 21 years old by sex, race,and Hispanic origin: October 1985 48
17. Persons 35 years old and over by enrollment and attendance status, labor forcestatus, marital status, sex, and race: October 19(35 51
18. Enrollment of college undergraduates 14 to 34 years old by type of college,residence, age, and sex: October 1985 52
19. Attendance status of college undergraduates 16 to 34 years old by sex, age,residence, and type, year, and control of college: October 1985 53
20. Year of high school graduation for college undergraduates 16 to 34 years old bytype and year of college and sex: October 1985 54
21. Enrollment status in 1984 for college undergraduates 14 to 24 years old by typeof college, educational attainment, age, and sex: October 1985 54
22. College undergraduates 14 to 34 years old by type of college and region:October 1985 55
23. Marital status of college undergraduates 14 to 34 years old by type of college,attendance status, age, and sex: October 1985 56
24. Undergraduate attendance status of primary family members 14 to 34 years oldby educational attainment of family householder and type and control ofcollege: October 1985 57
25. Primary family members 18 to 24 years old enrolled as undergraduates by familyincome, marital status, type and control of college, and sex: October 1985 58
26. Enrollment status for persons 3 to 34 years old, by age, sex, race, Hispanicorigin, and Mexican origin: October 1984 59
27. Level of enrollment for persons 3 to 34 years old by control of school, sex, race,Hispanic origin, and Mexican origin: October 1984 61
28. Level of enrollment for persons 3 years old and over, by age and sex: October1984 62
29. Attendance status for nursery school and kindergarten students 3 to 6 years oldby level and control of school, age, race, and Hispanic origin: October 1984 63
30. Attendance status for college students 16 to 34 years old by sex. age, year andcontrol of college, race, and Hispanic origin: October 1984 64
31. Enrollment status in 1983 for persons 14 to 24 years old by educationalattainment, age, sex, race, and Hispanic origin: October 1984 65
32. Year of high school graduation for persons 16 to 34 years old by educationalattainment, enrollment status, sex, and race: October 1984. 68
33. Enrollment rates for persons 3 to 34 years old by age, race, Hispanic origin, andregion: October 1984 70

e 34. Marital status for persons 14 to 34 years old by level and status of enrollment,attendance status, age, sex, and race: October 1984 71
35. Enrollment status of primary family members 3 to 34 years old by educationclattainment of family householder, level and control of school, sex, race, andHispanic origin: October 1984 73
36. College attendance of primary family members 18 to 24 years old, by familyincome, race, and Hispanic origin: October 1984 80
37. Primary family members 18 to 24 years old by family income, enrollment status,control of school, marital status, sex, race, and Hispanic origin: October 1984 80
38. R imary family members 3 to 17 years old by family income, enrollment status,level and control of school, sex, race, and Hispanic origin. October 1984 84
39. Single grade of enrollment and high school graduation status for persons 3 to 34years old by age, sex, race, and Hispanic origin: October 1984 88
40. Modal grade of enrollment and age for persons 3 to 21 years old by sex, rare,and Hispanic origin: October 1984 92
41. Persons 35 years old and over by enrollment and attendance status, labor forcestatus, marital status, sex, and race: October 1984 95
42. Attendance status of college undergraduates 16 to 34 years old by sex, age, andtype, year, and control of college: October 1984 96
43. Year of high school graduation for college undergraduates 16 to 34 years old bytype and year of college and sex: October 1984 97
44. Enrollment status in 1983 for college undergraduates 14 to 24 years old by typeof college, educational attainment, age, and sex: October 1984 97
45. College undergraduates 14 to 34 years old by type of college and region:October 1984 98
46. Marital status of college undergraduates 14 to 34 years old by type of college,attendance status, age, and sex: October 1984 99
47. Undergraduate attendance status of primary family members 14 to 34 years oldby educat onal attainment of family householder and type and control ofcohege: October 1984 100
48. Primary family members 18 to 24 years old enrolled as undergraduates by familyincome, marital status, type and control of college, and sex: October 1984 101
APPEDIXES
A. Supplementary tables 103B. Definitions and explanations 119C. Source and reliability of the estimates 125
APPENDIX TABLES
A-1. Year of college in which enrollee, for college students 14 years old and over bytype of school, full-time status, race, Hispanic origin, and sex: October 1985and 1984 103
A-2. School enrollment of persons 3 to 34 years old, by level and control of school,race, Hispanic origin: October 1955 to 1985 109
A-3. Percentage of persons 3 to 34 years old enrolled in school, by age, sex, andrace: October 1955 to 1985 111
A-4. Age distribution of college students 14 years old and over, by sex: October 1947to 1985 113
A-5. College enrollment of persons 14 to 34 years old, by sex, race, and Hispanicorigin: October 1965 to 1985 115
A-6. College enrollment of students 14 to 34 years old, by type of college, attendancestatus, age, and sex: October 1970 to 1985 116
A-7. Civilian college enrollment by sex and armed forces pa.ticipation for males 18 to24 years old: October 1960 and 1965 to 1985. 118
'6
v
vi
C-1. Generalized standard errors for estimated numbers of persons: Total or White ... 129C-2. Generalized standard errors for estimated numbers of persons: Black and
Hispanic. 130C-3. Generalized standard errors for estimates percentages: Total or White 130C-4. Generalized standard errors for estimated percentages: Black and Hispanic 131C-5. Param6ters and factors to be used for school enrollment characteristics for direct
computation of standard errors 131

1
0School Enrollment--Social and Economic Characteristics ofStudents: October 1985 and 1984
INTRODUCTION
This report presents data on school enrollmentfrom the October supplements to the Current Popula-tion Survey (CPS), collected in 1984 and in 1985. Thestatistical tables present data for student, attendingnursery school through college y age, race, Spanishorigin, sex, marital status, household relationship,residence, and family income. The tables are limitedto enrollment of the civilian noninstitutionul popula-tion in regular schools, and thus exclude enrollmentsin vocational schools, adult education classes, andspecial schools. This report also contains summarydata from earlier CPS surveys (appendix A) and adiscussion of recent enrollment trends. Advance reports,based on the October 1984 and 1985 CPS data,covered changes in the number of persons enrolled inschool and were released earlier as Current Popula-tion Reports, Series P-20, Nos. 404 and 409.
HigHights
Elementary and high school enrollment was 40.8million (± 0.4)1 in 1985, down from 46.1 million(± 0.4) in 1975.
Enrollment rates of 6- to 15-year-olds remainedessentially the same, with changes in enrollmentmirroring changes in the size of the school-agepopulation. The enrollment rate of 16- and 17-year -olds grew slightly.
There were 12.5 million (± 0.3) college students in1985, 15 percent (± 3) above enrollme.it a decadeearlier.
The college enrollment rate of Black 18- to 21-year -olds did not change from 1975 to 1985itremained at 25 percent (± 2), while the proportionof the age group who were high school dropoutsdeclined by 10 percentage points ( ±3) to 17 per-cent ( ± 2).
'The data in this report are from a sample survey of thepopulation and, therefore, are subject to both nonsampling andsampling error. The number in parentheses is equal to 1.6 times thestandard error of the estimate. This gives the 90-percent confidenceinterval when added to and subtracted from the estimate. A com-plete discussion of confidence intervals and standard errors is inappendix C.
Preprimay enrollment of 3- to 5-year-olds was 5.9million ( ± 0.2) in 1985, an 18 percent ( ±5) increaseover the number enrolled a decade earlier, due toan increase in the population of 3- to 5-year-oldsand a rise in their enrollment rate.
In 1985, 38 percent (± 2) of kindergarten studentsattended full day, up from 14 percent ( ±2) in 1970.
In 1985, 34 percent ( ± 3) of nursery school studentsattended full day, compared with 27 percent ( ± 3) in1970.
OVERALL ENROLLMENT TRENDS
Total school enrollment of the population 3 yearsold and over in 1985 was 59.8 million (table 4), adecrease of 4 percent since 1975. While elementaryschool and high school enrollment continued to declinein the 1980's,2 nursery school and kindergarten enroll-ment grew. The long-term decline in total births wasreversed in the late 1970's and consequently, largercohorts of children have begun to move into thepreprimary and early elementary grad's. Llementaryschool enrollment appears to have bottomed out andis not likely to decline further in the near future.Increases have been observed in the first two gradessince 1982. The impact of the larger cohorts enteringelementary school should be evident in total elemen-tary school enrollment numbers before 1990. From1985 to 1990 the elementary school-age population (6to 13 years old) will increase by over 2 million (8percent) having decreased by 6.7 million since 1970.3
College enrollment grew by 15 percent from 1975to 1985. Sixty-five percent of the growth was in thenumber of students 25 years old and over. Thoseolder students were 34 percent of all student:, in 1975and 38 percent in 1985.
PREPRIMARY ENROLLMENT
Kindergarten and nursery school enrollment of 3-to 5-year-olds not only has grown over the last decadeand a half (from 4.1 million to 5.9 million students), butalso ha:, become increasingly full-day (table A).
2Elementary school enrollment began to decline in the early1970's; high school enrollment began to decline in the late 1970's.
3Table 15 and Current Population Report, Series P-20, No. 222,School Enrollment. October 1970, Series P-25, No. 952, Projectionsof the Population of the United States, By Age, Sex, and Race. 1983to 2080; and unpublished data.
10

2
Kindergarten. Traditionally, attendance in kindergar-ten has been in half-day classes, as a gradual intro-duction to the elementary school system. The propor-tion of kindergarten students attending school `..111 dayexpanded from 14 percent to 38 percent between1970 and 1985. There may be many reasons for theintroduction offull-day kindergarten programs to schoolsystems. They may include the perceived educationalvalue of a full class-day, as early childhood educationhas become more common and significant propor-tions of young children attend nursery school. Also,the expense and difficulty of providing transportationin less populated areas for kindergarten students inhalf-day classes may have contributed to a decision toimplement full-day programs. Services such as reducedcost meals and health care may make a full-dayprogram desirable in some areas.
There are apparent regional differences in enrn1I-ment and in type of attendance in kindergarten. About87 percent of all 5-year-olds were enrolled in prepri-mary school in October 1985 (most in kindergarten).The proportions enrolled varied from 81 percent in theNortheast to 91 percent in the Midwest (table B).Substantial differences existed between regions infull-day enrollment. The South, with the shortest his-tory of kindergartens in the outlic schools, Ird thelargest proportion of students attending full day in1985, 65 percent (table C). The proportions cf kinder-garten utudents attending full day in the three otherregions were 36 percent in the Northeast and 20percent or less in the Midwest and West. The tradi-tional half-day kindergarten program had not beeninstitutionalized in the South, as it had been, overmany decades, in the other regions. When kindergar-tens were added to the public elementary schools inthe South, it may have been easier for school systemsto introduce new programs as full-day programs thanit was for school systems in the other regions tochange traditional half-day programs. From 1970 to1985 the proportion of 5-year-olds enrolled in schoolin the South rose from 47 to 87 percent. in the rest ofthe country in 1970, about 79 percent were enrolled inpreprimary s.lhoo1.4
Although there was little difference in the enroll-ment rate of 5-year-ulds by metropolitan status ofresidence (table B), kindergarten students in centralcities and nonmetropolitan areas were more likelythan those in the suburbs to attend full day (table C).This may reflect both the desire for educational enrich-ment in less affluent areas and the expense of bus-sing.
About 64 percent of Black kindergarten studentswere attending full day in 1985, twice the proportionof Whites (table A). The higher proportion of Blacks
4Unpublished data from October 1970 Current Population Sur-vey.
attending full day may be explained in part by kinder-garten enrollment in the South, since about 6 in 10Black kindergarten students were in the South, com-pared with 3 in 10 non-Black stude.its.5
Nursery school, As increased proportions of parentsseek out early educational opportunities for preschool-hildren, enrollment rates of 3- and 4-year-olds, thedominant group of nursery school students, rose from21 percent in 1970 to 39 percent in 1985 (table A-3).The proportion of children attending nursery schoolfull day increased from 27 percent in 1970 to 34percent in 1985. While full-day attendance in kinder-garten is a relatively nt w phenomenon, a substantialproportion of nursery school students attended fullday in both 1970 and 1985 (table A).
Although in all comparisons in table B, 4-year-oldswere significantly more likely to be enrolled than3-year-olds, all further discussions of enrollment ofnursery school age children are for 3- and 4-year-oldscombined.
Some geographic differences in nursery schoolattmclance are noteworthy. About half of 3- and4-year-olds in the Northeast were enrolled in school in1985, significantly above the other regions whichranged from 35 to 39 percent (table B). Nursery schoolstudents in the South were much more likely thanothers to attend full day-53 percent, compared withone-quarter of those in the remainder of the country.Children living in metropolitan suburbs were morelikely than those in central cities or . nonmetropolitanareas to attend school; however, it was nursery schoolstudents in central cities who were most likely toattend full day (table C).
Black and White 3- and 4- year -olds did not differsignificantly in the proportion er oiled in school in1985 (table B). Of children enrolled in nursery school,however, twice the proportion of Blacks as Whitesattended full day (66 percent vs. 28 percent) (table A).The higher full-day attendance for Blacks does notappear to be related to a different labor force statusdistribution of their mothers. In each status, Blackchildren were more likely than White children to beenrolled full day (table D). A factor contributing to thedifference is that Blacks were more likely to be in theSouth and in central cities, where full-day attendancewas most common.
In all regions roughly one-third of nursery schoolstudents were in public schools. Some )ublic elemen-tary school systems included preschoc' programs. Inaddition, the Federal Head Start program is active inall regions and comprises about half of public nursery
5From detailed tabulations available from tl-,e Bureau of theCensus upon (first (65 pages for $20.00).

e
3
school enrollment.° Of children attending nursery school,those in suburbs of metropolitan areas were leastlikely to attend public programs. Head Start is mostactive in areas which demonstrate economic need,largely central cities and rural areas. About 40 percentof nursery school students in central cities and non-metropolitan areas attended pubic nursery schoolscompared with 27 percent in the suburbs (table C).Black children were twice as likely as Whites to attendpublic nursery school (table A).
IS PREPRIMARY SCHOOL ALSO DAY CARE?
Because of nearly universai availability of kindergar-ten, the vast majority of 5-year-olds were enrolled inschool in 1585 (including some in first grade). There isvirtually no difference in the proportion of 5-year-oldsenrolled by mother's labor force status (table D).There was some discrepancy in the proportions enrolledfull day, between children whose mothers worked andthose whose mothers did not work, but it was notgreat enough to suggest that full-day kindergartenprograms were used primarily as child care arrange-ments for working mothers. Nevertheless, some work-ing parents may opt for a school with a convenientfull-day program. Forty-two percent of kindergartenstudents whose mothers were in the labor force attendedful! day (including 47 percent of those whose motherswere employed full time), compared with 34 percentof those whose mothers were not in the labor force(table E).
Nursery school, on the other hand, appeared morelikely than kindergarten to serve as day-care, eventhough a much smaller proportion of nursery schoolage children than kindergarten age children attendedschool (20 percent of 3- and 4-year-olds in 1970 and39 percent in 1985, compared with 80 percent or moreof 5-year-olds in both years)! There was a strongerrelationship between mother's labor force status andnursery school attendance than between mother'slabor force status and kindergarten attendance. Three-and four-year-old children with mothers in the laborforce were more likely than children with mothers notin the labor force to attend school (mostly nurseryschool)-44 percent vs 33 percent° among 5-year-olds there was no differenceabout 87 percent ofeach group (table D).
The difference is more striking when the relation-ship of mother's labor force status to full-day atten-dance is considered (table E). About 6 in 10 nursery
°Depirtment of Health and Human Services, Head Start Pro-gram.
'Unpublished data from October 1C70 Current Population Sur-vey.
°An analysis of trends appears in Current Population Report,Series P-20, No. 408, School Enrollment Social and EconomicCharact 'istics of Students: October 1982.
school students v.' lete mothers worked full time, (59percent) were attending full day compared with only16 percent of those whose mothers were not in thelabor force (table E). The proportions for kindergartenstudents ranged from 32 to 47 percent (discussedabove).
The data suggest, then, that a significant fraction ofnursery school enrollment, particularly full day, mayalso serve as day-care for children of working parents.On the other hand, the substantial proportion of chil-dren attending, among those whose mothers werenot in the labor force, provides sufficient evidence thatnursery school serves a wider clientel seeking earlychildhood education than just families also seekingchild care.
ENROLLMENT OF YOUNG ADULTS
The traditional college age population, 18 to 21years old, is more likely than any other age group tobe enrolled in college, although, because of the increasedenrollment of older students in recent years, they areno longer the majority of all college students (tableA-4). In 1972 (the first year data we,e available for allages), 18- to 21-year-olds were 53 percent of allcollege students; in 1985, they were only 44 percentof all students. The number of young students (18 to21 years old) grew by less than 1 million (15 percent),while the number of older students grew by 2.7 million(68 percent) in the period (table A-4).
The major educational transitions of America's youthoccur between 18 and 21 years old. These transitionsare represented in table F and figure 1, as persons ofthis age are distributed across four mutually exclusivestatuses: enrolled in high school, high school dropout,high school graduate not enrolled in college, andenrolled in college. Overall, in 1985 the enrollmentstatuses of men and women were not very different:men were slightly more likely than women not to havefinished high school (i.e. still enrolled or dropouts)(table F), while about equal proportions were enrolledin college.
Analyses of school enrollment data often havecompered the proportions of Blacks and Whites whowere either high school graduates and college enroll-ees or high school dropouts (not enrolled, not highschool graduate). However, the fact that a substantialproportion of Blacks and Hispanics were still in highschool beyond age 17 has not been noted widely(table F). Twice the proportion of 18- to 21-year-uldBlacks and Hispanics as Whites remained in highschool in 1985. Because of higher proportions belowthe modal grade in earlier years of school, Blacks andHispanics may graduate at older ages than Whites(table 16).

An earlier report in this series9 showed that thecollege enrollment of Black high school graduates 18to 24 years old grew from 1967 to 1975 to be aboutequal to Whites. After 1975, the proportion of Blackhigh school graduates enrolled in college declined,while the proportion of White high school graduatesenrolled continued to grow. Other changes haveoccurredsince 197: . rovide a more complete perspectivefrom whict analyze these enrollment trends: forBlacks 18 to 21 years old, there was a 10 percentagepoint decline in the proportion who were high schooldropouts (to 17 percent in 1985 which brought thedropout proportion close to that for Whites) Therewas also a complementary 10 percentage point increasein the pool of high school graduates from which
°Current Population Report, Series P-20, No. 404, School Enroll-mentSocial and Economic Characteristics of Students: October1984 (Advance Report).
college enrollees are drawn, to 71 percent of the agegroup (table F). Of those high school graduates, onlythe proportion who were not enrolled in college alsorose; the proportion of the age group enrolled incollege did nc -hangeit remained at 25 percent. Inother words, the higher proportion completing highschool combined with no change in the college-goingrate had the effect of lowering the percentage ofgraduates who went on to college.
For Whites, there was less change in the decade: 81percent of 18- to 21-year-olds were high school grad-uates in both years, the proportion enrolled in collegerose 4 percentage points to 39 percent in 1985, andthe proportion who were dropouts decreased slightly.
Among Hispanics, the proportion of 18- to 21-year -olds who were dropouts was substantially largerthan for the other groups. The proportions enrolled inhigh school and college were not different from thosefor Blacks table F).
Eleven detailed tabulations on preprimary enrollment of 3- to 5-year-olds by age, race, and Hispanic origin, bymaternal demographic, social, and economic characteristics, comprising 65 pages of computer outpL., areavailable for $20. Ask for the "preprimary tabulations," and make check payable to "Commerce-Census."Direct inquiries and requests to Paul Siegel, Population Division, U.S. Bureau of the Census, Washington, DC20233. Telephone (301) 763-1154.
Figure 1.Enrollment Status of Persons 18 to 21 Years Old byRace: October 1975 and 1985
100Percent
90
80
70
60
50
40
30
20
10
0
In college
High school graduate-no: enrolled
High school dropout
IIII In high school
34.638.8
4.7
1975 1985
White
5.1
24.9 24 8 24.4 22.3
37.8
12.0 10.6
1975 1985
Black
1975 1985
Hispanic origin
Highschoolgraduate
Not highschoolgraduate
10
e

5
Table A. Preprimary Enrollment of Children 3 to 5 Years Old by Full-day Attendance, Public Control. andRace: October 1970 to 1985
(Numbers in thousands)
CharacteristicYear
1985 1980 1975 1970
All races 10,733 9,284 10,185 10,949
Enrolled in preprimary school 5,865 4,878 4,955 4,104
Percent enrolled 54.6 52.5 48.6 37.5Enrolled in nursery school 2,477 1,981 1,745 1,094
Percent full day 34.0 34.4 33.9 26.6
Pert;ent in public school 34.2 31.7 32.7 30.3Enrolled in kindergarten ",388 2,897 3,211 3,010
Percent full day 38.4 30.0 21.9 13.5
Percent in public school 84.0 84.2 83.5 83.0
White 8,700 7,581 8,441 9,098Enrolled in preprimary school 4,757 3,994 4,106 3,443
Percent enrolled 54.7 52.7 48.6 37.8Enrolled in nursery school 2,077 1,632 1,429 891
Percent full day 28.4 28.7 26.9 21.2
Percent in public school 29.5 26.2 27.2 22.1
Enrolled in kindergarten 2,680 2,362 2,677 2,552
Percent full day 32.5 24.0 19.1 10.5
Percent in public school 82.5 83.1 82.5 82.3
Black 1,645 1,445 1,521 1,680
Enrolled in preprimary school 919 749 732 586Percent enrolled 55.8 51.8 48.1 34.9
Enrolled in nursery school 328 294 276 178
Percent full day 65.5 66.0 68.1 54.5
Percent in public school 63.7 61.2 62.0 72.5Enrolled in kindergarten 590 455 455 408Percent full day 63.9 60.7 37.4 31.6
Percent in public school 89.8 89.2 90.8 88.0
Table B. Preprimary Enrollment Rate of 3- to 5-Year-Olds by Age, Race, Region, and Metropolitan Status:October 1985
(Numbers in thousands)
Race, region, and metropolitan status
3 and 4 years old
5 yea rs old3 years old 4 years old
All Percent All Percent All Percent All Percent
children enrolled children enrolled children enrolled children enrolled
All races 7,192 38.9 3,594 28.8 3,598 49.1 3,542 86.5
White 5,836 38.6 2,919 28.5 2,917 48.6 2,864 87.5
Black 1,100 42.7 550 33.4 550 52.0 545 82.5
Northeast 1,288 48.6 661 34.8 627 63.1 604 81.2
Midwest. 1,89e 34.7 940 25.0 954 44.3 922 91.4
South 2,404 38.9 1,210 31.0 1,194 46.9 1,209 86.7
West 1,607 36.3 784 24.9 823 47.1 807 84 7
Metropolitan areas 4,876 41.2 2,469 30.9 2,407 51.8 2,345 85.2
Central city 2,015 37.0 1,016 26.4 999 47.8 893 82.1
Outside central city 2,861 44.2 1,453 34.1 1,408 54.6 1,452 87.1
Nonmetropolitan areas 2,316 34.2 1,125 24,2 1,191 43.6 1,196 89.2
9

6
Table C. Enrollment Characteristics of Preprimary Students 3 to 5 Years Old, by Region and teietropolitanStatus: October 1985
(Numbers in thousands)
Nursery school Kindergarten
Region and metropolitan status Percent Percent
All students Full day Public school All students Full jay Public schoo!
United States 2,477 34.0 34.2 3,388 38.4 84.0Northeast 537 26.8 33.0 580 36.2 79.8Midwest 654 17.7 34.3 846 15.6 86.2South 739 52.8 31.8 1,244 65.3 83.3West 548 35.2 38.3 718 20.3 86.2
Metropolitan areas 1,78' 35.5 32.2 2,226 3.9 80.9Central city 625 45.4 42.2 853 45.4 80.2Outside central city 1,157 30.2 26.7 1,373 30.1 81.4
Nonmetropolitan areas 696 30.2 39.2 1,162 43.1 90.0
Table D. Preprimary Enrollment Status and Full-day Attendance for Children 3 to 5 Years Old, by LaborForce Status of Mother and Age: October 1985
(Numbers in thousands)
Labor force status of mother and ageAll children
Percent enrolled
Total Full day
3 and 4 years old 7,192 38.9 13.8Mother in labor force 3,796 43.6 19.6Employed full time 2,276 43.0 25.6Mother not in labor force 3,172 33.2 6.5
3 years old 3,594 28.8 9.7Mother in labor force 1,880 34.3 15.3Employed full time 1,143 35.0 20.2Mother not in labor force 1,599 22.3 2.9
4 years old 3,598 49.1 17.9Mother in labor force 1,916 52.8 23.7Employed full time 1,133 51.1 30.9
Mother not in labor force 1,573 44.3 1-12
5 years old 3,542 86.5 32.5Mother in labor force 1,892 87.2 35.7Employed full time 1,152 85.9 38.7
Mother not in labor force 1,532 86.0 28.6
7
Table E. Enrollment Sta'eus, Level of Enrollment, and Full-Day Attendance, for Children 3 to 5 Years Old,by Employnteat Status of Mother and Race: October 1985
(Numbers in thousands)
Labor force status of mother andrace
Allchildren
Enrolled
Notenrolled
Nursery school Kindergarten
Total
Full day
Total
Full day
Numts.qr Percent Number Percent
ALL RACES
All children 10,733 2,477 843 34 0 3,388 1,30' 38.4 4,868
Living with mother 10,392 2,406 806 8.3.5 3,272 1,25/ 36.4 4,714
Mother in labor force 5,688 1,492 659 44.2 1,814 759 41.8 2,382
Employed 5,073 1,390 627 45.1 1,609. 669 41.6 2,074
Full time 3,428 904 532 68.8 1,065 496 46.6 1,459
Part time 1,646 486 96 19.8 544 173 31.8 616
Unemployed.... 614 102 31 30.4 205 90 43.9 307
Mother not in labor force. 4,705 914 147 16.1 1,458 498 34.2 2,333
WHITEAll children 8,700 2,077 590 28.4 2,680 871 32.5 3,943
Liviiig with mother 8,445 2,026 562 27.7 2,599 846 32.6 3,821
Mother in labor force 4,573 1,224 453 37.0 1,427 501 35.1 1,922
Employed 4,173 1,148 438 38.2 1,319 464 35.2 1,706
Full time 2,718 693 361 52.1 841 341 40.5 1,183
Part time ... 1,455 455 77 16.9 478 123 25.7 523
Unemployed 401 76 16 21.1 108 37 34.3 217
Mother not in labor force. 3,872 802 109 13.6 1,172 345 29.4 1,899
BLACK
All children 1,645 328 215 65.5 590 377 63.9 726
Living with mother 1,570 308 206 66.9 561 361 64.3 701
Mother in labor force 910 219 172 78.5 329 229 69.6 362
Employed 727 197 161 81.7 241 178 73.9 288
Full time 577 174 144 82.8 187 135 72.2 216
Part time 150 23 17 (B) 55 43 (B) 72
Unemployed 183 21 11 (B) 88 51 58.0 74
Mother not in labor force ...... ... 660 89 34 38.2 232 131 56.5 339

8
Table F. Enrollment Status of Persons 18 to 21 Years Old by Race, Hispanic Origin and Sex:October 1985 and 1975
(Numbers in thousands)
Sex, race, andHispanic origin
1985 1975
Number
Percent
Number
Percent
To:JI
Enrolledin highschool
High schoolgraduate
Highschool
dropout Total
Enrolledin highschool
High schoolgraduate
Highschool
dropout
Incollege
Not incollege
Incollege
Not incollege
Both Sexes
All races 14,883 100.0 6.0 37.1 42.8 14.1 15,693 100.0 5.7 33.5 44.5 16.3White 12,349 100.0 5.1 38.8 42.5 13.6 13,448 100.0 4.7 34.6 46.0 14.7Black 2,149 100.0 11.1 24.8 46.6 17.5 1,997 100.0 12.5 24.9 35.6 27.0Hispanic (of anyrace) 1,144 100.0 10.6 22.3 37.8 29.3 899 100.0 12.0 24.4 32.8 30.8
Men
All races 7,260 100.0 7.5 36.7 40.3 15.6 7,584 100.0 7.4 35.4 41.3 15.9White 6,069 100.0 6.2 38.1 40.5 15.2 6,545 100.0 6.2 36.9 42.8 14.1Black 1,017 100.0 14.3 25.7 41.1 19.1 911 100.0 15.9 23.9 31.1 29.0Hispanic (of anyrace) 551 100.0 11.6 17.6 32.7 37.7 416 100.0 17.3 25.2 29.3 27.9
Women
All races 7,623 100.0 4.7 37.5 45.2 12.6 8,109 100.0 4.2 31.8 47.4 16.6White 6,280 10C.0 3.9 39.5 44.5 12.0 6,903 100.0 3.2 32.4 49.0 15.3Black 1.132 100.0 8.3 24.0 51.6 16.1 1,085 100.0 9.7 25.8 39.2 25.4Hispanic (of anyrace) 594 100.0 9.6 26.4 42.4 21.4 484 100.0 7.6 23.6 35.7 33.1

Table 1. Enrollment Status for Persons 3 to 34 Years Old, by Age, Sex, Race, Hispanic Origin, and Mexican Origin:October 1985
0.1,btra in thousand, (.1.11:an non ins pop,iatinn Fur avr,b01, sat tart
9
Age, sex, race, Hispanic °nein,and Yerican origin Total
Popu-lation
broiled in 4choel
Below c 'liege
level'In college
Not enrolled in school
Totali High school
Total1_ Not high school
graduate graduate
Numberl Percent Number Percent Number Percent Number Percent Number Percent Number Percent
iLL RACES
Both sexes, 3 to 34 years... 120,000 58,013 48 3 47,151 39.3 10,861 9.1 61,987 51.7 47,200 39.3 14,787 12.3
7,192 2,801 38.9 2 801 38.9 - 4,391 61.1 - - 4,391 61.1
, and 6 years 6,967 6,697 96.1 6.697 96 1 - 270 3.9 - 270 3.9
' to 9 years., . , 9,827 9,740 99.1 9,740 99 1 - 87 0.9 - - 87 0.9
'0 to 13 years... . ... ... 13,197 13,109 99 3 13,109 99 3 - - 88 0.7 - - 88 0.7
.4 and 15 7,505 7,362 98.1 7,346 97.9 17 0.2 143 1.9 10 0.1 132 1.8
.6 and 17 years. , 7,260 6,654 91.7 6,409 88.3 245 3.4 606 8.3 101 1.4 505 7.0
.8 and 19 years... . . 7,204 3,716 51.6 809 11.2 2,907 40.4 3,488 48.4 2,457 34.1 1,031 14.3
T and 21 years ..... .. . 7,679 2,708 35.3 91 1.2 2.616 34.1 4,971 64.7 3,907 50.9 1,064 13.9
'2 t4 24 years 12,239 2,068 16.9 54 0.4 2,014 16.5 10,171 83.1 8,448 69.0 1,724 14.1
'5 to 29 year , ,, , , . ... . 21,046 1,942 9.2 58 0.3 1,884 9.0 19,104 90.8 16,144 76.7 2,960 14.1
10 to 34 years 19,885 1,218 0 1 38 0.2 1,180 5.9 18,667 93.9 16,133 81.1 2,534 12.7
Male, 3 to 34 years., .... ...... . . 59,770 29,436 49.2 24,091 40 3 5,345 8.9 30,334 50.8 22,739 38.0 7,594 12.7
1 and 4 years.... . . .. - .. 3,666 1,347 36.7 1,347 36.7 - - 2,319 63.3 - 2,319 63.3
and 6 years. ,... . .... . . . 3,590 3,422 95.3 3,422 95.3 - 168 4.7 - 168 4.7
' to 9 years..,. . ...... . . . 5,023 4,975 99.0 4,975 99.0 - - 48 1.0 - - 49 1.0
.0 to 13 years... . .. . . . ,, 6,743 6,691 99.2 6,691 99.2 - - 52 0.8 - - 52 0.8
'4 and 15 years 3,842 3,775 98.3 3,762 97.9 13 0.3 67 1.7 6 0.2 61 1.6
A and 17 years... .... ... ...e . 3,693 3,411 92.4 3,293 89.2 118 3.2 282 7 6 33 0.9 249 6.7
.8 and 19 years
tO and 21 years... . ,. . ... . . .. ,.
1,5503,710
1,8521,353
52.236.5
50,
40
14.2
1.1
1,3491,313
38 0
35.4
1,698
2,357
47.863.5
1,118
1,805
11,548.7
580
552
16.3
14.9
'2 to 24 years 5,939 1,114 18.8 26 0.4 1,087 18.3 4,825 81 2 3,942 66.4 883 14.9
'5 to 29 years 10,322 967 9.4 25 0.2 942 9.1 9,335 90.6 7,868 76.4 1,467 14.2
10 to 34 years.,... , .. . ...... .., 9,711 527 5.4 5 0 1 522 5.4 9,184 94.6 7,967 82.0 1,217 12.5
Female, 3 to 34 years.. 60,230 28,577 47.4 23,059 38.3 5,518 9.2 31,653 52.6 24,460 40.6 7,192 11.9
I and 4 years : mama ., 3,525 1,453 41.2 1,453 41.2 - - 2,072 58.8 - - 2,072 58.8
. and 6 years,_ 3,376 3,274 97.0 3,274 97 0 - 102 3.0 - 102 3.0
to 9 years.....,. .... .. ... .... ., 4,804 4,765 99.2 4,765 99.2 - - 39 0.8 - - 39 0.8
M to 13 years - 6,454 6,417 99.4 6,417 99 4 - - 37 0.6 - - 37 0.6
.4 and 15 years .: 3,663 3,587 97.9 3,581 97.8 3 0.1 76 2.1 4 0.1 72 2.0
.6 and 17 years mama , . 3,567 3,243 90.9 3,117 87.4 126 3.5 324 9.1 68 1.9 256 7.2
.8 and 19 year, 3,654 1,864 51.0 305 8.4 1,559 42.7 1,790 49.0 1,340 36.7 451 12.3
0 and 21 years.. .. ,... ... ,... .., 3,969 1.355 34.1 51 1.3 1,303 32.8 2,614 65.9 2,1n2 52.9 513 12.9
'2 to 2' years , z : r- 6,300 954 15.1 27 0.4 926 14.7 5,346 84.9 4,506 71.5 840 13.3
5 to 29 y e a r s 10,744 975 9.1 33 0.3 941 8.8 9,769 90.9 8,276 77.0 1,493 13.9
M to 34 years.... . ....... , .... . .,, 10,174 691 6.8 33 0.3 658 6.5 9,483 93.2 8,165 80.3 1,318 12.9
MITE .
Both sexes, 3 to 34 years .. .: .. ,. 99,370 47,452 47.8 38,118 38.4 9,334 9.4 51,918 52.2 40,044 40.3 11,873 11.9
I and 4 years 5,836 2,250 38.6 2,250 38.6 - - 3,586 61.4 - - 3,586 61.4
. and 6 years : 5,643 5,437 96.4 5,437 96.4 - 206 3.6 - 206 3.6
to 9 years. , 7,949 7,892 99.3 7,892 9° - - 57 0.7 - - 57 0.7
.0 to 13 years.... . . ..., ...... . 10,650 10,572 99.3 10,572 9).1 - - 78 0.7 - - 78 0.7
.4 and 15 years 6,126 6,007 98.1 5,996 97.9 11 0.2 119 1.9 10 0.2 109 1.8
.6 and 17 years 5,946 5,449 91.6 5,231 88.0 218 3.7 497 b.4 73 1.2 424 7.1
.8 and 19 years ..... . .. .... ... e . 5,922 3,105 52.4 566 9.6 2,539 42.9 2,817 47.6 2,002 33.8 815 13.8
0 and 21 years ..... , . ...., .... 6,427 2,318 36.1 61 0.9 2,257 35.1 4,109 63.9 3,247 50.5 863 13.4_.
2 to 24 years .... e..,. . . .... ...,, 10,283 1,744 17.0 40 0.4 1,704 16.6 8,539 83.0 7,167 69.7 1,372 13.3
'5 to 29 years 17,705 1,635 9.2 45 0 3 1,590 9.0 16,070 90.8 13,663 77.2 2,408 13.6
0 to 34 years. : 16,882 1,041 6.2 29 0.2 1,014 6.0 15,839 93.8 13,882 A2.2 1,957 11.6
Male, 3 to 34 years ......... ... ,. 49,817 24,178 48.5 19,545 39.2 4,653 9.3 25,638 51.5 19,493 39.1 6,146 12.3
I and 4 year, ... 2,992 1,116 37.3 1.116 37.3 - 1,876 62 7 - 1,876 62.7
2,893 2,767 95 7 2,767 95.7 - 126 4.3 - 126 '.3
to 9 years... . . . . . 4,080 4,052 99.3 4,052 99.3 - - 28 0.7 - - 28 0.7
.0 to 13 years 5,461 5,419 99.2 5,419 99.2 - - 42 0.8 - - 42 0.8
.4 and 15 years.... . ..... . . . .,, 3,137 3,081 98.2 3,072 97.9 9 0.3 56 1.8 6 0.2 50 1.6
.6 r^c1 17 years. 3,037 2,809 92.5 2,698 88.8 111 3.6 228 7.5 26 0.9 203 6.7
.8 and 19 years... . . .. . . . . 2,937 1.525 51.9 350 11.9 1,176 40.0 1,412 48.1 934 31.8 478 16.3
T and 21 years. ,_ 3,132 1,165 37.2 29 0.9 1,137 36.3 1,967 ,2.8 1,523 48.6 444 14.2
'2 to 24 years- 5,039 958 19.0 17 0.3 941 18 7 4,081 81.0 3,366 66.8 715 14.2,:
'5 to 29 years .... ... . 8,747 833 9.5 21 0.2 812 9.3 7,914 90.5 6,694 76.5 1,22o 14.0
10 to 34 years. 8.362 454 5.4 5 0.1 449 5.4 7,908 94.6 6,945 83.0 904 11.5
Female, 3 to 34 years...,. . . 49,553 23,274 47.0 18,572 37.5 4,701 9 5 26,279 53.0 20,551 41.5 5,728 11.6
i and 4 years.... . . . . . 2,844 1,134 39.9 1,134 39.. - - 1,710 60.1 - - 1,710 60.1
. and 6 years..,. . . . 2,750 2,070 97.1 2,670 97.1 80 2.9 - 80 2.9
to 9 years 3,869 3,840 99.3 3,840 99.3 - - 29 0.7 - - 29 0.7
.0 to 13 years 5,189 5,154 99.3 5,154 9. , - - 35 0.7 - - 35 0.7
.4 and 15 years .... . ...... 2,989 2,926 97.9 2,924 )7 8 2 0.1 63 2.1 4 0.1 59 2.0
.6 and 17 years.... .. . .. .. 2,909 2,641 90.8 2,533 87.1 108 3.7 268 9.2 47 1.6 221 7.6
.8 and 19 years 2,985 1,579 52.9 216 7 2 1,363 45.7 1,406 47.1 1,068 35.8 337 11.3
T and 21 years.... ., . ... .. .. . 3,295 1,152 35 0 32 1.0 1,120 34.0 2,141 65.0 1,724 52.3 419 12.7
'2 to 24 years . 5,244 786 15 0 22 0.4 764 14.6 4,458 85.0 3,801 72.5 657 12.5
5 to 29 ars 8,958 802 9.0 23 0.3 778 8.7 8,156 91.0 6,969 77.8 1,187 13.3
10 to 34 years ......... . .... .. . .. 8,520 589 6.' 24 0.3 565 6.6 7,931 93.1 6 938 81.4 993 11.7
See footnote, at end of table.

10
Table 1. Enrollment Status for Persons 3 to 34 Years Old, by Age, Sex, Race, Hispanic Origin, and Mexican Origin:October 1985-Continued
(Numbers in thousands. Civilian noninsittulinnal population. For rianing of symbols se, t. sii
Age, sex, race, Hispanic origin,
end u.exlcnn ortgtn Total
Enrolled in school
TotalBelow college
tenet t. callege Tm.-al
Number F
POP.'lation Number Percent Number Percent Number Percent
BLACK
Both 'axes, 3 to 34 years 16,589 8,444 50.9 7,395 44.6 1.049 6 3 8,1453 and 4 yeare 1,100 469 42.7 469 42.7 - 6315 and 6 years. .. , ..... ,.... . .... .. 1,076 1,030 95.7 1,030 95.7 - 467 to 9 years...:_ .. . 1,523 1,499 98.4 1,499 98.4 - - 2410 to 13 years _.. 2,060 2,050 99.5 2,050 99.5 1014 and 15 years.
-, : 1,129 1,106 97.9 1,100 97 4 5 0.5 2316 and 17 years., ..... , 1,084 994 91.7 978 90.2 16 1.5 9018 and 19 years..: :.: 1,072 472 44.1 214 19.9 259 24 1 60020 and 21 years.,......,,... . ,,.. .. 1,077 298 27.7 25 2.3 274 25.4 77922 to 24 years 1,567 211 13.7 14 0.9 201 12.8 1,35325 to 29 years.,,- , 2,587 192 7.4 9 0 3 185 7.1 2,39530 to 34 years.: 2,313 119 5.1 Z 0.3 112 4.8 2,195
Hale, 3 to 34 years. ,.. .. . .... 7,937 4,173 52 6 3,715 46 8 458 5.8 3,7643 and 4 years 531 184 34.6 184 34.6 3475 and 6 years
: 575 544 94 6 544 94.6 - - 317 to 9 years : .- 760 746 98.2 746 98 2 - 1410 to 13 years 1,043 1,034 99.1 1,034 99 1 - - 914 and 15 years.,... ,,,,... 572 561 98 2 557 97.5 4 0.8 1016 and 17 years :. .; ::: 546 501 91.8 495 90.7 6 1.0 4518 and 19 years., .... .,,, .. ...... - 518 256 49.5 136 26 2 121 23.3 26220 and 21 years.,: , 499 148 29.7 9 1 7 140 28 0 35022 to 24 years.,, .... ,. . . . . ... 703 93 13.2 9 1.3 84 11.9 61125 to 29 years.... .... . .. 1,157 66 5.7 2 0.2 64 5 5 1,09030 to 34 years.,,,,,.... ,,,.. , ... 1,034 40 3.9 40 3 9 994
Female, 3 to 34 years.... ...,, _. 8,652 4,271 49./ 3,680 42.5 591 6.8 4,3813 and 4 years. ,-,: 570 286 50.2 286 50.2 284S and 6 years..:, ::.: , 500 486 97.1 486 97 1 - - 14
7 to 9 years : : 763 753 38.7 753 98.7 - - 1010 to 13 years ,, ::: , i 1,017 1,016 99 9 1,016 99.9 - - I14 and 15 years..,, ...,:, ...... : . . .. 558 544 97.6 543 97.4 1 0.2 1316 and 17 years.,.: ..... .. ....
-.. . 538 493 91.6 483 89 7 10 1.9 4518 and 19 years.
, 554 216 39.0 78 14.1 138 24.9 33820 and 21 years-, .. , .. ,....... .. 578 150 26.0 16 2 8 134 23.1 42822 to 24 years . , ... ,.. ,.. ... .,,.. . 864 122 14.1 5 0.6 117 13.5 74225 to 29 years ,- ,-- 1,430 125 8.8 7 0.5 119 8.3 1,305
1,280 79 6.2 7 0 5 72 5.6 1,201
HISPANIC ORIGIN'
Both sexes, 3 to 34 years. ,... 10,631 5,070 47.7 4,491 42.2 579 5.4 5.5613 and 4 years...:- 789 213 27.0 213 27.0 5765 and 6 years. :, : . 701 662 94.5 662 94.5 - - 387 to 9 years ........... ,.., ... ... .... 1,016 1,000 98.4 1,000 98 4 1610 to 13 years.,,,..... ...,.. .. ....... 1,330 1,322 99 4 1,322 99 4 - - 814 and 15 years e- :- 630 606 96.1 606 96.1 - - 2516 and 17 years, : 665 562 84.5 547 82.1 16 2.4 10318 and 19 years 570 238 41.8 112 19.6 127 22 2 33220 and 21 years ::: : 574 137 24.0 9 1.6 128 22.4 43622 to 24 years..,, ..... , ....... .. .. 1,077 125 11.6 5 0.5 120 11 1 95225 to 29 years..,,, ... , ....... . 1,827 120 6.6 9 0.5 111 6.1 1,70730 to 34 years..,,,,...... . .... ., .... 1,452 83 5.7 6 0 4 78 5.3 1,368
Hale, 3 to 34 years.. : ...... ,. . 5,379 2,553 47 5 1,273 42 3 280 5.2 2,8263 and 4 years.... .-. ....... .. .... 431 114 26.4 114 26.4 3175 and 6 years.....:..... .. 339 95.3 339 95.3 - - 177 to 9 years :, 491 98.9 491 98 9 - - 610 to 13 years . 696 690 99.1 690 99.1 - - 614 and 15 years,,,.... . . .... , .. 288 277 96.2 277 96.2 - 1116 and 17 years.,,, ........ .. . ..... 341 303 88.9 293 86 0 10 2.9 3818 and 19 years ,- 275 106 38.6 62 22.5 44 16.2 16920 and 21 years,._,:....
., .... .... 276 56 20.3 2 0.9 53 19 4 22022 to 24 years. ,-. : 581 73 12.6 2 0.3 71 12.3 50825 to 29 years -- 917 75 8.2 3 0.3 72 7.9 64230 to 34 years 722 29 4 0 29 4 0 694
Female, 3 to 34 years 5,252 2,517 47.9 2,217 42.2 299 5.7 2,7363 and 4 years....,,,... ,.. .. 359 99 27.7 99 27.7 - 2595 and 6 years ...... ,.... .. .. . .. . 345 323 93.7 323 93.7 - 227 to 9 years.
: 520 509 98.0 509 98 0 - - 1010 to 13 years..,;
: 634 632 99.7 632 99.7 - - 214 and 15 years 342 329 96.0 329 96.0 - - 1416 aid 17 years.,.. .... 325 260 80.0 254 78 1 6 1.8 6518 and 19 years., 296 132 44 7 50 16.9 82 27.8 16320 and 21 years... .... ... ... 298 82 27.4 7 2 2 75 25.2 21622 to 24 years .. .,.. : .... . .... .... . 497 52 10.4 3 0.7 48 9.7 44525 to 29 years.. ..- ...... .. 909 45 4.9 6 0.6 39 4.3 86530 to 14 years. - 729 I 54 7.' I 5 0 7 49 6.7 670
See footnotes at end of table.
Not enroll,d in school
ercent
Highgraduate
Number
school
Percent
Not hivh
graduate
Number
school-Percent
49.1 5,756 34.7 2,389 14.457.3 631 57.34.3 46 4.31.6 24 1 J
0.5 10 0.52.1 23 2.18.3 20 1.8 70 6.5
55.9 414 38.6 186 17.372 3 588 54.6 190 17 786.3 1,074 68.5 279 17.892.6 1,941 75.0 :54 17.591.9 1,719 74.3 475 20.5
47.4 2,577 32.5 1,187 15.065.4 347 65.45.4 31 5.41.8 14 1.80.9 9 0 91.8 10 1.8
4 0.7 41 7.650.5 170 32.8 92 17.770.3 248 49.8 102 20.586.8 481 68.5 129 18.494.3 894 77.3 197 17.096.1 780 75.4 214 20.7
50.6 3,179 36.7 1.202 13 949.8 284 49.82.9 14 2.91.3 10 1.30.1 0.12.4 13 2.48.4 16 3.0 29 5.4
61.0 244 44.0 94 16.974.0 340 58.8 88 15.385.9 592 68.5 150 17.491.2 1,048 73.3 257 18.093.8 940 73.4 261 20.4
52.3 2,787 26.2 2.774 26.173.0 576 73.05.5 38 5.51.6 16 1.60.6 8 0.63.9 2 0.3 23 3.6
15.5 6 0.9 97 14.558.2 157 27.6 175 30.676.0 276 48.1 160 27.988.4 588 54.3 365 33.993.4 993 54 4 713 39 194.3 765 52.7 603 41.5
52.5 1,390 25.8 1,436 26.773.6 117 73.64.7 17 4.71.1 6 1.10.9 6 0.93.8 2 0.6 9 3.2
11.1 4 1.0 34 10.161 4 53 19.2 116 42 279.7 127 46.2 31.587.4 311 53.5 197 33.991.8 497 54.2 345 37.696.0 396 54.9 297 41 1
52 1 1,398 266 1,338 25 572.3 259 72.36.3 22 6 32.0 10 2.00 3 2 0.34.0 14 4.020 0 3 0.9 62 19.255.3 104 35 3 59 19.972.6 148 49.8 68 22.889 6 277 55.8 168 33.895 1 496 54 5 369 40.692.5 369 50.6 306 41 9

1;
Table 1. E:,rollment Status for Persons 3 to 34 Years Old, by Aye, Sex,, Race, Hispanic Origin, and Mexican OriginOctober 1985-Continued
(%urbers in th,uNand. (1v313an nonln.t Ito' to, II 14,13111 -I 1,n ror 4356,14 ' t, 4t
,N,,e, sex, ra,e, Hfspanl% ori,11,and MexItan o01610
lotion
rolled in school . .1r,113 3 ,,,,.;
Iota! Below colic.,eve! It colle,,e I ,ca: 1 .50 1
0,1 I Not .133a.e 3j , raJ,
,r,, . 1 0,414,-!--
sc .,o1at,.
Per tN..1-114.0 Per. e t Surber P, .,e6, N.u-ber Per, e it ',..-ther Per, z mber
'03)ICAN ORIGIN'
Yoc3. sere., 3 to 34 ,ear... . 0,70') 3,180 .7 5 2.,.13 43.5 -3,7 .. 0 3.520 52 5 1,911 ..!. 0 1,.+09 26 53 and 4 ears 52) 137 26.0 137 26 0 388 7. 0 356 74 05 and 6 N.eas -.------------ 481 456 9,.3 456 95 3 23 . 7 15 4
7 to 9 ;ears . s... . . ,1:#1 1319 98 . 619 9d.4 - 7 1 1 7 I.10 to 13 %ears . . 413 907 09.3 907 99 3 t 0 7 , 0..14 and 15 nears------------- 376 397 97 7 397 07 7 . - 0 1 3 - ' U 5 7 1 1
16 and 17 years.... ... . . .. 427 353 83.8 339 81 9 9 2 2 1,0 19.2 1 0 2 69 10.0IS and 19 vcars - . . .. . .. 35'o 127 35 2 63 17.4 64 17 4 233 51. 8 112 31 0 121 33.720 and 21 years.. . ,.. . . .. .., ., 370 91 19 4 3 0 7 58 15.7 30° 13 9 IhS 50,7 32..22 to 24 years 997 15 7.8 2 0.3 53 7.5 443 92.2 3"7 52 3. 27" 39.,25 to 29 years... . . . .. . . .. 1 125 56 5.0 5 0.5 51 5 1,000 .5 0 5,2 50 0 50, 15 030 to 34 years 801 35 1 5 4 0 5 32 1 795 45.5 370 ...7 5 10 50.0
Male, 3 to 34 ears 3.430 1.583 .6.1 1,449 41 2 13. 3." 1.847 53 9 913 23.71 1.60. 30.23 and 4 years . . . ..... 293 78 2,1,7 '5 26.7 215 73.3 21, 73.35 and 6 years . 259 250 915.4 250 96 4 - - 9 3.6 9 3.97 to 9 years 256 266 09.. 289 9. 4 - - 2 0 0 - - O.
10 to 13 years. 467 .62 99 0 452 99 0 - - 5 1 0 ,. 1.014 and 15 nears . .... 175 172 97.9 172 07,9 4 2 1 2 1 0 ' 1.116 and 17 years.... : ... .. ..,. 184 15 5 .0 0 161 87 1 5 2 6 10 10 0 1 0. Id 9.918 and 19 ears 190 31 5 35 19 8 11.e 123 95 1 37 20.. 8, 48.020 and 21 nears ... , .... . 181 20 11.0 /0 11 0 101 04 0 40 49 9 71 39.222 to 24 years ..,
. 360 .2 1,3 9 2 0 5 40 10 4 339 60 1 1.1 50 3 1.7 38.825 to 29 years 508 38 3 0.5 37 5.9 550 -.3 9 11/ .46 7 2.1 44 930 to 34 years .. . . 425 12 2 9 12 2 9 413 "7 1 202 -7 , 211 49.5
Female, 3 to 3. tear._ . , . - 3,270 1.598 .8 9 1,494 44,0 134 4 1 1.073 ..,1 1 7.d 2. 4 87, 20.83 and 4 nears . .. . .. 232 59 25 2 25 2 174 7 , 4 174 74 85 and 6 ears. 222 208 04.1 200 4..1 - - 13 5 . li 5 97 to 9 nears,. . , .. . . . 338 333 98 5 333 96 5 - - 5 1.5 a 1.510 to 13 ears . 445 445 00 y .45 44 y - 2 0 . 2 0 414 ard 15 years . 200 149 47.9 14 6 97 , - - 5 2 4 5 2.416 and 17 nears.. . . .. .... . . . 243 192 79.1 188 77.4 4 1 7 51 20.', ''. 20..18 and 19 nears.- :.... . . . .. 179 70 30.9 27 1. 9 43 110 91 1 75 1 9 15 19.520 and 21 years.... . ..... ... 1119 41 21 9 3 1 4 38 20 2 148 76 9e 51.5 31 25.922 to 24 yearn... :_ . . . 317 13 '.. 1 - 13 4 1 304 05 " 1,79 55 1 '.. 40. 525 to 29 >c-arc 527 1Y 3.3 2 0 . 15 1 9 510 .9 7 272 51 , 2 jn .5.130 to 34 nears. .... . . 379 21 9 4 1 0 20 5 4 352 "3" 179 47,. 17. 4,2
.1nelodts nut,' rn stool. 011,1. , id 31., 1 12
7,.av be of an, ra'.
2 U

12
Table 2. Enrollment Status for Persons 3 to 34 Years Old by Residence, Age, Race, HispanicOrigin, and Mexican Origin: October 1985
(Numbers in thousands. Civilian noninstitutional population. Por meaning of symbols, see text)
Age, residence, race,Hispanic origin,and Mexican origin
Population
Enrolled Not enrolled
Total Below collegelevels
Incollege Total
High school Notgraduate school g
highraduate
Number Percent Number Percent Number Percent Number Percent Number Percent Number Percent
ALL RACES
Metropolitan
Total..3 and 4 yearsS and 6 years old7 to 9 years old10 to 13 years old14 and 15 years old16 and 17 years old18 and 19 years old20 and 21 years old22 to 24 years old25 to 29 years old30 to 34 years old
In central city3 and 4 years old5 and 6 years old7 to 9 years old10 to 13 years old14 and 15 years old16 and 17 years old18 and 19 years old20 and 21 years old22 to 24 years old25 to 29 years old.30 to 34 years old
Outside central city..3 and 4 years old5 and 6 years old7 to 9 years old10 to 1? years old14 and 15 years old16 and 17 years old18 and 19 years old20 and 21 years old22 to 24 years old25 to 29 years old30 to 34 years old
Nonmetropulitac
Total3 and 4 years old5 and 6 years old7 to 9 years old10 to 13 years old14 and 15 years old16 and 17 years old18 and 19 years old20 and 21 years old22 to 24 years old25 to 29 years old33 to 34 years old
WHITE
Metropolitan
Total3 ann 4 years old5 and 6 years old7 to 9 years old10 to 13 years old14 and 15 years old16 and 17 years old18 and 19 years old20 and 21 years old22 to 24 years old25 to 29 years old30 to 34 years old
See footnotes at end of table.
82,1734,8764,6156,4228,6935,009
4,8084,8755,3348,76515,04213,738
32,6042,0181,7712,479
3,2511,741
1,7531,9012,1343,8706,3055,381
49,5742,8582,845
3,9425,4423,2673,0562,9743,2004,8958,737
8,357
37,8222,3162,3513,4054,5042,4962,4522,3292,345
3,474
6,0046,147
66,4303,8923, 24
5,0546,8033,9853,8123,897
4,3807,21912,4C:
11,364
39,462
2,0104,4556,3618,6254,9054,4152,620
1,9911,6321,552895
14,949747
1,6852,447
3,226
1,699
1,5601,006
749
763
673392
24,5161,2622,770
3,9145,3993,207
2,8551,614
1,242869879
504
18,552791
2,2423,3794,4842,457
2,2391,097
717
436
390323
31,4681,593
3,5105,0156,7453,8983,5072,141
1,6861,3441,284746
48.041.296.599.199.297.991.853.737.313.610.36.5
45.837.095.298.799.2
97.689.052.935.119.710.7
7.3
49.544.297.499.399.2
98.193.454.338.817.810.16.0
49.034.295.399.299.698.491.347.130.612.5
6.55.2
47.440.996.999.299.197.892.0
54.938.518.6
10.46.6
31,2712,0104,4556,3618,6254,8934,220
533
67
42
38
27
11,697747
1,6852,4473,2261,6941,496
286
39
30
28
19
19,5741,2622,7703,9145,3993,199
2,725247
28
12
10
8
15,880791
2,242
3,3794,4842,4532,189
2762412
20
11
24,5521,5933,5105,0156,7453,8913,131
35639
28
26
19
38.141.2
96.599.1
99.297.7
87.810.9
1.30.5
0.20.2
35.9
37.0
95.298.7
99.2
97.385.415.0
1.8
0.8
0.40.4
39.5
44.297.499.399.2
97.989.28.3
0.90.30.10.1
42.034.2
95.3
99.2
99.6
98.3
89.311.8
1.0
0.3
0.3
0.2
37.040.9
96.9
99.299.1
97.6
87.49.1
0.90.40.2
0.2
8,191
13
1952,087
1,9241,5901,514869
3,250
5
64720
709733645373
4,941
8
1311,3671,214857869496
2,672
450
821693424369311
6,916
7
176
1,7851,647
1,3161,258727
10.0
0.3
4.142.836.1
18.110.1
6.3
10.0
0.3
3.7
37.933.218.9
10.26.9
10.0
0.2
4.345.937.9
17.5
9.9
5.9
7.1
0.2
2.0
35.2
29.512.2
6.1
5.1
10.4
0.2
4.645.837.618.6
10.1
6.4
42,7162,866
160
6168
103393
2,255
3,3437,13313,49012,843
17,6581,271
863226
43192895
1,385
3,107
5,6324,990
25,058
1,5967528
4361
201
1,360
1,9584,026
7,8587,853
19,2711,525110
2620
39
213
1,2331,6283,039
5,6155,82;
34,9622,299
114405887
385
1,756
2,6935,87511,117
10,619
52.058.83.5
0.90.8
2.1
8.1
46.362.781.489.7
93.5
54.263.04.81.30.8
2.4
11.047.164.980.389.392.7
50.5
55.82.60.70.8
1.96.6
45.761.282.289.994.0
51.065.84.70.80.41.6
8.752.969.487.5
93.594.8
52.659.13.1
0.80.92.28.0
45.161.581.489.693.4
32,990
6
741,5652,6315,97611,547
11,191
12,880
3
28523
1,0762,4794,6554,117
20.110
3
461,0421,5553,4976,8937,075
14,210
427
8931,2762,4724,5974,942
27,279
6
51
1,2322,1214,9479,5589,365
40.1
0.11.5
32.149.368.2
76.881.5
39.5
0.2
1.627.5
50.464.173.8
76.5
40.6
0.11.5
35.048.671.478.9
84.7
37.6
0.2
1.1
38.3
54.471.1?6.680.4
41.1
0.11.3
31.6
48.468.5
77.182.4
9,726 11.82,866 58.8
160 3.561 0.968 0.897 1.9319 6.6691 14.2712 13.3
1,157 13.21,942 12.91,652 12.J
4,778 14.763.0
86 4.832 1.326 0.839 2.3165 9.4372 19.6309 14.5628 16.2977 15.5873 16.2
4,948 10.01,596 55.8
75 2.628 0.743 0.858 1.8155 5.1319 10.7403 12.6529 10.8965 11.0779 9.3
5,061 13.41,525 65.8
110 4.726 0.820 0.437. 1.4180 7.6?i0 14.6.53 15.0567 16.3
1,018 17.0882 14.4
7,663 11.62,299 59.1
114 3.140 0.858 0.981 2.0
254 6.7524 13.5572 13.1928 12.9
1,559 12.61,253 11.0

13
Table 2. Enrollment Status for Persons 3 to 34 Years Old by residence, Age, Race, HispanicOrigin, and Mexican Origin: October 1985-Continued
{Numbers in thousands. Civilian noninstitutional population. For meani..; of symbols, see text)
Age, residence, race,Hispanic origin,
and Mexican origin
WHITE -- Continued
Metropolitan -- Continued
In central city3 and 4 years old5 and 6 years old7 to 9 years old10 to 13 years old14 and 15 years old16 and 17 years old18 and 19 years old20 and 21 years old22 to 24 years old25 to 29 years old30 to 34 years old
Outside central city....3 and 4 years old5 and 6 years old7 to 9 years old10 to 13 years old14 and 15 years old16 and 17 years old18 and 19 years old20 and 21 years old22 to 24 years old25 to 29 years old30 to 34 years old
Nonmetropolitan
Total3 and 4 years old5 and 6 years old7 to 9 years old10 to 13 years old14 and 15 years old16 and 17 years old18 and 19 years old20 and 21 years old22 to 24 yew*, old25 to 29 years old30 to 34 years old
BLACK
Metropolitan
Total3 and 4 years old3 and 6 years old7 to 9 years old10 to 13 years old14 and 15 years old16 and 17 yea-s old18 and 19 years old20 and 21 years sld22 to 24 years o.d25 to 29 years old.30 to 34 years old
In central city3 and 4 years old5 and 6 years old7 to 9 years old
10 to 13 years old14 and 15 years old16 and 17 years old18 and 19 years old20 and 21 years old22 to 24 years old25 to 29 vea s old30 to 34 years old
Population
Enrolled Not enrolled
TotalBelow college
levels
In
co legeTotal
High schoolgraduate
Not highschool graduate
Number Percent Number Percent Number Percent Number Percent Number Percent Number Percent
22,337 9,857 44.1 7,411 33.2 2,446 10.9 12,480 55.9 9,206 41.2 3,274 14.7
1,358 484 35.6 484 35.6 874 64.4 874 64.41,124 1,071 95.3 1,071 95.3 53 4.7 53 4.7
1,622 1,609 99.2 1,609 99.2 13 0.8 13 0.8
2,038 2,020 99.1 2,020 99.1 18 0.9 18 0.91,092 1,058 96.9 1,055 96.6 3 0.2 34 3.1 3 0.3 31 2.8
1,135 1,012 89.1 958 84.4 54 4.8 123 10.9 10 0.9 113 10.0
1,228 687 55.9 154 12.6 533 43.4 541 44.1 301 24.5 239 19.5
1,479 554 37.5 14 0.9 540 36.5 925 62.5 730 49.3 195 13.2
2,830 572 20.2 18 0.6 555 19.6 2,258 79.8 1,793 63.4 464 16.44289( 486 10.6 17 0.4 469 10.2 4,109 89.4 3,403 74.1 706 15.4
3,837 305 7.9 12 0.3 292 7.6 3,532 92.1 2,965 77.3 567 14.8
44,093 21,611 49.0 17,141 38.9 4,470 10.1 22,482 51.0 18,074 41.0 4,409 10.0
2,533 1,108 43.8 1,108 43.8 1,425 56.2 1,425 56.22,500 2,440 97.6 2,440 97.6 61 2.4 61 2.4
3,433 3,406 99.2 3,406 99.2 27 0.8 27 0.8
4,765 4,725 99.1 4,725 99.1 41 0.9 41 0.9
2,893 2,840 98.2 2,836 98.0 4 0.2 53 1.8 3 0.1 50 1.7
2,676 2,495 93.2 2,373 88.7 122 4.6 181 6.8 40 1.5 141 5.3
2,670 L2454 54.5 202 7.5 1,252 46.9 1,216 45.5 931 34.9 285 10.7
2,901 1,132 39.0 25 0.9 1,107 38.2 1,768 61.0 1,391 48.0 377 13.0
4,389 772 17.6 11 0.2 761 17.3 3,617 82.4 3,154 71.9 463 10.6
7,805 797 10.2 9 0.1 788 10.1 7,008 89.8 6,154 78.9 853 10.9
7,528 441 5.9 6 0.1 435 5.8 7,087 94.1 6,401 85.0 686 9.1
32,939 15,984 48.5 13,566 41.2 2,418 7.3 L62955 51.5 12,765 38.8 4,191 12.7
1,945 657 33.8 657 33.8 1,287 66.2 1,287 66.2
2,019 1,927 95.4 1,927 95.4 92 4.6 92 4.62,895 2,877 99.4 2,877 99.4 17 0.6 17 0.6
3,847 3,827 99.5 3,827 99.5 19 0.5 19 0.5
2,141 2,109 98.5 2,105 98.3 4 0.2 32 1.5 4 0.2 28 1.3
2,134 1,942 91.0 1,900 89.0 42 2.0 192 9.0 22 1.1 170 7.9
2,025 964 47.6 210 10.4 754 37.2 1,061 52.4 770 38.0 )1 14.4
2,047 631 30.8 22 1.1 610 29.8 1,416 69.2 1,126 55.0 290 14.2
3,064 400 13.1 11 0.4 389 12.7 2,664 86.9 2,220 72.5 444 14.5
5,304 351 6.6 18 0.3 332 6.3 4,954 93.4 4,105 77.4 8? 16.0
5,518 297 5.4 10 0.2 287 5.2 5 220 94.6 4,517 81.9 703 12.7
12,667 6,367 50.3 5,492 43.4 874 6.9 6,300 49.7 4,599 36.3 1,701 13.4
811 361 44.5 361 44.5 450 55.5 450 55.5816 783 96.0 783 96.0 33 4.0 33 4.0
1,105 1,088 98.5 1,088 98.5 17 1.5 17 1.5
1,517 1,507 99.4 1,507 99.4 9 0.6 9 0.6
832 816 98.0 810 97.4 5 0.7 17 2.0 17 2.0
822 744 90.5 732 89.0 13 1.5 78 9.5 17 2.1 61 7.4
825 372 45.1 159 19.3 213 25.8 453 54.9 304 36.E 150 18.1
820 228 27.8 23 2.8 206 25.1 592 72.2 456 55.6 136 16.6
1,250 194 15.5 14 1.1 180 14.4 1,056 84.5 872 69.7 184 14.7
2,043 169 8.3 9 0.4 160 7.8 1,874 91.7 1,553 76.0 321 15.7
1,826 105 5.7 7 0.4 98 5.4 1,721 94.3 1,397 76.5 324 17.7
8,813 4,384 49.7 3,795 43.1 589 6.7 4,429 50.3 35.5 1,304 14.8
581 249 42.8 249 42.8 333 57.2 333 57.2
566 543 96.0 543 96.0 23 4.0 23 4.0
753 736 97.8 736 97.8 17 2.2 17 2.2
1,071 1,064 99.3 1,064 99.3 7 0.7 7 0.7
571 563 98.5 561 98.2 0.3 9 1.5 9 1.5
544 481 88.5 477 87.7 4 0.8 62 11.5 11 2.1 51
598 263 44.0 118 19.8 145 24.2 335 56.0 214 35.9 121 20.2
593 163 27.4 20 3.4 143 24.0 431 72.6 319 53.8 111 18.8869 133 15.3 12 1.4 121 14.0 736 b4.7 605 69.6 131 15.1
1,426 131 9.2 9 0.6 122 8.6 1,295 90.8 1,053 73.8 243 17.01,242 60 4.8 7 0.5 53 4.3 1,182 95.2 922 74.3 259 20.9
See footnotes at end of table.

14
Table 2. Enrollment Status for Persons 3 to 34 Years Old by Residence, Age, Race, HispanicOrigin, and Mexican Origin: October 1985-Cuntinued
(Numbers in thousands. Civilian noninstitutional population. For meaning of symbols, see text)
Age, residence, race,Hispanic origin,
and Mexican origin
Population
Enrolled
Total Below collegelevel'
In
collegeTotal
Number Percent Number Percent Number Percent Number Percent
Not enrolled
High schoolgraduate
Number Percent
Not highschool graduate
Number Percent
BIACK--Continued
Metropolitan -- Continued
Outside central city3 and 4 years old5 and 6 years old7 to 9 years old10 to 13 years old14 and 15 years old16 and 17 years old18 and 19 years old20 and 21 years old22 to 24 years old25 to 29 years old30 to 24 years old
Nonmetropolitan
Total3 and 4 years old5 and 6 years old7 to 9 years old10 to 'J years old14 and 15 years old16 and 17 years old18 and 19 years old20 and 21 years old22 to 24 years old25 to 29 years old
30 to 24 years old
HISPANIC ORIGIN'
Metropolllzn
Total3 and 4 years old5 and 6 years old7 to 9 years old10 to 13 years old14 and 15 years old16 and 17 years old18 and 19 years old20 and 21 years old22 to 24 years old25 to 29 years old30 to 34 years old
In central city3 and 4 years old5 and 6 years old7 to 9 years old10 to 13 years old14 and 15 yea:s old...16 and 17 years old18 and 19 years old20 and 21 years old22 to 24 years old25 to 29 years old30 to 34 years old
Outside central city3 and 4 years old5 and 6 years old7 to 9 years old10 to 13 years old14 and 15 years old16 and 17 years old18 a^d 19 years old.20 and 21 years old22 to 24 yea-4 01025 to 29 yes. ,ld
30 to 34 years old
See footnotes at end of table.
3,854
250
353
446262
278
228
227
381
617
584
3,922
289
260
418
543
297
262
246
257
317
544
488
9,275648
624
879
1,118
545
564
496
527
9781,627
1,267
5,409
399
332
549
694302
337
291
279
577
894
756
3,866
249
292
330
424
243
227
205
248
401
734
512
1,982112240
35344425326310966
6138
45
2,078
109
247
411543290
250100
70
20
23
14
4,380
162
590
863
1,113
521
489215
132
121108
65
2,600
91308
539
688283
289
143
69
81
63
48
1,78072
283
324
424
238
200
73
64
4145
17
51.448.896.0
100.099.596.9
94.548.028.9
16.06.1
7.7
53.037.695.098.359.997.795.340.727.3
6.44.22.9
47.225.194.698.2
99.595.586.743.525.1
12.46.6
5.1
48.122.892.698.399.293.685.6
49.024.7
13.97.16.3
46.028.896.898.0100.097.988.335.525.7
10.16.1
3.3
1,697
112
240
353
444
249
255
41
3
2
1,903109
247
411
543
290
247
55
2
3,849162
590
863
1,113521
476
1049
5
4
2
2,27991
308
539
688283
283
76
4
2
4
2
1,57072
283
324424238
19328
5
3
44.048.89C ,
100.099.595.691.5
18.01.1
0.4
48.537.695.098.399.997.7
94.022.1
0.8
41.525.1
94.698.2
99.595.5
84.320.9
1.7
0.5
0.2
0.1
42.122.892.6
98.399.293.6
84.026.01.6
0.30.40.2
40.628.8
96.898.0
100.097.9
84.8
13.81.90.8
285
4
8
68
63
59
38
45
175
4
4668.
20
23
14
531
13
112
123
116
104
63
321
5
67
64
79
59
46
210
8
45
59
37
4517
7.4
1.4
3.0
30.027.8
15.56.17.7
4.5
1.3
18.526.5
6.4
4.22.9
5.7
2.3
22.5
23.4
11.86.45.0
5.9
1.6
23.1
23.1
13.66.7
6.1
5.4
3.521.8
23.89.36.1
3.3
1,871118
10
2
8
15
118161
320579
539
1,844
181
13
7
1
7
12146
187
297
521
474
4,89448534
16
5
25
75
280
395
857
1,5191,203
2,80930825
9
5
19
49
148
210497830708
2,086178
9
6
5
27
132
185
360
689495
48.651.2
4.0
0.53.15.5
52.0
71.184.093.9
92.3
47.062.4
5.01.7
0.12.3
4.7
59.3
72.7
93.695.8
97.1
52.8
74.95.4
1.8
0.5
4.513 3
56.574.987.693.4
94.9
51.9
77.27.4
1.7
0.8
6.4
14.451.075.386.1
92.993.7
54.471.23.22.0
2.1
11.764.574.3
89.9
93.996.7
1,474
6
89
137
267
501
475
1,157
3
110
132202
388
322
38.3
2.1
39.3
60.270.081.281.3
29.5
1.144.651.663.671.4
66.0
2,500 26.9
2 0.36 1.0
130 26.3244 46.3549 56.1894 54.9675 53.3
1,304 24.1
2 0.64 1.3
47 16.3134 48.2292 50.:447 50.1377 49.9
83
110
257
446298
30.9
0.5
40.444.364.160.958.3
397
11810
2
8
1025
25
53
78
64
687
18113
7
1
7
10
3654
95133
152
2,395485
3416
5
23
70
150150308626527
1,50530825
9
5
1844
10176
205383
331
890178
9
6
5
26
4975
103243197
10.3
51.2
4.0
0.53.1
3.4
12.8
10.9
14.012.7
11.0
17.5
62.4
5.01.70.1
2.3
3.6
14.7
21.2
29.9
24.4
31.1
25.874.9
5.4
1.8
9.54.2
12.:
30..
28.5
31.5
38.541.6
27.8
77.2
7.4
1.7
0.85.9
13.1
34.6
27.2
35.542.943.8
23.0
71.23.2
2.0
2.1
11.2
24.0
30.025.8
33.1
38.4

15
Table 2. Enrollme.it Status for Persons 3 to 34 Years Old by Residence, Age, Race, HispanicOrigin, and Mexican Origin: Octobe. 1985-Continued
(Numbers in thousands. Civilian noninstitutional population. For meaning of symbols, see text
Age, residence, race,Hispanic origin,
and Mexican origin
Population
Enrolled Not enrolled
TotalBelow college
level
In
col egeTotal
High schoolgraduate
Not high
school graduate
Number Percent Number Percent Number Percent ',umber Percent Number Percent Number Percert
HISPANIC ORIGIN= -- Continued
Nonmetropolitan
Total 1,357 G90 5C.8 641 47.3 48 3.5 667 49.2 288 21.2 379 28.03 and 4 years old 141 50 35.5 50 35.5 - - 91 64.5 - 91 64.55 and 6 years old 76 72 94.1 72 94.1 - - 4 5.9 - - 4 5.97 to 9 years old 137 137 100.0 137 100.0 - - - - -
10 to 13 years old 212 209 98.9 209 98.9 - - 2 1.1 2 1.114 and 15 years old 85 85 100.2 85 100.0 - - - - -
16 and 17 years old 101 73 72.6 71 69.9 3 2.6 28 27.4 1 0.7 27 26.718 and 19 years old 75 23 30.8 8 10.8 15 20.0 52 69.2 27 36.2 25 33.020 and 21 years old 46 5 10.7 5 10.7 41 89..1 32 68.1 10 21.222 to 24 years old 99 4 3.9 - 4 3.9 95 96.1 39 39.t 56 57.025 to 29 year, old 199 12 6.1 5 2.6 7 3.5 187 93.5 99 49.9 88 44.030 to 34 years old 184 19 10.0 4 2.1 15 /.? 166 90.0 90 48.9 76 41.1
MEXICAN ORIGIN
Metropolitan
Total 5,702 2,682 47.0 2,437 42.7 245 4.3 3,020 53.0 1,428 25.0 1,593 27.93 and 4 years old 410 97 23.6 9? 23.6 - - 313 76.4 - - 311 76.45 and 6 years old 422 403 95.4 403 95.4 - - 20 4.6 - 20 4.67 to 9 years old 525 518 98.7 518 98.7 - 7 1.3 - 7 1.310 to 13 years old 761 757 99.5 757 99.5 - - 4 0.5 - 4 0.514 and 15 years old 318 310 97..1 310 97.3 - - 8 2.7 2 0.5 7 2.116 and 17 years old 340 298 87.6 291 85.7 7 2.0 42 12.4 - - 42 12.418 and 19 years old 306 115 37.7 57 18.7 58 19.0 191 62.3 91 29.8 100 32.520 and 21 years old 341 59 17.3 3 0.8 56 16.5 282 82.7 169 49.5 113 33.322 to 24 years old 620 51 8.2 2 0.3 49 7.9 570 91.8 345 55.6 225 36.225 to 29 years old 987 49 5.0 49 5.0 937 95.0 498 50.5 439 44.530 to 34 yearn old 672 26 3.8 - 26 3.8 646 96.2 323 48.1 323 48.1
In central city 3,139 1,477 47.0 1,341 42.7 135 4.3 1,662 53.0 728 23.2 935 29.83 and 4 years old 230 41 17.7 41 17.7 - - 190 82.3 - - 190 82.35 and 6 years old 205 190 92.7 190 92.7 - - 15 7.3 - 15 7.37 to 9 years old 310 307 99.1 307 99.1 - - 3 0.9 - 3 0.910 to 13 years old 438 434 99.1 434 99.1 - - 4 0.9 - 4 0.914 and 15 years old 169 163 96.2 163 96.2 - - 6 3.8 2 1.0 5 2.816 and 17 years old 190 168 88.5 166 87.4 2 1.2 22 11.5 - 22 11.518 and 19 years old 160 75 46.5 40 25.0 34 21.5 86 53.5 22 14.0 63 39.420 and 21 years old 168 27 16.1 27 16.1 141 83.9 82 49.0 59 35.022 to 24 years old ...... . 370 :4 9.1 - 34 9.1 336 90.9 193 52.3 143 38.625 to 29 years old 502 21 4.1 - 21 4.1 481 95.9 228 45.5 253 50.430 to 34 years old 395 tv 4 - 17 4.4 378 95.6 199 50.4 179 45.2
Outside central city 2,563 1,205 27.1 1,'95 42.7 110 4.3 1,358 53.0 700 27.3 658 25.73 and 4 years old 180 56 3, : 56 31.2 - - 124 68.8 - - 124 68.85 and 6 years old 217 212 97.'., 212 97.9 - - 5 2.1 - 5 2.17 to 9 years old 214 210 98 ! 210 98.1 - 4 1.9 - 4 1.910 to 13 years old 323 323 100.' 323 100.0 - - - -
14 and 15 years old 149 147 98. 147 98.7 - 2 1.3 - - 2 1.316 and 17 years old 149 129 86.5 125 83.5 4 3.0 20 13.5 - - 20 13.518 and 19 years old 146 41 27.9 17 11.7 24 16.2 105 72.1 69 47.2 36 24.920 and 21 years old 173 32 18.5 3 1.5 29 16.9 141 81.5 86 50.0 55 31.622 to 24 years old 251 17 6.8 2 0.8 15 6.0 233 93.2 151 60.5 82 32.725 to 29 years old 485 29 6.0 - 29 6.0 456 94.0 270 55.7 186 38.430 to 34 years old 277 8 3.0 - 8 3.0 268 97.0 124 44.8 145 52.2
Nonmetropolitan
Total 998 498 49.9 476 47.7 22 2.2 500 50.1 183 18.3 317 31.73 and 4 years old t15 40 34.7 40 34.7 - - 75 65.3 - - 75 65.35 and 6 years o!d 59 56 95.0 56 95.0 - - 3 5.0 - 3 5.07 to 9 years old 101 101 100.0 101 100.0 - - -
10 to 13 years old 152 150 98.4 150 98.4 - - 2 1.6 - 2 1.614 and 15 years old 58 58 100.0 58 100.0 - - - - -
16 and 17 years old 88 61 69.0 58 65.9 3 3.0 27 31.0 1 0 3 27 30.218 and 19 years old 53 11 21.3 5 9.9 6 11.3 42 78.7 20 37.9 22 40.820 and 21 years old 29 2 5.9 - 2 5.9 27 94.1 19 65.4 8 28.822 to 24 years old 77 4 5.0 - 4 5.0 73 95.0 22 28.7 5t 66.325 to 29 years old 138 7 4.8 5 3.7 1 1.1 132 95.2 64 46.4 67 48.830 to 34 years old 129 10 8.1 4 2.8 7 5.2 118 91.9 57 44.3 61 47.6
lIncludes nursery school. kindergarten, and grades 1 to 12.2May be of any race.
/71

16
Table 3. Level of Enrollment for Persons 3 to 34 Years Old by Control of School, Residence,Sex, Race, Hispanic Origin, and Mexican Origin: October 1985
(Numbers in thousands. Civilian noninstitutional population. For meaning of symbols, see text)
Sex, coot 1 of school,residence. race, 4ispanicorigin, and Mexican origin
Enrolled below college level Enrolled in college (year)
Total
Nurseryschool
Kinder-garten
Grades1 to 6
Grades7 and 8
Grades9 to 12 Total 1 and 2 3 and 4 5 or more
ALL RACES
Total
Total 47,151 2,491 3,815 20,212 6,654 13979 10,863 5,541 3,572 1,749Public 40,642 854 3,221 17,839 5,964 12,764 8,379 4,492 2,719 1,168Male 20,874 408 1,692 9,157 3,029 6,587 4,121 2,091 1,441 589Female 19,768 447 1,528 8,681 2,935 6,177 4,258 2,401 1,278 579Private 6,509 1,637 594 2,373 690 1,215 2,483 1,049 854 581Male 3,218 800 293 1,203 335 587 1,224 440 413 370Female 3,291 837 301 1,170 355 628 1,260 609 440 211
Metropolitan
Total 31,271 1,793 2,478 13,298 4,378 9,324 8,191 4,080 2,717 1,394Public 26,179 579 2,012 11,456 3,817 8,314 6,113 3,220 2,004 890Male 13,463 266 1,088 5,895 1,916 4,298 2,995 1,486 1,060 449Female 12,716 313 924 5,561 1,901 4,016 J,118 1,734 944 440Private 5,092 1,214 465 1,842 561 1,010 2,078 861 713 504Male 2,539 605 230 935 273 496 1,044 363 352 329Female 2,553 609 235 907 289 514 1,034 498 361 175
In central city 11,697 633 947 5,192 1,603 3,321 3,250 1,545 1,028 676Public 9,758 270 768 4,463 1,379 2,878 2,427 1,220 781 425Male 5,035 106 424 2,319 669 1,517 1,207 537 442 228Female 4,723 165 343 2,144 710 1,361 1,220 684 339 198Private 1,938 362 180 729 224 443 822 325 246 251Male 932 181 94 348 102 207 406 121 124 160Female 1,007 181 86 381 122 236 416 204 122 91
Outside central city 19,574 1,160 1,530 8,106 2,775 6,003 4,941 2,535 1,689 717Public 16,421 309 1,245 6,993 2,438 5,436 3,686 1,999 1,222 464Male 8,428 160 663 3,576 1,248 2,781 1,789 949 618 221Female 7.993 149 581 3,417 1,191 2,655 1,897 1,050 604 243Private 3,154 851 285 1,113 337 567 1,255 536 467 253Male 1,607 424 13u 587 171 289 638 241 228 168Female 1,546 428 149 526 166 278 617 294 239 84
Nonmetropolitan
Total 15,880 698 1,337 6,914 2,276 4,655 2,672 1,461 856 356Public 14,463 275 1,209 6,382 2,147 4,450 2,266 1,273 715 278Male 7,411 141 605 3,263 1,113 2,289 1,126 606 381 140Female 7,052 134 604 3,120 1,034 2,161 1,140 667 335 139Private 1,417 423 128 531 129 205 406 188 141 77Male 679 195 63 268 62 91 180 77 61 42Female 738 228 66 263 67 114 226 111 80 35
WRITE
Tot,1
Total 38,118 2,087 3,060 16,238 5,355 11,378 9,334 4,676 3,106 1,553Public 32,237 617 2,545 14,078 4,739 10,258 7,131 3,744 2,357 1,030Male 16,624 314 1,348 7,248 2,405 5,309 3,546 1,763 1,266 517Female 15,613 303 1,197 6,830 2,334 4,949 3,585 1,982 1,091 513Private 5,881 1,470 515 2,160 616 1,120 2,203 931 749 523Male 2.921 725 257 1,100 295 544 1,087 405 344 337Female . 2,960 745 258 1,060 321 576 1,116 526 405 185
Metropolitan
Total 24,552 1,458 1,967 10,375 3,421 7,330 6,916 3,361 2,335 1,221Public 20,033 381 1,578 8,733 2,931 6,410 5,085 2,601 1,711 773Male 1...'..,3:,1 1s, 860 4,513 1,467 3,326 2,547 1,226 931 390Female 9,681 195 718 4,220 1,464 3,084 2,538 1,375 779 383Private 4,519 1,076 390 1,642 491 921 1,832 760 62t 448Male 2,274 545 197 842 235 455 926 336 293 298Female 2,245 531 19? 800 255 466 905 424 331 150
In central city 7,411 413 611 3,327 1,000 2,061 2,446 1,035 803 559Public 5,778 132 467 2,699 808 1,673 1,786 825 612 349Male 2,992 53 255 1,403 380 902 919 355 375 190Female 2,786 79 212 1,296 428 770 867 470 237 160Private 1,633 282 144 628 192 388 660 260 191 209Male 797 146 71 312 86 181 331 102 91 138Female 837 136 72 316 106 207 329 158 100 71
Outside central city 17,141 1,044 1,357 7,048 2,421 5,270 4,470 2,276 1,532 662Public 14,255 250 1,110 6,034 2,123 4,737 3,299 1,777 1,099 423Male 7,359 133 605 3,111 1,087 2,423 1,628 871 557 200Female 6,896 116 506 2,924 1,036 2,314 1,671 905 542 223Private 2,886 795 246 1,014 298 533 1,171 500 433 238Male 1,478 400 126 530 149 274 595 233 202 160Female 1,408 395 121 484 149 259 576 267 231 79
See footnote at end of table.

17
Table 3. Level of Enrollment for Persons 3 to 34 Years Old by Control of School, Residence,Sex, Race, Hispanic Origin, and Mexican Origin: October 1985-Continued
(Numbers In thousands. Civilian noninstitutional population. For meaning of syrbols, see text)
Sex, cont_ol of school,residence, race, Hispanicorigin, and Mexican origin
Enrolled below college level Enrolled in college (yearl
7,talNurseryschool
Kinder-garten
Grades1 to 6
Grades7 and 8
Grades9 to 12 Total 1 and 2 3 and 4 5 or more
WHILE -- Continued
Nonmetropolitan
13,566 629 1,093 5,863 1,934 4,047 2,418 1,315 771 332Public..... , .... . , ..... 12,205 235 968 5,345 1,808 3,848 2,046 1,143 646 257
Male 6,273 128 489 2,735 938 1,983 999 537 335 127Female 5,931 107 479 2,610 870 1,865 1,047 606 311 130
Private . 1,361 394 125 518 125 199 372 172 125 75Male , 647 180 60 258 60 90 161 70 51 40Female 711 214 66 260 65 110 211 102 74 35
BLACK
Total
Total. : 7,395 332 625 3,254 1,053 2,131 1,049 629 326 95Public .
. 6,974 212 562 3,124 1,007 2,068 860 540 252 68:tale ....... , ...... ,....,,.,..,. 3,525 81 289 1,599 511 1,046 373 234 111 28Female 3,449 13* 273 1,526 497 1,022 486 306 141 39
Private 422 120 63 130 45 63 190 89 73 27Male... ,. .., ....... ,. 190 48 28 61 23 31 85 24 49 11Female . ............ .... ,31 72 35 69 22 32 105 65 24 16
Metropolitan
Total - - 5,492 285 422 2,387 771 1,627 874 531 261 82Public 5,102 185 360 2,264 726 1,567 708 453 199 56Male 2,573 75 188 1,153 365 791 288 190 76 23Female 2,530 110 172 1,111 36. 776 419 263 123 33
Private 390 100 62 122 45 60 167 78 62 26Male 174 40 26 55 23 31 73 21 42 10Female 216 61 35 68 22 30 94 58 20 16
In central city... ,.. , . ,.., 3,795 203 301 1,658 574 1,109 589 356 179 54Public 3,544 131 271 1,580 4.8 1,064 471 299 138 34Male : _ 1,802 52 152 817 248 533 198 130 54 14Female 1,742 79 119 763 250 530 272 168 134 20
Private 251 72 31 78 26 45 119 58 11 20Male 112 30 21 27 12 21 49 16 24 9
Female, . .... ............ 139 42 10 51 13 24 70 42 17 11
Outside central city 1,697 83 120 728 247 519 285 175 82 28Public : = 1,558 54 89 684 228 503 237 154 61 22Male 770 23 36 336 118 258 90 59 22 9
Female: 788 31 53 348 111 147 95 38 13Private , 139 29 31 44 19 15 48 20 21 6
Male 62 10 5 27 10 9 24 5 18 1
Female 97 19 26 17 9 6 24 15 4 5
Nonmetropolitan
Total 1,903 47 204 868 281 594 175 97 64 13Public : 1,871 27 202 860 281 501 152 87 53 12
Male..., .. ............ 952 6 101 446 145 255 85 44 35 5
Female : 919 21 101 414 136 247 67 43 18 6Private ........ >.... : : : : 32 20 2 8 2 23 10 11 1
Male 16 8 2 6 - 12 3 8 1
Female.,.. ... ..... .. . 16 12 1 - 2 11 7 4 -
HISPANIC ORIGIN'
Total
Total - : -, 4,491 168 364 2,158 645 1,156 579 332 165 82Public - : 4,117 105 315 2,008 599 1,090 464 280 138 45
Male 2,097 59 162 1,026 306 543 219 122 71 25Female , 2,020 46 153 982 293 547 245 158 67 19
Private 374 63 49 150 46 67 116 52 27 37Male - 177 30 22 71 24 30 61 20 10 30Female, , 1 7 33 29 79 21 37 55 32 16 7
Metropolitan
Total . 3,849 126 316 1,859 543 1,011 531 301 156 73Public 3,506 82 268 1,708 498 949 422 253 131 37
Male 1,776 45 137 872 254 468 203 115 68 20Female 1,730 37 131 836 245 481 219 139 63 16
Private - : 343 44 48 146 44 62 109 48 25 36Male... 166 26 22 68 24 26 60 20 10 30Female 177 19 25 78 20 36 50 28 15 7
Sec footnote at end of table.
rA
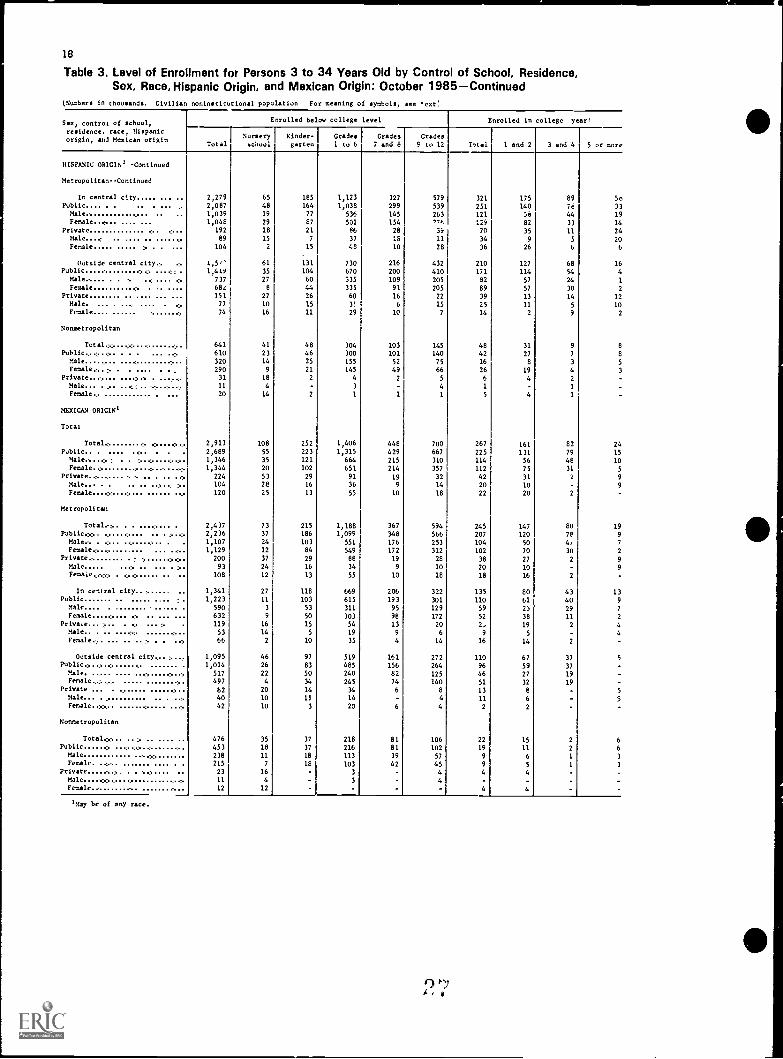
18
Table 3. Level of Enrollment for Persons 3 to 34 Years Old by Control of School, Residence,Sox, Race, Hispanic Origin, and Mexican Origin: October 1985Continued
(Numbers in thousands. Civilian noninstitutionsl population For meaning of symbols, see text)
Sex, control of school,residence, race, Hispanic
origin, and Mexican origin
Enrolled below college level Enrolled in college year'
TotalNurseryschool
Kinder-garten
Grades
1 to 6Grades
7 and 8Grades
9 to 12 Total 1 and 2 3 and 4 5 or more
HISPANIC ORIGIN' -Continued
Metropolitan--Continued
In central city ..... ... .. 2,279 65 185 1,123 327 579 321 175 89 58Public.... . . 2,087 48 164 1,038 299 539 251 140 76 33
Male 1,039 19 77 536 145 263 121 58 44 19Female .. ,... .... ... 1,048 29 87 501 154 ,,,, 129 82 33 14
Private . 192 18 21 86 28 39 70 35 11 24Male..., .. .... .. ...... . 89 15 7 37 16 11 34 9 5 20Female 104 2 15 48 10 28 36 26 6 6
Outside central city., ., t,5,' 61 131 730 216 432 210 127 68 16Public - 1,419 35 104 670 200 410 171 114 54 4
Male . -.... . . , ., .... ,. 737 27 60 335 109 205 82 57 24 1
Female 682 8 44 335 91 205 89 57 30 2
Private ........ .. .... ... ... 151 27 26 60 16 22 39 13 14 12
77 10 15 3." 6 15 25 11 5 10Female.... ...... , 74 16 11 29 10 7 14 2 9 2
Nonnetropolitan
Total 641 41 48 304 103 145 48 31 9 8
Public,. ,.. ,.. . . . ... .., 610 23 46 300 101 140 42 27 7 8
Male . 320 14 25 155 52 75 16 8 3 5
290 9 21 145 49 66 26 19 4 3
Private . 31 18 2
4
2 5 6 4 2
11 4 - 3 - 4 1 - 1 -
Female 20 14 2 1 1 1 5 4 1 -
MEXICAN ORIGIN'
Total
Total- ., 2,913 108 252 1,406 448 700 267 161 82 24
2,689 55 223 1,315 429 667 225 131 79 15Male t , 1,346 35 121 664 215 310 114 56 48 10Female 1,344 20 102 651 214 357 112 75 31 5
Private . ., ... .... , , .. . .. .., 224 53 29 91 19 32 42 31 2 9
Male... . . .. .. . .t....., ,. 104 28 16 36 9 14 20 10 - 9
Female ,, 120 25 13 55 10 18 22 20 2
Metropolitan
Total, . . ... .... . 2,437 73 215 1,188 367 594 245 147 80 19
Public :, . 2,236 37 186 1,099 348 566 207 120 78 9
Male., . ... .. , .... ,... . . 1,107 24 103 551 176 253 104 50 4, 7
Female . 1,129 12 84 549 172 312 102 70 30 2
Private. . 200 37 29 88 19 28 38 27 2 9
Male 93 24 16 34 9 10 20 10 - 9
Female.,,,,, . ., ,...... .. .. 108 12 13 55 10 18 18 16 2
In central city.. ,..... .. 1,341 27 118 669 206 322 135 80 43 13Public ..... .... . 1,223 11 103 615 193 301 110 61 40 9
Male.. 590 3 53 311 95 129 59 25 29 7
Female 632 9 50 303 98 172 52 38 11 2
Private... ,.. . ,. ... , . 119 16 15 54 13 20 2, 19 2 4Male.. .,:. 53 14 5 19 9 6 9 5 - 4
66 2 10 35 4 14 16 14 2
Outside central city,.. ,..:. 1,095 46 97 519 161 272 110 67 37 5
Public 1,014 26 83 485 156 264 96 59 37 -
Male. - - 517 22 50 240 82 125 46 27 19 -
Female 7: ,, 497 4 34 245 74 140 51 32 19Private 82 20 14 34 6 8 13 8 - 5
Male. 40 10 11 14 - 4 11 6 - 5
Female.......,.. ...... ,..... ..., 42 10 3 20 6 4 2 2 -
Nonmetropolitan
476 35 37 218 81 106 22 15 2 6Public 453 18 37 216 81 102 19 11 2 6Male 238 11 18 113 39 57 9 6 1 3
Female. ..,,. . ...... .... . . 215 7 18 103 42 45 9 5 1 3
Private 23 16 - 3 - 4 4 4 - -
Male 11 4 - 3 4 - - - -
Female - - 12 12 - - 4 4 - -
'May be of any race.
A 6

19
Table 4. Level of Enrollment For Persons 3 Years Old and Over, by Age and Sex: October 1985(Numbers in thousands. Civilian noninstitutional population. For meaning of symbols, see text)
Age and sexPopulation
EnrolledNurseryschool
Kindergartenand
elementaryHigh
school
College year)
Number Percent Total 1 and 2 3 and 4 5 or more
Both sexes 223,459 59,782 26.8 2,493 30,685 14,082 12,525 .5,541 '3,572 '1,750
3 and 4 years old., .., ,.. , 7,192 2,801 ,8.9 2,312 489 - - - -
5 to 13 years old 29,991 29,546 98.5 181 29,086 284 - -
14 to 17 years old 14,765 14,016 94.9 1,099 12,655 260 250 10 -
18 and l' 'ars old 7,204 3,716 51.6 - 808 2,908 2.775 133 -
20 and 2. ,ears old 7,679 2,708 35.3 91 2,617 914 1,672 31
22 to 24 years old 12,239 2,068 16.9 53 2,014 574 900 540
25 to 29 years old.,,...- .:.c 21,046 1,942 9.2 55 1,883 614 577 692
30 to 34 years old - -- 19,885 1,218 6.1 31 1,181 414 280 487
35 to 39 years old 17,474 799 4.6 227 771 (NA) (NA) 04A)
40 to 44 years old. 14,218 467 3.3 227 440 (NA) ,NA) (NJ)
45 to 49 years old. c 11,609 210 1.8 224 186 (NA) (NA) (NA)
50 to 54 years old - 10,837 118 1.1 29 109 (NA) ,NA) (NA)
55 to 64 years old - 22,140 122 0.6 28 114 (NA) ;NA) ,NA)
65 years old and over,- , .. ,, 27,180 52 0.2 - 210 42 ',NA) ,NA) (NA)
Male 107,607 30,039 27.9 1,208 15,714 7,218 5,906 '2,532 .1,853 .959
3 and 4 years old., ....... ,,.<.., 3,666 1,347 36.7 1,108 239 - - - -
5 to 13 years old..,, ..... ,, 15,356 15,088 98.3 100 14,841 154 - - -
14 to 17 years old == 7,535 7,186 95.4 - 631 6,423 13 125 6 -
18 and 19 years old ,:- - 3,550 1,852 52.2 - 504 1,34 1,301 48 -
20 and 21 years old 3,710 1,253 36.5 40 1,314 459 839 16
22 to 24 ye..s old 5,939 1,114 18.8 26 1,087 262 512 313
25 to 29 years old - 10,302 967 9.4 23 941 230 328 ,83
30 to 34 years old : , 9.711 527 5.4 5 522 155 120 247
35 to 39 years old 8,506 293 3.4 211 282 (NA) INA) INA)
40 to 44 years old 6,915 142 2.1 28 133 (NA) (4A) (NA)
45 to 49 years old 5,638 59 1.0 29 50 (NA) NA) (NA)
50 to 54 years old ... , .. ,,,, 5,212 49 0.9 26 44 (NA) ,NA) (NA)
55 to 64 years old 10,400 42 0.4 25 37 (NA) NA) (NA)
65 years old and over 11,167 20 0.2 - 24 16 (NA) ,NA) (NA)
Female - 115,850 29,741 25.7 1,285 14,971 6,864 6,620 '3,009 '1,719 '791
3 and 4 years old .,525 ,453 41.2 1,204 250 - - - -
5 to 13 years old -- : 14.634 14,456 98.8 81 14,245 130 - -
14 to 17 years old., , 7,?30 6,830 94.5 - 463 6,232 129 125 4 -
18 and 19 years old 3,654 ',864 51.0 - 304 1,559 1,474 85 -
20 and 21 years old 3,969 1,355 34.1 51 1,303 455 833 15
22 to 24 years old _- 6,300 954 15.1 27 927 312 388 227
75 to 29 years old.,, .... ,,., 10,744 975 9.1 32 942 384 249 309
30 to 34 years old 10,174 691 6.8 26 659 259 160 240
35 to 39 years old 8,9,. 506 5.6 216 490 ANA) (NA) NA)
40 to 44 years old --- . 7,303 325 4.5 219 307 (NA) INA) INA)
45 to 49 years old..,...:. , ,971 151 2.5 215 136 !Ift) ,NA) ;NA)
50 to 54 years old 5,625 68 1.2 23 65 .NA) INA) (NA)
55 to 64 years old 11,740 79 0.7 23 77 04A) b,1A) NA)
65 years old and over 16,013 32 0.2 26 26 ,NA) tNA) 'NA)
Data are fcr students 3 to 34 years old.2Inclsdes persons in elementary and high school.

20
Table 5. Attendance Status for Nursery School aria: Kindergarten Students 3 to 6 Years Old by Leveland Control of School, Residence, Age, Race, and Hispanic Origin: October 1985
(Numbers in thousands. Civilian noninstitutional population For meaning of symbols, see text)
Level and control of school.residence, age race andHispanic origin
Both sexes Male Female
Totalenrolled
Attending full dayTotal
enrolled
Attending full dayTotal
enrolled
Attending full day
Humbert Percent Number Percent Number Percent
ALL RACES
Total , 6,306 2,311 36.7 3,193 1,139 35.7 3,113 1,172 37.63 years old 1,035 349 33 7 490 149 30.4 545 200 36.74 years old . 1,765 643 36.4 857 310 36.2 908 333 36.75 years old 3,065 1,151 37 5 1,579 579 36.7 1.485 572 38.56 years old 440 167 38.0 266 101 37.8 174 67 38.2
Level and control.Nursery school . 2,91 849 34.1 1,207 389 32.2 1,284 460 35.9
Public 854 296 34.6 408 129 31.6 447 167 37.4Private e 1,637 553 33.8 800 260 32.5 837 293 35.1
Kindergarten . 3,815 1,462 38.3 1,986 750 37.8 1,829 712 38.9Public , - 3,221 1,204 37.. 1,692 627 37.0 1,528 577 37.3Private . : 594 258 43.5 293 .24 42.3 301 135 44.7
Metropolitan--In central city. . .... .. 1,580 713 45.1 805 349 43.3 775 365 47 0
3 years old. 268 106 39.5 120 39 32.6 148 67 45.04 years old -. 480 229 47.7 234 111 47.6 245 117 47.85 years old _= 736 339 46.1 392 175 44.5 343 165 48.06 years old 97 39 40.5 59 24 (B) 38 16 (B)
Level and control-Nursery school 633 293 45.9 287 130 45.3 346 160 46.3
Public . 270 112 41.4 106 44 41.7 165 68 41.1Private 362 178 49.3 181 86 47.5 181 92 51.1
Kindergarten 947 423 44.6 518 219 42.2 '.29 204 47.6Public : 768 342 44.6 424 180 42.4 343 163 47.4Private : 180 80 44.7 94 39 41.2 86 42 48.6
Metropolitan -- Outside
Central city 2,691 815 30 3 1,384 392 28.3 1,306 424 32.43 years old - . 495 151 30.5 242 64 26.6 254 87 34.24 years old 767 230 30.0 ;81 104 27.4 386 125 32.55 years old 1,262 379 30 0 656 186 28.4 606 193 31.86 years old - 166 56 33.5 106 37 35.2 60 18 (B)
Level and control.Nursery school.... . 1,160 348 30.0 584 155 26.6 576 192 33.4
Public ,, 309 96 31.1 160 42 26.2 149 54 36.4
Private 851 251 29.5 424 113 26.7 428 138 32.4Kindergarten = t 1,530 468 30.6 800 237 29 6 730 231 31.6
Public 1,245 342 27.5 663 181 27.2 581 161 27.8Private 285 126 44.1 136 56 41.1 149 70 46.7
Nonmetropolitan 2,035 783 38.5 1,003 399 .9.8 1,032 384 37.23 years old 272 93 34.0 129 46 35.7 143 47 32.54 years old : 519 185 35.6 242 94 38.9 277 91 32.85 years old 1,067 433 40.6 531 219 41.2 536 214 40.06 years old . 177 72 40.7 101 40 39.3 76 32 42.6
Level and control.
Nursery school 698 211 30.3 336 104 30.8 362 108 29.8Public . 275 88 32.0 141 43 30.2 134 45 33.8Private : 423 123 29.2 19) 61 31.3 228 63 27.4
Kindergarten ... 1,337 572 42.7 667 295 44.3 670 276 41.2Public ) 1,209 519 43.0 605 266 44.0 604 253 41.9Private 128 52 40.6 63 29 (B) 66 23 (8)
WHITETotal 5,147 1,603 31.1 2,644 810 30.6 2,503 793 31.7
3 years old. e . . 831 225 27.1 412 1u8 26.2 419 117 28.04 years old.....-...... e...... ,e 1.419 433 30.5 704 219 31.1 715 214 29.95 years old 2,507 803 32.0 1,291 395 30.6 1,215 40b 33.66 yearr old = - 391 143 36.5 237 88 37.2 154 55 35.4
Level and controlNursery school : 2.087 593 28.4 1019 287 77,7 1,048 104 29.2
Public 617 168 27.2 314 82 26.0 303 86 28.4Private 1,470 425 23.9 725 206 28.4 745 220 29.5
Kindergarten - 3,060 1,010 33.0 1,605 523 32.6 1,456 488 33.5Public 2,545 813 32.0 1,348 430 31.9 1,197 381 32.0Private 515 197 38.2 257 93 36.1 258 104 4C.3
BLACK
Total . 957 61. 64.1 446 278 62.4 511 336 65.63 years o.d 184 '11 60.5 69 35 (B) 114 76 66.44 years old 286 186 65.0 115 77 67.5 171 109 63.45 years old . . 449 295 65.8 238 154 64.6 212 142 67.06 years old 39 21 (B) 25 12 (B) 14 9 00
Level and control.
Nursery school 332 218 65.6 129 83 64.4 203 135 66.5Public -. 212 120 56.6 81 45 55.8 131 75 57.1Private 120 98 81.6 48 38 (B) 72 60 ;13)
Kindergarten 625 396 63.3 317 195 61.5 308 201 65.1Public . ., . 562 346 61.7 289 172 59.5 273 175 64.0Private 63 49 (8) 28 23 (B) 35 26 (8)
HISPANIC ORIGIN'
Total 532 248 46.6 273 112 41 1 259 136 52 4
'May be of any race.
0 C

21
Table 6. Attendance Status for College Students 16 to 34 Years Old Ly Sex, Age, Reside-.ce, Yearand Control of College, Race, and Hispanic Origin: October 1985
(Numbers in thousands Civilian noninstitutional population. For meaning of symbols, see text)
Age, year and controlof college, residence,race, and Hispanicorigtn
Both sexes Male Female
Totalenrolled
Attending full timeTotal
enrolled
Attending full timeTotal
enrolled
Attending full time
Number Percent Number Percent Number Percent
ALL RACES
Total 10,846 7,703 71.0 5,3-2 3,942 73.9 5 51', 3,761 68.2
16 and 17 years old 245 220 89.7 118 104 88.0 126 115 91.218 and 19 years old 2,907 2,666 91.7 1,349 1,247 92.5 1,559 1,419 91.120 ant 21 rars old 2,616 2,264 86.5 1,313 1,156 88.0 1,303 ' 108., 85.022 to 26 years old 2,014 1,402 69.6 1,087 822 75.6 926 S81 62.725 to 'tar8 old 1,884 795 42.2 942 445 47.2 941 350 37.230 to 5 irs old 1,180 355 30.1 522 168 32.1 658 188 28 5
College yearFir-1' 2,939 2,121 72.2 1,329 1,018 76.6 1,610 1,10 63.5Second 2,585 1,895 73.3 1,190 8'19 75.6 1,395 99) 71.3Third 1,931 1,451 75.1 927 712 76.8 1,003 739 73.6Fourth 1,642 1,374 83.7 927 764 82.2 715 612 85.6Fifth 867 384 44.3 438 220 50.1 429 165 38.4Sixth or more 882 478 54.2 521 330 63.4 361 148 40.9
Residence:Metropolitan 8,178 5,737 70.7 4,028 2,914 72.3 4,151 2,823 68.0
In central city 3,245 2,317 71.4 1,608 1,159 72.1 1,637 1,158 70.8Outside central city 4,933 3,420 69.3 2,420 1,755 72.5 , 514., 1,665 66.3
Non metropolitan 2,668 1,965 73.7 1,304 1,028 78.8 1,3, 937 68.7
Control of college.Public 8,363 5,782 69.1 4,108 2,985 72.7 4,255 2,796 65.7krivate 2,483 1,921 77.3 1,224 956 78.1 1,260 965 76.6
WHITE
Total 9,323 6,586 70.6 4,624 3,384 73.2 4,699 3,202 68.1
16 and 17 years old 218 197 90.1 111 99 89.5 108 98 90.718 and 19 years old 2,539 2,336 92.0 1,176 1,088 92.5 1,363 1,248 91.520 and 21 years old 2,257 1,974 87.4 1,137 1,005 88.4 1,120 969 86.422 to 24 years old 1,704 1,175 68.9 941 705 74.9 764 470 61.525 to 29 years old 1,590 627 39.4 312 353 43.5 778 274 35.230 to 34 years old 1,014 278 27.4 449 134 29.9 565 144 25.4
College year:
First 2,481 1,789 72.1 1,125 852 75.7 1,357 938 69.1Second 2,183 1,605 73.5 1,034 784 75.8 1,149 821 71.5Third 1,676 1,272 75.9 799 620 77.5 877 652 74.4Fourth 1,430 1,188 83.1 811 661 81.5 619 527 85.2Fifth 785 331 42.1 402 1'31 47.5 384 140 36.5Sixth or more 767 400 52.2 453 277 61.1 314 123 39.2
Residence.Metropolitan 6,909 4,833 70.0 3,465 2,488 71 8 3,443 2.345 68.1
In central city 2,443 1,727 70.7 1,247 879 70.5 1,196 848 70.9Outside central city 4,466 3,106 69.5 2,218 1,609 72 5 2,247 1,497 66.6
Non metropolitan 2,414 1,753 72.6 1,158 896 77.4 1,256 857 b8.3
Control of college.Public 7,120 4,885 68.6 3,537 2,539 71.8 3,583 2,346 65.5Private 2,203 1,701 77.2 1,087 845 77.7 1,116 856 76.7
BLACK
Total 1,044 762 73.0 454 364 80.3 590 398 67.4
16 and 17 years old 16 12 (B) 6 3 .8) 10 9 B)18 and 19 years old 259 230 89.2 121 111 92.5 138 119 86.320 and 21 years old 274 223 81.6 140 122 87.5 134 101 75.422 to 24 years old 201 147 73.4 84 70 83.4 117 77 66.225 to 29 years old 183 97 53.2 64 43 (B) 119 54 45.630 to 34 years old 112 52 46.2 40 15 '13, 72 37 (B)
College year
First 324 238 73.6 146 121 82.6 178 118 66.3Second 300 212 70.8 107 82 76.4 192 130 67.6Third 189 139 73.5 89 72 80.9 100 67 66.9Fourth 137 115 84.1 72 61 (19 65 54 .8)Fifth 45 31 (B) 15 13 (B) 30 19 B)
Sixth or more 50 27 (B) 25 16 B) 25 11 (8)
Residence:Metropolitan 869 616 70.9 357 278 77.9 513 338 65.9
In central city 588 433 73.7 245 195 79.5 343 238 69.5
Outside central city 281 183 64.9 112 83 74.0 170 100 59.0Nonmetropolitan 175 147 84.0 97 87 89.7 78 60 76.8
Control of college.
Public 854 61 72.0 369 295 80.0 485 320 65.9Private 190 '.47 77.8 85 69 81.8 105 78 74.6
HISPANIC ORIGIN'
Total, 16 to 34 years old 579 381 65.8 280 171 61.3 299 210 70.1
'May be of any race.

22
Table 7. Enrollment Status in 1984 for Persons 14 to 24 Years Old by Educational Attainment,Age, Sex, Race, and Hispanic Origin: October 1985
Oumbers to thousands Civilian nontnstttuttonal population For -leaning of symbols, sec [Est
Age, years of school completed, sex,race, and Hispanic origin
Population
Not enrolled Oct. 1985 I
EnrolledOct. 1985
Enro'led in collegevet. 1985
Enrolled bele,:college
Oct 1985
Enrolled
Oct. 1984got enrolled
Oct. 1984Enrolled
Oct. 1984trot enrolled
Oct. 1984
ALL RACES
Both sexes 41,887 4,002 15,377 22,509 6,822 978 14,70914 and 15 yea's old , ,... . . 7,505 81 61 7,363 16 1 7,54616 and 17 years old ....... .... 7,260 343 262 6,654 229 16 6,40918 and 19 years old.... ... .. 7,204 1,616 1,872 3,717 2,709 199 80920 and 21 years old.. - . . 7,679 720 4,251 2,707 2,318 298 9122 to 24 years old 12,239 1,242 8,930 2,068 1,551 463 54
Years of school completedElementary, 3 years or less 5,787 185 950 4,652 - - 4,652High school
4,503 143 786 3,573 - - 3,5732 years 4,562 139 1,074 3,348 - - 3,348
4,314 222 957 3,135 - - 3,1354 years 12,856 1,763 8,629 2,464 1,980 484
College1 year = 3,337 398 960 1,979 1,764 215 -
2 years 2,730 358 873 1,499 1,387 112 -
3 years...... .. . . .. .. 1,593 149 208 1,236 1,162 74 -
4 years 1,873 570 880 424 345 795 years or more.. .. .. . . 332 76 60 197 183 14 -
Male 20,734 1,929 7,299 11,506 3,432 449 7,62514 and 15 years old.,. .. . . . 3,842 40 27 3,775 13 3 76216 and 17 years old.,... . . . . 3,693 160 121 3,412 106 13 3,29318 and 19 years old 3,550 779 918 1,852 1,249 99 '0420 and 21 years old.. ... .... . 3,710 321 2,036 1,353 1,172 141 4022 to 24 years old 5,939 629 4.196 1,113 892 195 26
Years of school completedElementary, 8 years or less., 3,090 1CO 508 2,482 - - 2,482High school
1 sear .. ...... .... . . . 2,333 74 388 1,871 - - 1,8712 years -, 2,338 70 546 1,723 - - 1,7233 years. ..... . . .... . 2,188 115 525 1,548 - - 1,5484 years .. ..... ,... . , . 6,084 821 4,07 1,184 957 227
College1,546 193 412 940 843 97 -
2 years. ,... ............. . 1,287 189 37) 725 670 553 years . .. 829 74 "6 679 650 29 -
4 years.... . 843 252 366 224 193 31 -
5 years or more.. . . .. .. 194 41 26 127 118 9
Female.... ... ... . ....... 21,153 2,073 8,077 '1,002 3,399 529 7,08414 and 15 years old . . . 3,663 42 34 3,586 2 1 3,58316 and 17 years old .. . 3,567 183 141 3,244 123 4 3,11718 and 19 years old... . . . 3,654 837 953 1,863 1,459 99 30520 and 2' years old... . 3,969 399 2,215 1,355 1,147 157 5122 to 24 years old .. . . . 6,300 612 4,734 953 658 268 27
Years of school completedElementary, 8 years or less.. 2,697 85 442 2,170 - - 2,170High school
1 year . 2,169 69 398 1,702 - - 1,7022 years.. 7,224 69 529 1,626 - - 1,6263 years . 2,126 107 432 1,587 - - 1,5874 years 6,772 942 4,550 1,280 1,023 I 257 -
College1,791 204 547 1,039 920 119 -
1,443 169 x00 773 717 563 years... . . 764 75 133 557 512 45 -
4 years .. . 1,029 318 513 199 151 485 years or more . 138 35 34 70 65 5 -
WHITE
Both sexes ....... .. .. . 34,704 3,267 12,815 18,623 5,917 813 11,89314 and 15 years.old.. .. 6,126 61 58 6,007 11 5,99616 and 17 years old... .. 5,946 279 218 5.450 205 14 5,23118 and 19 years old. . . . . ... 5,922 1,299 1,518 3,105 2,372 167 56620 and 21 years old.. . 6,427 586 3,523 2,318 2,004 253 6122 to 24 years old .. .... 10,283 1,041 7,498 1,744 1,324 380 40
Years of school completedElementary, 8 years or less , 4,608 134 811 3,664 - - 3,664High school
3,715 115 668 2,932 - - 2,9322 years... ... ..... .... 3,684 107 838 2,740 - - 2,7403 years.... . . 3,467 162 748 2,557 - - 2,5574 years 10,658 1,421 7,167 2,071 1,685 186 -
College1 year ..... .. .... .. . 2,812 313 814 1,684 1,507 177 -
2 years.... . . ....... . ... 2,399 313 750 1,336 1,235 1013 years. . 1,385 122 182 1,081 1,021 60 -
1,679 510 786 383 306 77 -
5 years or more . . 296 71 50 176 162 14 -
See footnote at end of table.
8,1

23
Table 7. Enrollment Status in 1994 for Persons 14 to 24 Years Old by Educational Attainment,Aar., Sex, Race, and Hispanic Origin: October 1985-Continued
(Numbers in thousands. Civilian noninstitutional population. For meaning of symbols, see text)
Age, years of school completed, sox,race, and Hispanic origi
Not enrolled Oct. 1985
Enrolled
Enrolled in collegeOct. 1985
Enrolled belowcollegeEnrolled Not enrolled Enrolled Not enrolled
Population Oct. 1984 Oct. 1984 Oct. 1985 Oct. 1984 Oct. 1984 Oct. 1985
47H1TE--Continued
Hale 17,282 1,612 6,132 9,539 2,995 378 6,16614 and 15 years oldl 3,137 31 25 3,081 9 - 3,07216 and 17 years old 3,037 129 99 2,809 101 10 2,69818 and 19 years old 2,937 652 760 1,525 1,086 89 35020 and 21 years old 3,132 261 1,706 1,165 1,018 118 2922 to 24 years old 5,039 540 3,541 957 780 160 17
Years of school completed:
Elementary, 8 years or less 2,506 76 452 1,979 - 1,979High school.1 year 1,902 58 330 1,514 - 1,5142 years 1,883 50 422 1,410 - - 1,4103 years 1,764 87 414 1,263 - - 1,2634 years 5,097 683 3,420 994 805 189 -College1 year 1,312 163 340 809 729 80 -2 years 1,148 161 336 652 606 46 -3 years 722 66 62 594 571 23 -4 years 766 228 332 206 175 31 -5 years or more 180 39 23 118 109 9 -
Female 17,422 1,654 6,683 9,084 2,922 435 5,72714 and 15 years old 2,989 30 33 2,926 2 - 2,92416 and 17 years old 2,909 150 118 2,641 104 4 2,53318 and 19 years old 2,985 648 758 1,580 1,286 78 21620 and 21 years old 3,7:5 325 1,818 1,152 986 134 3222 to .4 years old 5 244., 501 3,957 786 544 220 22Years of school completed:
Elementary, 8 years or less 2,102 58 359 1,685 - - 1,685High school:1 year 1,813 57 339 1,417 - - 1,4112 years 1,802 56 415 1,330 - 1,3303 years 1,703 75 334 1,294 - - 1,2944 years 5,561 738 3,747 1,076 879 197 -College1 year 1,499 150 474 876 778 98 -2 years 1,250 152 414 684 630 54 -3 years 663 56 120 487 450 37 -4 years. 913 282 454 177 132 45 -5 years or more 116 32 27 58 53 5 -
BLACK
Both sexes 5,930 631 2,113 3,085 629 125 2,33114 and 15 years old 1,129 20 3 1,105 4 1 1,10016 and 17 years old 1,084 59 31 994 13 3 97818 and 19 years old 1,072 284 316 473 231 28 21420 and 21 years old 1,077 119 659 298 236 37 2522 to 24 years old
fears of school completed:
1,567 149 1,203 215 144 57 14
Elementary, 8 years or less 967 43 100 825 - - 825High school.1 year 655 26 99 530 - - 5302 years 744 30 216 495 - - 4993 years 713 54 182 477 - - 4774 years 1,889 305 1,297 288 210 78 -College1 year 409 75 129 206 176 30 -2 years 273 39 107 128 119 9 -3 years 138 18 25 95 88 7 -4 years 121 41 53 28 26 2 -5 years or more 18 2 5 11 11 - -
Hale 2,838 266 1,012 1,559 300 54 1,205L4 and 15 years old 572 8 2 561 4 - 557L6 and 17 years old 546 28 17 501 3 3 4951.8 and 19 ycars old 518 118 144 256 110 10 13620 and 21 years old 499 51 299 149 119 21 9'2 to 24 years old
fears of school completed.
703 60 551 92 63 20 9
Elementary, 8 years or less 479 19 39 421 - - 421High school.1 year 359 14 48 296 - - 2962 years 375 17 111 248 - - 2483 years 367 27 99 241 - - 2414 years 849 121 569 139 .,v 33 -College1 year 181 27 62 92 78 14 -2 years 109 24 31 54 47 7 -3 years 68 2 13 53 53 - -4 years 48 15 20 14 14 - -5 years or more 2 - 2 2 - -
See footnote at end of table.

24
Table 7. Enrollment Status in 1984 for Persons 14 to 24 Years Old by Educational Attainment,Age, Sex, Race, and Hispanic Origin: October 1985Continued
(Numbers in thousands. Civilian noninstitutional population. For meaning of symbols, see text
Age, years of school completed, sex,race, and Hispanic origin
Not enrolled Oct. 1985
Enrolled
Enrolled n collegeOct. 1985
Enrolled belowcollegeEnrolled Not enrolled Enrolled Not enrolled
Population Oct. 1984 Oct. 1984 Oct. 1985 Oct. 1984 Oct. 1984 Oct. 1985
BLACK -- Continued
Female 3,092 365 1,201 1,525 329 71 1,12514 and 15 years old 558 12 1 544 54316 and 17 years old 538 30 15 493 10 48318 and 19 years old 554 166 172 216 120 18 7820 and 21 years old .78 68 360 150 118 16 1622 to 24 years old 864 89 653 122 81 36 5
Years of school completed.Elementary, 8 years or less 488 23 61 404 404High school:1 year 297 12 51 234 2342 years 369 13 105 251 2513 years 346 27 83 236 2364 years 1,040 184 709 148 103 45
College:
1 year 228 43 66 114 98 162 years 164 15 76 73 723 years 71 16 13 42 35 74 years 73 26 33 14 12 25 years or more 17 2 5 9 9
HISPANIC ORIGIN'
Both sexes 3,517 3JJ 1,495 1,669 338 53 1,27814 and 15 years old 630 10 14 606 60616 and 17 years old 665 45 58 563 11 5 54718 End 19 years old 570 136 196 238 114 12 11220 and 21 years old 574 65 371 137 117 11 922 to 24 years old 1,077 97 855 125 96 24 5
Years of school completed,Elementary, 8 years or less 837 45 325 468 468High school:
1 year 440 24 121 294 2942 years 402 26 128 248 2483 years 419 21 130 268 2684 years 891 158 598 135 114 21
College:
1 ytar 234 24 93 116 98 182 years 145 23 53 69 67 23 years 63 7 13 43 38 54 years 82 24 34 23 21 25 years or more 4 - - 4 4
Male 1,760 162 782 814 156 22 63614 and 15 years old 288 4 7 277 27716 and 17 years old 341 20 18 303 5 5 29318 and 19 years old 275 52 116 106 40 4 6220 and 21 years old 276 32 187 56 51 3 222 to 24 years old 581 54 454 73 61 10 2
Years of school completed:Elementary, 8 years or less 446 29 193 224 224High school:
1 year 234 8 60 166 1662 years 204 12 69 123 1233 years 202 11 67 124 1244 years 438 60 310 07 56 11
College:
1 year 95 13 45 37 32 52 rears. 68 13 22 33 333 years 39 2 8 29 24 54 years 33 13 9 10 105 years cr more 2 - - 2 2
female 1,757 191 712 854 181 30 64314 and 15 years old 342 6 7 329 32916 and 17 years old 325 2i 41 260 6 25418 and 19 years old 296 84 79 132 74 8 5020 and 21 years old 298 32 184 82 66 9 722 to 24 years old 497 44 401 51 35 13 3
Years of school completed.Elementary, 8 years or less 392 15 132 244 244High school:
1 year 206 16 61 129 1292 years 199 14 59 126 1263 years 217 9 64 144 1444 years 454 98 287 68 58 10
College:1 year 139 11 49 79 66 132 years 77 10 31 35 33 23 years 23 5 4 14 144 years 49 11 25 12 10 25 years or more 2 2 2
1May be of any race.

25
Table 8. Year of High School Graduation For Persons 16 to 34 Years Old by Educational Attainment,Enrollment Status, Sex, and Race: October 1985
(Numbers in thousands. Civilian noninstitucional population. For meaning of symbols, see text)
Numbers Percent distribution:nrollment status, year of
Year of high schoo' graduation Year of high 361001 graduationcollege, years of schoolcompleted, sex, and race
1980 or earlier 1980 or earlier1982 1982
to Under 26 26 to 28 29 to 34 to Under 26 26 to 28 29 to 34Total 1985 1984 1981 years old years old years old Total 1985 1984 1981 years old years old years old
ILL RACES
Both sexes 58,036 2,717 9,653 3,535 10,675 10,68_ 20,676 1C0.0 100.0 100.0 100.0 100.0 100.0 100.0:nrolled in college 10,846 1,553 4,102 947 1,689 1,072 1,485 18.7 57.2 42.5 26.0 15.8 10.0 7.2First year 2,939 1,522 707 74 215 146 274 5.1 56.0 7.3 2.0 2.0 1.4 1.3Second year 2,585 25 1,721 159 251 181 248 4.5 0.9 17.8 4.4 2.4 1.7 1.2Third year 1,931 3 1,093 180 261 172 222 3.3 0.1 11.3 5.0 2.4 1.6 1.1Fourth yea- 1,642 2 )68 373 381 165 153 2.8 0.1 5.9 10.3 3.6 1.5 0.7Fifth year - 867 8 155 303 178 223 1.5 - 0.1 4.3 2.8 1.7 1.1Sixth year or more 882 4 S 278 231 364 1.5 - 0.2 2.5 2.2 1.8lot enrolled 47,190 1,164 5,551 2,689 8,986 9,609 19,191 81.3 42.8 57.5 74.0 84.2 90.0 92.8Years of school completed.
High school, 4 years.... .. 26,612 1,138 4,447 1,680 5,120 5,038 9,188 45.9 41.9 46.1 46.2 48.0 47.2 44.4College:1 year 4,155 12 619 265 784 806 1,668 7.2 0.4 6.4 7.3 7.3 7.5 8.12 years - 4,855 5 332 334 915 1,090 2,179 8.4 0.2 3.4 9.2 8.6 10.2 10.53 years 1,506 66 69 325 322 724 2.6 - 0.7 1.9 3.0 3.0 3.54 years 7,144 10 70 325 1,595 1,764 3,380 12.3 0.4 0.7 8.9 14.9 16.5 16.35 years or more.... ...e.. 2,91E 17 16 246 588 2,050 5.0 - 0.2 0.4 2.3 5.5 9.9
Hale 28,065 1,301 4,567 1,771 5,077 5,135 10,164 100.0 100.0 100.0 100.0 100.0 100.0 100.0:nrolled in college 5,332 758 1,959 517 904 514 680 19.0 59.3 42.9 29.2 17.8 9.9 6.7First yea- 1,329 741 316 33 92 53 94 4.7 57.0 6.9 1.9 1.8 1.0 0.9Second year 1,190 13 820 83 103 71 101 4.2 1.0 18.0 4.7 2.0 1.4 1.0Third year 927 2 527 88 145 79 87 3.3 0.2 11.5 5.0 2.9 1.5 0.9Fourth year 927 2 291 224 214 104 92 3.3 0.2 6.4 12.6 4.2 2.0 0.9Fifth year : 438 5 88 165 72 109 1.6 - 0.1 5.0 3.2 1.4 1.1Sixth year or more 511 2 2 185 136 196 1.9 - 0.1 3.6 2.6 1.9.
lot enrolled -- 22,733 543 2,608 1,253 4,173 4,671 9,484 81.0 41.7 57.1 70.8 82.2 90.1 93.3Years of school completed:
High school, 4 years 12,665 527 2,113 816 2,460 2,446 4,298 45.1 40.5 46.4 46.1 48.5 47.2 42.3College:1 year 1,926 8 277 119 344 379 798 6.9 0.6 6.1 6.7 6.8 7.3 7.52 years : 2,359 146 155 421 529 1,109 8.4 - 3.2 8.8 8.1 10.2 10.93 years 690 21 36 130 147 357 2.5 - 0.5 2.0 2.6 '.8 3.54 years . 3,459 8 34 123 693 817 1,793 12.4 0.6 0.7 6.9 )3.6 15.8 17.E5 years or more . 1,624 - 12 4 125 354 1,129 5.8 - 0.3 0.2 2.5 6.8 11.1
Female :- 29,971 1,416 5,084 1,864 5,598 5,496 10,512 100.0 100.0 100.0 100.0 100.0 100.0 100.0Enrolled in college 5,514 795 2,141 429 785 558 805 18.4 56.1 42.1 23.0 14.0 10.2 7.7First yrar - 1,610 781 393 41 123 94 180 5.4 55.2 7.7 2.2 2.2 1.7 1.7Second year 1,395 13 900 76 149 109 148 4.7 0.9 17.7 4.1 2.7 2.0 1.4Third year . 1,003 1 566 92 116 93 134 3.3 0.1 11.1 4.9 2.1 1.7 1.3Forth year 715 - 277 149 167 61 61 2.4 - 5.4 8.0 3.0 1.1 0.EFifth year :. 429 3 67 138 106 114 1.4 - 0.1 3.6 2.5 1.9 1.1Sixth year or more 361 - 2 4 92 95 168 1.2 - 0.2 1.6 1.7 1.E
lot enrolled = 24,456 621 2,943 1,435 4,813 4,938 9,707 81.6 43.9 57.9 77.0 86.0 89.8 92.3Years of school completed:High school, 4 years 13,947 610 2,329 864 2,660 2,593 4,891 46.5 43.1 45.8 46.4 47.5 47.2 46.5College:
1 year 2,228 4 342 146 440 427 870 7.4 0.3 6.7 7.8 7.9 7.8 8.22 years - 2,496 5 186 179 494 562 1,070 8.3 0.4 3.7 9.6 8.8 10.2 10.23 years 816 44 33 196 175 367 2.7 - 0.9 1.8 3.5 3.2 3.54 years 3,675 2 36 202 901 947 1,587 12.3 0.1 0.7 10.8 16.1 17.2 15.]5 years or more 1,294 - 5 12 122 234 921 4.3 - 0.1 0.6 2.2 4.3 8.E
4IITE
Both sexes 49,357 2,486 8,5'3 3,123 9,027 9,040 17,737 100.0 100.0 100.0 100.0 100.0 100.0 100.0Enrolled in college 9,323 1,342 3,5.,6 807 1,435 892 1,291 18.9 5047 43.7 25.8 15.9 9.9 7.2First year 2,481 1,318 568 60 170 130 237 5.0 57.6 7.0 1.9 1.9 1.4 1.3Second year 2,183 19 1,486 122 207 139 211 4.4 0.8 18.2 3.9 2.3 1.5 1.2Third year 1,676 3 979 149 220 137 187 3.4 0.2 12.0 4.8 2.4 1.5 1.1Fourth year 1,430 2 511 326 316 141 134 2.9 0.1 6.3 10.4 3.5 1.6 0.8Fifth year - 785 8 145 273 152 208 1.6 - 0.1 4.7 3.0 1.7 1.2Sixth year or more 767 - 4 5 250 194 315 1.6 - 0.2 2.8 2.1 1.8
lot enrolled - 40,034 944 4,588 2,316 7,592 8,148 16,447 81.1 41.3 56.3 74.2 84.1 90.1 92.7Years of school completed:
High school, 4 years 22,256 917 3,683 1,421 4,242 ..,240 7,752 45.1 40.1 45.2 45.5 47.0 46.9 43.7College:
1 year == 3,526 12 486 232 665 697 1,433 7.1 0.5 6.0 7.4 7.4 7.7 8.12 years = 4,106 5 290 295 745 899 1,867 8.3 0.2 3.6 9.4 8.3 9.9 10.53 years 1,239 58 58 278 248 596 2.5 - 0.7 1.9 3.1 2.7 3.44 years 6,318 10 59 293 1,434 1,547 2,976 12.8 0.4 0.7 9.4 15.9 17.1 16.85 years or more 2,589 12 16 223 517 1,822 5.2 - 0.1 0.5 2.5 5.7 10.3
Male 24,111 1,095 3,893 1,525 4,368 4,407 8,822 100.0 100.0 100.0 100.0 100.0 100.0 100.0Enrolled in college.... ..... . 4,624 642 1,717 439 799 434 593 19.2 58.6 44.1 28.8 18.3 9.8 6.7First year e 1,125 628 254 29 78 48 89 4.7 57.4 6.5 1.9 1.8 1.1 1.0Second year . 1,034 10 723 67 85 61 89 4.3 0.9 18.6 4.4 1.9 1.4 1.0Third year 799 2 473 67 126 58 74 3.3 0.2 12.2 4.4 2.9 1.3 0.5Fourth year . 811 2 461 196 185 87 79 3.4 0.2 6.7 12.9 4.2 2.0 0.9Fifth year 402 5 80 155 63 99 1.7 - 0.1 5.2 3.5 1.4 1.1Sixth year or more 453 - 2 2 169 116 164 1.9 - 0.1 0.1 3.9 2.6 1.9
E.1

26
Table 8. Year of High School Graduation For Persons 16 to 34 Years Old by Educationai Attainment,Enrollment Status, Sex, and Race: October 1985-Continued
(17Lmbers in thousands. Civilian noninstitutional population. For meaning of symbols, see text
Enrollment status, year ofcollege, years of schoolcompleted, sex, and race
Numbers Percent distribution
Total
Year of high school graduation
Total
Year of high school graduation
1985
1982
to
1984 1981
1980 or earlier
1985
I
1982
to
1984 1981
1980 or earlier
Under 26years old
26 to 28
years old29 to 34years old
Under 26years old
26 to 28
years old
29 to 34
years old
L .TE--Continued
tale-Continued
lot enrolled 19,487 452 2,177 1,085 3,569 3,973 8,229 80.8 41.3 55.9 71.1 81.7 90.2 93.3Years of school completedHigh school, 4 years 10,668 437 1,773 690 2,071 2,067 3,631 44.2 39.9 45.5 45.2 47.4 46.9 41.2College:
1 year 1,652 8 225 105 293 332 689 6.9 0.7 5.8 6.9 6.7 7.5 7.82 years 2,020 - 123 138 356 433 968 8.4 3.2 9.0 8.2 9.8 11.03 years 572 20 31 108 111 301 2.4 - 0.5 2.0 2.5 2.5 3.44 years 3,138 8 29 116 624 724 1,638 13.0 0.7 0 7 7.6 14.3 16.4 18.65 years or ac4e 1,437 8 4 117 306 1,002 6.0 - 0.2 0.3 2.7 6.9 11.4
Female 25,246 1,191 4,249 1,599 4,658 4,633 8,915 100.0 100.0 100.0 100.0 100.0 100.0 100.01nro11ed in college 4,699 700 1,839 368 636 458 698 186 S8.8 43.3 23.0 13.7 9.9 7.8First year 1,357 690 314 31 92 81 148 5.4 57.9 7.4 1.9 2.0 1.7 1.7Second year 1,149 9 763 56 122 78 122 4.b 0.8 18.0 3.5 2.6 1.7 1.4Third year 877 1 506 82 94 79 10 3.5 0.1 11.9 5.1 2.0 1.7 1.3Fourth year 619 - 250 130 131 53 55 2.5 - 5.9 8.1 2.8 1.1 0.6Fifth year 384 3 66 117 89 109 1.5 - 0.1 4.1 2.5 1.9 1.2Sixth year or more 314 - 2 4 80 78 150 1.2 - 0.3 1.7 1.7 1.7
Lot enrolled 20,547 491 2,410 1,231 4,022 4,174 8,218 81.4 41.2 56.7 77.0 86.3 90.1 92.2Years of school completed_High school, 4 years 11,589 481 1,911 732 2,171 2,174 4,121
.45.9 40.4 45.0 45.8 46.b 46.9 46.2
College.1 year 1,873 4 261 127 372 365 744 7.4 0.3 6.1 7.9 8.0 7.9 8.32 years 2,086 5 167 157 353 466 899 8.3 0.4 3.9 9.8 8.4 10.1 10.13 years 668 38 27 170 137 295 2.6 0.9 1.7 3.6 3.0 3.34 years 3,180 2 31 177 810 822 1,338 12.6 0.2 0.7 11.1 17.4 17.7 15.05 years or more 1,152 4 12 106 211 820 4.6 - 0.1 0.8 2.3 4.6 9.2
HACK
Both sexes 6,800 3 6 1,252 423 1,303 1,266 2,219 100.0 100.0 1°8.0 100.0 100.0 100.0 100.0:nrolled in college 1.044 1 3 404 93 155 123 126 15.4 42.6 37.3 21.9 11.9 9.7 5.7First year 324 137 110 9 31 11 24 4.8 40.9 8.8 2.1 2.4 0.9 1.1Second year 300 6 169 25 29 38 32 4.4 1.8 13.5 6.0 2.2 3.0 1.4Third year 189 89 21 25 29 26 2.8 - 7.1 5.0 1.9 2.3 1.2Fourth year 137 - 36 31 38 17 15 2.0 - 2.9 7.3 2.9 1.3 0.7Fifth year 45 - - 6 19 12 7 0.7 - 1.4 1.5 1.0 0.3Sixth year or more 50 - - - 12 16 22 0.7 - - 0.9 1.3 1.0
,ot enrolled 5.756 193 848 330 1,148 1,143 2,093 84.6 5%.4 67.7 78.1 88.1 90.3 94.3Years of school compltied.High school, 4 years 3,769 193 683 234 7.7 b89 1,213 55.4 57.4 54.6 55,4 58.1 54.4 54.7College
1 year
2 years526on
- 118
34
30
35
102
144
89
137
188
250
7.,
8.8
-
-
9.4
2.7
7.2
8.3
7.8
11.0
7.0 8 S
10.9 11.33 wars 219 - 6 9 41 57 106 3.2 - 0.5 2.1 3.2 4.5 4.84 years 496 - 6 22 91 136 241 7.3 - 0.5 5.2 7.0 10.7 10.95 year; or morO 145 - 1 - 13 35 95 2.1 - 0.1 - 1.0 2.8 4.3
Male 3,030 156 561 206 541 592 984 100.0 100 0 100.0 100.0 100.0 100.0 100.0enrolled in college 454 78 182 56 50 45 43 15.0 50.v 32.4 27.2 9.2 7.7 j 4.4First sear 14b 7o 52 3 9 4 2 4.8 48.7 9.3 1.5 1.7 0.7 0.2Second year 107 2 67 12 10 7 9 3.5 1.3 11.9 5.8 1.8 1.2 1 0.9Third year 89 44 14 8 16 7 2.9 - 7.8 6.8 1.5 2.7 0.7Fourth veer 72 - 19 22 14 9 9 2.4 - 3.4 10.7 2.6 1.5 0.9Fifth }tar 15 - - 5 3 3 3 0.5 - 2.4 0.6 0.5 0.3Sixth year or more 25 - - - 5 . 13 0.8 - - 0.9 1.2 1.3
43t enrolled 1,577 78 379 150 491 537 941 85.0 50.0 67.6 72.8 90.8 9 .3 95.6Years of school completed:High school, 4 years 1,740 78 316 115 336 333 561 57.4 50.0 56.3 55.8 62.1 57.2 57,0College:
1 ear 225 43 13 44 41 84 7.4 - 7.7 6.3 8.1 7.0 8.52 scars 257 - 17 14 33 63 110 8,5 - 3.0 6.8 9.8 10.8 11.23 years 95 - 4 18 27 47 3.1 - 1.9 3.3 4.6 4.84 years 181 - 2 5 38 47 89 6.0 - 0.4 2.4 7.0 8.1 9.05 wars r x,re ...... 79 - - 2 26 50 2.6 - 0.4 4.5 5.1
Female 3,769 180 691 217 762 683 1,235 100.0 100.0 100.0 100.0 100.0 100.0 100.0:nrollcd in colle,e 590 66 222 37 1°4 77 83 15.7 36.7 32.1 17.: 13.6 11.3 6.7First %%ar , 178 62 58 6 22 7 22 4.7 34.4 8.4 2.8 2.9 1.0 1.8Second t r 1)2 4 103 14 19 31 23 5.1 2.2 14.9 6.5 2.5 4.5 1.9Third }car 100 46 7 16 13 19 2.7 - 6.7 3.2 2.1 1.9 1.5Fourth sear 65 - 18 9 24 8 6 1.7 - 2.6 4.1 3.1 1.2 0.5Fifth }car 30 - 1 lb 9 4 0.8 - 0.5 2.1 1.3 0.3St<th Aar or man 25 - - - 7 9 9 0.7 - 0.9 1.3 0.7
.,L ..--,11,61 3,179 115 569 180 658 606 1,152 84.3 63.9 67.9 82.9 86.4 88.7 93.3Scars of ,(1.61 conp1,L,d
I. to 5,1.01, '. scars 2,030 115 366 119 421 356 652 53.1 63.`1 53.0 54.8 52.1 52.8( 0 llege
1 yea- 301 - 74 18 57 48 104 8.0 . 10.7 8.3 7.5 7.0 8.42 stirs- 344 - 17 21 91 74 140 9.1 . 2.5 9.7 11.9 10.8 11.33 year.. 124 - 6 5 24 30 60 3.3 - 0.9 2.3 3.1 4.4 4.94 Years 315 - 4 17 51 89 152 8.4 - (6 7.8 7.0 13.0 12.35 years or mon 66 - I - 11 9 45 1.8 - 0.1 1.3 3.o
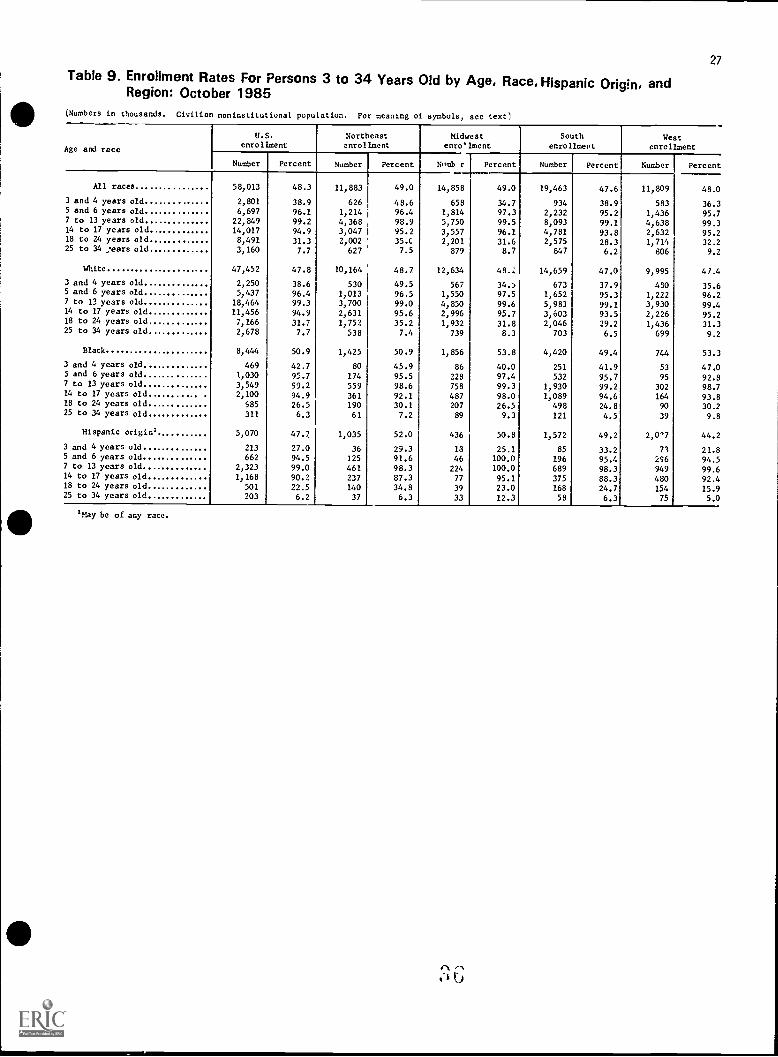
27
Table 9. Enrollment Rates For Persons 3 to 34 Years Old by Age, Race, Hispanic Origin, andRegion: October 1985
(Numbers in thousands. Civilian noninstitutional population. For meaning of symbols, see text)
Age and race
U.S.enrollment
Northeastenrollment
Midwestenro'lment
Southenrollment
Westenrollment
Number Percent Number Percent Numb r Percent Number Percent Number Percent
All races 58,013 48.3 11,883 49.0 14,858 49.0 19,463 47.6 11,809 48.0
3 and 4 years old . 2,801 38.9 626 48.6 658 34.7 934 38.9 583 36.35 and 6 years old 6,697 96.1 1,214 96.4 1,814 97.3 2,232 95.2 1,436 95.77 to 13 years old 22,849 99.2 4,368 98.9 5,750 99.5 8,093 99.1 4,638 99.314 to 17 years old... 14,017 94.9 3,047 I 95.2 3,557 96.1 4,781 93.8 2,632 95.218 to 24 years old 8,491 31.3 2,002 35.( 2,201 31.6 2,575 28.3 1,714 32.225 to 34 ;ears old 3,160 7.7 627 7.5 879 8.7 847 6.2 806 9.2
White 47,452 47.8 10,164 48.7 12,634 48.Z 14,659 47.0 9,995 47.4
3 and 4 years old 2,250 38.6 530 49.5 567 34.9 673 37.9 450 35.65 and 6 years old 5,437 96.4 1,013 96.5 1,550 97.5 1,652 95.3 1,222 96.27 to 13 years old 18,464 99.3 3,700 99.0 4,850 99.6 5,983 99.1 3,930 99.414 to 17 years old 11,456 94.9 2,631 95.6 2,996 95.7 3,603 93.5 2,226 95.218 to 24 years old 7,166 31.7 1,752 35.2 1,932 31.8 2,046 29.2 1,436 31.325 to 34 years old. 2,678 7.7 538 7.4 739 8.3 703 6.5 699 9.2
Black 8,444 50.9 1,425 50.9 1,856 53.8 4,420 49.4 744 53.3
3 and 4 years old 469 42.7 80 45.9 86 40.0 251 41.9 53 47.05 and 6 years old 1,030 95.7 174 95.5 228 97.4 532 95.7 95 92.87 to 13 years old 3,549 99.2 559 98.6 758 99.3 1,930 99.2 302 98.714 to 17 years old. . . . 2,100 94.9 361 92.1 487 98.0 1,089 94.6 164 93.818 to 24 years old 985 26.5 190 30.1 207 26.5 498 24.8 90 30.225 to 34 years old 311 6.3 61 7.2 89 9.3 121 4.5 39 9.8
Hispanic origin' 5,070 47.7 1,035 52.0 436 50.8 1,572 49.2 2,0'7 44.2
3 and 4 years old. 213 27.0 36 29.3 13 25.1 85 33.2 71 21.85 and 6 years old 662 94.5 125 91.6 46 100.0 196 95.4 296 94.57 to 13 years old .. . 2,323 99.0 461 98.3 224 100.0 689 98.3 949 99.614 to 17 years old 1,168 90.2 237 87.3 77 95.1 375 88.3 480 92.418 to 24 years old 501 22.5 140 34.8 39 23.0 168 24.7 154 15.925 to 34 years old 203 6.2 37 6.3 33 12.3 58 6.3 75 5.0
May be of any race.
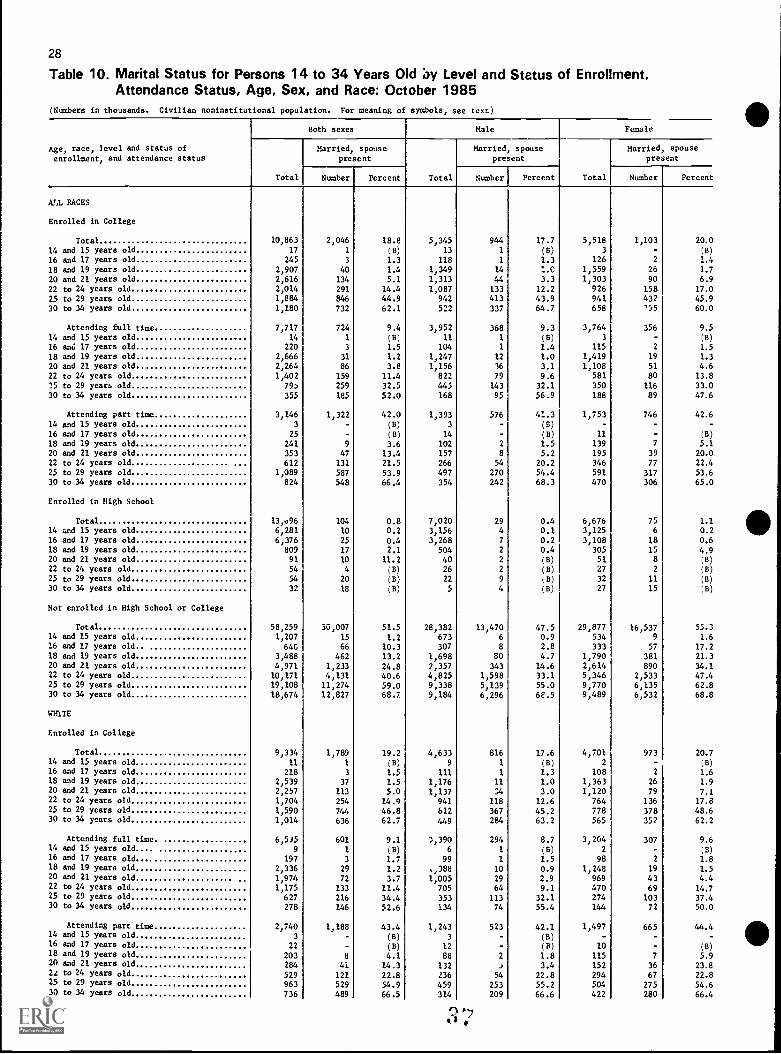
28
Table 10. Marital Status for Persons 14 to 34 Years Old 'ay Level and Status of Enrollment,Attendance Status, Age, Sex, and Race: October 1985
(Numbers in thousands. Civilian noninstitutional population. For meaning of symbols, see text)
Age, race, level and status ofenrollment, and attendance status
Both sexes Male Female
Total
Married, spousepresent
Total
Married, spousepresent
Total
Married spouse
present
Number Percent Number Percent Number Percent
ALL RACES
Enrolled in College
Total 10,863 2,046 18.8 5,345 944 17.7 5,518 1,103 20.0
14 and 15 years old 17 1 (B) 13 1 (B) 3 (B)
16 and 17 years old 245 3 1.3 118 1 1.3 126 2 1.4
18 and 19 years old 2,907 40 1.4 1,349 14 :.0 1,559 26 1.7
20 and 21 years old 2,616 134 5.1 1,313 44 3.3 1,303 90 6.9
22 to 24 years old 2,014 291 14.4 1,087 133 12.2 926 158 17.0
25 to 29 years old 1,884 846 44.9 942 413 43.9 941 43? 45.9
30 to 34 years old 1,180 732 62.1 522 337 64.7 658 '55 60.0
Attending full time 7,717 724 9.4 3,952 368 9.3 3,764 356 9.5
14 and 15 years old 14 1 (B) 11 1 (B) 3 (B)
16 and 17 years old 220 3 1.5 104 1 1.4 115 2 1.5
18 and 19 years old 2,666 31 1.2 1,247 12 1.0 1,419 19 1.3
20 and 21 years old 2,264 86 3.8 1,156 36 3.1 1,108 51 4.6
22 to 24 years old 1,402 159 11.4 822 79 9.6 581 80 13.8
15 to 29 years old 79) 259 32.5 445 143 32.1 350 116 33.0
30 to 34 years old 355 185 52.0 168 95 56.9 188 89 47.6
Attending part time 3,146 1,322 42.0 1,393 576 41.3 1,753 746 42.614 and 15 years old 3 (B) 3 (B)
16 and 17 years old 25 (B) 14 (B) 11 (B)18 and 19 years old 241 9 3.6 102 2 1.5 139 7 5.1
20 and 21 years old 353 47 13.4 157 8 5.2 195 39 20.0
22 to 24 years old 612 131 21.5 266 54 20.2 346 77 22.4
25 to 29 years old 1,089 587 53.9 497 270 54.4 591 317 53.6
30 to 34 years old 824 548 66.4 354 242 68.3 470 306 65.0
Enrolled in High School
Total 13,096 104 0.8 7,020 29 0.4 6,676 75 1.1
14 and 15 years old 6,281 10 0.2 3,156 4 0.1 3,125 6 0.216 and 17 years old 6,376 25 0.4 3,268 7 0.2 3,108 18 0.6
18 and 19 years old 809 17 2.1 504 2 0.4 305 15 4.920 and 21 years old 91 10 11.2 40 2 (B) 51 8 (B)22 to 24 years old 54 4 (B) 26 2 (B) 27 2 (B)25 to 29 years old 54 20 (B) 22 9 03) 32 11 (B)30 to 34 years old 32 18 (B) 5 4 (B) 27 15 (8)
Not enrolled in High School or College
Total 58,259 30,007 51.5 28,382 13,470 47.5 29,877 16,537 55.314 and 15 years old 1,207 15 1.2 673 6 0.9 534 9 1.616 and 17 years old 64G 66 10.3 307 8 2.8 333 57 17.218 and 19 years old 3,488 462 13.2 1,698 80 4.7 1,790 381 21.320 and 21 years old 4,971 1,233 24.8 2,357 343 14.6 2,614 890 34.122 to 24 years old 10,171 4,131 40.6 4,825 1,598 33.1 5,346 2,533 47.425 to 29 years old 19,108 11,274 59.0 9,338 5,139 55.0 9,770 6,135 62.830 to 34 years old 18,674 12,827 68.7 9,184 6,296 6E.5 9,489 6,532 68.8
WHITE
Enrolled in College
Total 9,334 1,789 19.2 4,633 816 17.6 4,701 973 20.714 and 15 years old 11 1 (B) 9 1 (B) 2 (B)16 and 17 years old 218 3 1.5 111 1 1.3 108 2 1.618 and 19 years old 2,539 37 1.5 1,176 11 1.0 1,363 26 1.920 and 21 years old 2,257 113 5.0 1,137 3.0 1,120 79 7.122 to 24 years old 1,704 254 14.9 941 118 12.6 764 136 17.825 to 29 years old 1,590 744 46.8 612 367 45.2 778 378 48.630 to 34 years old 1,014 636 62.7 449 284 63.2 565 352 62.2
Attending full time. 6,5)5 601 9.1 3,390 294 8.7 3,204 307 9.614 and 15 years old 9 1 (B) 6 1 (B) 2 (B)16 and 17 years old 197 3 1.7 99 1 1.5 98 2 1.818 and 19 years old 2,336 29 1.2 10 0.9 1,248 19 1.520 and 21 years old 1,974 72 3.7 1,005 29 2.9 969 43 4.422 to 24 years old 1,175 133 11.4 705 64 9.1 470 69 14.725 to 29 years old 627 216 34.4 353 113 32.1 274 103 37.430 to 34 years old 278 146 52.6 134 74 55.4 144 72 50.0
Attending part time 2,740 1,188 43.4 1,243 523 42.1 1,497 665 44.414 and 15 years old 3 (B) 3 (B)16 and 17 years old 22 (B) 12 (B) 10 (B)18 and 19 years old 203 8 4.1 88 2 1.8 115 5.920 and 21 years old 284 41 14.3 132 3.4 152 36 23.824 to 24 years old 529 121 22.8 236 54 22.8 294 67 22.825 to 29 years old 963 529 54.9 459 253 55.2 504 275 54.630 to 34 years old 736 489 66.5 314 209 66.6 422 280 66.4

2
2
2
3
2
2
2
3
29
Table 10. Marital Status for Persons 14 to 34 Years Old by Level and Status of Enrollment,Attendance Status, Age, Sex, and Race: October 1985-Continued
(Numbers in thousands. Civilian noninstitutional population. For meaning of symbols, see text)
Age, race, level and status ofenrollment, and attendance status
Both sexes Male Female
Total
Married, snousepresent
Married spouse
present
Total
Married, spousepresent
Number Percent Total Number Percent Number Percent
JHITE -- Continued
Enrolled in High school
Total 11,164 91 0.8 5,743 27 n.5 5,416 64 1.2L4 and 15 years old 5,224 8 0.1 2,643 4 0.1 2,581 4 0.2L6 and 17 years old 5,210 21 0.4 2,686 3 0.2 2,524 16 0.6L3 and 19 years 01d 566 13 2.4 350 2 0.6 216 11 5.320 and 21 years old 61 10 (B) 29 2 (B) 32 8 (3)
22 to 24 years old 40 3 (B) 17 2 (B) 22 2 (B)25 to 29 years old 42 19 (B) 18 9 (3) 23 10 (B)
30 to 34 years old
lot Enrolled in High School or College
22 15 (B) 5 4 (3) 17 12 (B)
Total 48,792 26,577 54.5 24,010 11,934 49.7 24,711 14,643 59.1L4 and 15 years, old 891 12 1.4 485 6 1.2 406 6 1.6L6 and 17 years old 517 63 12.1 240 8 3.5 277 54 19.5L8 and 19 years old 2,81' 415 14.7 1,412 67 4.7 1,406 348 24.8!CI and 21 years old 4,109 1,105 26.9 1,967 316 16.1 2,143 788 36.8!2 to 24 years old 8,539 3,644 41.7 4,081 1,425 34.9 4,458 2,219 49.815 to 29 years old 16,073 10,014 62.3 7,917 4,580 57.9 8,156 5,434 66.630 to 34 years old 15,846 11,325 71.5 7,908 5,532 69.9 7,937 5,793 73.0
3LACK
!nrolled in College
Total 1,049 150 14.3 458 63 13.8 591 87 14.8L4 and 15 years old 5 - (B) 4 (B) 1 (B)L6 and 17 years old 16 - (B) 6 - (B) 10 - (3)
L8 and 19 years old 259 2 0.8 121 2 1.7 138 -
'0 and 21 years old 274 13 4.7 140 7 5.2 134 6 4.3(2 to 24 years old 201 21 10.7 84 6 6.7 117 16 13.5(5 to 29 years old 183 60 32.7 64 22 (B) 119 37 31.410 to 34 years 010 112 54 48.3 40 26 (B) 72 28 (B)
Attending full time 768 66 8.6 3G9 31 8.3 399 35 8.8A and 15 years old 5 - (B) 4 - (B) 1 LB)f) and 17 years old 12 - (B) 3 - (B) 9 (B).8 and 19 years old 230 2 0.9 111 2 1.9 119 - -
'0 and 21 years old 223 9 4.t 122 4 ..9 101 6 5.7'2 to 24 years old 147 15 10.2 70 6 (B) 77 9 12.15 to 29 years old 97 24 25.1 43 16 (B) 54 8 (B)
0 to 34 years old 52 15 (B) 15 3 (B) 37 12 (B)
Attending part time 281 85 30.0 89 32 36.4 192 52 27.14 and 15 years old - - - - - - -
6 and 17 years old 4 - (B) 3 - (B) 1 - (B)8 and 19 years old 28 - (B) 9 - (B) 19 - (B)0 and 21 years old 50 4 (B) 17 4 (B) 33 - (B)
2 to 24 years old 53 6 (B) 14 - (B) 40 6 (B)5 to 29 years old 86 35 41.3 21 6 (B) 65 29 (13)
0 to 34 years old
nrolled in High School
60 39 (B) 25 23 (B) 35 17 (B)
Total. 2,082 10 0.5 1,045 2 0.2 1,037 8 0.84 and 15 years old 849 2 0.3 407 - - 442 2 0.56 and .., years old 965 4 0.4 482 2 0.4 483 2 0.48 and 19 years old 214 2 1.1 136 - - 78 2 3.00 and 21 years old 25 - (B) 9 - (B) 16 - ,B)
2 to 24 years old 14 - (B) 9 - (B) 5 - (8)5 to 29 years old 9 - (B) 2 - (B) 7 - (B)
0 to 34 years old
of Enrollee in High School or College
7 2 (B) - - 7 2 (B)
Total 7,699 2,501 32.5 3,525 1,168 33.1 4,174 1,333 31.94 and 15 years old 275 2 0.8 160 - - 115 2 2.06 and 17 years old 103 - - 58 - (B) 45 - (B)8 and 19 years old 600 27 4.5 262 11 4.3 338 16 4.70 and 21 years old... 779 104 13.3 350 23 6.4 428 81 18.92 to 24 years old 1,353 372 27.5 611 139 22.8 742 233 31.35 to 29 years old. 2,395 907 37.8 1,090 404 37.1 1,305 502 38.50 to 34 years old 2,195 1,090 49.7 994 592 59.5 1,201 498 41.5

30
Table 11. Enrollment Status of Primary Family Members 3 to 34 Years Old by EducationalAttainment of Family Householder, Level and Control of School, Sex, Race, andHispanic Origin: October 1985
Numbers in thousands, Civilian noninsticutional population. Excludes persons in families in which the householder.; are members of the ArmedForces. Also excludes family members who are family householders and family members who are married, spouse present. For meaning of symbols,see text)
Level and control of schoolenrollment status, sex, race,and Hispanic origin
Total
Years of school completed by family householder
Elementary school High school College
0 to 4
years5 to
years8
years1 to 3years
4
years1 to 3years
4 yearsor more
ALL RACES
All family members ...... . 70,836 2,044 3,344 3,072 9,487 26,856 12,295 13,737Enrolled 52,851 1,308 2,186 1,835 6,368 19,827 9,813 11,514Nursery school and Kindergarten 6,306 133 161 156 662 2,373 1, 55 1,556
4,075 127 150 131 565 1,668 752 681Private 2,231 6 11 25 97 705 513 875
Elementary, 1 tr 8 years 26,813 769 1,299 989 3,511 10,265 4,857 5,123Public 23,751 750 1,248 929 3,325 9,236 4,123 4,140Private 3,062 19 51 60 186 1,029 734 983
High school, 1 to 4 years 13,370 346 584 535 1,781 5,068 2,385 2,672Public 12,196 337 566 506 1,698 4,709 2,123 2,257Private 1,174 9 18 29 83 359 262 415
College, full time 5,412 52 107 118 325 1,762 1,108 1,941Public 4,071 45 89 90 260 1,369 875 1,344Private 1,341 7 18 28 65 393 233 597
College, part time 950 9 35 39 90 360 198 221Public 814 5 31 35 80 309 186 170Private 136 4 4 4 10 51 12 51
Not enrolled3 to 13 years old 4,836 150 218 183 836 1,953 794 70514 to 34 years old 13,149 587 940 1,054 2,284 5,077 1,688 1,519Not high school graduate 2,869 297 378 352 688 799 236 119
14 to 24 years old 2,077 194 245 233 493 637 188 8725 to 34 years old 792 103 133 119 196 161 48 32
High school graduate 10,279 289 562 702 1,595 4,279 1,652 1,400No college 6,974 222 451 581 1,272 3,087 835 527College, 1 to 3 years 1,996 57 75 87 234 731 416 395College, 4 years 1,309 10 35 34 89 461 201 478
Percent distribution 100,0 2.9 4.7 4.3 13.4 37.9 17.4 19.4Enrolled 100.0 2.5 4.1 3.5 12.0 37.5 18.6 21.8
Nursery school and kindergarten 100.0 2.1 2.6 2.5 10.5 37.6 20.1 24.7Public 100.0 3.1 3.7 3.2 13.9 40.9 18.4 16.7Private 100.0 0.2 0.5 1.1 4.3 31.6 23.0 39.2
Elementary, i to 8 years ...... 100.0 2.9 4.8 3.7 13.1 38.3 18.1 19.1Public 100.0 3.2 5.3 3.9 14.0 38.9 17.4 17.4Private 100.0 0.6 1.7 1.9 6.1 33.6 24.0 32.1High school, 1 to 4 years 100.0 2.6 4.4 4.0 13.3 37.9 17.8 20.0Public 100.0 2.8 4.6 4.1 13.9 38.6 17.4 18.5Private 100.0 0.8 1., 2.4 7.1 30.5 22.3 35.4
College, full time 100.0 1.0 2.0 2.2 6.0 32.6 20.5 35.9Public 100.0 2.2 2.1 6.4 33.6 21.5 33.0Private. 100.0 0.5 1.4 2.1 4.8 29.3 17.4 44.5
College, part time 100.0 0.9 3.7 4.1 9.5 37.9 20.8 23.3Public 100.0 0.6 3.7 4.3 9.8 37.9 22.8 20.8Private 100.0 2.7 3.2 2.8 7.5 37.2 9.1 37.5
Not enrolled
3 to 13 years old.. 100.0 3.1 4.5 3.8 17 40.4 16.4 14.614 to 34 years old 100.0 4.5 7.1 8.0 17.4 38.6 12.8 11.6Not high school graduate 100.0 10.4 13.2 12.3 24.0 27.8 8.2 4.2
14 to 24 years old 100.0 9.3 11.8 11.2 23.7 30.7 9.1 4.225 to 34 years old 100.0 13.0 :L.7 15.1 24.7 *0.4 6.0 4.1
High school graduate 100.0 2.8 5.5 6.8 15.5 41.6 14.1 13.6No college 100.0 3.2 6.5 8.3 18.2 44.3 12.0 7.6College, 1 to 3 years 100.0 2.9 3.8 4.4 11.7 36.6 20.8 19.8College, 4 years or more 100.0 0.8 2.7 2.6 6.8 35.2 15.4 36.5
Male members 37,337 1,132 1,838 1,637 5,055 14,062 6,388 7,225Enrolled 27,032 700 1,138 948 3,218 10,116 4,950 5,962Nursery school and kindergarten 3,193 61 96 77 332 1,179 657 791
Public 2,100 57 90 72 292 847 385 357Private 1,093 4 6 5 40 332 272 434
Elementary, 1 to 8 years 13,698 426 6o6 504 1,793 5,264 2,439 2,606Public 12,160 418 636 471 1,695 4,732 2,072 2,136Private 1,539 8 30 33 98 532 367 470
High school, 1 to 4 years 6,924 192 300 281 918 2,597 1,233 1,402Public 6,351 191 292 272 881 2,426 1,107 1,182Private 573 1 8 9 37 171 126 220
College, full time 2,777 16 54 59 148 920 528 1,052Public 2,113 12 47 41 119 720 415 758Ptivate 664 4 7 18 29 200 113 294
College, part time 440 5 22 27 28 155 92 112Public 371 1 19 25 22 134 88 82Private 69 4 3 2 6 21 4 30
Not enrolled:3 to 13 years old 2,586 95 120 64 467 1,010 441 39014 to 34 years old 7,718 337 580 625 1,370 2,937 997 872Not high school graduates ... 1,875 178 269 228 461 511 151 7/14 to 24 years old 1,375 112 188 160 329 4,2 122 52
21 to 34 years old 499 66 81 68 132 99 29 25High school graduate 5,843 160 311 397 909 2,426 846 797No college 4,076 131 251 335 745 1,809 511 295College, 1 to 3 years 1,103 23 38 46 127 392 230 248College, 4 years or more 664 6 22 16 37 225 105 254
See footnote at end of table.

31
Table 11. Enrollment Status of Primary Family Members 3 to 34 Years Old by EducationalAttainment of Family Householder, Level and Control of School, Sex, Race, andHispanic Origin: October 1985-Continued
,Numbers in thousands. Civilian noninstitutional population. Excludes persons in families in which the householders are members of the ArredForces. Alsoexc'udesfamilymembers who are family householders and family members who are married, spouse present. For meaning of symbols,see text)
Level and control of schoolenrollment status, sex, race,and Hispanic origin
Total
Years of school completed by family householders
Elementary school High school College
0 to 4
years5 to 7
years8
years
1 to 3years
4
years
1 to 3years
4 yel.rs
or more
ALL RACES--Continued
Female members 33,500 912 1,506 1,435 4,433 12,794 5,907 6,512Enrolled 25,819 608 1,049 887 3,150 9,711 4,863 5,551Ndrsery school ard kindergarten 3,113 71 65 80 330 1,'" 608 764
Public 1,975 70 60 60 273 821 367 324Private 1,138 1 5 20 57 374 241 440
Elementary, 1 to 8 years 15,L1.7, 344 633 484 1,718 5,002 2,417 2,517Public 11,591 332 612 458 1,630 4,505 2,051 2,004Private 1,524 12 21 26 88 497 366 513
High school, 1 to 4 years 6,447 153 283 254 863 2,469 1,152 1,272Public 5,845 146 2/3 234 817 2,292 1,017 1,076Private .............. .. .... 602 7 10 20 46 187 135 196
College, full time 2,635 35 54 59 177 840 580 889Public 1,958 32 42 49 141 648 460 586Private 677 3 12 10 36 192 120 303
College, part time 511 4 14 12 63 204 106 109Public 443 4 12 10 58 174 98 87Private 68 - 2 2 5 30 8 22
Not enrolled:3 to 13 years old 2,250 55 97 118 369 942 353 31514 to 34 years old 5,431 250 360 430 914 2,141 691 645Not high school graduate 995 119 109 124 227 288 85 42
14 to 24 years old 702 82 57 73 163 226 66 3525 to 34 years old 293 37 51 51 64 63 19 7
High school graduate 4,436 130 251 306 687 1,853 607 604No college 2,898 91 200 246 527 1,278 324 232College, 1 to 3 years 893 34 38 41 108 339 186 148College, 4 years or more 645 5 13 19 52 236 97 224
WHITE
All family members 57,291 1,472 2,431 2,418 6,614 21,854 10,304 12,198Enrolled 43,117 941 1,643 1,455 4,395 16,132 8,251 10,300Nursery school and kindergarten.. 5,147 98 126 125 423 1,892 1,072 1,411
Public 3,162 93 117 107 344 1,276 618 607Private 1,985 5 9 18 79 616 454 804
Elementary, 1 to 8 years 21,557 566 986 800 2,426 8,213 4,035 4,532Public 18,781 550 939 740 2,276 7,274 3,367 3,636Private 2,776 16 47 60 150 939 668 896
High school, 1 to 4 years 10,909 244 431 427 1,209 4,199 2,012 2,390Public 9,821 237 416 400 1,142 3,868 1,762 1,997Private 1,088 7 15 27 67 331 250 393
College, full time 4,70/ 31 76 71 271 1,524 964 1,770Public 3,486 27 63 50 215 1,165 753 1,213Private 1,221 4 13 21 56 359 211 557
College, part time 795 5 24 31 67 303 170 195Public 675 3 20 27 59 259 159 148Private 120 2 4 4 8 44 11 47
Not enrolled:3 to 13 years old 3,927 116 167 133 637 1,579 673 62114 to 34 years old 10,247 415 621 829 1,582 4,143 1,380 1,277Not high school graduate 2,091 223 273 262 445 608 182 97
14 to 24 years old 1,565 161 191 175 330 483 145 7925 to 34 years old 526 62 83 87 114 125 38 17
High school graduate 8,157 192 348 566 1,137 3,534 1,197 1,180No college 5,486 155 283 481 896 2,550 681 439College, 1 to 3 years 1,562 31 47 61 169 587 329 337College, 4 years or more 1,109 6 18 24 72 397 187 404
Percent distribution 100.0 2.6 4.2 4.2 11.5 38.1 18.0 21.3Enrolled 100.0 2.2 3.8 3.4 10.2 37.4 19.1 23.9Nursery school and kindergarten 100.0 1.9 2.4 2.4 8.2 36.8 20.8 27.4
Public. 100.0 2.9 3.7 3.4 10.9 4(.4 19.5 19.2Private 100.0 0.2 0.4 0.9 4.0 31.1 22.9 40.5
Elementary, 1 to 8 years 100.0 2.6 4.6 3.7 11.3 38.1 18.7 21.0Public 100.0 2.9 5.0 3.9 12.1 38.7 17.9 19.4Private 100.0 0.6 1.7 2.1 5.4 33.8 24.1 32.2
High school, 1 to 4 years 100.0 2.2 4.0 3.9 11 1 38.5 18.4 21.9Public 100.0 2.4 4.2 4.1 11.6 39.4 17.9 20.3Private 100.0 0.6 1.3 2.5 6.2 30.4 22.9 36.1
College, full time 100.0 0.7 1.6 1.5 5.8 32.4 20.5 37.6Public 100.0 0.8 1.8 1.4 6.2 33.4 21.6 34.8Private 100.0 0.3 1.1 1.8 4.6 29.4 17.3 45.6
College, part time 100.0 0.6 3.0 3.9 8.4 38.1 21.4 24.5Public 100.0 0.4 2.9 4.0 8.7 38.4 23.5 22.0Private 100.0 1.4 3.6 3.1 6.6 36.8 9.3 39.1
Not enrolled3 to 13 years old 100.0 3.0 4.3 3.4 16.2 40.2 17.1 15.814 to 34 years old 100.0 4.1 6.1 8.1 15.4 40.4 13.5 12.5Not high school graduate 100.0 10.7 13.1 12.6 21.3 29.1 8.7 4.6
14 to 24 yeArs old 100.0 10.3 12.2 11.2 21.1 30.9 9.3 5.125 to 34 years old 100.0 11.7 15.8 16.6 21.7 23.7 7.1 3.3
High school graduate 100 0 2.4 4.3 6.9 13.9 43.3 14.7 14.5No college 100 0 2.8 5.2 8.8 16.3 46.5 12.4 8.0College, 4 years or more 100.0 2.0 3.0 3.9 10.8 37.6 21.1 21.6College, 4 years or more 100.0 0.6 1.6 202, , 6.5 35.8 16.9 36.4
See footnote at and of table.

32
Table 11. Enrollment Status of Primary Family Members 3 to 34 Years Old by EducationalAttainment of Family Householder, Level and Control of School, Sex, Race, andHispanic Origin: October 1985-Continued
N,mbers in thousands. Civilian noninstitut4onal pOpu.atiOn. Excludes persons in families in which the householdersare members of the ArmedForces. Also excludes family members who are family householders and family members who are married, spouse present. For meaning of symbols,see text)
.evel and control of schoolenrollment statuo, sex, race,and Hispanic origin
Total
Years of school completed by family householder-Elementary school High school College
0 to 4
years5 to 7years
8
years1 to 3
years4
years
1 to 3years
4 yearsor more
MITE --Contilnued
Hale members 30,359 815 1,364 1,316 3,589 11,456 5,366 6,45341rolled 22,164 506 855 757 2,239 8,250 4,181 5,376Nursery school and kindergarten 2,644 49 83 66 197 964 572 711
Public 1,662 45 77 64 163 670 328 316Private 982 4 6 2 34 294 244 395
Elementary, 1 to 8 years 11,031 315 494 414 1,255 4,181 2,024 2,347Public 9,636 307 464 381 1,180 3,699 1,671 1,913Private 1,395 8 30 33 75 482 333 434
High school, 1 to 4 years... 5,660 '30 227 222 634 2,152 1,03; 1,259Public 5,127 129 220 213 663 1,995 916 1,051Private 533 1 7 9 :1 157 119 208
College, full time 2,440 9 35 33 131 810 463 960Public 1,830 5 28 20 105 628 359 685Private 610 4 7 13 26 182 104 275
College, part time 390 3 17 20 22 143 86 98Public 330 1 14 18 18 124 83 71Private
lot enrolled.
3 to 13 years old
60
2,072
2
73
3
1Si
2
50
4
352
19
794
3
363
27
34014 to 34 years old 6,123 237 408 509 998 2,412 822 737Not high school graduate 1,371 127 202 172 301 392 116 62
14 to 24 years old 1,056 94 152 121 225 321 95 4825 to 34 years old 315 33 50 51 77 70 21 14
High school graduate 4,751 110 206 338 697 2,021 707 675No college 3,287 87 172 292 559 1,511 422 244College, 1 to 3 years 889 20 21 31 101 316 187 215College, 4 years or more 575 3 13 15 37 194 98 216
Female members - 26,932 657 1,068 1,102 3,025 10,398 4,938 5,745:nrolled 20,953 435 788 698 2,156 7,882 4,070 4,924Nursery school and kindergarten 2,503 49 42 59 225 928 499 700Public 1,500 48 40 43 181 606 290 291Private ... . ......... ... 1,003 1 2 16 44 322 209 409
Elementary. 1 to 8 years 10,527 250 491 385 1,171 4,033 2,010 2,1859,146 242 474 359 1,096 3,576 1,675 1,723
Private... ... ...... 1,381 8 17 26 75 457 335 462High school, 1 to 4 years... ...... 5,250 113 204 205 575 2,046 976 1,131
public 4,694 108 196 187 539 1,873 845 946Private 55o 5 8 18 36 173 131 185
College, full time 2.268 22 42 38 140 714 501 81"Public 1,656 22 35 30 110 536 394 528Private 612 - 7 8 30 178 107 287
College, part time 407 2 8 11 44 161 84 07Public 346 2 6 9 41 136 76 77Private . .... .......
lot enrolled.
3 to 13 years old
61
1,855
-
43
2
66
2
84
3
285
25
785
8
310
20
28114 to 34 years old 4,124 178 214 320 584 1,731 558 540Not high school graduate.... 719 96 72 90 144 217 67 35
14 to 24 years ole.e.... .... . 508 67 38 54 106 162 50 3125 to J4 years old 211 29 33 36 38 55 lb 4
High school graduate 3,405 82 142 231 440 1,515 492 505No college 2,199 68 111 190 337 1,040 259 195College, 1 to 3 years 672 11 26 31 68 27] 143 122College, 4 years or more 534 3 5 10 35 204 i") 18?
1ACK
All family members 11,153 383 820 518 2,696 4,266 1,648 822'mrolled. 7,907 218 481 291 1,845 3.152 1,298 622Nursery school and kindergarten 957 18 30 25 224 427 156 79
Public 773 18 28 19 204 353 110 42Private 184 - 2 6 18 74 46 37
Elementary, 1 to 8 years 4,299 124 281 151 1,013 1,751 683 297Public 4.124 124 277 151 983 1,692 631 266Private 175 - 4 - 30 59 52 31
High school, 1 to 4 years 2,019 57 134 75 543 747 320 143Public 1,96d 55 131 73 530 726 310 138Private 56 2 3 2 13 21 10 5
College, full time , 519 15 30 37 48 177 120 91Public 432 14 25 30 39 151 98 74Private 87 1 5 7 9 26 22 17
College, part time 113 2 6 4 19 50 19 13Public 104 2 6 4 17 44 18 13Private
lot enrolled.
3 -0 13 years old
9
711
-
12
-
43
-
40
2
178
6
306
1
88 4314 to 34 years old 2,536 153 296 186 673 809 262 157Not high -chool graduate 702 67 95 73 228 175 46 17
14 to 24 years old 463 27 47 48 153 144 38 523 to 34 years old 239 40 47 26 75 31 8 12
High school graduate 1,834 85 202 113 444 632 217 141Fo college 1,359 57 160 89 366 485 141 61College, 1 to 3 years 363 25 27 18 61 111 66 55College, 4 years or more 112 3 15 6 17 36 10 25
See footnote at end of table.

33
Table 11. Enrollment Status of Primary Family Members 3 to 34 Years Old by EducationalAttainment of Family Householder, Level and Control of Schoc!, Sex, Race, andHispanic Origin: October 1985-Continued
(Numbers in thousands. Civilian noninstituticnal population. Excludes persons in families in which the householdersare members of the ArmedForces. Also excludes family members who arc family householders and family members who are married, spouse present. For meaning of symbols,see text)
Level and control of schoolenrollment status, sex, race,and Hispanic origin
Total
Years of school completed by family householder
Elementary school High school College
0 to 4years
5 to 7years
8
years
1 to 3years
4years
1 to 3
years1 yearsor more
BLACK-Continued
Percent distributionEnrc.led
Nursery school and kindergartenPublic
PrivateE'ementary, 1 to 8 years
Public
PrivateHigh school, 1 to 4 years
Public
Private
College, full timePublicPrivate
College, part timePtolic
Private
Not enrolled-3 to 13 years old14 to 34 years old
Not high school graduate14 to 24 years old25 to 34 years old
High school graduateNo collegeCollege, 1 to 3 yearsCollege, 4 years
Hale membersEnrolled
Nursery school and kindergartenPublic
Private
Elementary, 1 to 8 yearsPublic
PrivateHigh school, 1 to 4 yearsPublic
PrivateCollege, full timePublic
PrivateCollege, part time
Public
Private
lot enrolled.3 to 13 years old14 to 34 years old
Not high school graduate14 to 24 years old
25 to 34 years oldHigh school graduateNo collegeCollege, 1 to 3 yearsCollege, 4 years or more
Female membersEnrolled
Nursery school and kindergartenPublic
Private
Elementary, 1 to 8 yearsPublic
Private1 'eh school, 1 to 4 years
voteLL. ee, full time
,N.t"c
44AvateCollege, part time
PublicPrivate
Not enrolled.3 to 13 years old14 to 34 years old
Not high school graduate14 to 24 years old25 to 34 years old
High .chool graduateNo collegeCollege, 1 to 3 yearsCollege, 4 years or more
See footnote at end of table.
100.0
100.0100.0
100.0100.0
100.0100.0
100.0100.0100.0
(B)
100.0100.0100.0100.0100.0
,B)
100.0
100.0100.0100.0100.0100.0100.0
100.0100.0
5,7413,960
44637076
2,1902,106
84
1,0371,009
28
25521441
32
27
5
3.4
2.81.92.4
7.9
3.0
2.84.2(B)
2.93.31.4
1.82.3(3)
1.76.09.65.916.6
4.64.27.02.7
213118
6
6
74
74
34
34
44
401 6
1,380 88455 46287 14
168 32
925 42715 37177 3
2
5,4123,947
512404
1082,1102,018
92
98295428
263217
46
81
76
5
3091,156
248176
72
909644186
79
17010012
12
5050
24222
11
10
1
2
2
6
652113
8
442023
1
7.46.13.13.61.4
6.56.72.3
6.6
5.7(B)
5.85.86.05.35.6(B)
6.111.7
13.510.2
19.811.011.87.3
13.3
42325211
11
153
153
68671
19
19
1
1
16
155603030947115
8
39722919
17
2
127
1234
66642
116
5
S
5
27
14134
17
17
107
8812
7
4.63.7
2.62.5
3.3
3.53.7
3.7
3.1
(B)7.1
6.97.6
3.53.9
(B)
5.77.3
10.410.310.7
6.26.6
4.95.7
259149
9
6
3
75
75
4141
21
16
5
3
3
13
9647
3116
4939
10
259142
17
13
4
76
76
35
33
2
1513
2
1
1
27
9026
17
10
63
50
7
6
24.223.323.226.4
9.623.6
23.817.0
26.923.8(B)
9.29.110.5
16.816.8(B)
25.126.532.533.131.5
24.226.916.9
15.1
1,315921123118
5
50248418
275269
6
16
13
3
4
3
1
103351149
9950202
17923
1,3229259886
49911
268261
7
3226
6
16
15
1
75
32280
54
25
243187
39
17
38.2
39.9
44.645.640.540.741.033.637.0
36.9(B)
34.1
35.029.844.242.2(B)
43.031.925.031.2
13.134.535.7
30.732.5
2,2291,598
192
16329
91688630
38937712
887414
12
10
2
18244911085
26
33926858
13
2,0371,554
235190
45
83480628
357
349
8
8877
11
38
34
4
12435965
606
29521853
24
14.8
16.4
16.3
14.2
25.2
15.9
15.3
29.6
15.818.0
(B)
23.1
22.824.9
16.8
16.9
(B)
12.4
10.3
6.68.2
3.4
11.8
10.3
18.2
8.7
842
6336042
18
344
316
28
167
161
6
58
49
9
4
3
1
S7
153
30
25
5
12383
37
3
80666596
6828
339
3:5
24
153
148
5
6350
13
15
15
31
110
16
13
3
93
58
29
6
7.47.9
8.3
5.4
20.1
6.9
6.517.57.1
8.4
(B)
17.517.1
19.811.5
12.3
(8)
6.0
6.22.41.2
4.9
7.7
4.515.122.0
401
289
4524
21
123
117
6
63
60
3
49
39
10
8
8
24
88
12
4
8
76
38
31
7
421333
34
18
16
173
149
24
79
78
1
4235
7
4
4
19
70
5
2
3
6423
24
17

34
Table 11. Enrollment Status of Primary Family Members 3 to 34 Years Old by EducationalAttainment of Family Householder, Level and Control of School, Sex, Race, andHispanic Origin: October 1985-Continued
(Numbers in thousands. Civilian noninstitutional population. Excludes persons in families in which the householders are member- of the ArmeuForces. Also excludes family members who are family householders and family members who are married, spouse present. For meaning of symbols,see text)
revel and control of schoolenrollment status, sex, race,and Hispanic origin
Total
Years of school completed by family householder
Elementary school High school College
0 to 4years
5 to 7
years8
years1 to 3years
4
years1 to 3years
4 yearsor more
HISPANIC ORIGIN'
All family members 6,603 1,043 1,273 583 1,106 1,542 673 383Enrolled. 4,790 715 913 434 782 1,096 542 307Nursery school and kindergarten 532 86 83 45 89 132 67 30
Public 420 81 81 37 79 84 44 14Private 112 5 2 8 10 48 23 16
Elementary, 1 to 8 years 2,797 419 582 272 452 610 303 159Public 2,602 411 564 264 421 544 269 128Private 195 8 18 8 31 66 34 31
High school, 1 to 4 years 1,112 182 201 102 178 265 118 66Public 1,045 176 194 93 168 249 110 55Private 67 6 7 9 10 16 8 11
College, full time ....... .... 277 26 32 6 53 69 46 46Public 221 21 32 2 40 51 44 31Private 56 5 4 13 18 2 15
College, part time 72 3 15 9 10 20 8 7Public 58 1 11 9 8 16 8 5Private
got enrolled.
3 to 13 years old
14
638
2
94
4
125 40
2
139
4
157 49
2
3414 to 34 years old 1,174 234 235 109 185 289 81 42
Not high school graduate 448 125 129 42 60 70 16 414 to 24 years old 320 94 87 19 45 55 15 425 to 34 years old 128 31 42 23 16 15 1
High school graduate 726 109 106 67 124 218 65 38No college 523 86 78 55 83 167 30 17College, 1 to 3 years 149 21 25 10 34 30 19 10College, 4 years or more 54 2 3 2 7 21 8 11
Percent distribution 100.0 15.8 19.3 8.8 16.7 23.4 10.2 5.8'Enrolled 100.0 14.9 19.1 9.1 16.3 22.9 11.3 6.4Nursery school and kindergarten 100.0 16.2 15.6 8.5 16.7 24.8 12.6 5.6
Public 100.0 19.3 19.3 8.8 18.9 20.0 10.5 3.3Private 100.0 4.4 2.0 7.1 9.2 43.: 20.2 13.9
Elementary, 1 to 8 years 100.0 15.0 20.8 9.7 16.2 21.8 10.8 5.7Public 100.0 15.8 21 7 10.1 16.2 20.9 10.3 !...9Private 100.0 3.9 9.0 4.2 15.9 34.0 17.3 1_.7
High school, 1 to 4 years 100.0 16.4 18.1 9.2 16.0 23.8 10.6 5.9Public 100.0 16.9 18.0 8.c 16.1 23.8 10.5 5.2',fixate 81 B) B) B, B) 8) B1 (B)
College, full time 100.0 9.4 11.6 2.2 19.1 24.9 16.6 16.6Fublic 100.0 9.5 14.5 1.1 17.9 23.2 19.9 13.9Private ,g, B) B, B) gl 81 B1 13)
College, part time B) B B) (5) B) S BI (B)Public 8, 81 B) 13) B 8) 8) 8)Private
got enrolled.
3 to 13 years old
B
100.0
81
14.7
81
19.5
B)
6.3 21.7
B)
24.6
gl
7.7
'13)
5.414 to 34 years old 100.0 14.9 20.0 9.3 15.7 24.6 6.9 3.5Not 'Ugh school graduate
14 to 24 years old100.0100.0
28.0
29.528.9
27.3
9.4
6.013.514.1
15.7,
17.3
3.6
4.70.81.2
25 to 34 years old 100.0 24.3 32.9 17.9 12.1 11./ 1.0 -High school graduate 100.0 15.0 14.6 9.2 17.1 30.0 t,.0 5.2
No college 100.0 16.3 14.9 10.5 15.8 31.9 7.3 3.3College, 1 to 3 years 100.0 13.9 16.7 6.4 23.1 20.4 12.8 6.7College, 4 years or more B B, B) B) 8) B) Br B)
1May be of any race.
4 r.t:,

TaL,a 12. College Attendance of Primary Family Members 18 to 24 Years Old, by Family Income, 35
Race, and Hispanic Origin:' October 1985(Numbers in thousands. Civilian noninstitutional population. Excludes families in which the householders are members of the Armed Forces.
For meaning of symbols, see text)
Families, race, and Hispanic origin
Total
Family income
Under
$10,000$10,000 to
$19,999$20,000 to
$29,999$30,000 to
$39,999$40,000 to
$49,999$50,300tnd over
Not
reported
PRIMARY FAMILIES
All families 63,750 11,187 15,158 12,277 9,834 5,208 7,228 2,857
No meeer 18 to 24 years old' 51,581 9,059 12,830 10,255 7,818 4,019 5,301 2,298
A". ,r more members 18 to 24 years old' 12,169 2,127 2,327 2,021 2,016 1,188 1,927 558
None attending college full time /,901 1,837 1,781 1,340 1,174 577 861 330
One or more attending college full time 4,268 290 546 681 842 611 1,013 228
One member 18 to 24 years old 9,139 1,772 1,779 1,535 1,493 863 1,275 422
Not attending college full time 6,364 1,564 1,412 1,062 949 464 659 254
Attending college full time 2,775 208 367 473 54,. 395 616 168
Two or more members 18 to 24 years old 3,030 355 548 486 523 325 652 136
None attending college full time 1,537 273 369 278 225 113 202 76
One attending college full timo 837 53 103 132 167 115 228 37
Two or more attending college full titan 656 29 76 76 131 97 222 23
White families 54,970 8,052 12,780 10,981 8,955 4,804 6,814 2,585
No member 18 to 24 years old' 45,088 6,796 11,063 9,273 7,164 3,721 4,970 2,100
One or more member 18 to 24 years old' 9,882 1,255 1,717 1,707 1,732 1,083 1,844 486
None attending college full time 6,184 1,078 1,'23 1,119 1,045 523 825 273
One or more attending college full time 3,69C 177 ;94 588 747 560 1,019 213
One member 18 to 24 years old 7,448 1,064 1,351 1,304 1,354 784 1,220 369
Not attending college full time 5,045 936 1,069 908 867 423 630 211
Attending college full time 2,403 128 282 396 487 361 590 158
Two or more members 18 to 24 years old 2,434 191 366 403 438 299 624 117
None attending college full time 1,139 142 254 211 178 100 195 62
One attending college full time 720 31 60 123 145 111 219 32
Two or more attending college full tine 575 18 52 69 115 88 210 23
Black families 7,181 2,797 2,007 1,024 635 286 217 217
No member 18 to 24 years old' 5,'06 1,992 1,458 754 462 212 174 154
One or more members 18 to24 years old2 1,973 805 549 269 173 73 41 63
None attending college full time 1,540 710 423 19' 102 43 19 47
One or more attending college full time 433 95 126 7 71 30 22 16
One member 18 to 24 years old . 1,462 653 385 155 103 54 28 44
Not attending college full time 1,173 582 314 135 62 33 13 34
Attending college full time 289 71 71 60 41 21 15 10
Two or more members 18 to 24 years old 511 152 164 74 70 19 13 19
None attending college full t... 367 128 109 60 40 10 6 13
One attending college full time 92 14 40 9 18 - 5 6
Two or more attending college full time ...... ... 52 10 15 5 12 9 2
Hispanic origin families3. 4,33? 1,359 1:317 754 456 170 189 88
No members 18 to 24 years old' 3.365 1,075 1,026 600 343 134 127 61
One or more members 18 to 24 years old' 966 284 290 153 113 36 62 27
None attending college full tire.. ... ......... 739 245 224 121 64 22 38 24
One or more attending colle6a toll tits, 227 39 66 32 49 14 24 3
One member 18 to 24 years old. 668 229 184 100 75 23 38 19
Not attending college full ,43e 551 210 152 88 44 16 25 16
Attending college full time 117 19 32 12 31 7 13 3
Two or more members 18 to 24 yeors old 298 55 106 53 38 13 24 8
None attending college full tine 188 35 72 33 20 6 13 8
One attending college full time 74 14 20 14 14 5 6
Two or more attending college full time 36 6 14 6 4 2 5 -
PERCENT DISTRIBUTION
All families with- -
One or more members 18 to 24 years old' 100.0 100.0 100.0 100.0 100.0 100.0 100.0 100.0
None attending college full time 64.9 86.4 76.5 66.3 58.2 48.6 44.7 59.1
One or more attending college full time 35.1 13.6 23.5 33.7 41.8 51.4 55.3 40.9
One attending college full time 29.7 12.3 20.2 29.9 35.3 43.3 43.8 36.7
Two or more attending college full time 5,4 1.4 3.3 3.8 6.5 8.2 11.5 4.1
White families with- -One or more members 18 to 24 years old2 100.0 100.0 )00.0 100.0 100.0 100.0 100.0 100.0
None attending college full time 62.6 85.9 77.1 65.6 58.3 48.3 44.7 56.2
One or more attending col:age fu' ime 37.4 14.1 22.9 34.4 41.7 51.7 55.3 43.8
One attending college full time 31.6 12.7 19.9 30.4 35.3 43.6 43.9 39.1
Two or more attending college full tine 5.8 1.. 3.0 4.0 6.4 8.1 11.4 4.7
Black families with- -One or more members 18 to 24 years old2 100.0 100.0 100.0 100.: 100 '8) ;13) '8)
None attending college full time 78.1 88.2 77.0 72.5 59. (B) B) 03)
One or more attending college full time... 21 9 11.8 23.0 27.5 41.0 (B) 11) 'B)
One attending college full tine 19.3 10.6 20.2 25.7 34.1 (B) (B) 8)
Two or more attending college full time 2.6 1.2 2.7 1.9 6.9 (B) (8) ,g)
Hispanic origins families with- -
One or more members 18 to 24 years old2 100.0 100.0 100.0 10C.0 100.0 (B) ,11) 03)
None attending college full time 76.5 E5.3 77.2 79.1 56.6 (B) (B) (8)
One or more attending college full time 23.5 13.7 22.8 20.9 43.4 (B) (B) (B)
One attending college full time 19.8 11.6 17.9 17.0 39.8 (B) fg) B)
Two or more attending college full time ...... 3.7 2.1 4.8 3.9 3.5 (B) ,B) '8)
'Includes families with no member 18 to 24 years old and those in which the only member 18 to 24 years old are the family houreholder, or
other members who are married, spouse present.=Excludes families in which the only members 18 to 24 years old are the family householders, or other members who are married, spouse
present.
3May be of any race.

26Table 13. Primary Family Members 18 to 24 Years Old by Family Income, Lnrollment Status,
Control of School, Marital Status, Sex, Race, and Hispanic Origin:Octo;., -a. 1985(In thauSands. Civilian noninstitutional populction. Excludes persons in families in which the householders are members of the Armed Forces.For meaning of symbols, see text)
Level of educatf.n, enrollmentstatus, sex, marital status,
race, and Hispanic originTotal
Family income
Under
$10,000$10,000 to
$19,999$20,000 to
$29,999$30 000 to
439,999$40,000 to
$49,999$50,000and over
Notreported
ALL RACES
Married, Spou-m Present
Male 2,189 554 821 471 216 61 42 25Enrolled 194 48 79 31 20 8 5 3Below college 5 3 2 1 - -College 188 45 78 30 19 8 5 3Full time 125 40 59 11 5 4 4 3Public 97 31 48 6 5 4 1 3Private 28 9 11 5 - 3 -Part time 63 5 19 19 14 4 1Public 49 5 16 13 10 4 -Private 14 3 6 4 1 -
Not enroll, 1,995 506 742 440 196 53 36 22Not high school graduate 502 227 183 56 18 8 4 5High school graduate 1,494 278 559 383 178 44 33 17No college 1.078 230 428 254 106 31 21 8College, 1 to 3 years 276 43 102 73 43 2 5 6College, 4 years or more 140 5 29 56 29 11 7 3
Female 4,074 859 1,471 968 455 126 124 73Enrolled 293 70 83 77 40 11 9 8Be.ow college 31 17 7 2 2 2 -College 267 53 77 75 38 12 7 7Full time 148 44 42 35 13 6 4 6Public 121 35 33 28 13 4 3 6Private 27 9 9 7 2 1 -Prrt time 119 9 35 40 25 6 3 1Public 107 9 33 34 25 2 3 1Private 12 2 6 4 -
Not enrolled 3,776 789 1,388 890 415 115 113 65Not high school graduate 762 349 276 78 41 13 1 7Hign school graduate 3,015 440 1,111 813 375 105 111 58No college 2,135 356 876 524 221 58 52 45Co'lege, 1 to 3 years 619 61 170 212 103 29 34 10Collage, 4 years or more 261 21 65 /7 51 18 25 3
Other Marital Status
Male 8,642 1,06u 1,675 1,523 1,444 923 1,591 420Enrolled 3,496 302 486 527 653 471 882 175Below college 548 129 125 89 80 46 62 20Colle'e 2,949 174 362 439 574 425 821 155Fu . time 2,601 146 302 387 500 379 748 140.ubtic 1,994 121 256 305 380 283 553 97Private 607 25 46 82 120 96 195 43Parr time 348 28 60 52 74 46 73 15Public 302 23 51 48 66 40 62 12Private 46 5 9 4 8 6 11 3Not enrolled 5,146 764 1,189 996 791 451 709 245Not high school graduate 1,166 350 341 213 126 36 47 52High school graduate 3,980 414 848 782 665 415 662 193No college 2,975 363 714 627 474 279 369 148College, 1 to 3 years 711 38 101 113 13, 101 184 35College, 4 years or more 294 13 33 42 52 35 109 10
Female 7,537 1,563 1,371 1,129 1,229 704 1,242 30(Enrolled 3,240 330 486 492 648 399 732 153Below college 335 98 92 44 39 16 28 17College 2,904 232 394 449 610 383 704 136Full time 2,493 185 343 383 504 352 612 115Public 1,849 153 27O 300 389 244 410 83Private 644 32 7: 83 115 108 202 32Part time 411 47 51 66 106 31 92 21Public 351 39 45 57 95 28 74 18Private 'o 8 6 9 11 3 18 3Not enrolled 4,297 1,233 8b3 6s6 581 305 510 147Not high school er.auate ...... 835 507 156 77 43 24 15 12High school F.eduate 3,462 725 7, 559 539 280 495 136No college 2,471 625 56, 402 356 178 257 90College, 1 to 3 years 651 91 121 107 126 64 114 29College, 4 years or more 540 9 44 50 57 38 124 17
See footnote at end of table.

37
Table 13. Primary Family Members 18 to 24 Years Old hy Family Income, Enrollment Status,Control of School, Marital Status, Sex, Race, and hispanic Origin: October1985-Continued
kIn thousands. Civilian noninstitutional population. Excludes persons in families in which the householders are members of the aimed Forces.
For meaning of symbols, see text)
Level of education, enrollmentstatus, sex, marital status,race, and Hispanic origin
Total
Family income
Under
$10,000
$10,000 to
$19,999$20,000 to
;,'29,999
$30,000 to
$39,999$40,000 to
$49,999$50,000and over
Notreported
WHITE
Married, Spouse Present
Male 1,952 470 738 433 201 52 35 23
Enrolled 169 41 66 27 20 6 5 3
Below college 5 3 2 1 -
College 163 38 64 27 19 6 5 3
Full time 103 33 49 8 5 2 4 3
Public 79 24 38 6 5 2 1 3
Private 24 9 11 2 3
Part time 60 5 15 19 14 4 1
Public 46 5 12 1:, 10 4 -
Private 14 3 6 4 1
Not enrolled 1,783 429 672 406 181 46 30 20
Not high school graduate 446 203 160 53 18 S 4 4
High school graduate 1,338 226 512 352 162 40 27 17
No college 957 181 395 227 103 27 15 8
College, 1 to 3 years 248 40 91 69 34 2 5 6
College, 4 years or more 133 5 26 56 25 11 7 3
Female 3,588 712 1,277 888 411 121 114 65
Enrolled 262 52 80 ;0 33 11 9 6
Below college 25 14 7 2 2 -
College 236 39 74 68 33 12 7 6
Full time 131 34 40 35 8 6 4 6
Public 107 27 31 28 8 4 3 6
Private 24 7 9 7 2 1
Part time 10'.: 5 34 33 25 6 3
Public 97 5 32 30 25 2 3
Private 8 - 2 3 4 -
Not enrolled 3,327 659 1,197 818 378 110 105 59
Not high school graduat. 663 302 232 74 37 10 1 7
High school graduate 2,664 357 966 744 342 100 103 53
No college 1,898 291 774 488 202 54 49 41
College, 1 to 3 years 537 55 135 186 93 29 29 10
College, 4 years or more 229 11 57 70 47 17 25 2
Other Maritel Status
Male 7,140 668 1,228 1,256 1,274 835 1,521 358
Enrolled 2,962 175 323 451 594 421 843 157
Below college 384 58 76 66 66 42 62 16
College 2,579 117 248 386 530 379 781 140
Full time 2,275 97 207 339 460 340 708 125
Public 1,720 77 167 266 351 249 525 85
Private 555 20 40 73 109 91 183 40
Part time 304 20 41 47 70 39 73 15
Public 263 16 34 43 62 35 62 12
Private 41 4 7 4 8 4 11 3
Jot enrolled 4,178 493 905 80. 681 414 679 202
Not high school graduate 895 215 269 184 106 36 45 38
High school graduate 3,283 278 636 621 575 377 634 164
No college 2,423 243 540 503 401 258 355 123
College, 1 to 3 years 597 29 71 84 123 87 173 31
College, 4 years or more 263 6 25 34 51 32 106 10
Female 5,874 844 952 934 1,076 631 1,178 258
Enrolled 2,682 182 325 411 546 373 698 147
Below college 223 52 47 31 33 16 27 16
College 2,460 131 277 381 512 357 671 131
Full time 2,142 107 252 324 431 3;.7 587 115
Public 1,559 85 192 251 329 225 395 83
Private 583 22 60 73 102 102 192 32
Part time 318 24 25 57 81 30 84 16
Public 267 19 22 48 70 28 66 13
Private 51 5 3 9 11 2 18 3
Not llirclled 3,192 662 623 523 530 .;8 480 111
Not high school graduate 561 290 127 66 34 i9 15 11
High school graduate 2,631 372 502 45'+ 496 240 465 99
No college 1,826 309 396 329 333 157 237 65
College, 1 to 3 years 506 58 68 88 114 50 110 19
College, 4 years or more 299 5 38 41 49 33 118 15
See footnot at end of table.

38
Table 13. Primary Family Members 18 to 24 Years Old by Family Income, Enrollment Status,Control of School, Marital Status, Sex, Race, and Hispanic Origin: October1985Continued
(In thousands. Civilian noninstitutional population. Excludes persons in families in which the householders are members of the Armed Forces.For meaning of symbols, see text)
Level of education, enrollmentstatus, sex, marital status,race, and Hispanic origin
Total
Family income
Under
$10,00010,000 to
$19,999$20,000 to
$29,999$30,000 to
$39,999$40,000 to
$49,999150,000and over
Notreported
BLACK
Harried Spouse Present
Male 184 67 64 28 14 2 6 1Enrolled 13 2 9 - --Below vIllege -
-- -College 13 2 10 - -Full time 9 2 6 2 - -Public 9 2 6 - -Private - --
Part time 4-Public 4 - -Privat- - -
- -
Not enrolled 171 65 54 28 14 1 6 1Not high school graduate 38 22 11 3 - - 1Hign school graduate 133 44 43 25 14 1 7 -No college 104 40 32 23 3 1 6College, 1 to 3 years 24 4 P 2 9 1 -College, 4 years or more 5 3 - 2 -
Female 353 115 132 60 38 1 5 2Enrolled 24 10 1 5 7- 1Below college 4 2 - 2
College 18 7 1 5 4 - 1Full time 12 7 1 4 -Public 10 5 1-Private 2 - -
Part time 6 - 5- 1PuAic 5 - 4 - 1Private 1 - 1 - -
Not enrolled 330 105 131 55 31 1 5 1Not high school graduate 61 35 19 3 4 - -High school graduate 268 69 111 52 27 1 6 1No college 178 55 72 30 16 1 3 1College, 1 to 3 years 70 5 32 22 8 3College, 4 years or more 20 9 7 - 3 - -
Other Marital Status
Male 1,275 358 396 228 136 64 40 53Enrolled 414 108 135 59 42 33 20 ;',Below college 145 64 46 20 10 2 - 3College 268 42 88 39 31 31 20 15Full time 244 37 79 38 28 26 20 15Public 206 33 73 31 18 24 15 12Private 38 4 6 7 10 2 5 3Part time 24 5 9 1 3 5 -Public 23 4 9 1 3 5 .-Private
1 1 - - - --
Not enrolled 861 251 261 169 94 31 20 35Not high school graduate 242 123 69 25 15 - - 11High school graduate 619 128 192 145 80 31 20 24No college 5J5 14 159 114 68 18 13 20College, 1 to 3 years 99 7 28 28 12 13 7 4College, 4 years or more 15 7 5 3 - - - .
Female 1,451 672 386 167 111 53 25 36Enrolled 426 124 137 65 67 15 14 5Below college 100 39 42 13 5 - - -College 327 84 95 52 61 16 14 5Full time 253 69 72 45 45 15 6Public 206 59 62 ?6 32 12 4 -Private £.7 10 10 10 13 3 2 -Part time 74 15 23 6 16 1 8 5Public 69 13 21 6 16 - 8 ..Private 5 2 2 - 1 - .
Not enrolled 1,026 549 249 103 45 37 11 31Not high school graduate 253 205 28 9 4 5 - IHigh school graduate 772 343 221 94 39 32 11 3(No college, 610 309 162 69 22 17 11 2CCollege, 1 to 3 years 133 30 52 18 10 12 - gCollege, 4 years or more 29 4 7 7 7 3 11
See footnote at end of table.

39
Table 13. Primary Family Members 18 to 24 Years Old by Family Income, Enrollment Status,Control of School, Marital Status, Sex, Race, and Hispanic Origin: October1985Continued
In thousands. Civilian noninotitutional population. Excludes persons in families in which the householders are members of the Armed Forces.
For meaning of symbols, ale text)
Level of education, enrollmentstatus, sex, marital status,race, and Hispanic origin Total
Family incort
Under
$10,000$10,000 to
$19,999
$20,000 to
$29,999
$30,000 to$39,999
140,000 to
$49,999$50,000and over
Not
reported
HISPANIC ORIGIN'
Married, Spouse Present
Male 250 91 84 40 12 10 7 5
Enrolled 13 3 8 2
Below collegeCollege 14 3 8 2
Full time.. 14 3 8 2
Public 9 1 6 2
Private 5 2 2
Part timePublicPrivate
Not enrolled 237 88 76 40 2 10 7 3
Not high school graduate 100 55 26 13 4 2
High school graduate 137 33 49 27 8 10 5 3
No college 98 28 32 16 8 10 2
College, 1 to 3 years 34 5 17 11 1
College, 4 years or more 5 - 2 3
Female 346 128 117 62 25 7 6 1
Enrolled 20 6 7 6 - 1
Below college - -
College. 20 6 7 1
Full time 9 4 4 1
Public 9 4 4 1
Private - - - -
Part time 11 2 7 2
Public 9 2 7
Private 2 - 2 -
Not enrolled 327 122 111 56 25 7 6
Not high school graduate 131 70 39 16 5 -
High school graduate 196 52 72 40 21 7 6
No college 148 41 53 37 13 4 -
College, 1 to 3 years 37 9 16 3 3 3 4
College, 4 years or more 11 2 3 5 2
Other Marital Status
Male 685 157 251 131 66 23 37 19
Enrolled 202 47 73 35 26 3 17 1
Below _ollege 66 23 27 10 6 - -
College 136 24 46 25 21 3 17 1
Full time 97 20 31 17 17 - 13
Public 80 16 26 13 12 - 13
Private 17 4 5 4 5 - -
Part time 39 4 15 8 4 3 4 1
Public 29 3 8 8 2 3 4 1
Private 10 1 7 2 - -
Not enrolled 482 110 178 96 40 20 20 18
Not high school graduate 204 63 72 38 15 7 2 7
High school graduate 279 47 106 57 25 13 19 11
No college 227 45 90 52 14 4 14 7
College, 1 to 3 years 40 2 14 3 8 7 3 4
College, 4 years or more 12 - 2 2 3 2 2
Female 626 197 176 76 84 15 66 11
Enrolled 237 51 83 29 42 7 23 2
Below college 57 24 14 9 7 - J
College 179 26 69 20 35 7 20 2
Full time 154 25 57 18 29 7 17 2
Public 122 23 41 16 20 7 13 2
Private 32 2 16 2 9 - 4
Part time 25 1 12 2 6 3
Public 21 1 12 2 2 3
Private 4 - 4 - -
Not enrolled 389 147 93 47 42 8 44 9
Not high school graduate 137 85 23 12 5 2 9 2
High school graduate 251 62 70 35 38 6 35 7
No college 176 44 52 26 25 6 18 7
College, 1 to 3 years 52 18 9 7 9 - 9
College, 4 dears or more 23 9 2 4 8
'May be of any race.

40
Table 14. Primary Family Members 3 to 17 Years Old by Family Income, Enrollment Status, Leveland Control of School, Sex, Race, and Hispanic Origin: October 1985
(Numbers in thousands. Civilian noninstitutional population. Excludes persons enrolled in college. For meaning of symbols, see text)
Level and control of school,enrollment status, age, sex,race, and Hispanic origin
Family Income
TotalUnder
$10,000$10,000 to
$19,999$20,000 to
$29,999$30,000 to
$39,000$40,000 to
$49,999$50,000and over
Not
repotted
PRIMARY FAMILY MEMBERS
All Races
Male 26,293 5,057 5,942 5,345 4,210 2,107 2,785 847Enrollee below college 23,383 4,210 5,167 4,762 3,858 1,989 2,627 771
Nursery school and kindergarten 3,196 552 760 629 578 253 335 91Public 2,103 501 606 387 314 111 136 49Private 1,093 51 154 242 264 142 199 42
Elementary, 1 to 8 years 13,750 2,765 3,201 2,798 2,208 1,031 1,350 397Public 12,212 2,649 2,955 2,434 1,881 875 1,074 344Private 1,538 116 246 364 327 156 276 53
High school, 1 to 4 years 6,437 893 1,207 1,336 1,073 704 942 283Public 5,889 868 1,156 1,253 972 601 781 259Private 548 25 51 83 1GL 103 161 24
Not enrolled 2,910 847 775 583 353 118 158 753 to 13 years old 2,586 728 714 526 320 112 127 5914 to 17 years old 324 119 61 57 32 7 31 16High school graduate 39 10 6 9 7 7 -Not high school graduate 285 109 55 48 26 7 24 18
Female 25,076 5,025 5,514 5,125 3,919 1,950 2,695 848Enrolled below college 22,474 4,299 4,757 4,588 3,637 1,823 2,583 787
Nursery school and kindergarten 3,115 624 637 684 501 240 359 69Public 1,977 551 469 395 265 117 143 37Private 1,138 73 168 289 236 123 216 32
Elementary, 1 to 8 yeart 13,164 2,762 2,968 2,667 2,024 982 1,360 399Public 11,640 2,639 2,741 2,353 1,710 816 1,048 332Private 1,524 123 227 314 114 166 312 67
High school, 1 to 4 years 6,195 913 1,151 1,237 1,111 601 865 318Public 5,613 886 1,085 1,147 991 529 708 26EPrivate 582 27 66 90 120 72 157 5C
Not enrolled 2,602 725 757 537 282 127 112 613 to 13 years old 2,250 576 688 46 255 116 96 5C14 to 17 years old 352 149 69 69 28 11 16 11High school graduate 66 7 16 17 13 2 8 4Not high school graduate 287 142 53 51 15 10 8 7
White
Male 21,382 3,050 4,648 4,692 2,754 1,922 2,573 743Enrolled below college 19,048 2,480 4,022 4,176 3,450 1,815 2,426 675Nursery school and kindergarten 2,647 326 600 565 526 235 310 8:
Public 1,665 282 477 348 234 105 127 42Private 982 44 123 217 242 130 183 41
Elementari, 1 to 8 years 11,070 1,625 2,487 2,464 1,980 930 1,241 342Public 9,675 1,533 ',277 2,129 1,680 778 988 285Private 1,395 92 210 335 300 152 253 53
High school, 1 to 4 years... 5,331 529 934 1,146 944 650 873 254Public 4,820 510 887 1,078 849 550 714 232Private 511 19 q7 68 95 100 159 22
Not enrolled 2,334 570 627 516 304 106 147 653 to 13 yearn old 2,072 484 576 464 279 100 120 5C14 to 17 years old 262 86 50 52 25 7 28 15High school gradua.e 32 8 6 7 4 7 -Not high school graduate 230 79 45 45 20 7 20 15
Female 20,2% 3,062 4,310 4,458 3,531 1,720 2,482 727Enrolled below college 18,1t! 2,562 3,676 3,984 3,276 1,599 2,376 675
Nursery school and kindergarten 2,503 340 502 59: 457 217 327 63Public 1,5d0 292 358 347 23S 102 132 31Private 1,003 8 144 250 219 115 195 32
Elementary, 1 to 8 years 10,561 1,683 2,316 2,319 1,833 845 1,234 333Public 9,180 1,578 2,118 2,023 1,540 697 956 265Private 1,381 105 198 296 293 148 278 64
High school, to 4 years 5,085 540 859 1,070 986 537 816 275Public 4,544 516 800 991 873 469 667 23(Private 541 24 59 79 113 68 149 45
Not enrolled 2,141 500 633 473 256 121 106 523 to 13 years old 1,855 381 570 427 231 110 91 44L4 to 17 years old 286 119 63 46 25 11 14 5
High school graduate 46 3 13 8 11 2 6 4Not hie, school eraduate 240 116 50 38 11 10 8 5
See footn tes at end of table.
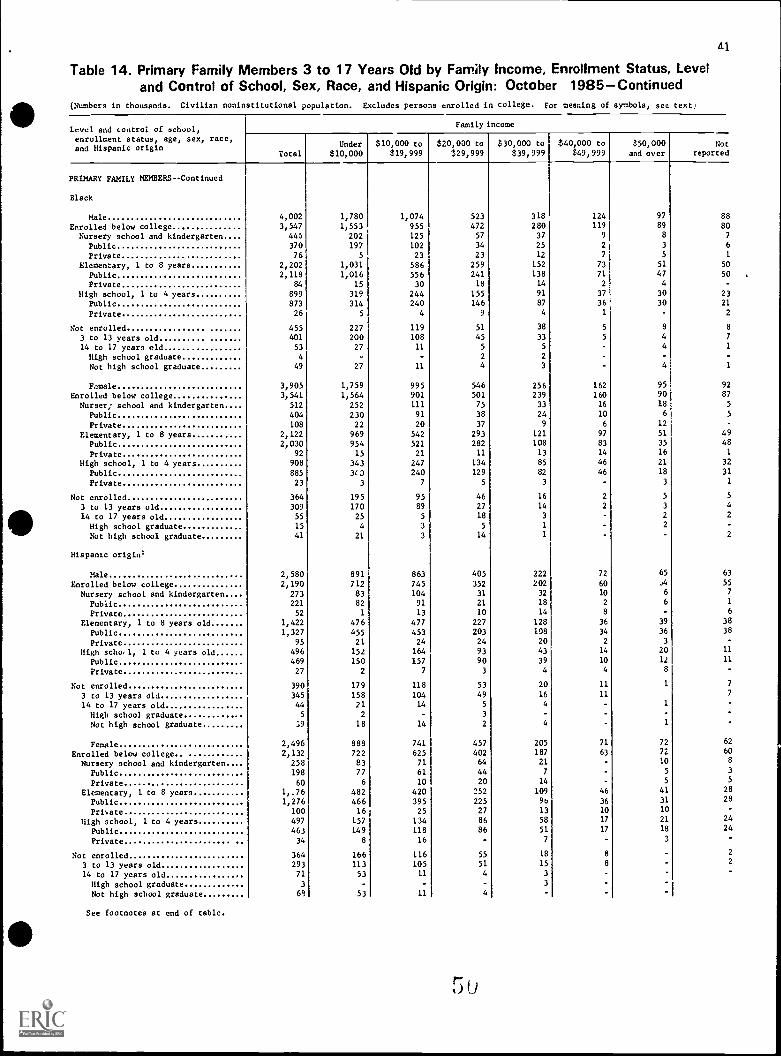
Table 14. Primary Family Members 3 to 17 Years Old by Family Income, Enrollment Status, Level
and Control of School, Sex, Race, and Hispanic Origin: October 1985Continued(Numbers in thousands. Civilian noninstitutional population. Excludes persons enrolled in college. For meaning of symbols: see text,
Level and control of school:enrollment status: age: sex: race,and Hispanic origin
Family income
Total
Under
$10,000$10,000 to
$19,999$20:000 to
$29,999$30,000 to
$39,999
$40,000 to
$49,999$50:000and over
Notreported
PRIMARY FAMILY MEMBERSContinued
Black
Male 4,002 1,780 1,074 523 318 124 97 88
Enrolled below college 3,547 1,553 955 472 280 119 89 80
Nursery school and kindergarten 445 202 125 57 37 9 8 7
Public 370 197 102 34 25 2 3 6
Private 76 5 23 23 12 7 5 1
Elementary: 1 to 8 years 2,202 1,031 586 259 152 73 51 50
Public 2,118 1,016 556 241 138 71 47 Sc
Private 84 15 30 18 14 2 4 -
High school: 1 to 4 years 899 319 244 155 91 37 30 23
Public 873 314 240 146 87 36 30 21
Private 26 5 4 9 4 1 2
Not enrolled 455 227 119 51 38 5 8 E
3 to 13 years old 401 200 108 45 33 S 4 7
14 to 17 years old 53 27 11 5 5 4 1
High school graduate 4 - - 2 2 -
Not high school graduate 49 27 11 4 3 - 4 1
Female 3,905 1,759 995 546 256 162 95 92
Enrolled below college 3,541 1,564 901 501 239 160 90 8;
Nurser; school and kindergarten 512 252 111 75 33 16 18 .
Public 404 230 91 38 24 10 6 .
Private 108 22 20 37 9 6 12 -
Elementary: 1 to 8 years 2,122 969 542 293 121 97 51 4S
Public 2,030 954 521 282 108 83 35 4E
Private 92 15 21 11 13 14 16 ]
High school: 1 to 4 years. 908 343 247 134 85 46 21 32
Public 885 30 240 129 82 46 18 3]
Private 23 3 7 5 3 - 3 ]
Not enrolled 364 195 95 46 16 2 5
3 to 13 years old 309 170 89 27 14 2 3 [
14 to 17 years old 55 25 5 18 3 2
High school graduate 15 4 3 5 1 2 -
Not high school graduate 41 21 3 14 1 2
Hispanic origin'
Male 2,580 891 863 405 222 72 65 6:
Enrolled below college 2,190 712 745 352 202 60 .y4 5!
Nursery school and kindergarten 273 83 104 31 32 10 6
Public 221 82 91 21 18 2 6 I
Private 52 1 13 10 14 8 -
Elementary: 1 to 8 years old 1,422 476 477 227 128 36 39 3E
Public 1,327 455 453 203 108 34 36 3E
Private 95 21 24 24 20 2 3
High scho/1, 1 to 4 years old 496 152 164 93 43 14 20 11
Public 469 150 157 90 39 10 12 1:
Private 27 2 7 3 4 4 8
Not enrolled 390 179 118 53 20 11 1
3 to 13 years old 345 158 104 49 16 11
14 to 17 years old. 44 21 14 5 4 - 1
High school graduate 5 2 3 - -
Not high school graduate ;9 18 14 2 4 - 1
Female 2,496 888 741 457 205 71 72 6:
Enrolled below college 2,132 722 625 402 187 63 72 61
Nursery school and kindergarten 258 83 71 64 21 - 10 1
Public 198 77 61 44 7 - 5
Private 60 6 10 20 14 - S
Elementary: 1 to 8 years 1,.76 482 420 252 109 46 41
Public 1,276 466 395 225 90 36 31 21
Private 100 16 25 27 13 10 10
High school: 1 to 4 years 497 157 134 86 58 17 21 2,
Public 463 149 118 86 51 17 18 2,
Private 34 8 16 7 - 3
Not enrolled 364 166 116 55 18 -
3 to 13 years old 293 113 105 51 15 -
14 to 17 years old 71 53 11 4 3
High school graduate 3 3 -
Not high school graduate 69 53 11 4 -
See footnotes at end of table.
3
3
3
5

42
Table 14. Primary Family Member 3 to 17 Years Old by Family Income, Enrollment Status, Leveland Control of School, Sex, Race, and Hispanic Origin: October 1985-Continued
(Numbers in thousands. Civi!lan noninstitutional population. Excludes persons enrolled in college. For meaning of symbols, sec text)
Level and control of school,
enrollment status, age, sex,race, and Hispanic origin
Family income
TotalUnder
$10,000$10,000 to
$19,999$20,000 to
$29,999$30,000 to
$39,999'4,000 to$49 999
$50 000and over
Not
reported
PERCENT DISTRIBUTION
All Races
Hale 100.0 19.2 22.6 20.3 16.0 8.0 10.6 3.2Enrolled below college 100.0 13.0 22.1 20.4 16.5 8.5 11.2 3.3Nursery school an kindergarten 100.0 17.3 23.8 19.7 18.1 7.9 )0.5 2.8Public 100.0 23.8 28.8 18.4 14.9 5.3 6.5 2.3Private 100.0 4.7 14.1 22.1 24.1 13.0 18.2 3.8Elementar}, 1 to 8 years 100.0 20.1 23.3 20.3 16.1 7.5 9.8 2.9Public 100.0 21.7 24.2 15.9 15.4 7.2 8.8 2.8Private 100.0 7.6 16.0 23.6 21.3 10.1 17.9 3.5High school, 1 to 4 years 100.0 13.9 18.8 20.8 16.7 10.9 14.6 4.4Public 100.0 14.7 19.6 21.3 16.5 10.2 13.3 4.4Private 100.0 4.6 9.3 15.2 18.4 18.8 29.4 4.4Not enrolled 100.0 29.1 26.6 20.0 12.1 4.1 5.4 2.63 to 13 years old 100.0 28.1 27.6 20.3 12.4 4.3 4.9 2.314 to 17 years old 100.0 36.9 18.8 17.6 10.0 2.1 9.6 5.0High school graduate (8) (B) (R) (8) (B) (B) (8) (8)Not high school graduate 100.0 38.3 19.5 16.9 9.0 2.3 8.4 5.6
Female 100.0 20.0 22.0 20.4 15.6 7.8 10.7 3.4Enrolled below college 100.0 19.1 21.2 20.4 16.2 8.1 11.5 3.5Nursery school and kindergarten 100.0 20.0 20.4 22.0 16.1 7.7 11.5 2.2Public 100.0 27.9 23.7 20.0 13.4 5.9 7.2 1.9Private 100.0 6.5 14.7 25.4 20.8 10.8 19.0 2.8Elementary, 1 to 8 years 10 0 21.0 22.5 20.3 15.4 7.5 10.3 3.0Public 1- .0 22.7 2:.6 20.2 14.7 7.0 9.0 2.9Private 1..0.0 8.1 14.9 10.6 20.6 10.9 20.5 4.4High school, 1 to 4 years 100.0 14.7 18.6 20.0 17.9 9.7 14.0 5.1Public 100.0 15.8 19.3 20.4 17.7 9.4 12.6 4.8Private 100.0 4.7 11.4 15.4 20.6 12.4 26.9 8.6',lot enrolled 100.0 27.9 29.1 20.6 10.8 4.9 4.3 2.33 to 13 years old 100.0 25.6 30.6 20.8 11.3 5.2 4.3 2.214 to 17 years old 100.0 42.4 19.6 19.5 7.8 3.1 4.6 3.0High school graduate
(B) (8) (B) (B) (8) (1) (B) (B)Not high school graduate
ihite
100.0 49.7 18.6 17.9 5.1 3.3 2.9 2.4
Hale 100.0 14.3 21.7 21.9 17.6 9.0 12.0 3.5Enrolled below coll. .e 100.0 13.0 21.1 21.9 18.1 9.5 12.7 3.6Nursery school and kindergarten 100.0 12.3 22.7 21.3 19.9 8.9 11.7 3.1Public 100.0 16.9 28.6 20.9 17.1 6.3 7.6 2.5Private 100.0 4.5 12.6 22.2 24.7 13.3 18.7 4.2Elementary, 1 to 8 years 100.0 14.7 22.5 22.3 17.9 8.4 11.2 3.1Public 100.0 15.8 23.5 22.0 17.4 8.0 10.2 3.0Private 100.0 6.6 15.1 24.0 21.5 10.9 18.2 3.8High school, 1 to 4 years 100.0 9.9 17.5 21.5 17.7 12.2 16.4 4.8Public 100.0 10.6 18.4 22.4 17.6 11.4 14.8 4.8Private 100.0 3.8 9.2 13.3 18.7 19.5 31.2 4.3Not enrolled 100.0 24.4 26.8 22.1 13.0 4.6 6.3 2.83 to 13 veers old 100.0 23.3 27.8 22.4 13.5 4.8 5.8 2.414 to 17 years old 100.0 33.0 19.2 19.7 9.4 2.5 10.5 5.7High school graduate (8) (8) (B) (B) (B) (B) (B) (B,Not hign school graduate 100.0 34.2 19.5 19.4 8.7 2.9 8.8 6.5
Female 100.0 15.1 21.2 22.0 17.4 8.5 12.2 3.6Enrolled below college 100.0 14.1 20.3 22.0 18.0 8.8 13.1 3.7Nursery school and kindergarten 400.0 13.6 20.1 23.9 18.3 8.7 13.1 2.5Public 100.0 19.5 23.8 23.1 15.9 6.8 8.8 2.1Private 100.0 4.8 14.4 24.9 21.8 11.5 19.4 3.2Elementary, 1 to 8 years 100.0 15.9 21.9 22.0 17.4 8.0 11.7 3.2Public 100.0 17.2 23.1 22.0 16.8 7.6 10.4 2.9Private 100.0 7.6 14.3 21.4 21.2 10.7 20.1 4.6High school, 1 to 4 years 100.0 10.6 16.9 21.0 19.4 10.6 16.0 5.5Public 100.0 11.4 17.6 21.8 19.2 10.3 14.7 5.1Private 100.0 4.4 10.8 14.5 21.0 12.6 27.6 9.0
Not enrolled 100.0 23.3 29.6 22.1 11.9 5.7 4.9 2.53 to 13 years old 100.0 20.5 30.8 23.0 12.4 5.9 4.9 2.414 to 17 years old 100.0 41.6 22.0 16.0 8.6 3.9 4.9 3.0High school graduate(8) (B) (B' 03) ill (8) (8) (8)Not high school graduate 100.0 48.4 20.8 15.7 5.5 4.0 3.5 2.1
See footnotes at end of table.

43
Table 14. Primary Family Member 3 to 17 Years Old by Family Income, Enrollment Status, Leveland Control of School, Sex, Race, and Hispanic Origin: October 1985-Continued
(Numbers .n thousands. Civilian noninstitutional population. Excludes persons enrolled in college. For meaning of symbols, see text)
Level and control of school,enrollment status, age, sex, race,and Hispan'c origin
Family income
Total
Under$10,000
$10,000 to$19,999
$20,000 to
$29,999
$30,000 to$39,999
$40,000 to
$49,999$50,000and over
Not
reported
PERCENT DISTRIBUTION--Continued
Black
Mile. 100.0 44.5 26.8 13.1 7.9 3.1 2.4 2.2
Enrollee below college 100.0 43.8 26.9 13.3 7.9 3.4 2.5 2.3
Nursery school and kindergarten 100.0 45.3 28.0 12.8 8.3 2.0 1.8 1.E
Public 100.0 53.2 27.5 9.2 6.8 0.6 0.9 1.7
Private 100 0 6.4 30.3 30.2 15.4 9.6 6.6 1.5
Elementary, 1 to 8 years 100.0 46.8 26.6 11.8 6.9 3.3 2.3 2.3
Public 100.0 48.6 26.3 11.4 6.5 3.3 2.2 2.3
Private 100.0 18.4 35.6 21.9 16.9 2.6 4.2 0.5
High school, 1 to 4 years 100.0 35.5 27.1 17.2 10.1 4.1 3.3 2.E
Public 100.0 36.0 27.5 16.7 9.9 4.1 3.4 2.4
Private (E) (B) (B) (B) (B) (B) (B) (B)
Not enrolled 100.0 49.9 26.1 11.2 8,4 1.0 1.7 1.7
3 to 13 years oli 100.0 49.7 27.0 11.3 8.1 1.1 1.0 1.7
14 to 17 years old (B) (B) (B) (B) (B) (B) (B) (B)
High school graduate (B) (B) (B) (B) (B) (B) (B) (B)
Not high school gr-duate (B) (B) (B) (B) (B) (B) (B) (B)
Female 100.0 45.0 25.5 14.0 6.5 4.1 2.4 2.4
Entolled below college 100.0 44.2 25.4 14.1 6.8 4.5 2.5 2.5
Nursery school and kindergarten 100.0 49.2 21.7 14.6 6.4 3.1 3.5 1.0
Public 100.0 57.0 22.6 9.3 5.9 2.4 1.8 1.4
Private 100.0 20.7 18.9 34.7 8.5 6.0 11.3
Elementary, 1 to 8 years 100.0 45.7 25.5 13.8 5.7 4.6 2.4 2.3
Public 100.0 47.0 25.7 13.9 5.3 4.1 1.7 2.4
Private 100.0 16.0 22.9 11.5 14.6 15.6 17.9 1.4
High school, 1 to 4 years 100.0 37.8 27.2 14.8 9.4 3.1 2.3 3.5
Public 100.0 38.4 27.1 14.5 9.3 5.2 2.0 3.5
Private (B) (B) (B) (B) (B) (B) (B) (B)
Not enrolled 100.0 53.5 26.0 12.5 4.5 0.6 1.4 1.5
3 to 13 years old 100.0 55.0 28.9 8.9 4.4 0.7 1.0 1.2
14 to 17 years old (B) (B) (B) (B) (B) (B) (B) (B)
High school graduate (B) (B) (B) (B) (B) (B) (B) (B)
Not higa school graduate (B) (B) (a) (B) (B) (B) (B) (B)
Hispanic origin'
Male 100.0 34.5 33.4 15.7 8.6 2.8 2.5 2.4
Enrolled below college 100.0 32.5 34.0 16.0 9.2 2.8 2.9 2.5Nursery school and kindergarten 100.0 30.4 38.1 11.4 11.7 3.7 2.2 2.6Public 100.0 37.2 41.3 9.7 8.1 0.8 2.5 0.4Private (B) (8) (B) (B) (B) (B) (B) (B)
Eli entary, 1 to 8 years 100.0 33.5 33.5 16.0 9.0 2.5 2.7 2.7
Public 100.0 34.3 34.2 15.3 8.1 2.6 2.7 2.8Private 100.0 22.2 25.7 25.7 20.9 2.1 3.4
High school, 1 to 4 years 100.0 30.6 33.1 18.8 8.7 2.8 4.0 2.2
Public 100.0 32.0 33.4 19.1 8.4 2.2 2.5 2.3Private (B) (B) (B) (B) (B) (B) (B) (B)
Not enrolled 100.0 45.9 30.2 13.7 5.0 2.9 0.3 1.8
3 to 13 years old 100.0 45.9 30.2 14.1 4.5 3.3 2.1
14 to 17 years old (B) (B) (B) (B) (B) (B) 031 (B)
High school graduate (B) (B) (B) (B) (B) (B) (B) (B)Not high school graduate (B) (B) (E) (B) (B) (B) JO (B)
Female 100.0 35.6 29.7 18.3 8.2 2.8 2.9 2 5Enrolled below college 100.0 33.9 29.3 18.9 8.8 3.0 3.4 8
Nursery school and kindergarten 100.0 32.2 27.5 24.8 8.1 3.9Public 100.0 39.0 31.0 22.4 3.3 0.2 2.6 1.6
Frivate (B) (3) (B) (B) (B) (B) 0) (B)
Elementa , 1 to 8 years 100.0 35.0 30.5 18.3 7.9 3.3 3.0 2.0Public. 100.0 36.5 30.9 17.7 7.5 2.8 2.4 2.2
Private 100.0 16.0 24.7 27.0 12.8 9.5 9.9 -
High school, 1 to 4 years 100.0 31.6 27.0 17.3 11.7 3.4 4.2 4.8Public 100.0 32.1 25.4 18.5 11.1 3.7 4.0 5.3Private (B) (B) (B) (B) (B) (B) (B) (B)
Not enrolled 100.0 45.5 31.7 15.2 4.9 2.2 - 0.5
3 to 13 years old 100.0 38.4 35.8 17.6 5.0 2.7 - 0.614 to 17 years old (B) (8) (B) (8) (a) (B) (B) (B)
High school graduate (B) (B) (B) (B) (B) (B) (B) (B)
Not high school graduate (8) (a) (B) (B) (B) (B) (3) (B)
'May be if any race.

Table 15. Single Grade of Enrollment and High School Graduation Status for Persons 3 to 34 Years Olci by Age, Sex, Race, and HispanicOrigin: October 1985
(Numbers in thousands. Civilian noninstitucional population. For meaning of symbols, see text)
Age, sex,race, andHispanicorigin
Popu-latioa
Enrolled
aut enrolledTotal
Nurs-ery
Kin-
der-
garten
Elementary school (year) High school (year) College (year)
NumberPer-cent 1 2 3 4 5 6 7 8 1 2 3 4 1 2 3 4 5
6 or
more
Highschool
graduate
Not highschool
graduate
ALL RACES
Hale3 years old4 years old
5 years old6 years old7 years oldB years old9 years old10 years old11 years old .
12 years old13 years old14 years old
15 years old16 years old17 years old18 years old ..
19 years old20 years old21 years old .
22 years old23 years old24 years old25 to 29 years old
30 to 34 year!, old
Female3 years old
4 years old5 years old6 years old7 years oldB years old
9 years old10 years old11 years old
12 years old13 years old14 years old15 years old16 years old17 years old18 years old19 years old20 years old .....
21 years old
22 years old23 years old24 years old25 to 29 years old30 to 34 years old
59,7701,8391,8271,8241,7661,7291,6641,6301,6161,700
1,6901,7381,9121,9301,9011,7921,7841,7661,828
1,882
1,9711,987
1,98110,3029,711
60,230
1,7551,7701,7171,6591,6641,5941,5461,596
1,585
1,6691,6041,629
1,8341,850
1,1171,8301,8241,9911,9/8
2,2262,072
2,00210,74410,174
29,436490857
1,6851,7381,7141,6481,6141,6031,685
1,679
1,7251,8771,8991,8001,6111,070
782
678
675
473347
293
967527
28,577
545908
1,629
1,6451,6481,5851,5321,589
1,577
1,657
1,5941,789
1,7981,755
1,4881,049
814746609
450
271232
975691
49.226.646.992.498.499.199.099.0
99.299.1
99.399.398.298.494.7
89.960.0
44.337.135.9
24.017.514.8
9.45.4
47.431.151.394.9
99.299.099.499.1
99.699.5
99.399.497.898.0
94.986.757.3
44.637.530.8
20.2
13.111.6
9.16.8
1,207
452656
90
10
-
-
-
-
-
-
-
-
-
-
-
-
-
-
-
-
-
-
-
1,284505
69977
4
-
-
-
-
-
-
-
-
-
-
-
-
-
-
-
-
-
-
-
1,986
38
201
1,490
257
-
-
-
-
-
-
-
-
-
-
-
-
-
-
-
-
-
-
-
1,829
40
210
1,409
170
-
-
-
-
-
-
-
-
-
-
-
-
-
-
-
-
-
-
-
1,895
-
-
1051,374
38031
3
3
-
-
-
-
-
-
-
-
-
-
-
-
-
-
-
-
1,750-
-
141
1,333
25814
3
-
-
-
-
-
-
-
-
-
-
-
-
-
-
-
-
-
1,751-
-
-
931,211
386459
6
-
-
-
-
-
-
-
-
-
-
-
-
-
-
-
1,707-
-
2
1261,25129624
8-
-
-
-
-
-
-
-
-
-
-
-
-
-
-
-
1,682
-
-
5
117
1,124
381
449
1
-
-
-
-
-
-
-
-
-
-
-
-
-
1,637
-
-
12
1281,15930033
1
2
2
-
-
-
-
-
-
-
-
-
-
-
-
1,663
-
-
-
-
4
98
1,084386
78
9
3
-
2
-
-
-
-
-
-
-
-
-
-
-
1,561
-
-
-
-
8
110
1,079
314
40
3
3
-
-
-
-
-
-
-
-
-
-
-
-
1,658-
-
-
-
2
9
95
1,040
435
6213
4-
-
-
-
-
-
-
-
-
-
-
-
1,558
-
-
-
-
3
1
111
1,096
288
499
-
-
-
-
-
-
-
-
-
-
-
-
-
1,711-
-
-
-
-
-
4113
1,071
42087
15-
-
2
-
-
-
-
-
-
-
-
-
1,637
-
-
-
-
-
412
1311,105
311
678
-
-
-
-
-
-
-
-
-
-
-
-
1,715
-
-
-
-
-
2
8
83
1,069
44493
10
2
1
-
-
-
-
-
-
3
1,659
-
-
-
-
3
5
140
1,136
301
51
19
2
-
-
-
-
-
-
-
2
1,649-
-
-
-
-
-
-
1
3
108
1,03540082
19
1
-
-
-
-
-
-
-
-
-
1,632-
-
-
-
-
-
-
2
3
148
1,086
318632
5
-
-
-
-
-
-
-
1
5
2,015-
-
-
-
-
-
-
-
-
9
1351,216483142214
1
2
-
-
-
-
4-
1,836-
-
-
-
-
-
-
-
-
3
124
1,24237073
7
5
4-
-
-
-
-
7
1
1,902
-
-
-
-
-
-
-
-
2
8
1381,187
41311514
8
3
3
2
3
4
1,735
-
-
-
-
-
-
-
-
-
3
1661,180
309449
8
8
1
2
-
1
3
1,714-
-
-
-
-
-
-
-
-
-
-
1
126
1,08140576
10
1
3
5
-
-
3
3
1,635-
-
-
-
-
-
-
-
-
-
-
4159
1,17121631
17
7
1
-
-
6
10
11
1,543
-
-
-
-
-
-
-
-
-
-
-
2
3
127
963306
83
22
i
11
3
2
12
2
1,600
-
-
-
-
-
-
-
-
-
-
-
-
4
1831,104
20228
24
10
11
5
3
14
11
1,342
-
-
-
-
-
-
-
-
-
-
7
6
14
94606194
90
52
45
29
33
99
72
1,614
-
-
-
-
-
-
-
-
-
-
-
3
16
103695
184
84
48
62
4651
179
143
1,190
-
-
-
-
-
-
-
-
-
-
-
-
1
3
55
446184
133
83
38
34
131
83
1,395-
-
-
-
-
-
-
-
-
-
-
-
-
3
101
494217
106
72
4536
205
116
927
-
-
-
-
-
-
-
-
-
-
-
-
-
-
46
39
321
164
89
61
34
149
60
1,003-
-
-
-
-
-
-
-
-
-
-
-
-
-
46
77
341
174
75
4620
147
115
927
-
-
-
-
-
-
-
-
-
-
-
2
i
2
53
301
151
119
58
179
60
715
-
-
-
-
-
-
-
-
-
-
-
-
-
-
-
2
61
257
14661
40
102
45
438
-
-
-
-
-
-
-
-
-
-
-
-
-
-
-
-
-
2
14
79
60
53
149
81
429-
-
-
-
-
-
-
-
-
-
-
-
-
-
-
-
-
4
10
80
4041
166
89
521
-
-
-
-
-
-
-
-
-
-
-
-
-
-
-
-
-
-
-
8
33
8C
234166
361
-
-
-
-
-
-
-
-
-
-
-
-
-
-
-
-
-
-
1
3
27
36
143
151
22,739
-
-
-
-
-
-
-
-
-
2
4
13
20
432
686886919
1,1981,315
1,429
7,8687,967
24,460-
-
-
-
-
-
-
-
-
-
-
2
2
6
62
538802
9901,111
1,451
1,5481,506
8,2768,165
7,5941,34997013928
15
16
17
13
15
11
13
3427
88161282298264288
300326258
1,467
1,217
7,1921,2108628814
16
9
14
7
8
12
10
38
34
89
167
243207
255258
325253263
1,4931,318

Table 15. Single Grade of Enrollment and High School Graduation Status for Persons 3 to 34 Years Old by Age, Sex, Race, and HispanicOrigin: October 1985-Continued
(Numbers in thousands. Civilian noninstitutional population. For meaning of symbols, see text)
1ge, sex,
Enrolled
Not enrolledrace, and
Total Elementary school (year) High school (year) College (year)Hispanicor1r4-1
Popu- Per- Nurs-Kin-
der- 6 oHigh
schoolNot high
school:anon Number cent ery garten 1 2 3 4 5 6 7 8 1 2 3 4 1 2 3 4 5 more graduate graduate
MITE
Male 49,817 24,178 48.5 1,039 1,605 1,502 1,440 -,326 1,349 1,335 1,397 1,362 1,338 1,653 1,542 1,398 1,260 1,134 1,0'4 799 811 402 453 19,493 6,146years old 1,496 412 27.5 379 33 - - - - - - - - - - 1,084years old...., . 1,496 704 47.1 577 127 - - - - - - - 792years old 1,468 1,362 92.8 76 1,215 70 -- - 106years old 1,425 1,406 98.7 7 230 1,094 - -- 19years cad 1,406 1,393 99.1 - - 308 1, 80 - - -- 13I years old 1,344 1,337 99.5 - 24 314 713 78 9 - - - 71 years old 1,330 1,321 99.3 - 3 37 195 915 69 2 1 - - - - 80 years ol, 1,323 1,310 99.0 - 2 8 32 302 867 95 2 - - - - - 131 years old 1,371 1,360 99.2 - 2 5 46 335 902 67 3 - - - - 11
2 years old 1,352 1,344 99.4 - - 4 44 325 879 86 5 1 - - - - - 83 years old ..... 1,415 1,404 99.2 - - 3 7 61 340 893 96 3 - - - 114 years old 1,540 1,511 98.1 - - - 3 10 57 294 1,031 110 - - 5 - - - - 2 275 years old 1,597 1,570 98.3 - 2 - 9 53 396 995 109 3 4 - - - - - 4 236 years old 1,546 1,462 94.6 - - - - - 2 7 95 324 912 102 14 1 - - 9 757 years old 1,491 1,347 90.3 - - - 2 - 20 87 306 837 86 3 4 2 - - 17 1288 years old 1,462 859 58.8 - - - - - 4 6 52 225 520 44 6 1 - 361 2429 years old 1,475 666 45.2 - - - - 1 6 8 48 151 416 35 2 - - 572 2360 years old 1,531 581 37.9 - - - - - - 2 - 19 63 155 293 47 2 - 741 2091 years old 1,601 584 36.5 - - - - - - - 5 45 111 141 266 12 - 782 235
.2 years old 1,656 404 24.4 - - - - - - - 2 5 6 40 60 71 138 75 8 998 2543 years old 1,676 296 17.7 - - - - - - - - 3 - 2 27 33 52 94 55 30 1,112 2674 years old 1,707 258 15.1 - - - - - - - - - 26 25 29 52 50 74 1,256 1945 to 29 years old. 6,747 833 9.5 - - - - - - - 3 4 3 11 84 115 120 156 134 203 6,694 s,2200 to 34 years old. 8,362 454 5.4 - - - - - - - - 3 2 68 71 48 51 73 138 6,945 964
Female 49,553 23,274 47.0 1,048 1,456 1,408 1,363 1,322 1,249 1,266 1,282 1,316 1,339 1,455 1,440 1,326 1,303 1,359 1,149 877 619 384 314 20,551 5,728years old 1,423 419 29.4 404 15 - - - - - - - - - 1,004years old 1,421 715 50.3 580 105 - - - - - - - - - - - - - - - - 706years old 1,396 1,327 95.1 60 1,156 112 - - - - - - - - - - - - - - - 69years Ad 1,354 1,343 99.2 3 151 1,083 100 6 - - - - - - - - - - - 11years old 1,335 1,325 99.3 - 198 1,024 94 5 3 - - - - - - - - - 11years c".1 1,172 1,263 99.3 - - 14 219 954 72 - 4 - - - - - - - - 9years old 1,262 1,253 99.3 - - 1 14 240 897 91 9 1 - - - - - - - - - 90 years old 1,300 1,294 99.5 - - - / 24 234 928 95 3 2 - - - - - - - - 71 years old 1,254 1,246 99.4 - - - 1 29 209 900 107 1 - - - - - - - 8
2 years old 1,348 1,336 99.1 - - - 2 8 28 231 942 123 3 - - - - - - - - - 123 years old 1,287 1 278 99.3 - - - - 3 8 42 206 913 103 3 - - - - - - - 94 years old 1,487 1,459 98.1 - - - - - - - 2 40 24. 1,035 134 4 - - - - - - 2 265 years old 1.502 1,468 97.7 - - - - - - - 13 44 260 1,008 136 4 2 - - - - 2 326 years old 1,497 1,413 94.4 - - - - - - - - 2 40 229 996 135 11 - - - - - 6 787 years old 1,412 1,228 87.0 - - - - - - - 2 5 4 37 142 940 92 1 4 - - - 41 1438 years old 1,504 884 58.8 - - - - - - 4 7 18 159 608 82 6 - - - 432 1889 yeas old 1,481 696 47.0 - - - - 8 7 13 15 439 70 2 - - 637 1490 years old 1,660 621 37.4 - - - - - - - - 8 4 9 64 177 305 52 4 - 837 2021 years old 1,635 531 32.5 - - -- - - - - - 1 1 10 44 81 149 235 8 1 887 217
2 years old 1,885 380 20.2 - - - - - - - - - - - 2 - 10 43 53 68 126 74 3 1,247 2573 years old 1,690 210 12.4 - - - - - - - - - - 5 34 36 35 43 31 25 1,280 2004 years old 1,670 196 11.7 - - - - - - - - - - - 3 2 39 32 18 35 40 28 1,274 2005 to 29 years old. 8,958 802 9.0 - - - - - - - - 5 1 8 9 144 159 128 86 140 122 6,969 1,11,70 to 34 years old. 8,520 589 6.9 - - - - - - - - 2 o 1 2 6 8 123 88 94 39 86 135 6,938 993
3
6
7
8
9
22
22223
rt

Table 15. Single Grade of Enrollment and High School Graduation Status for Persons 3 to 34 Years Old by Age, Sex, Race, and Hispanic a,.p.
Origin: October 1985-Continued(Numbers in thousands. Civilian noninstitutional population. For meaning of symbols, see text)
Age, sex,race, andHispanicorigin
Popu-lation
Enrolled
Not enrolledTotal
Nurs-ery
Kin-der-
garten
Elementary school (year) High school kyear College year)
NumberPer-
cent 1 2 3 4 5 6 7 8 1 2 3 4 1 2 3 4 5
6 ormore
Highschool
graduate
Not highschool
graduate
BLACK
Hale 7,937 4,173 52.6 129 31; 331 251 288 265 260 264 280 253 290 295 249 242 150 107 89 72 15 25 2,577 1,1873 years old 272 69 25.4 64 5 - - - - - - - - - - 2034 years old 258 115 44.6 51 63 - -- 1445 years ol4 296 271 91.6 11 227 32 1- 255 years old 279 273 9'.8 3 22 229 15 5 -- 67 years old 255 253 99.2 - 61 164 21 4 -- 2B years old 244 236 96.7 - . 59 164 9 - - - 8i years old 261 257 98.5 - 9 83 145 18 2 1 - 4LO years old 240 240 100.0 - - 10 73 139 12 5 -11 years old 274 270 98.5 - 4 32 81 135 14 - - 4
L2 years old 271 268 98.9 - - 1 2 16 87 141 17 2 1 - 3L3 years old 258 256 99.2 - - 5 23 85 114 27 2 - 2L4 years old 301 294 97.7 - - - 1 5 34 85 149 17 1 - - - 7L5 years old 270 267 98.9 - - - - 25 67 164 8 - 3 - - - 3L6 years old 288 273 94.8 - - - - 11 43 68 131 20 - - 2 12L7 years old 25G 228 88.4 - - - - 1 2 26 85 108 6 - - - 2 29L8 years old 263 '54 62.4 - - - - - 10 19 73 55 7 - - 63 35LO years old 255 92 36.1 - - - - - 2 2 30 37 19 2 - 107 5720 years old 259 79 30.5 - - - - - 1 2 24 23 25 4 - 128 5231 years old.... 240 69 28.8 - - - - - 1 2 17 21 23 2 - 121 50
22 years ^ld 245 38 15.5 - - - - - 6 4 13 8 5 3 - 1)4 3223 years old 245 32 13.1 - - - - - 2 2 5 8 15 1 - 169 4424 years old 213 22 10.3 - - - - - 5 4 2 5 2 1 138 5335 to 29 years old. 1,157 66 5.7 - - - - - 9 10 17 13 4 11 894 19730 to 34 years old. 1,034 40 3.9 - - - - - - - - - - 2 9 7 7 3 12 780 214
Female 8,652 4,271 49.4 203 30& 287 278 271 244 225 290 269 250 309 251 258 236 179 192 100 65 30 25 3,179 1,2023 years old 278 114 41.0 90 25 - - - - - - - - - - - 1634 years old 292 171 58.6 101 70 - - - - - - - - - 121i years old 248 237 95.6 12 )9 23 2 - - - - - - - 125 years old 252 249 98.8 1 4 209 20 6 - - - - - - - 3/ years old 110 264 97.8 - 52 183 28 - - - - - - - 63 years old 268 268 100.0 - - - 64 169 34 1 - - - - - -) year:, old 225 221 98.2 - - 3 6 59 135 13 2 2 - - - - 4LO years old 232 232 100.0 - - 1 7 65 127 28 2 - - - - -Li years old 766 266 100.0 - - - 10 61 164 30 2 - - - -
L2 years old 249 :49 100.0 - - - - - 21 65 140 21 - - - - - - -L. years old 271 270 99.6 - - - 2 - 1 24 81 145 17 - - - - - - 1L4 years old 285 273 95.8 - - - - - 6 7 8 162 30 - - - - - - 12L5 years gld 273 271 99.3 - - - - - - 15 92 139 18 - 1 - - - - 2L6 years old 290 279 96.2 - - - - - - - - 31 73 150 21 3 - - - - 11L7 years old 248 214 86.3 - - - - - - - - 1 5 62 139 6 1 - - 16 18L8 years old 26U 121 46.5 - - - - - - - - 2 11 40 57 11 - - 95 44L9 years old 293 95 32.4 - - - - - - - 6 15 23 44 3 - 149 50.).0 years old... 282 97 34.4 - - - - - - - - - 4 13 17 29 29 5 134 50!I years old 297 53 17.8 - - - - - - - - - - 2 19 17 14 1 - 206 38
1.2 years old 277 53 19.1 - - - - - - - - - 18 13 6 10 4 - 169 55!3 years old 307 40 13.0 - - - - - - - - - - 5 4 9 13 6 2 225 41!4 years old 281 28 10.0 - - - - - - - 3 - 9 3 1 6 1 5 198 5515 to 29 years old. 1,430 125 8.7 - - - - - - - - 2 5 23 44 14 10 16 11 1,048 25710 to 34 years old. 1,280 79 6.2 - - - - - - - 2 3 2 14 24 19 6 2 6 940 261

Table 15. Single Grade of Enroll:rient and High School Graduation Status for Persons 3 to 34 Years Old by Age, Sex, Race, and HispanicOrigin: October 1985-Continued
(Numbers In thousands. C.vilian noninstiturionat population. For meaning of symbols, see text)
Enrolled
Age, sex, Not enrolledrace, and Total Elementary school (year) High school (year) College (year)Hispanic
Kin- High Not highorigin Popu- Per- Nurs- der- 6 or school schoollatinn Number cent ery garten 1 2 3 4 5 6 7 8 1 2 3 4 1 2 3 4 5 more graduate graduate
HISPANIC ORIGIN'
Hale 5,379 2,553 47.5 89 184 200 184 181 166 181 186 183 147 162 166 119 126 95 47 34 48 28 28 1,390 1,4363 years old... 223 26 11.7 21 5 -- - - - - - - - . - - - 1974 years old 208 87 41,8 60 27 - - - - - 1205 years old 178 162 91.0 7 134 20 -- - - 176 years old 177 177 100.0 - 18 141 19 - - -
- -7 years old 178 175 98.3 - 34 :27 13 - - - - 48 years old 166 164 98.8 - 5 30 108 15 6 - - - - - - 29 years old 153 100.0 - 5 47 83 15 2 - - - - - - - -10 years old 173 . 100.0 - 1 12 52 85 21 - - - - - -11 years old 201 li. 99.9 - 2 15 60 102 21 - - - -- - - 2
---12 years old .. 156 156 100.0 - 7 '3 93 12 - 1 -
4 - --13 yens old 167 163 97.6 - 17 58 77 5 2 - 4- -
14 years old 179 170 95.0 - 3 2 8 51 96 13 - 2 815 years old 109 107 98.2 - - - - 6 42 58 1 - - -- 116 years old 164 150 91.5 - - - - -2 13 57 67 8 3 - 2 12
-17 years old 176 152 86.4 - - - - - 6 32 3, 71 7 - 2 2218 years old . 146 71 48.6 - - - 2 2 13 12 20 2 - 13 62
--
19 years old 129 35 17.1 - - - - - 13 8 12 2 40 5420 years old 141 31 22.0 - - - - . 2 14 7 R 69 41
- --
21 years old 134 25 18.7 - - - - . 4 12 8 58 51
22 years old 191 34 17.8 - - - - - 2 - 3 5 13 6 89 6723 years old 186 16 8.6 - - - - - - - 1 4 9 2 - 100 7024 years old.. 203 23 11.3 - - - - - - 7 3 2 6 3 2 121 6C25 to 29 years old 917 75 8.2 - 3 - - - 15 4 3 19 11 21 497 34530 to 34 years old 722 29 4.0 - - - - - - - - - 10 4 3 7 5 396 2°
Female.. 5,252 2,517 47.9 79 180 184 '86 165 187 179 160 159 156 163 137 130 153 102 88 59 25 9 17 1,398 1,3383 years old 188 24 12.8 23 2 -- - -
- - - - - - - - - - 163-
4 yeah old 171 75 43.9 54 21 - - - - - - 96---
5 year- old 178 157 88.2 2 139 14 2 - - - . 21- -
6 years old 167 166 99.4 - 19 127 16 - - - .1
-7 yews old 174 168 96.6 - 36 115 15 1 - - - - 78 years old 173 173 100.0 - 7 45 104 16 - 2 - - - -.9 years old ...... 172 168 97.7 - 4 31 119 13 - 1 . - - - 410 years old 174 174 100.0 - 4 11 40 108 10 2 - - - - -11 years old 174 173 99.4 - 4 51 102 16 - - - - - 2
-12 years old 154 154 100.0 -
- -6 5 38 90 14 - .
--- -
14
13 years old 131 131 100.0 - 8 30 79 11 - -
--- -
14 yesra old 170 166 97.6 - - 8 53 94 9 2 - 415 years old ... 172 163 94.8 - - 11 8 43 83 14 4 - - - 916 years old.. ..... 145 125 86.2- - -
- 12 30 69 15 - 2017 years old 180 135 75.0- -3 10 24 90 4 1 3 43le years old 143 80 55.9
1 9 32 31 4 4 - 41 2219 years old .. 153 52 34.0-- 8 - 25 17 2 64 3720 years old 156 41 26.3
- - 2 5 '7 12 74 4121 years old 142 40 28.2 - - - 5 13 13 9 75 27
22 years old 186 25 13.4- - 1 - 10 4 6 4 - 89 7123 years old 138 9 6.5 - - - - - - 2 1 2 86 4324 years old .. 173 17 0 - - - - - - 2 4 6 2 2 2 102 5425 to 29 years old. 909 45 5 - - - -
1 5 16 10 8 4 - 496 36930 to 34 years old. 729 54 7.4-
- - 2 10 9 12 4 2 11 369 306
'May be of any race.

48
Table 16. Modal Grade of Enrollment and Age for Persons 3 to 21 Years Old by Sex, Race, andHispanic Origin: October 1985
(Numbers in thousands. Civilian noninstitutional populati6n. For meaning of symbols, see text)
age, sex; race, modal grade
of enrollment,and Hispanic origin
Population
Enrolled at any level Percent of enrolled
Number Percent
2 or more
years belowmodal grade
1 year belowmodal grade
In modalgrade
1 or moreyears abovemodal grade
ALL RACES
Male 33,818 26,830 79.3 5.3 21.3 66.1 7.25 years old, nursery school 1,839 490 26.6 - 92.2 7.8: years old, nursery school 1,827 857 46.9 - 76.5 23.55 years old, kindergarten 1,824 1,685 92.4 5.3 88.4 6.35 years old, elementary 1 1,766 1,738 98.4 0.6 14.8 7:.1 5.67 years old, elementary 2 1,729 1,714 99.1 22.2 70.7 7.23 years old, elementary 3 1,664 1,648 99.0 1.9 23.4 68.2 6.52 years old, elementary 4 1,630 1,614 99.0 3.0 23.6 67.2 6.3LO years old; elementary 5 1,616 1,603 99.2 3.5 24.1 64.9 7.611 years old, elementary 6 1,700 1,685 99.1 5.5 25.8 63.6 5.1L2 years old, elementary 7 1,690 1,679 99.3 4.3 25.0 63.7 7.1L3 years old, elementary a 1,738 1,725 99.3 6.0 25.7 60.0 8.3L4 years old, high school 1 1,912 1,877 98.2 6.0 21.3 64.8 7.9L5 years old, high school 2 1,930 1,899 98.4 4.9 25.4 62.5 7.1L6 years old, high school 3 1,901 1,800 94.7 9.1 22.9 60.1 7.9L7 years old; high school 4 1,792 1,611 89.9 8.7 25.1 59.8 6.4L8 years old; college 1 1,784 1,070 o0.0 9.0 28.6 56.6 5.819 years old; college 2 1,766 782 44.3 13.0 24.8 57.0 5.220 years old, college 3 1,828 678 17.1 17.4 27.1 47.3 8.121 years old, college 4 1,882 675 35.9 29.2 24.3 44.6 2.1
Female 33,012 25,957 75.6 3.6 16.6 70.7 9.23 years old, nursery schcol 1,755 545 3..1 92.7 7.3', years old, nursery school 1,770 908 51.3 - 77.0 23.15 years old, kindergarten 1,717 1,629 94.9 4.7 86.5 8.8years old; elementary 1 1,659 1,645 99.2 0.2 10.3 81.0 8.4years old; elementary 2 1,654 1,648 99.0 15.7 75.9 8.4
3 years old, elementary 3 1,594 1,585 99.4 0.9 18.7 73.1 7.3years old, elementary 4. 1,546 1,532 99.1 1.8 19.6 70.4 8.20 years old, elementary 5 1,596 1,589 99.6 2.6 19.8 69.0 8.7L1 years old; elementary 6 1,585 1,577 99.5 2.6 18.3 70.1 9.12 years old; elementary 7 1,669 1,657 99.3 3.6 18.8 68.6 9.13 years old, elementary 8 1,604 1,594 99.4 5.1 18.9 68.1 8.04 years old; high school 1 1,829 1,789 97.8 3.3 17.8 69.4 9.55 years old; high school 2 1,834 1,798 98.0 4.6 20.6 65.6 9.26 years old, high school 3 1,850 1,755 94.9 4.3 17.6 66.7 11.37 years old, high school 4 1,717 1,488 86.7 3.9 i4.5 74.2 7.418 years old; college 1 1,830 1,049 57.3 4.3 19.3 66.3 10.2L9 years old, college 2 1,824 814 44.6 7.0 22.6 60.7 9.7ZO years old; college 3 1,991 746 37.5 16.5 29.1 45.7 3.721 years old; college 4 1,978 609 30.8 27.3 28.6 42.2 1.8
WHITE
Male 27,6E9 21,933 79.3 4.6 20.6 68.0 6.83 years old, nursery school 1,496 412 27.5 92.0 8.0: years old; nursery school 1;496 704 47.1 - 82.0 18.05 years old; kindergar. en 1,468 1,362 92.8 5.6 89.2 5.15 years old; elementary 1 1,425 1,406 98.7 0.5 16.4 77.8 5.37 years old, elementary 2 1,406 1,393 99.1 22.1 72.1 5.73 years old, elementary 3 1,344 1,337 99.5 1.8 23.5 68.3 6.5) years old; elementary 4 1,330 1,321 99.3 3.0 22.3 69.3 5.5LO years old; elementary 5 1,323 1,310 99.0 3.2 23.1 66.2 7.5Ll years old; elementary 6 1,371 1,360 99.2 3.9 24.6 66.J 5.1L2 years old, elementary 7 1,352 1,344 99.4 3.6 24.2 65.4 6.8L3 years old; elementary 8 1,415 1,404 99.2 5.1 24.2 63.6 7.1L4 years old; high school 1 1,540 1,511 98.1 4.6 19.5 68.2 7.61.5 years old; high school 2..... 1,597 1,570 98.3 4.1 25.2 63.4 7.4L6 years old; high school 3 1,546 1,462 94.6 7.1 22.3 62.4 8.0L7 years old; high school 4 1,491 1,347 90.3 8.1 22.7 62.1 7.1L8 years old, college 1 1,462 859 58.8 7.2 26.2 60.5 5.919 years old; college 2 1,475 666 45.2 9.5 22.7 62.5 5.620 years old, college 3 1,531 581 37.) 14.5 26.7 50.4 8.421 years old, college 4 1,601 584 36.5 28.1 24.1 45.5 2.1
1
6

49
Table 16. Modal Grade of Enrollment ari Age for 'ersons 3 to 21 Years Old by Sex, Race, andHispanic Origin: October 1985-Continued
(Numbers in thousands. Civilian noninatitutional population. For meaning of symbols, see text)
Age, sex, race, modal gradeof enrollment,and Hispanic origin
WHITE-Continued
Female3 years old, nursery school4 years old, nursery school5 years old, kindergarten6 years old, elementary 17 years old, elementary 2
years old, elementary 39 years old, elementary 410 years old, elementary 511 years old, elementary 612 years old, elementary 713 years old, elementary 814 years old, high school 115 years old, high school 216 years old, high school 3...17 years old, high school 418 years old, Lol1ege 119 years old, college 220 years old, college 321 years old, college 4
BLACK
Hale3 years old, nursery school4 years old, nursery school5 years cld, kindergarte'i6 years old, elementary 17 years old, elementary 28 years old, elementary 39 years old, elementary 410 years old, elementary 511 years old, elementary 612 years old, elementary 713 years old, elementary 814 years old, high school 115 years old, high school 216 years old, high school 317 years old, high school 418 years old, college 119 years old, college 220 years old, college 321 years old, college 4
Female3 years old, nursery school4 years old, nursery school5 years old, kindergarten6 years old, elementary 17 years old, elementary 28 years old, elementary 39 years old, elementary 410 years old elementary 511 years old, elementary 612 years old, elementary 713 years old, elementary 814 years old, high school 115 years old, high school 216 years old, high school 317 years old, high school 418 years old, college 119 years old, co:lege 220 years old, college 321 years old, college 4
Population
Earolled at any level Percent of enrolled
Number Percent
2 or more
years belowmodal grade
1 year belowmodal grade
In modalgrade
1 or more
y, r& abovemedal grade
26,830 21,099 -8.6 3.1 15.5 72.7 8.71,423 419 29.4 96.4 3.61,421 715 50.3 - 81.1 18.91,396 1,327 95.1 - 4.5 87.1 8.41,354 1,343 99.: 0.2 11.2 80.6 7.91,335 1,325 99.3 - 14.9 77.3 7.71,272 1,263 99.3 1.1 17.3 75.5 6.01,262 1,253 99.3 1.2 19.2 71.6 8.11,300 1,294 99.5 2.4 18.1 71.7 7.71,254 1,246 99.4 2.4 16.8 72.2 8.71,348 1,336 99.1 2.8 17.3 70.5 9.41,287 1,278 99.3 4.1 16.1 71.4 8.31,487 1,459 98.1 2.9 16.7 70.9 9.5L,502 1,468 97.7 3.9 17.7 68.7 9.71,497 1,41:. 94.4 3.0 16.2 70.5 10.31,412 1,228 87.0 3.9 11.6 76.5 7.91,504 884 58.8 3.3 18.0 68.8 10.01,46/ 696 47.0 4.0 22.4 63.1 10.31,660 621 37.4 13.7 28.5 49.1 9.01,635 531 32.5 25.8 28.1 44.4 1.7
S,042 3,974 78.8 '.5 25.8 56.5 8.3272 69 25.4 92.8 7.2258 115 44.6 - 44.3 54.8296 271 91.6 - 4.1 83.8 12.2279 273 97.8 1.1 8.1 83.9 7.3255 253 99.2 - 25.3 64.8 9.9244 236 96.7 1.7 25.0 69.5 3.8261 257 98.5 3.5 32.3 56.4 8.2240 240 100.0 4.6 30.4 57.9 7.1274 270 98.5 14.8 30.0 50.0 5.2271 268 98.9 7.1 32.5 52.6 7.5258 256 99.2 10.9 33.2 44.5 11.3301 294 07.7 13.6 28.9 50.7 6.8270 267 98.9 9.4 25.1 61.4 4.1288 273 94.8 19.8 24.9 48.0 7.3258 228 88.4 13.2 37.3 47.4 2.6263 164 62.4 17.7 44.5 33.5 4.3255 92 36.1 37.0 40.2 20.7 2.2259 79 30.5 36.7 29.1 31.6 5.1240 69 28.8 33.3 30.4 33.3 2.9
5,079 3,944 77.7 6.1 22.2 60.8 10.8278 114 41.0 - 78.9 21.9292 171 58.6 - - 59.1 40.9248 237 95.6 - 5.1 84.0 10.5252 249 98.8 0.4 5.6 83.9 10.4270 264 97.8 - 19.7 69.3 10.6268 268 100.0 - 23.9 0.1 13.1225 2,7 98.2 4.1 2'.7 61.1 7.7232 232 100.0 3.4 2i.0 54.7 12.9266 266 100.0 3.8 22.9 61.7 12.0249 249 100.0 8.4 26.1 56.2 8.4271 270 99.6 10.0 30.0 53.7 6.3285 273 95.8 4.8 24.9 59.3 11.0273 271 99.3 7.7 33.9 51.3 7.0290 279 96.2 11.1 26.2 53.8 8.6248 714 86.3 2.8 29.0 65.0 3.3260 1 46.5 10.7 33.1 47.1 9.1293 95 32.4 26.3 24.2 46.3 3.2282 97 34.4 35.1 29.9 29.9 5.2297 53 17.8 39.6 32.1 26.4 1.9

50
Table 16. Modal Grade of Enrollment and Age for Persons 3 to 21 Years Old by Sex, Race, andHispanic Origin: October 1985-Continued
(Numbers in thousands. Civilian noninstitutional population . For meaning of symbols, see text)
Age, sex, race, modal gradeof enrollment and Hispanic origin
HISPANIC ORIGIN'
Male3 years old, nursery school4 years old nursery school5 years old, kindergarten5 years old, elementary 17 years old, elementary 28 years old, elementary 39 years old, elementary 410 years old, elementary 511 years old, elementary 612 years old, elementary 713 years old, elementary 814 years old, high school 1
15 years old, high school 216 years old, high school 317 years old, high school 418 years old, college 119 years old, college 220 years old, college 321 years old, college 4
Female3 years old, nursery school4 years old, nursery schoo'5 years old, kindergarten6 years old, elementary 17 years old, elementary 28 years old, elementary 39 years old, elementary 410 years old, elementary 511 years old, elementary 612 years old, elementary13 years old, elementar 814 years old, high school 1.....15 years old, high scaool 216 years old, high school 317 years old, high sc ool 418 years old, college 119 years old, college20 years old, college 321 years old, college 4
'May be of any race.
Population
Enrolled at any level Percent of enrolled
Number Percent
2 or moreyears belowmodal grade
1 year belowmodal grade
In modalgrade
1 or more
years abovemodal grade
3,158 2,376 75.2 8.5 24.9 57.3 9.3
223 26 11.7 - 80.8 19.2
208 87 41.8 - 69.0 31.0
178 162 91.0 4.3 82.7 12.3
177 177 100.0 10.2 79.7 10.7
178 175 98.3 19.4 72.6 7.4
166 164 98.8 3.0 18.3 65.9 12.8
153 153 100.0 3.3 30.7 54.2 11.1
173 173 100.0 7.5 30.1 49.7 12.1
201 199 99.0 8.5 30.2 51.3 10.6
156 156 100.0 4.5 27.6 59.6 8.3
167 163 97.6 12.9 35.6 47.2 4.3
179 170 95.0 7.6 30.0 55.3 7.6
109 107 98.2 5.6 39.3 54.2 0.9
164 150 91.5 10.0 38.0 44.7 7.3
176 152 86.4 25.0 24.3 46.7 4.6
146 71 48.6 23.9 45.1 28.2 2.8
129 35 27.1 37.1 22.9 34.3 5.7
141 31 22.0 51.6 22.6 25.8 -
134 25 18.7 64.0 32.0
3,117 2,365 75.9 6.5 22.4 61.6 9.3
188 24 12.8 - 95.8 8.3
171 75 43.9 - 72.0 28.0
178 157 88.2 1.3 88.5 10.2
167 166 99.4 11.4 76.5 12.0
174 168 96.6 21.4 C.?. 5 9.5
172 li3 100.0 4.0 26.0 60.1 10.4
172 168 97.7 2.4 18.5 70.8 8.3
174 174 100.0 8.6 23.0 62.1 6.9
174 173 99.4 2.3 29.5 59.0 9.2
154 154 :00.0 7.1 24.7 58.4 9.1
131 131 100.0 7.6 22.9 60.3 8.4
170 166 97.6 4.8 31.9 56.6 6.6
172 163 94.8 11.7 26.4 50.9 11.0
145 125 86.2 9.6 24.0 55.2 12.0
180 135 75.0 11.1 17.8 66.7 3.7
143 80 55.9 12.5 40.0 38.8 10.0
153 52 34.0 15.4 48.1 32.7 3.8
156 41 26.3 29.3 41.5 29.3 2.4
142 40 28.2 45.0 32.5 22.5
t) 0

51
Table 17. Persons 35 Years Old and Over by Enrollment and Attendance Status, Labor ForceStatus, Write! Status, Sex, and Race: October 1985
(Numbers in thousands. Civililtan noninstitutional population For meaning of symbols, see text)
Enrollment and attendance status,labor force status, andmarital status
All races White Black and other races
Both sexes Male Female Both sexes Male Female Both sexes Male Female
ENROLLMENT STATUS
Total 103,458 47,838 55,620 90,916 42,317 48,599 12,542 5,521 7,021Enrolled in dchool:
Below college level 105 43 61 86 33 51 19 10 10In college 1,661 561 1,100 1,448 468 979 213 93 121
Full time 318 109 209 267 86 131 51 23 28Part time 1,343 452 891 1,181 382 798 162 70 93
Not enrolled in school 101,692 47,234 54,459 89,382 41,816 47,569 12,310 5,418 6,890
LABOR FORCE STATUS
In labor force 59,1i 33,544 25,643 51,739 29,764 21,976 7,447 3,780 3,667Enrolled in college 1,270 485 785 1,102 411 691 168 74 94Full time 161 63 98 139 S4 85 22 9 13Part time 1,109 422 687 963 357 606 146 65 81
Not enrolled in college 57,916 33,059 24,858 50,637 29,353 21,285 7,279 3,706 3,573
Not in labor force 44,272 14,294 29,977 39,177 12,553 26,622 5,095 1,741 3,354Enrolled in college 391 77 315 346 58 289 45 19 26Full time 157 47 111 128 33 96 29 14 15Part time 234 30 204 218 25 193 16 5 11
Not enrolled in college 43,881 14,217 29,662 38,831 12,495 26,334 5,050 1,722 3,328
MARITAL STATUS
Married, spouse present 72,479 37,818 34,661 65,567 34,156 31,411 6,912 3,662 3,250Enrolled in college 1,156 415 741 1,042 363 680 114 52 61
Full time 206 68 138 189 60 130 17 8 8Part time 950 347 603 853 303 550 97 44 53
Not enrolled in college 71,323 37,403 33,920 64,525 33,793 30,731 6,798 3,610 3,189
Other marital status 30,979 10,020 20,959 25,349 8,161 17,188 5,630 1,859 3,771Enrolled in college 505 146 359 406 105 299 99 41 60
Full time 112 41 71 78 26 51 34 15 20Part time 393 105 288 328 79 248 65 26 40
Not enrolled in college 30,474 9,874 20,600 24,943 8,056 16,889 5,531 1,818 3,711

52
Table 18. Enrollment of College Undergraduates 14 to 34 Years Old by Type of College,Residence, Age, and Sex: October 1985
(Numbers in thousands. Civilian noninstitutional population. For meaning of symbols, see text)
Sex, residence, and typeof college Total
enrolled14 to 19
years old20 and 21years old
22 to 24years old
25 to 34years old
Percent distribution
Totalenrolled
14 to 19years old
20 and 21years old
22 to 24
years old25 to 34
years old
ALL COLLEGES
Total 9,114 3,169 2,586 1,475 1,884 100.0 34.8 28.4 16.2 20.7Male 4,385 1,481 1,298 775 533 100.0 33.8 29.6 17.7 19.0Female 4,728 1,688 1,288 699 1,051 100.0 35.7 27.2 14.8 22.2
Metropolitan 6,797 2,295 1,906 1,157 1,440 100.0 33.8 28.0 17.0 21.2Inside central city 2,573 789 700 521 564 100.0 30.7 27.2 20.2 21.9Outside central city 4,224 1,506 1,206 637 876 100.0 35.7 28.6 15.1 20.7
Nonmetropolitan 2,316 874 680 316 444 100 0 37.7 29.4 13.6 19.2
TWO-YEAR COLLEGES
Total 2,772 959 558 403 851 100.0 34.6 20.1 14.5 30.7Male 1,179 1.28 264 179 309 100.0 36.3 22.4 15.2 26.2Female I 593.., 532 294 224 542 100.0 33.4 18.5 14.1 34.0
Metropolitan 2,006 657 407 307 635 100.0 32.8 20.3 15.3 31,7Inside central city 721 219 157 119 226 100.0 30.4 21.8 16.5 31.3Outside central city 1,285 437 250 189 410 100.0 34.0 19.5 14.7 31.9
Nonmetropolitan 765 303 151 95 215 100.0 39.6 19.7 12.4 28.1
LOUR -YEAR COLLEGES
Total 5,961 2,018 1,967 1,011 965 100.0 33.9 33.0 17.0 16.2Male 3,012 947 1,009 562 495 100.0 31.4 33.5 18.7 16.4Femalo 2,948 1,071 958 449 470 100.0 36.3 32.5 15.2 15.9
Metropolitan 4,479 1,483 1,450 800 746 100.0 33.1 32.4 17.9 16.7Inside central city 1,729 506 526 375 321 100.0 29.3 30.4 21.7 18.6Outside central city 2,750 977 924 426 424 100.0 35.5 33.6 15.5 15.4
Nonmetropolitan 1,482 534 517 210 220 100.0 36.0 34.9 14.2 14.8
First and second years 2,729 1,890 409 181 250 100.0 69.3 15.0 6.6 9.2Male 1,317 899 225 90 103 100.0 68 3 17.1 6.8 7.8Female 1,412 991 184 91 146 100.0 70,2 13.0 6.4 10.3
Metropolitan 2,019 1,386 311 142 180 100.0 68.6 15.4 7.0 8.9Inside central city. 772 469 146 73 84 100.0 60.8 18.9 9.5 10.9Outside central city 1,247 917 165 69 96 100.0 73.5 13.2 5.5 7.7
Nonmetropolitan 710 504 98 39 70 100.0 71.0 13.8 5.5 9.9
TYPE OF COLLEGE NOT REPORTED
Total, 14 to 34 years old 381 192 61 61 68 100.0 50.4 16.0 16.0 17.8

53
Table 19. Attendatice Status of College Undergraduates 16 to 34 Years Old by Sex, Age, Residence,and Type, Year, and Control of College: October 1985
3Numbers in thousands. Civilian noninstitutional population. For meaning of symbols, see text)
Age, type, yell- and control ofcollege and residence
Both tt,,so Male Female
Totalenrolled
Attending full timeTotal
enrolled
Attending full time
Totalenrolled
Attending lull time
Number Percent Number Percent Number Percent
ALL COLLEGES
Total.... .. . ,. ..... 9,097 6,841 75.2 4,373 3,391 77.5 4,725 3,449 73.016 and 17 years old.. , .. . 244 219 89.6 118 104 88.1 126 115 91.318 and 19 years old... ... 2,908 2,667 91.7 1,349 1,247 92.4 1,559 1,419 91.020 and 21 years old , 2,586 2,237 86.5 1,298 1,140 87.8 1,288 1,098 85.222 to 24 years old 1,475 1,017 68.9 775 587 75.7 699 431 61.725 to 29 years old 1,191 483 40 6 559 235 42.0 633 248 39.230 to 34 years old 693 218 31.5 274 80 29.2 418 138 33.0Year.
First 2,939 2,120 72.1 1,329 1,019 76.7 1,610 1,103 68.5Second 2,085 1,895 73.3 1,190 900 75.6 1,336 995 71 3Third, 1,931 1,451 75.1 927 712 76.8 1,003 739 73 7Fourth,
: 1,642 1,374 83.7 927 762 82.2 715 612 85.6Control
Public , 7,195 5,223 72.6 3,519 2,653 75.4 3,676 2,,70 69.9Private 1,903 1 618 85.0 854 739 86.5 1,04' 879 83.8
Residence.
Metropolitan 6,784 5,029 74.1 3,249 2,466 75.9 3,535 7 562-, 72.5Inside central city 2,569 1,917 74.6 1,220 905 74.2 1,348 1,012 75.1Outside central city 4,215 3,112 73.8 2,029 1,561 76.9 L,187 1,550 70.9
Nonmetropolitan 2,312 1,811 78.3 1,123 925 ..4 1.189 887 74.6
IWO-YEAR COLLEGES
Total . 2,772 1,538 55.5 1,1'9 678 57 5 1,593 860 54.016 and 17 years old 53 37 ,B) 26 19 13, 27 18 Bi18 and 19 years old 906 742 81.9 402 334 83.2 505 408 80.820 and 21 years old... . ... .. . 558 341 61.1 264 161 61.2 294 180 61.022 to 24 years old 402 174 43.2 179 95 52.9 224 79 35.425 to 29 years old 493 149 30.3 180 44 24.4 314 105 33.630 to 34 years old 358 95 26.6 129 7o 20.2 228 69 30.2Year.
First 1,362 790 58.0 576 :58 62.1 786 433 55.0Second 1,141 643 56.4 485 281 57.9 656 362 55.2Third 268 104 38.9 118 40 33.8 150 65 43.0Control:Public 2,516 1,349 53.6 1,092 621 56.9 1,424 728 51.1Private . 25o 189 73.9 87 58 66.0 168 131 78.0
Residence:
Metropolitan 2,006 1,077 53.7 832 447 53.7 1,175 630 53.6Inside central city 721 422 58.6 2E. 157 5,.8 439 265 60.4Outside central city. 1,285 655 51.0 550 290 52.8 736 365 49.6
Nonmetropolitan 765 460 60.1 347 231 60.5 418 230 54.9
FOUR-Yr...4 COLLEGES
Total ....... . .... ...,, ... . 5,958 5,041 84.6 3,010 2,572 85.5 2,948 2,468 83.716 and 17 years old 128 119 92.9 63 56 B 65 63 618 and 19 years old 1,887 1,824 96.7 881 851 96.7 1,006 972 96.720 and 21 years old
.: 1,967 1,853 94.2 1,009 956 94.7 958 898 93.722 to 24 years old 1,011 811 80.2 562 472 84.0 449 339 75.525 to 29 years old 664 320 48.1 359 186 51.7 305 134 43.930 to 34 years old 301 114 37.9 136 51 37.7 165 63 38.1Year
First 1,353 1,17E 87.1 651 583 89.6 702 595 84.8Second 1,374 1,200 87.3 663 585 88.2 711 615 86.5Third 1,590 1,289 81.1 769 642 83.5 820 646 78.8Fourth 1,642 1,374 83.7 927 762 82.2 715 612 85.6
Control:Public 4,377 3,664 83.7 2,283 1,922 84.2 2,094 1,742 83.2Private - 1,581 1,377 87.1 727 650 89.5 855 727 85.0
Resx...ence
Metropolitan 4,476 3,740 83.6 2,271 1,905 83.9 2,205 1,835 83.2
Inside central it 1,729 1,415 81.8 878 701 79.9 851 714 93.8
Outside central city 2,747 2,325 84.6 1,393 1,204 86.4 1,354 1,121 82.8
Nonmetropolitan 1,482 )001 87.8 739 667 90.3 743 633 85.3
First and second years 2,727 2, .78 87.2 1,314 1,168 88.9 1,412 1,210 85.716 and 17 years old.... ..... 124 115 92.7 59 52 B 65 63 818 and 19 years old 1,763 1,703 96.6 837 808 96.5 926 895 96.720 and 21 years old 409 359 87.7 225 198 87 9 184 161 87.422 to 24 years old 181 119 65.9 90 73 81.4 91 46 50.725 to 29 years old 164 53 32.5 65 25 11, 99 28 28 330 to 34 years old 86 29 33.4 38 12 8 47 17 8
Control.Public 1,960 1,680 85.7 979 857 87.5 981 823 83.9Private , 767 698 91.1 335 311 92.8 431 387 89.7
Residence.
Metropolitan 4,476 3,740 83.6 2,271 1,905 83.9 2,205 1,815 83.2Inside central city 1,729 1,415 81.i 878 701 79.9 851 714 83.8Outside central city 2,747 2,325 84.6 1013 1,204 86.4 1,354 1,121 82.8
Nonmetropolitan 1,482 1,301 87.8 739 667 90.3 743 633 85.3
TYPE OF COLLEGE NOT REPORTED
Total, 16 to 34 years old..., 367 262 71.3 184 141 76.9 184 121 65.7

54
Table 20. Year o High School Graduation For College Undergraduates 16 to 34 Years Old byType and Year of College and Sex: October 1985
(Number. thousands. Civilian noninstitutional population For meaning of symbols, see text)
Year and type ofcollege
Male Female
Total
Year of high school graduation Year of high school graduation
1985
1982
to
1984 1981
1980 or earlier
Under 26years old
Under 26years old
26 to 28years old
29 to 34years old
ALL COLLEGES'
Total 4,373 757 1,952 427 554 307 375 4,725 71'5 2,138 358 555 357 522First year 1,329 741 316 34 92 52 94 1,610 781 394 40 124 94 180Second year 1,190 13 821 83 103 71 101 1,396 13 903 76 149 109 147Third year 927 2 527 8C 146 79 87 1,003 1 565 92 116 93 134Fourth year 927 2 291 224 214 104 92 715 277 149 167 61 61
TWO-YEAR COLLEGES
Total 1,179 241 458 71 136 103 169 1,593 257 593 90 199 173 280First year 576 237 161 21 48 36 73 786 255 214 30 86 75 128Second year 485 4 258 39 62 50 73 656 2 335 49 87 69 115Third year 118 40 12 26 17 23 150 45 11 27 29 37
FOUR-YEAR L.'LLEGES
Total 3,010 467 1,422 345 386 195 195 2,948 482 1,482 260 333 175 217First year 651 461 130 9 23 11 16 702 473 154 7 20 13 35
Second year 6G3 4 538 37 38 21 26 711 9 550 24 58 39 31Third year. 769 464 76 112 58 60 820 501 79 87 62 90Fourth year 927 2 291 224 214 104 92 715 277 149 167 61 61
'Includes type not repor ed, not shown separately.
Table 21. Enrollment Status in 1984 for College Undergraduates 14 to 24 Years Old by Type ofCollege, Educational Attainment, Age, and Sex: October 1985
(Numbers in housands. Civilian noninstitutional population. For meaning of symbols, see text)
Age, years of college completed,and type of college
Both sexes Male Female
EnrolledOctober
NotenrolledOctober
EnrolledOctober
Notenrolled
OctoberEnrolledOctober
NotenrolledOctober
Total 1984 1984 Total 1984 1984 Total 1986 1984
ALL COLLEGES
Total 7,228 6,330 898 3,552 3,142 411 3,677 3,188 48914 to 17 years old.... . .. 261 244 18 132 119 13 129 125 5
18 to 19 years old. 2,908 2,709 199 1,349 1,250 100 1,559 1,460 9920 and 21 years old 2,586 2,'38 298 1,298 1,155 142 1,288 1,133 157
22 to 24 years old 1,475 1,090 384 775 618 157 699 472 227
Years of college completed,
None 2,464 1,981 483 1,184 957 227 1,281 1,023 2581 veRr or more 4,765 4,349 414 2,367 2,185 183 2,396 2,164 231
TWO-YEAR COLLEGES
Total 1,920 1,506 414 870 691 179 1,051 815 23614 to 17 years old 53 53 26 26 27 27 -
18 and 19 years old 906 828 78 402 367 35 505 462 4320 ano 21 years old 558 417 141 264 197 66 294 220 7522 to 24 years old.. .... 403 207 195 179 101 77 224 106 118
Years of college completed.
None 599 729 270 463 349 114 536 379 1571 year or more 921 777 144 406 342 65 515 435 79
FOUR-YEAR COLLEGES
Total 4,995 6,590 405 2,517 2,322 195 2,478 2,268 21014 to 17 years old 131 121 10 66 56 10 65 65 -
18 and 19 years old 1,887 1,785 '02 881 828 53 1,006 957 4920 and 21 years old 1,967 1,832 135 1,009 943 66 958 889 70
22 to 24 years old 1,011 853 158 562 495 67 449 358 91
Years of college completed:None 1,267 1,112 155 624 536 89 643 576 67
1 years or more 3,728 3,478 249 1,892 1,787 106 1,835 1,691 144
First and second year 2,480 2,228 251 1,213 1,084 129 1,266 1,144 12214 to 17 years old 127 117 10 62 52 10 65 65 -
18 and 19 years old 1,763 1,661 100 837 784 53 926 879 4120 and 21 years old 409 3 65 225 192 33 184 152 3322 to 24 years old 181 . s 76 90 56 34 91 49 42
Years of college completedNone 1,257 1,102 155 620 531 89 637 571 671 year or more 1,223 1,126 96 594 554 40 629 573 56
TYPE OF COLLEGE NOT REPORTED
Total, 14 to 24 years old 313 234 79 1E5 129 37 148 105 43

53
Table 22. College Undergraduates 14 to 34 Years Old by Type of College and Region:October 1985
(Numbers in thousands. Civilian noninstitutional population. For meaning of symbols, see text)
Age and -cgion
Enrolled Percent distribution
Total
Type of college
Total
Type of college
Twoyear
FOOT year
Not
reportedTwoyear
Four year
NotreportedTotal
First andsecond year
Third and
fourth year TotalFirst and
second yearThird and
fourth year
14 TO 34 YEARS OLD
United States 9,114 2,771 5,961 2,729 3,232 38" 100.0 100.0 100.0 100.0 100.0 100.0Northeast 2,038 514 1,427 721 706 97 22.4 18.5 23.9 26.4 21.8 25.4Midwest 2,345 606 1,635 755 880 104 25.7 21.9 27.4 27.7 27.2 27.2South 2,678 804 1,782 808 974 92 29.4 29.0 29.9 29.6 30.1 24.1West 2,053 848 1,117 444 673 88 22.5 30.6 18.7 16.3 20.8 23.0
14 TO 24 YEARS OLD
United States 7,229 1,920 4,995 2,480 2,515 314 100.0 100.0 100.0 100.0 100.0 100.0Northeast 1,724 389 1,249 668 581 86 23.8 20.3 25.0 26.9 23.1 27.4Midwest 1,834 386 1,362 668 694 86 25.4 20.1 27.3 26.9 27.6 27.4South 2,162 587 1,501 742 759 74 29.9 30.6 30.1 29.9 30.2 23.6West 1,508 558 883 401 482 67 20.9 29.1 17.7 16.2 19.2 21.1
25 TO 34 YEARS OLD
United States 1,885 851 966 249 717 68 100.0 100.0 100.0 100.0 100.0 (B)Northeast 314 125 178 53 125 11 16.7 14.7 18.4 21.3 17.4 (B)Midwest 511 220 273 87 186 18 27.1 25.9 28.3 34.9 25.9 (B)South 516 217 281 66 215 18 27.4 25.5 29.1 26.5 30.0 (B)West 545 290 234 43 191 21 28.9 34.1 24.2 17.3 26.6 (B)

56
Table 23. Marital Status of College Undergraduates 14 to 34 Years Old by Type of College,Attendance Status, Age, and Sex: October 1985
(Numbers in thousands. Civilian noninstitutional population. For meaning of symbols, see text)
Age, attendance status, andtype of college
Both sexes Male Female
Totalenrolled
Married spousepresent
Totalenrolled
Married, spousepresent
Totalenrolled
Married spousepresent
Number Percent Number Percent Number Percent
ALL COLLEGES
Total 9,114 1,3'4 14.8 4,385 582 13.3 4,728 765 16.214 to 19 years old 3,169 44 1.4 1,481 16 1.1 1,688 28 1 720 and 21 years old 2,586 131 5.1 1,298 43 3.3 1,288 83 6.822 to 24 years old 1,475 213 14, 775 95 12.3 699 118 16.925 to 34 years old 1,884 960 51.0 833 428 51.4 1,051 532 50.6
Attending full time 6,854 485 7.1 3,402 224 6.6 3,452 261 7.614 to 19 years old 2,900 36 1.2 1,362 14 1.0 1,537 21 1.420 and 2'. years old 2,237 86 3.8 1,140 36 3.2 1,098 50 4.622 to 24 years old 1,017 109 10.7 587 56 9.5 431 52 12.125 to 34 years old 701 255 36.4 315 117 '7.1 386 138 35.8
TWC-YEAR COLLEGES
Total 2,772 621 22.4 1,179 249 21.1 1,593 372 23.414 to 19 years old 959 16 1.7 428 2 0.5 532 14 2.620 and 21 years old 558 50 9.0 264 le 7.0 294 32 10.822 to 24 years old 403 82 20.3 179 34 18.9 224 48 21.425 to 34 years old 851 473 55.6 309 195 63.1 542 278 51.3
Attending full time 1,538 144 9.3 678 61 8.9 860 83 9.614 to 19 years old 779 10 1.3 353 2 0.6 426 7 1.620 and 21 years old 341 21 6.2 161 11 6.7 180 10 5.822 to 24 years old 174 27 15.4 95 16 17.4 79 10 12.925 to 34 years old 244 86 35.2 70 31 (8) 174 55 31.6
FOUR-YEAR COLLEGES
Total 5,961 664 11.1 3,012 311 10.3 2,948 353 12.014 to 19 years old 2,018 21 1.0 947 9 1.0 1,071 12 1.120 and 21 years old 1,967 75 3.8 i,009 25 2.5 958 50 5.222 to 24 years old 1,011 118 11.7 562 58 10.4 449 60 13.325 to 34 years old 965 450 46.6 495 218 44.0 470 231 49.1
Attending full time 5,043 317 6.3 2,575 156 6.1 2,468 161 6.514 to 19 years old 1,946 19 1.0 910 7 0.8 1,035 12 1.220 and 21 years old 1,853 61 3.3 956 25 2.6 898 36 4.022 to 24 years old 811 79 9.7 472 38 8.0 339 41 12.225 to 34 years old 434 158 36.4 237 86 36.3 197 72 36.5
First and second year 2,729 212 7.8 1,317 78 5.9 1,412 134 9.514 to 19 years old 1,890 19 1.0 899 9 1.0 991 10 1.02C and 21 years old 409 31 '.5 225 8 3.7 184 22 12.122 to 24 years old 181 29 .,.1 90 9 10.2 91 20 21.925 to 34 years old 250 133 53.2 103 52 50.5 146 82 56.2
Attending full time 2,380 87 3.7 1,171 31 2.7 1,210 56 4.714 to 19 years old 1,821 17 0.9 863 7 0.8 958 10 1.020 and 21 years old 359 25 7.0 198 8 4.2 161 17 10.322 to 24 years old 119 16 13.3 73 2 (8) 46 14 (3)25 to 34 years old 82 30 36.6 37 14 (B) 45 16 (B)
TYPE OF COLLEGE NO7 REPORTED
Total, 14 to 34 years old 381 62 16.3 194 22 11.4 187 40 21.4
P
rites

57
Table 24. Undergraduate Attendance Status of Primary Family Members 14 to 34 Years Old byEducational Attainment of Family Householder and Type and Control of College:October 1985
(In thousands. Civilian noninseieutional population. Excludes persons in families in which the householders are members of the Amer! %zees.Also excludes family members who are family householders and family members who are married, spouse present. For meaning of symbols,see text)
Type and control of collegeand attendarce status
Total
enrolled
Years of school completed by family householder
Elementary High school College
0 oo 4years
5 to 7years
8
years1 to 3
years4
years1 to 3
years4 yearsor more
. COLLEGES
Total 5,967 60 140 151 397 2,012 1,248 1,959Public 4,622 50 117 119 330 1,593 1,021 1,388Full time 3,902 45 89 89 254 1,315 853 1,255Part time 720 5 28 30 76 278 168 133Private 1,344 11 24 31 67 416 228 570rill time 1,248 7 i 27 61 375 217 546Part time 96 4 5 4 6 43 11 24
Male 5,014 51 104 120 292 1,634 1,021 1,793Full time 4,364 45 77 87 233 1,378 881 1,663Part time 650 7 26 33 59 255 139 129
Female 954 10 38 30 105 378 227 167Full time 787 8 30 28 83 311 189 140Part time. 166 2 7 1 22 67 37 28
TWO-YEAR COLLEGES
Total 1,546 22 56 56 123 608 376 306Public 1,420 18 50 50 112 559 351 279Full time 985 14 28 36 72 385 239 210Part time 435 4 22 14 40 174 112 69Private 126 4 7 6 11 49 25 26Full time 103 2 5 4 8 41 22 22Part time 23 2 2 2 3 8 3 4
Male 1,259 18 41 43 S 482 303 280Full time 896 14 22 29 58 343 214 217Part time 363 4 19 15 33 139 90 63
Female 288 4 15 12 32 126 73 26Full time 192 2 10 11 23 83 48 17Part tire. 95 2 5 1 9 43 25 10
FOUR-YEAR COLLEGES
Total 4,157 28 75 88 241 1,317 817 1,590Public 2,984 26 58 63 186 96/ 620 1,062Full time 2,735 25 54 50 156 876 574 999Part time 249 1 4 13 30 91 46 63Private 1,172 2 17 25 55 350 198 527Full time 1,103 2 14 23 52 317 190 507Part time 69 - 3 2 3 33 8 20
Male 3,541 23 56 70 181 1,083 675 1,454Full time 3,286 22 51 55 161 978 630 1,388Part time 256 1 1 15 20 105 44 65
Female 615 6 20 18 60 234 142 136Full time553 6 17 17 47 214 133 118Part time 62 - 2 - 13 20 8 18
First and second years 2,183 18 40 41 120 758 411 795Public 1,574 17 32 29 93 563 313 526Full time 1,450 17 29 27 79 511 294 492Part time 124 - i 2 14 52 19 34Private608 2 8 12 28 194 98 268Full time 586 2 8 12 26 184 95 261Part '.ime 22 - - 2 10 3 7
Male 1,833 13 29 3" 94 611 33: 723Full time 1,721 13 27 30 86 557 316 692Part time 113 - 2 2 7 53 16 31
Female349 6 11 9 26 147 79 72Full time 115 6 10 9 18 138 73 61Part time33 - - 8 9 6 10
TYPE OF COLLEGE NOT REPORTED
Total, 14 to 34 years old 264 1G 9 7 33 87 55 63
7

56
Table 25. Primary Family Members 18 to 24 Years Old Enrolled as Undergraduates by FamilyIncome, Marital Status, Type and Control of College, and Sex: October 1985
,ra thousands. Civilian noninstitutional population. Excludes persons in fam-lies in which the householders are members of the Armed Forces.For meaning of symbols, see text)
Type and control of college, sex,and marital status Total
Family income
Under $10,000 to $20,000 to 330,000 to $40,000 to 350,000 Notenrolled $10,000 $19,999 :129,999 $39,999 $49,999 .rd over reported
MARRIED, SPOUSE PRESENT
All colleges '76 79 121 93 49 15 10 10Control.
Public 323 71 105 70 47 12 7 10Private 51 7 15 22 1 4 3
Sex:
Male 151 36 57 27 16 8 4 3
Female 225 43 64 68 33 7 6 7
Two-year colleges .. . 147 23 60 39 21 2 2 2
Control.Public .... 137 22 S2 35 20 2 2 2
9 6 3 - - -
Sex.
Male.. ......... .... .. .. 54 11 24 16 4 - -
Female ..... . ... .. . ... . . 93 12 36 23 17 2 2 2
Four-year colleges .. .. .. 207 49 58 50 24 13 5 7
Control.
Fubli,... . ... . ... 172 42 50 35 24 10 5 7
Private . ... . . 34 7 9 15 - 4 -
Sex.
Male. . . . . . .. . ... 91 23 33 11 11 8 1 3
Female 116 26 25 39 13 5 4 4
First and ,econd years 76 13 25 14 15 10 1 2
ControlPublic 67 10 LO 13 14 8 1 2Private 10 2 5 1 - 2 -
Sex:
Male ... . . . . 26 13 2 7 5 -Female 50 13 12 12 8 3 1 2
Type of college not reported 22 7 3 4 4 - 3 1
OTHER MARITAL STATUS
All colleges 5,582 397 745 855 1,124 764 1,423 273Control:
Public 4,313 327 614 688 883 566 1.,035., 200Private 1,271 68 132 163 241 200 388 75
Sex
Male 2,782 170 357 417 53g 400 757 142Female 2,800 227 388 438 586 364 666 131
Two-year colleges . . . . 1,471 152 250 270 340 168 239 52Control.
Pt,b1 it . 1,347 133 230 249 316 151 216 51Private.. . . . . . . ... 125 18 20 22 22 16 23 2
Sex.
Male... . . . 688 47 127 126 149 /9 131 29Feralc .. ... . 783 105 123 144 191 89 108 23
Four -}car ,,,Ileg,s . . 3,923 221 471 563 751 574 1,157 135Contiol
Public... . . 2,[4 173 363 417 540 397 798 125P.1%ace.. . . . .... 1,169 47 109 146 211 179 359 60
Sc.
1,980 - . 211 277 375 309 607 881,943 109 260 24,6 376 265 550 97
rirst and s,cond years .. . 2,044 132 241 341 403 303 527 97Control
Public. 1,480 109 188 247 284 216 372 64564 24 51 9' 118 87 155 34
',ex.
1,011 64 105 159 189 171 281 431,033 68 136 182 2.4 132 246 54
r,,p, ,,.11,,4, not reported. . . 188 24 24 22 33 22 27 16
7

59Table 26. Enrollment Status for Persons 3 to 34 Years Old by Age, Sex, Race, Hispanic Origin, and Mexican Origin:
October 1984
(Niabers in thousands. Civilian noninstitutional population. For meaning of symbols. see text)
Age, stk. raceHispanic originand Mexican 0,Igin
Population
Enrolled Not enrolled
TotalBelow college
level'In
collegeTotal
High schoolgraduate
Not high schoolgraduate
Number Percent Number Percent Number Percent Number Percent Number Percent Number Percent
,11. RACES
Both sexes 119,740 57,313 47.9 46,453 3R.8 10,859 9.1 62,428 52.1 47,308 39.5 15,120 12.63 and 4 years old 7,188 2,608 36.3 2,608 36.3 - 4,580 63.7 - 4,580 63.75 and 6 years old 6,698 6.332 94.5 6,332 94.5 366 5.5 366 5.57 to 9 years old. 9,632 9,539 99.0 9,539 99.0 - 92 1.0 92 1.010 to 13 years old 13,401 13,315 99.4 13,315 99.4 - 86 0.6 - - 86 0.614 and 15 years old 7,390 7.229 97.8 7,223 97.7 6 0.1 161 2.2 5 0.1 157 2.116 and 17 years old 7,173 6,561. 91.5 6,317 88.1 247 3.4 509 8.5 124 1,7 485 6.818 and 19 years old 7,428 3,724 50.1 857 11.5 2,867 38.6 3,706 49.9 2,575 34.7 1,129 15.220 and 21 years old 7,959 2,699 33.9 102 1.3 2,597 32.6 5,260 66.1 4,092 51.4 1,168 14.722 to 24 years old 12,644 2,187 17.3 60 0.5 2,127 16.8 10,457 82.7 8,612 68.1 1,845 14.625 to 29 years old 20,995 1,906 9.1 49 0.2 1,857 8.8 19,089 90.9 16,230 77.3 2,861 13.630 to 34 years old 19,232 1,209 6.3 51 0.3 1,158 6.0 18,023 93.7 15,670 81.5 2,353 12.2
Male 59,746 29,334 49.1 23,821 39.9 5,513 9.2 30,412 50.9 22,673 37.9 7,739 13.03 and 4 years old 3,676 1,320 35.9 1,320 35.9 - 2,356 64.1 - 2,356 64.15 and 6 years old 3,625 3,220 94.0 3,220 94.0 - 204 6.0 204 6.07 to 9 years old 4,926 4,866 98.8 4,866 98.8 - 59 1.2 59 1.210 to 13 years old 5,848 6,799 99.3 6,799 99.3 - 49 0.7 - 49 0.714 and 15 years old 3,768 3,673 97.5 3,671 97.4 2 0.1 95 2.5 3 0.1 91 2.416 and 17 years old 3,643 1 345 91.8 3,256 89.4 89 2.5 298 8.2 44 1.2 254 7.018 and 19 years old 3,674 924 52 4 551 15.0 1,373 37.4 1,750 47.6 1,156 31.5 594 16.220 and 21 years old 3,880 1,405 '6.2 68 1.7 1,337 34.5 2,475 63.8 1,830 47.2 645 16.622 to 24 years old 6,190 1,246 2t.1 27 0.4 1,219 19.7 4,944 79.9 3,999 64.6 945 15.525 to 29 years old 10,303 987 9.c 22 0.2 965 9.4 9,316 90.4 7,923 76.) 1,393 13.530 to 34 years old 9,414 548 5.8 21 0.2 527 5.6 8,866 94 7,71,', 82.0 1,148 12.2
Female 59,995 27,978 46.6 22,632 37.7 5,347 8.9 32,015 53.4 24,635 41.1 7,380 12.33 and 4 years old 3,512 1,287 36.7 1,287 36.7 - 2,224 63.3 - - 2,224 63.35 and 6 years old 3,273 3,112 95.1 3,112 95.1 - 161 4.9 161 4.97 to 9 years old 4,706 4,673 99.3 4,673 99.3 - 33 0.7 33 0.710 to 13 years old 6,553 6,,17 99.4 6,517 99.4 - 37 0.6 - 37 0.614 and 15 years olf 3,622 3,555 98.2 3,552 98.1 3 0.1 67 1.8 1 65 1.816 and 17 years old 3,530 3,219 91.2 3,061 86.7 158 4.5 311 8.8 81 2.3 230 6.518 and 19 years old 3,754 1,800 48.0 306 8.1 1,494 39.8 1,954 52.0 1,419 37.8 535 14.320 and 21 years old 4,079 1,294 31.7 34 0.6 1,260 30.9 2,785 68.3 2,262 55.5 523 12.822 to 24 years old 6,454 941 14.6 33 0.5 908 14.1 5,,13 85.4 4,613 71.5 900 13.925 to 29 years old 10,692 919 8.6 27 0.3 892 8.3 9,773 91.4 8,307 77.7 1,466 13.730 to 34 years old 9,818 660 6.7 30 0.3 630 6.4 ),158 93.3 7,952 81.0 1,205 12.3
WHITE
Both exes 99,237 46,941 47.3 37,673 38.0 9,269 9.3 52,296 52.7 40,280 40.6 12,017 12.13 and 4 years old 5,782 2,081 36.0 2,081 36.0 - 3,701 64.0 - - 3,701 64.05 and 6 years old 5,423 5,133 94.6 5,133 94.6 - 291 5.4 - - 291 5.47 to 9 years old10 to 13 years old
7,84310,900
7,76510,831
99.099.4
7,765
10,831
99.0
99.4-
-
79
69
1.0
0.6
- - 79
69
1.0
0.614 and 15 yelrs old 6,057 5,924 97.8 5,920 97.7 4 0.1 133 2.2 5 0.1 129 2.111 and 17 years old 5,909 5,391 91.2 5,186 87.8 205 3.5 518 8.8 97 1.6 421 7.118 and 19 years old 6,139 3,135 51.1 594 9.7 2,541 41.4 3,004 48.9 2,091 34.1 913 14.920 and 21 years old 6,611 2,264 34.3 58 0.9 2,206 33.4 4,347 65.7 3,40' 51.5 939 14.222 to 24 years old 10,597 1,819 17.2 41 0.4 1,779 16.8 8,778 82.8 7,349 69.4 1,429 13.525 to 29 years old 17,693 1,604 9.1 38 0.2 1,566 8.9 16,089 90.9 13,838 78.2 2,251 12.730 to 34 years old 16,282 995 6.1 28 0.2 967 5.9 15,287 93.9 13,491 82.9 1,796 11.0
Male 49,834 24,078 48.3 19,369 38.9 4,709 9.4 25,756 51.7 19,530 i9.2 6,226 12.53 and 4 years old 2.944 1,055 35.8 1,055 35.8 - 1,890 64.2 - - 1,890 64.25 and 6 years old 2,789 2,626 94.- 2,626 94.1 - 164 5.9 - 164 5.97 to 9 years, old 4,015 3,962 98.7 3,962 98.7 - 53 1.3 - 53 1.310 ,o 13 years o:d 5,599 5,561 99.3 5,561 99.3 - 38 0.7 - 38 0.714 and 15 ycais old 3,1u3 3,029 97.6 3,026 97.5 2 0.1 74 2.4 3 0.1 71 2.316 and 17 years old 3,006 2,750 91.5 2,679 89.1 71 2.4 256 8.5 35 1.2 221 7.318 and 19 year% old 3,047 1,603 52.6 378 12.4 ./24 40.2 1,444 47.4 965 31.6 480 15.820 and 21 yews old 3,242 1,177 36.3 34 1.0 1,143 35.3 2,065 63.7 1,549 47.8 516 15.922 to /4 years old 5,232 1,055 20.2 17 0.3 1,039 19.9 f,177 79.8 3,428 65.5 748 14.325 to 29 years old 8,770 811 9.2 15 0.2 796 9.1 7,959 90.8 6,823 77.8 1,137 13.030 to 34 year% old 8,086 449 5.6 16 0,2 434 5.4 7,6,7 94.4 6,728 83.2 909 11.2
Female 49,403 22,863 46.3 18,304 37.0 4,559 9.2 ,,540 53.7 20,749 42.0 5,791 11.73 and 4 years old 2,838 1,026 36.1 1,026 36.1 - 1,312 63.9 - - 1,812 63.95 and 6 years old 2,634 2,507 95.2 2,507 95.2 - 1E7 4.8 - - 127 4.87 to 9 years old 3,828 3,302 99.3 3,80. 99.3 /6 0.7 - 26 0.710 to 13 years old 5,301 5,270 )9.4 5,270 99.4 - 31 0.6 31 0.614 and 15 years old 2,954 2,895 V8.0 2,893 97.9 2 0.1 59 2.0 1 58 2.016 and 17 years old 2,903 2,641 91.0 2,507 86.4 134 4.6 262 9.0 62 2.1 200 6.918 and 19 years old 3,092 1,532 49.6 215 7.0 1,317 42.6 1,560 50.'4 1,127 36.5 432 14.020 and 21 years old 3,369 1,087 32.3 24 9.7 1,063 31.6 2,282 67.7 1,858 55.2 423 12.622 V. '4 years old 5,365 765 14.2 24 0.4 740 13.8 4,601 85.8 3,921 73.1 680 12.725 to 29 year% old 8,923 793 8.9 /3 0.3 770 8.6 8,130 91.1 7,016 78.6 1,114 12.530 to 34 years old 8,196 545 6.7 12 0.i 533 6.5 7,651 93.3 6,7b4 82.5 887 10.8
Sec footnotes at o.d of table.
7 2,

60
Table N. Enrollment Status for Persons 3 to 34 Years Old by Age, Sex, Race, Hispanic Origin, at d Mexican Origin:
October 1984-Continued
(Numbers in thousands. Civilian noninstitutional population. For meaning of symbols, see text)
Age, sex, race,Hispanic origin,and Mexican origin
Population
Enrolled Not enrolled
TotalBelow college
level'In
collegeTotal
High schoolgraduate
Not high schoolgraduate
Number Percent Number Percent Number Percent Number Percent Number Percent Number Percent
BIACK
Both sexes 16,414 8,226 50.1 7,089 43.2 1,138 6.9 8,188 49.9 5,670 34.5 ',518 15.3
3 and 4 years old 1,131 432 38.2 432 38.2 - 699 61.8 - 699 61.8
5 and 6 years old 1,001 941 94.1 941 94.1 - 59 5.9 - 59 5.9
7 to 9 years old 1,435 1,428 99.5 1,428 99.5 - - 7 0.5 7 0.5
10 to 13 years old 2,016 2,001 99.3 2,001 99.3 - - 15 0.7 - 15 0.7
14 and 15 years old 1,077 1,055 97.9 1,054 97.8 2 0.1 22 2.1 - 22 2.1
16 and 17 years old 1,061 981 92.4 943 88.9 38 3.6 80 7.6 25 2.4 55 5.2
18 and 19 years old 1,092 /93 44.3 218 20.0 265 24.3 609 55.7 423 38.8 186 17.0
20 and 21 years old 1,115 )8 27.7 34 .,.1 274 24.6 807 72.3 619 55.6 187 16.8
22 to e4 years old 1,655 G59 15.7 12 0.7 247 14.9 1,396 84.3 1,057 63.8 339 20.5
25 to 29 years old 2,578 191 7.4 9 0.4 182 7.0 2,387 92.6 1,889 73.3 498 19.3
30 to 34 years old 2,253 147 6.5 16 0.7 131 5.8 2,106 93.5 1,656 73.5 451 20.0
Male 7,876 4,142 52.6 3,598 45.7 544 6.9 3,735 47.4 2,499 31.7 1,236 15.7
3 and 4 years old 571 212 37.2 212 37.2 - 358 62.8 - - 358 62.8
5 and 6 years old 503 467 92.8 467 92.8 - 36 7.2 36 7.2
7 to 9 years old 724 720 99.5 720 99.5 4 0.5 4 0.510 to 13 years old 1,014 1,005 99.1 1,005 99.1 - - 9 0.9 - 9 0.9
14 and 15 years old 545 528 96.9 523 96.9 - - 17 3.1 - 17 3.1
16 and 17 years old 529 493 93.2 478 90.3 16 2.9 36 6.8 7 1.3 29 5.5
18 and 19 years old 524 255 48.6 143 27.3 117 21.3 269 51.4 166 31.7 103 19.7
20 and 21 years old 516 153 29.7 24 4.7 129 25.0 363 70.3 259 50.1 104 20.2
22 to 24 years old 771 135 17.5 8 1.1 126 16.4 636 82.5 480 62.4 155 20.2
25 to 29 years old 1,169 106 9.1 7 0.6 99 8.5 1,063 90.9 849 72.6 214 18.3
30 to 34 years old 1,010 66 6.6 4 0.4 62 6.2 944 93.4 738 75.1 205 20.3
Female 8,538 4,085 47.8 3,491 40.9 594 7.0 4,453 52.2 3,170 37.1 1,283 15.0
3 and 4 years old 560 220 39.2 220 39.2 - 340 60.8 - 340 60.8
5 and 6 years old 497 474 95.3 474 95.3 23 4.7 23 4.7
7 to 9 years old 711 708 99.5 708 99.5 - - 4 0.5 4 0.5
10 to 13 years old 1,001 996 99.4 996 99.4 - - 6 0.6 - 6 0,6
14 and 15 years oil 53- 527 99.0 525 98.7 2 0.3 5 1.0 - 5 1.0
16 and 17 years old 532 488 91.7 465 87.5 22 4.2 44 8.3 18 3.4 26 4.9
18 and 19 years old 568 229 40.3 75 13.3 153 27.0 340 59.7 257 45.3 82 14.5
20 and 21 years old 599 155 25.9 10 1.6 145 24.2 444 74.1 361 60.2 83 13.9
22 to 24 years old 885 124 14.1 4 0.4 121 13.6 760 85.9 576 65.1 184 20.8
25 to 29 years old 1,409 84 6.0 2 0.1 83 5.9 1,324 94.0 1,041 73.9 284 20.1
30 to 34 years old 1,243 80 6.5 12 0.9 69 5.5 1,163 93.5 917 73.8 245 19.1
HISPANIC ORIGIN'
Both sexes 8,982 4,284 47.7 3,760 41.9 524 5.8 4,698 52.3 2,286 25.5 2,412 26.8
3 and 4 years old 621 151 24.2 151 24.2 470 75.8 - - 470 75.8
5 and 6 years old 585 549 93.9 549 93.9 36 6.1 36 6.1
7 to 9 years old 863 852 98.7 852 98.7 11 1.3 11 1.3
10 to 13 years old 1,119 1,112 99.4 1,112 99.4 - - 7 0.6 - 7 0.6
14 and .3 years old 539 512 94.9 512 94.9 - - 27 5.1 - - 27 5.1
16 and 17 years old 540 463 85.7 458 84.8 5 1.0 77 14.3 6 1.1 71 13.2
18 and 19 years old 561 224 39.9 87 15.6 136 24.3 337 60.1 191 34.0 146 26.1
20 and 21 years old 527 148 28.1 15 2.8 133 25.2 379 '1.9 192 36.5 187 35.4
'2 to 24 years old 930 105 11.3 13 1.4 93 10.0 825 88.: 467 50.' 358 ?S.4
25 to 29 /ears old 1,504 107 7.1 7 0.5 100 6.7 1,396 92.9 796 52.9 601 39.9
30 to 34 years old 1,194 62 5.2 5 0.4 57 4.8 1,132 94.8 635 '3.1 498 41.7
Male 4,446 2,161 48.6 1,'29 43.4 232 5.2 2,285 51.4 1,084 24.4 1,201 27.0
3 and 4 years old 300 60 20.0 60 20.0 - - 240 80.0 - 240 d0.0
5 and 6 years old 315 795 93.6 295 93.6 20 6.4 20 6.4
7 to 9 years old 410 403 98.2 403 98.2 7 1.8 7 1.8
10 to 13 years old 596 596 100.0 596 100.0 - - - - - - -
14 and 15 years old 290 278 95.7 278 95.7 - - 12 4.3 - 12 4.3
16 and 17 years old 269 229 85.1 227 84.3 2 0.8 40 14.9 3 1.2 37 13.6
18 and 19 years old 249 97 38.8 1-.5 21.9 42 16.9 153 61.2 37 35.0 65 26.2
20 and 21 years old 259 11 27.5 9 3.3 63 24.1 188 72.5 89 34.3 99 38.2
22 to 24 years old 448 55 12.3 6 1.3 49 11.0 393 87.7 ;19 48.9 174 38.8
25 to 29 years old 743 51 6.9 2 0.3 49 6.6 692 93.1 3)6 53.4 295 39.7
30 to 34 years old 567 26 4.6 - - 76 4.6 541 95.4 2E9 51.1 251 44.3
Female 4,536 2,124 46.8 1,831 40.4 292 6.4 2,412 53.2 1,2C2 26.5 1,211 26.7
3 and 4 years old 321 91 28.2 91 28.2 - - 231 71.8 71.8
5 and 6 years old, 269 254 94.2 254 94.2 16 5.8 15 5.8
7 to 9 years old 453 449 99.2 449 99.2 3 0.8 3 0.8
10 to 13 years old 523 516 98.7 516 98.7 - - 7 1.3 - - 7 1.3
14 and 15 years old 249 234 94.0 234 94.0 - - 15 6.0 - - 15 6.0
16 and 17 years old 271 234 86.3 231 85.2 3 1.1 37 13.7 3 1.0 34 12.7
18 and 19 years old 311 127 40.8 33 10.5 94 30.2 184 59.2 103 33.2 81 26.0
20 and 21 years old 268 77 28.7 6 2.4 70 26.3 191 71.3 103 38.6 88 32.7
22 to 24 years old 482 50 10.4 7 1.4 43 9.0 432 89.6 248 51.5 184 38.1
25 to 29 years old 761 56 7.4 5 0.7 51 6.7 705 92.6 359 52.4 306 40.2
30 to 34 years old 628 36 5.7 5 0.8 31 4.9 592 94.3 345 55.0 247 39.3
See footnotes at end of table.

61
Table 26. Enrollment Status for Persons 3 to 34 )(ears Old by Age, Sex, Race, Hispanic Origin, and Mexican Crigin:
October 1984-Continued
(Numbers in thousands. Civilian noninstitutional population. For meaning c; symbols, see text)
Age, sex, race,Hispanic origin.and Mexican origin
Population
Enrolled Not enrolled
TotalBelow college
level'In
collegeTotal
High schoolgraduate
Not high schoolgraduate
Number Percent Number Percent Nmmber Percent Number Percent Number Percent Number Percent
MEXICAN ORIGIN'
Both sexes 5,877 c,791 47.5 2,543 43.3 248 4.2 3,086 52.5 1,331 22.7 1,755 29.93 and 4 years old 430 100 23.3 100 23.3 330 76.7 330 76.75 and 6 years old 412 387 94.0 387 94.0 25 6.0 25 6.07 to 9 years old 598 593 99.2 593 99.2 5 0.8 5 0.810 to 13 years old 759 754 99.3 754 99.3 5 0.7 5 0.714 and 15 years old 363 341 93.7 341 93.7 23 6.3 23 6.316 and 17 years old 356 292 82.0 290 81.4 2 0.6 64 18.0 3 0.9 61 17.118 and 19 years old 350 129 36.7 49 13.9 80 22.8 221 63.3 123 35.0 99 '8.320 and 21 years old 335 71 21.2 11 3.3 60 17.9 264 78.8 118 35.1 147 43.722 to 24 years old 585 46 7.8 11 1.9 14 5.8 540 92.2 279 47.6 261 44.625 to 29 years old 954 48 4 0.4 44 4.6 906 95.0 472 49.5 434 45.530 to 34 years old 734 31 4.2 3 0.5 28 3.8 703 95.8 337 46.0 366 49.8
Male 2,950 1,409 47.8 1,301 44.1 108 3.7 1,541 52.2 638 21.6 903 30.63 and 4 years old 212 41 19.5 41 19.5 171 80.5 171 80.55 and 6 years old 224 210 94.0 210 94.0 13 6.0 13 6.07 to 9 years old 279 276 99.0 276 99.0 3 1.0 3 1.010 to 13 years old 406 406 100.0 406 100.014 and 15 years old 197 189 95.7 189 95.7 9 4.3 9 4.316 and 17 years old 174 137 79.2 135 77.9 2 1.3 36 20.8 3 1.9 33 18.518 and 19 years old l4 52 33.9 30 19.5 22 14.3 102 66.1 54 35.1 48 31.020 and 21 years old 173 39 22.5 5 2.6 34 19.9 134 77.5 60 34.8 74 42.722 to 24 years cld 294 27 9.3 6 2.0 21 7.3 267 90.7 135 45.8 132 44.925 to 29 years old 477 18 3.7 2 0.4 16 3.3 460 96.3 230 48.1 230 48.230 to 34 years old 360 13 3.5 13 3.5 348 96.5 156 43.4 191 53.1
Female 2,927 1,381 47.2 1,242 42.4 140 4.8 1,545 52.8 694 23.7 852 29.13 add 4 years old 217 59 2,.0 59 27.0 159 73.0 159 73.05 and 6 years old 188 177 95.9 177 93.9 11 6.1 11 6.17 to 9 years old 319 317 99.4 317 99.4 2 0.6 2 0.610 to 13 years old 353 347 98.5 347 98.5 5 1.5 5 1.514 and 15 years old 166 152 91.4 152 91.4 14 C.6 14 8.616 and 17 years old 182 154 84.7 154 84.7 28 15,3 28 15.318 and 19 years old 196 76 38.9 19 9.5 58 29.4 120 61.1 69 34.9 51 26.170 and 21 years old 163 32 19.7 6 3.9 26 15.8 131 80.3 58 35.5 73 44.722 to 24 years old 291 18 6.3 6 1.9 13 4.4 273 93., 144 49.4 129 44.425 to 29 years old 477 30 6.3 2 D.4 28 5.9 447 93.7 242 50.8 204 42.830 to 2; years old 374 19 5.0 0.9 15 4.1 355 95.0 181 48.4 174 46.6
'Includes nursery school, kindergarten, and grades 1 to 12.'May be of any race.
4 'A
Lio

62
Tat** 27. Level of Enrollment for Persons 3 to 34 Years Old by Control of School, Sex, Race, 1ispanic Origin, and Mexican
Origin: October 1984
(In thousands. Civilian noninatitutional population. For meaning of symbols, see text.
Sex, control of school, race, Hispanicorigin, and Mexican origin
Enrolled below college level Enrolled in college (ye,.)
TotalNurseryschool
Kinder-garten
Grades1 to 6
Grades7 and 8
Grades9 to 12 Total land 2 3 and 4 5 or more
ALL RACES
Total 46,453 2,354 3,484 19,868 6,970 13,777 10,859 5,471 3,580 1,802Public 40,554 761 2,953 17,748 6,372 12,721 8,467 4,432 2,810 1,225Male 20,882 387 1,528 9,107 3,327 6,533 4,289 2,157 1,480 651Female 19,673 373 1,425 8,641 3,045 6,188 4,178 2,275 1,330 574
Private 5,899 1,593 531 2,120 59: 1,057 2,392 1,046 770 576Male 2,940 814 269 1,062 287 508 1,224 495 373 356Female. 2,959 780 261 1,058 311 549 1,168 551 397 221
WHITE
Total 37,673 1,915 2,788 16,0/9 5,711 11,240 9,269 4,632Public 32,409 543 2,319 14,134 5,148 10,266 7,163 3,716 1,072
Male 16,730 276 1,203 7,268 2,697 5,286 3,630 1,795 559Female 15,680 267 1,117 6,866 2,451 4,979 3,533 1,921 ,J9 513
Private ,263 1,372 469 1,886 563 974 2,105 917 679 509Male 2,639 705 233 968 267 466 1,079 442 330 308Female 2,624 667 237 918 296 508 1,026 475 350 201
BLACK
Total 7,089 340 563 3,093 1,030 2,061 1,138 651 366 121Public 6,641 179 513 2,941 1,006 2,002 918 537 295 86Male 3,380 86 260 1,493 527 1,015 440 256 :29 56Female 3,261 94 253 1,448 479 987 477 281 16u 30
Private 448 161 51 153 24 59 220 114 71 35Male 218 82 30 58 19 3U 103 47 32 25
Female 230 79 20 95 6 29 117 67 40 11
HISPANIC ORIGI'
Total 3,760 117 293 1,809 575 966 524 325 138 61Public 3,472 78 267 Lou, 532 909 4... 287 104 42Male 1,817 37 130 858 313 479 203 126 55 22Female 1,655 41 137 828 219 430 230 161 49 20
Private 288 39 26 123 43 57 91 37 34 19
Male 112 15 9 58 16 13 29 6 10 12Female 176 24 17 65 27 44 62 31 24 7
MEXICAN ORIGIN'
Total 2,543 79 208 1,271 369 616 248 180 52 16
Public 2,389 57 189 1,206 349 589 223 163 46 14
Male 1,240 29 96 609 211 295 104 73 25
Female 1,149 28 93 597 138 294 119 90 21 7Private 153 22 19 65 20 27 25 17 5 2
Male 61 7 :0 7 10 4 2 2
Female 93 15 12 3: 14 17 21 15 3 2
'May be of any race.

63
Table 28. Level of Enrollment for Persons 3 Years Old and Over, by Age and Sex: October 1984
(Numbers in thousand;. Civilian noninstitutional population. For meaning of symbols, see text)
Age and sex
Population
Enrolled
Nurseryschool
Kinder-garten andelementary
High
school
College (year)
Number Percent Total 1 and 2 3 and 4 5 or more
Both sexes 221,268 58,879 26.6 2,354 30,323 13,902 12,310 15,479 '3,583 '1.8023 and 4 years old 7,188 2,608 36.3 2,187 420 - - - - -5 to 13 years old 29,731 29,186 98.2 166 28,706 316 - - - -14 to 17 years old 14,563 13,793 94.; - 1,179 12,361 254 249 5 -18 and 19 years oh. 7,42P 3,724 50.1 2 854 2,869 2,749 120 -20 and 21 years old 7,959 2,699 33.9 4 99 2,597 881 1,684 3222 to 24 years old 12,644 2,187 17.3 3 58 2,128 612 936 58025 to 29 years old 20,995 1,906 9.1 4 44 1,857 605 544 70830 to 34 years old 19,232 1,209 6.3 5 47 1,159 383 294 48235 to 39 years old 16,983 668 3.9 238 630 (NA) (NA) (NA)40 to 44 years old 13,640 414 3.0 227 388 (NA) (NA) (NA)45 to 49 years old 11,379 188 1.7 229 160 (NA) (NA) (NA)50 to 54 years old 10,867 130 1.2 25 145 (NA) (NA) (NA)55 to 64 years old 22,052 119 0.5 - 215 105 (NA) (NA) (NA)65 years old and ove. 26,607 47 0.2 - 29 38 (NA) (NA) (NA)
Male 106,525 29,859 28.0 1,201 15,577 7,093 5,990 '2,652 '1,856 11,0073 and 4 years old 3,676 1,320 35.9 1,111 209 - - - - -5 to 13 years old 15,199 14,885 97.9 90 14,650 144 - - -14 to 17 years old 7,411 7,018 04.7 - 708 6,218 92 91 1 -18 and 19 years old 3,674 1,924 52.4 - 2 549 1,374 1,320 54 -20 and 21 years old 3,860 1,405 36.2 - 4 65 1,337 455' 860 1822 to 24 years old 6,190 1,246 20.1 - 3 24 1,220 345 530 34525 to 29 years old 10,303 987 9.6 - - 21 964 289 275 40030 to 34 years old 9,414 548 5.8 - 1 21 528 148 136 24435 to 39 years old 8,272 241 2.9 - - 214 227 (NA) (NA) (NA)40 to 44 years old 6,632 149 2.2 - 212 137 (NA) (NA) NA)45 to 49 years old 5,517 5i 1.0 - - 216 41 (NA) (NA) (NA)50 to 54 years old 5,218 24 0.5 - 24 (NA) t ) (NA)55 to 64 years old 10,284 44 0.4 - - 27 37 (NA) (NA) (NA)65 years old and over 10,856 11 0.1 - - 22
9 ;NA) (NA) (NA)
Femal t 114,743 2',020 25.3 1,153 14,7,46 6,809 6,320 12,£27 11,727 17953 and 4 years old 3,512 1,287 36.7 1,076 211 - - - - -5 to 13 years old 14,532 14,302 98.4 76 14,056 172 - - - -14 to 17 years old 7,152 6,774 94.7 - 471 6,143 162 158 4 -1E and 19 years old 3,754 1,800 47.9 - - 305 1,495 1,429 66 -20 and 21 years old 4,079 1,294 31.7 - - 34 1,260 422 824 1422 to 24 Years old 6,454 941 14.6 - 34 908 267 406 23525 to 29 years old 10,692 919 8.6 - 4 23 893 316 269 30830 to 34 years old 9,818 660 6.7 - 4 26 631 235 158 23835 to 39 years old 8,711 428 4.9 224 404 (NA) (NA) (NA)40 to 44 years old 7,008 26( 3.8 - 115 251 (NA) (NA) (NA)4. to 49 years old 5,862 132 2.3 - 213 119 (NA) (NA) (NA)50 to 54 years old 5,649 106 1.9 - 25 101 (NA) (NA) (NA)55 to 64 years old 11,768 75 0.6 - 28 67 (NA) (NA) (NA)65 years old and over 15,751 36 0.2 - 22 29 (NA) (NA) (NA)
'Data are for students 3 to 34 years old only.2Includes persons in elementary and high school.
or"

64
Table 29. Attendance Status for Nursary School and KL.dergarten Students 3 to 6 Yea's Old by Level and Control ofSchool, Age, Race, and Hispanic Origin: October 1984
(m= , ,n thousands. Civilian noninstitutional population. For meaning of symbols, see te,c)
Level and control ofschool, rge, race, andHispanic origin
Both sexes Male Female
Totalenrolled
Attending full day
Total
enrolled
Attending full day
Totalenrolled
Attending full day
Number Percent Number Percent Number Percent
ALL RACES
Total 5,838 2,058 35.3 2,998 1,037 34.6 2,840 1,022 36.03 years old 1,004 402 40.0 517 217 42.0 487 184 37.84 years old 1,603 521 32.5 803 250 31.1 800 271 33.S5 years old 2,872 1,007 35.1 1,461 508 34.8 1,412 499 35.46 years old 358 129 36.1 217 62 28.5 141 67 47.9
Level and control:Nursery school. 2,354 798 33.9 1,201 406 33.8 1,153 392 34.0
Public 761 256 33.7 387 118 30.5 373 138 37.0Private 1,593 542 34.0 814 288 35.4 780 253 32.5
Kindergarten 3,484 1,260 36.2 1,797 630 35.1 1,687 630 37.4Public 2,953 1,025 34.7 1,528 516 33.8 1,425 509 35.7Private 531 235 44.4 269 115 42.5 261 121 46.2
WHITE
Total 4,703 1,422 30.2 2,417 710 29.4 2,286 712 31.13 years old 766 248 32.4 379 125 32.9 388 123 31.84 years old 1,314 361 27.5 676 189 27.9 638 172 27.05 years old 2,330 721 30.9 1,181 354 29.9 1,149 367 32.06 years old 292 92 31.5 181 43 23.8 111 49 43.9
Level and control:Nursery school 1 915 541 28.3 981 283 28.9 934 258 27.6
Public ) 1 150 27 6 276 66 24.0 267 83 31.3Privet, 1,372 391 : .5 705 217 30.8 667 174 26.1
Kindergarten 2,788 881 31.6 1,436 426 29.7 1,352 454 33.6Public 2,319 685 29.5 1,203 336 27.9 1,117 349 31.3Private 469 196 41.8 233 91 39.0 236 105 44.5
BLACK
Total 904 540 59.7 458 2/5 60.1 446 264 59.33 years old 191 131 68.8 107 75 69.9 84 56 67.44 years old 241 140 57.8 106 55 52.2 136 84 62.25 years old 413 234 56.6 212 127 59.7 201 107 53.46 years old 59 35 (13) 34 19 (13) 25 16 (B)
Level and control:Nursery school 340 210 61.6 167 98 58.6 173 111 64.5
Public 179 91 50.9 86 42 4C.6 94 50 52.9Private 161 118 73.6 82 57 69.0 79 62 78.2
Kindergarten 563 330 58.6 291 177 61.0 273 153 56.0Public 513 297 57.9 260 154 59.3 253 143 56.4Private 51 33 (8) 30 23 (13) 20 10 (B)
HISPANIC ORIGIN'
Total 410 187 45.5 192 75 39.2 218 112 51.1
'May be of sny race.
4 a
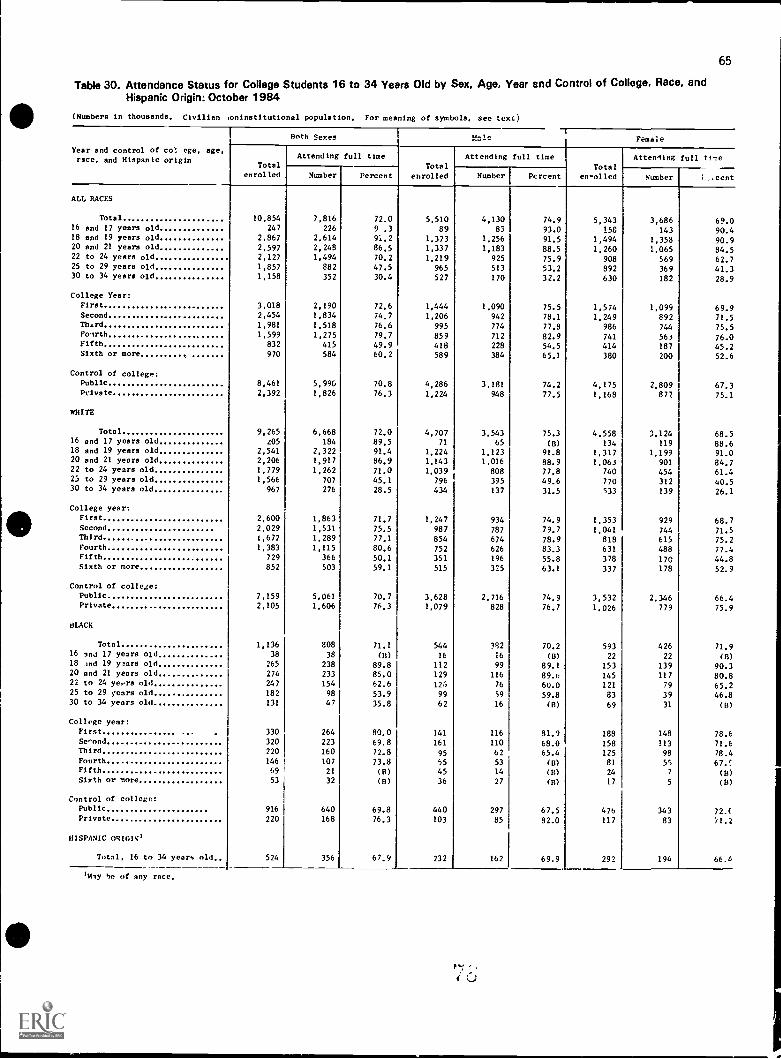
Table 30. Attendance Status for College Students 16 to 34 Years Old by Sex, Age, Yearend Control of College, Race, and
Hispanic Origin: October 1984
(Numbers in thousands, Civilian .oninstitutional population, For meaning of symbols, see text)
Year and control of co'. ege, age,race, and Hispanic origin
Both Sexes
65
Female
Total
enrolled
Attending full time Attending full time Attending full timeTotal Total
Number Percent enrolled Number Pcrcent enolled Number ..cent
ALL RACES
Total
16 and 17 years old18 and 19 years old20 and 21 years old22 to 24 years old25 to 29 years old30 to 34 years old
College YearFirst
SecondThirdForthFifthSixth or more
Control of college:Public
Private
WHITE
Total16 and 17 years old18 and 19 years old20 and 21 years old22 to 24 years old25 to 29 years old30 to 34 years old
College yearFirst
SecondThirdFourthFifth
Sixth or tore
Control of college:PublicPrivate
BLACK
Total16 and 17 years old18 and 19 years old20 and 21 years old22 to 24 yeprs old25 to 29 years old30 to 34 years old
College year:First
SeeondThirdFourthFifth
Sixth or tore
Control of college:Public
Private
HISPANIC ORIGIN'
Total, 16 to 34 years old..
10,854247
2,867
2,597
2,1271,857
1,158
3,0182,454
1,981
1,599
832
970
7,816 72.0 5,510 4,130 74.9 5,343 3,686 69.0226 9 .3 89 83 93.0 158 143 90.4
2,614 9...2 1,373 1,256 91.5 1,494 1,358 90.92,248 86.5 1,337 1,183 88.5 1,260 1,065 84.51,494 70.2 1,219 925 75.9 908 569 62.7
882 47.5 965 513 53.2 892 369 41.3352 30.4 527 170 32.2 630 182 28.9
2,190 72.6 1,444 1,090 75.5 1,574 1,099 69.91,834 74.7 1,206 942 78.1 1,249 892 71.51,518 76.6 995 774 77.8 986 744 75.51,275 79.7 859 712 82.9 741 563 76.0
415 49.9 418 228 54.5 414 187 45.2584 60.2 589 384 65.1 380 200 52.6
8,461 5,990 70.8 4,286 3,181 74.2 4,175 2,809 67.32,392 1,826 76.3 1,224 948 77.5 1,168 877 75.1
9,265 6,668 72.0 4,707 3,543 75.3 4,558 3,124Z05 184 89.5 71 65 (B) 134 119
2,541 2,322 91.4 1,224 1,123 91.8 1,317 1,1992,206 1,917 86.9 1,143 1,016 88.9 1,063 9011,779 1,262 71.0 1,039 808 77.8 740 4541,566 707 45.1 796 395 49.6 770 312
967 276 28.5 434 137 31.5 S33 139
68.588.691.084.761.4
40.526.1
2,600 1,863 71.7 1,247 934 74.9 1,353 929 68.72,029 1,531 75.5 987 787 79.7 1,041 744 71.51,677 1,289 77.1 854 674 78.9 818 615 75.21,383 1,115 80.6 752 626 83.3 631 488 77.4
729 366 50.1 351 196 55.8 378 170 44.8852 503 59.1 515 325 63.1 337 178 52.9
7,159 5,061 70.7 3,628 2,716 74.9 3,532 2,346 66.42,105 1,606 76.3 1,079 828 76.7 1,026 779 75.9
1,136 808 71.1 544 392 70.2 593 426 71.938 38 (B) 16 16 (B) 22 22 (B)
265 238 89.8 112 99 89.1 153 139 90.3274 233 85.0 129 116 89.b 145 117 80.8247 154 62.6 126 76 60.0 121 79 65.2182 98 53.9 99 59 59.8 83 39 46.8131 47 35.8 62 16 (B) 69 31 (B)
330 264 80.0 141 116 81.9 188 148 78.6320 223 69.8 161 110 68.0 158 113 71.6220 160 72.8 95 62 65.4 125 98 78.4146 107 73.8 45 53 (B) 81 SS 67.'..
69 21 (B) 45 14 (8) 24 7 (8)53 32 (13) 36 27 (8) 17 5 (8)
916 640 69.8 440 297 67.5 476 343 72.(220 168 76.3 103 85 82.0 117 83 11.2
524 356 67.9 232 162 69.9 292 194 66.6
'Miy he of any race.

66
Table 31. Enrollment Status in 1983 for Persons 14 to 24 Years Old by Educational Attainment, Age, Sex, Race, andHispanic Origin: October 1984
(In thousands. Civilian noninstitutional population. Fbr meaning of symbols, see text)
Age, years of school completed, sex,race, and Hispanic origin
population
Not enrolled Oct. 1984
Enrolled
Oct. 1984
Enrolled in collegeOct. 1984
Enrolled below
collegeOct. 1984
EnrolledOct. 1983
Not enrolledOct. 1983
EnrolledOct. 1983
Not enrolledOct. 1983
ALL RACES
Both sexes 42,594 4,097 16,094 22,404 6,683 1,162 14,55914 and 15 years old 7,390 86 75 7,229 6 - 7,22316 and 17 years old 7,173 334 275 6,564 224 23 6,31718 and 19 years old 7,428 1,653 2,051 3,724 2,613 254 85720 and 21 years old 7,959 776 4,484 2,699 2,207 390 102
22 to 24 years old 12,644 1,248 9,209 2,187 1,632 495 60
Years of school completed:Elementary, 8 years or less 5,806 179 1,025 4,602 - - 4,602High school:
1 year 4,540 135 893 3,512 - - 3,5122 years 4,560 163 1,117 3,280 - - 3,2303 years 4,435 209 1,062 3,165 - - 3,165
4 years 13,481 1,847 9,092 2,543 1,968 575 -
College:1 year 3,200 363 956 1,882 1,658 224 -
2 years 2,898 404 908 1,586 1,404 182 -
3 years 1,537 139 206 1,192 1,104 88 -
4 years 1,767 585 782 400 318 82 -
5 years or more 369 73 55 241 230 11 -
Male 21,155 1,909 7,652 11,594 3,446 575 7,57314 and 15 years old 3,748 53 42 3,673 2 - 3,671
16 and 17 years old 3,643 161 136 3,346 79 11 3,256
18 and 19 years old 3,674 790 960 1,923 1,265 107 551
20 and 21 years old 3,880 336 2,140 1,405 1,145 192 68
22 to 24 years old 6,190 570 4,374 1,246 954 265 27
Years of school complc .td:Elementary, 8 years or less 3,158 107 545 2,506 - - 2,506
High school:1 veer 2,349 76 461 1,812 - - 1,812
2 years ',306 87 560 1,659 - - 1,659
3 years 2,289 105 588 1,595 - - 1,595
4 years 6,381 833 4,298 1,250 968 282 -
College:1 year 1,503 168 409 925 809 117 -
2 years 1,357 182 367 809 734 75 -
3 years 799 57 87 654 605 49 -
4 years 804 274 314 216 172 44 -
5 years or more 209 19 24 166 158 8 -
Feral° 21,439 2,188 8,641 10,810 3,237 517 6,986
14 and 15 years old 3,622 34 33 3,555 3 - 3,552
16 and 17 years old 3,530 173 138 3,219 146 12 3,061
18 and 19 years old 3 754 863 1,091 1,800 1,348 146 306
20 and 21 years old 4,079 441 2,344 1.295 1,062 199 34
22 to 24 years old 6,454 678 4,835 941 678 230 33
Years of school c mpleted:Elementary, 8 years or less 2,648 72 480 2,096 - - 2,096
High school:1 year 2,190 59 432 1,700 - - 1,700
2 years 2,253 76 557 1,621 - - 1,6,1
3 years 2,147 103 473 1,570 - - 1,570
4 years 7,100 1,014 4,794 1,293 1.000 293 -
Colleo:1 -- 1,698 195 547 956 849 107 -
2 years 1,541 222 541 778 671 107 -
3 years 738 82 118 538 499 39 -
4 years 963 311 468 184 146 .4
5 years or more 160 54 31 76 73 3 -
WHITE
Both sexes 35,313 3,368 13,412 18,533 5,750 985 11,798
14 and 15 years old 6,057 72 62 5,924 4 - 5,920
16 and 17 years old 5,909 293 225 5,393 182 23 5,186
18 and 19 years old 6,139 1,314 1,690 3,135 2,316 225 594
20 and 21 years old 6,611 627 3,720 2,245 1,870 337 58
22 to 24 years old 10,597 1,063 7,714 1,820 1,378 401 41
Years of school completed:Elementary, 8 years or less 4,724 145 870 3,709 - - 3,709
High school:1 year 3,697 106 731 2,861 - - 2,861
2 years 3,684 137 873 2,675 - - 2,675
3 years 3,522 167 802 2,554 - - 2,554
4 years 11,284 1,451 7,646 2,188 1,692 496 -
College:1 year 2,670 298 788 1,584 1,395 189 -
2 years 2,481 350 782 1,348 1,201 14" -
3 years 1,307 112 155 1,041 966
4 years 1,610 541 715 354 287 67I
5 yearn or nore 334 63 50 220 209 11 -
7

67
Table 31. Enrollment Status in 1983 for Persons 14 to 24 Years Old by Educational Attainment, Age, Sex, Race, andHispanic Origin: October 1984-Continued
(In thousands. Civilian noninstitutional population. Fbr moaning of symbols, see text)
Age, years of school completed, sex,race, and Hispanic origin
Not enrolled Oct. 1984
Enrollee
Enro11(... ,4 college
Oct. 1984Enrolled below
collegeEnrolled Not enrolled Enrolled Not enrolledPopulation Oct. 1983 Oct. 1983 Oct. 1984 Oct. 1983 Oct. 1983 Oct. 1984
WHITE -- Continued
Male 17,630 1,594 6,422 9,614 2,971 508 b,135
14 and 15 years old 3,103 40 34 3,028 2 3,02616 and 17 years old 3,006 142 114 2,750 60 11 2,679
18 and 19 years old 3,047 645 799 1,603 1,124 101 378
20 and 21 years old .... 3,242 275 1,790 1,177 970 173 34
22 to 24 years old 5,232 491 3,685 1,056 815 224 17
Years of school completediElementary, 8 years or less . .. 2,573 88 469 2,016 - 2,016
High school:1 year 1,895 58 367 1,470 - 1,4702 years 1,871 77 436 1,358 - 1..$58
3 years 1.831 85 456 1,290 - - 1,2904 years ,,405 669 3,663 1,073 825 248 -
College:1 year 1,248 146 328 774 670 104 -
2 years 1,175 154 316 704 640 64 -
3 years 692 46 72 580 536 44 -
4 years** "
744 254 293 197 157 40 -
5 years or mor 188 17 21 150 142 8 -
Female 17,683 1,774 6,990 8,919 2,779 477 5,66314 and 15 years old 2,954 32 27 2,895 2 - 2,893
16 and 17 years old 2,903 150 111 2,641 172 12 2,50718 and 19 years old 3,092 668 891 1,533 1,193 125 215
20 and 21 years old 3,369 351 1,930 :,088 900 164 24
22 to 24 years old 5,365 572 4,029 763 563 176 24
Years of school completed:Elementary, 8 years or less 2,151 57 401 1,693 - - 1,693High school:
1 year ... 1,802 48 364 1 '90 - - 1,3902 years... 1,813 60 437 ,J16 - - 1,316
3 years 1,691 82 346 1,264 - - 1,264
4 years 5,879 781 3,983 1,115 867 248 -
College:1 year 1,422 151 460 810 725 85 -
2 yeas 1,306 196 466 644 561 83 -
3 years 609 66 82 460 429 31 -
4 years 866 287 421 158 130 28 -
5 years or core 145 46 29 71 68 3 -
BLACK
Both sexes 6,001 632 2,282 3,087 699 126 2,26214 and 15 years old.. ..... ..... 1,077 12 10 1,056 2 - 1,05416 and 17 years old . 1,061 38 42 981 38 - 94318 and 19 years old 1,092 300 308 483 248 17 218
20 and 21 years old ... 1,115 132 675 308 233 41 34
22 to 24 yearn old 1,655 150 1,246 258 179 67 12
Years of school complet 1:Elementary, 8 yea-s or less.. ..... . 879 32 107 740 - - 740High school:
1 yea,. 691 27 136 528 - - 528
2 years 730 21 208 500 - 500
3 years . .. 751 40 218 493 - 4934 years 1,905 354 1,264 287 230 57 -
College1 year .. .. 433 52 155 226 201 25 -
2 years 319 48 103 168 145 23 -
3 years 168 25 45 99 87 12 -
4 years 104 32 43 29 20 Q -
5 years or more ... 20 2 2 16 16 - -
Male. 2,885 276 1,045 1,564 340 42 1,18214 and 15 years old 545 12 4 528 - 52816 and 17 years old 529 18 18 494 16 - 47818 and 19 years old 524 134 135 254 109 2 143
20 and 21 years old ...... . 515 50 3i3 153 117 12 24
22 to 24 years old 771 61 575 134 98 28 8
Years of ,:pool completed:Elementary, 8 years or less 477 18 50 409 - 409High school:1 year 383 16 79 288 - 28i
2 years 358 9 137 242 - 2423 years.. .............. . ........ 373 19 110 244 - 2444 years 839 150 559 130 110 20 -
College:
1 year .. 199 14 73 113 103 10 -
2 years 136 25 39 72 64 8 -
3 years 64 9 14 42 37 5 -
4 years ....... 41 15 14 12 12 - -
5 years or more 15 - 15 15 - -

68
Table 31. Enrollment Status in 1983 for Persons 14 to 24 Years ()lid by Educational Attainment, Age, Sex, Race, andHispanic Origin: October 1984Continued
(In thousands. Civilian noninstitutional population. For meaning of symbols, see text)
Age, years of school completed, sex,race, and Hispanic origin
Not enrolled Oct. 1984 Enrolled in collegeOct. 1984
Enrolled belowcollegeEnrolled Not enrolled Enrolled Enrolled Not enrolled
Population Oct. 1983 Oct. 1983 Oct. 1984 Oct. 1983 Oct. 1983 Oct. 1984
BLACK - -Continued
Female 3,116 356 1,237 1,523 359 84 1,08014 and 15 years old 532 - 5 527 2 52516 and 17 years old 532 20 24 487 22 46518 aid 19 years old 568 166 173 228 138 15 7520 and 21 years old 599 81 362 155 116 29 1022 to 24 years old 885 89 672 125 81 40 4
Years of school completed:
Elementary, 8 years or les 402 14 57 332 332High school:
1 year 308 10 57 240 2402 years 372 12 101 259 2593 years 379 21 109 249 2494 yearn 1,066 205 705 156 119 37
College.
1 year 234 37 83 114 99 IS2 years 183 23 64 97 81 163 years 104 16 31 56 50 64 years 62 17 28 17 8 95 years or more 6 2 2 2 2
HISPANIC ORIGIN'
Both sexes 3,097 316 1,330 1,452 325 42 1,08514 and 15 years old 539 17 10 512 51216 and 17 years old 540 40 37 463 5 45818 and 19 years old 561 134 203 223 122 14 8720 and 21 years old 527 47 332 14S 120 13 1522 to 24 years old 930 78 747 105 77 15 13
Years of school comp eted:
Elementary, 8 year:, or less 743 30 326 387 387High school:
1 year 412 18 133 261 2612 years 402 33 130 239 2293 years 317 26 93 198 1984 years 799 137 524 138 115 23
College:
1 year 180 21 53 106 97 92 years 126 23 43 60 56 43 years 51 4 12 36 24 years 62 24 16 22 18 45 years or more 5 5 5
Male 1,516 146 641 730 144 13 57314 and 15 years old 290 9 3 278 27816 and 17 years old 269 24 16 2'29 2 22718 and 19 years old 249 57 96 97 40 2 5520 and 21 years old 259 22 166 71 58 4 922 to 24 years old 448 34 359 56 43 7 6
Years of school completed:
Elementary, 8 years or less 400 15 158 226 226High school:
1 year 227 '0 69 148 1482 years 180 19 55 106 1063 years 154 9 53 93 934 years 348 52 251 45 36 9
College:1 year 79 10 18 51 50 12 years 67 12 25 :J 27 33 years 22 3 3 16 164 years 35 15 10 11 115 years or more 4 - - 4 4
Fcmale 1,581 170 689 722 182 29 51114 and 15 years old 249 8 7 234 23416 and 17 years old 271 16 21 234 3 23118 and 19 years old 311 77 107 127 82 12 3320 and 21 years old 268 25 166 75 62 8 622 to 24 years old 482 44 388 50 34 9 7
Years of school completed:
Elementary, 9 years or less 343 15 168 16C 160High school:
1 year 185'
64 113 1132 years 223 14 75 133 1333 years 162 18 40 105 1054 years 451 85 273 93 79 14
College:1 year 101 11 36 55 47 82 years 59 11 18 30 293 years 29 9 20 18 24 years 26 9 6 11 7 45 years or more 2 2 2
1May be of any race.

69Table 32. Year of High School Graduation for Persons 16 to 34 Years Old by Educational Attainment, Enrollment Str'us,
Sex, and Race: October 1984
(Numbers in thousands. Civilian noninstltutional population. For meaning of symbols, see tent)
Enrollment status, year ofcollege. years of schoolcompleted, sex, and race
Numbers
Total
Percent distribution
Total
Year of high school graduation Year of high school graduation
1984
1981
to
1983 1980
1979 or earlier
1984
1981
to
1983 1980
1979 or earlier
Under 26years old
26 to 28years old
29 to 34yearn old
Under 26years old
26 to 28years old
29 to 34years old
ALL RACES
Both sexes 58,157 3,089 9,703 3.669 10,783 10,728 20,185 100.0 100.0 100.0 100.0 100.0 100.0 100.0Fnrolled in college 10,854 1,668 3,901 1,043 1,725 1,093 1,424 18.7 54.0 40.2 28.4 16.0 10.2 7.1First year 3,018 1,624 674 110 206 173 232 5.2 52.6 6.9 3.0 1.9 1.6 1.1Second yens. . 2 454 27 1,597 141 285 165 239 4.2 0.9 16.5 3.9 2.6 1.5 1.2Third year 1.981 8 1,130 228 265 164 186 3.4 0.3 11.6 6.2 2.5 1.5 0.9Fourth year 1,599 6 493 402 373 166 158 2.8 0.2 5.1 11.0 3.5 1.6 0.8Fifth year 832 2 8 151 271 195 207 1.4 - 0.1 4.1 2.5 1.8 1.0Sixth year or more 970 - 1 11 325 229 403 1.7 - 0.3 3.0 2.i 2.0
Rot enrolled 47,303 1,422 5,802 2,626 9,058 9,635 18,761 81.3 46.0 59.8 71.6 84.0 89.8 92.9Years of school completed:High school, 4 years 27,008 1,387 4,673 1,679 5,242 5,031 8,996 46.4 44.9 48,2 45.8 48.6 46.9 44.6College
1 year 4,101 14 565 240 768 847 1,667 7.1 0.4 5.8 6.5 7.1 7.9 8.32 years 4,827 9 437 269 954 1,076 2,087 8.3 0.3 4.5 7.3 8.8 10.0 10.33 years 1,621 2 48 74 332 361 805 2.8 0.1 0.5 2.0 3.1 3.4 4.04 years 6,757 10 73 346 1,517 1,674 3,1 3 11.6 0.3 0.8 9.4 14.! 15.6 15.55 years or sore 2,988 - 7 17 246 646 2,073 5.1 - 0.1 0.5 2.3 6.0 10.3
Male 28,180 1,464 4,569 1,724 5,246 5,220 9,958 100.0 100.0 100.0 100.0 100.0 100.0 100.0Enrolled in college 5,510 801 1,944 561 956 560 689 19,6 54.7 42.5 32.5 18.2 10.7 6.9First year 1,444 771 347 62 95 74 94 5.1 52.' 7.6 3.6 1 8 1.4 0.9Second year 1,206 21 760 78 146 89 112 4,3 1.4 16.6 4.5 2.8 1.7 1.1Third year 995 5 585 112 128 77 88 3.5 0.3 12.8 6.5 2.4 1.5 0.9Fourth year 859 3 24d 232 218 87 71 3.0 0.2 5,4 13.5 4.2 1.7 0 7Fifth year 418 4 74 146 97 99 1.5 - 0.1 4.3 2.8 1.9 1.0Sixth year or more 589 5 224 136 225 2.1 - 0.3 4.3 2.6 2.3
Rot enrolled 22,670 663 2,624 1,163 4,290 4,660 9,269 80.4 45.3 57.4 67.5 81.8 89.3 93.1Years of school completed:
High school, 4 years 12,757 645 2,139 758 2,627 2,426 4.162 45.3 44.1 46.8 44.0 50.1 46.5 41.8College:
1 year 1,885 7 241 88 358 4:7 764 6.7 0.5 5.3 5.1 6.8 8.2 7.72 yea a 2,333 5 189 115 407 r15 1,101 8.3 0.3 4.1 6.7 7.8 9.9 11.13 years 787 2 18 35 130 175 427 2.8 0.1 0.4 2.0 2.5 3.5 4.34 yearn 3,247 4 35 158 663 784 1,604 , .5 0.3 0.8 9.2 12.6 15.0 16.15 years or more 1,6'1 - 3 9 105 333 1,211 5.9 - 0.1 0.5 2.0 6.4 12.2
Female 29,977 1,625 5,134 1,945 5,537 5,508 10,227 100.0 100.0 100.6 100.0 100.0 100.0 100.0Enrolled in college 5,343 867 1,956 483 768 533 735 17.8 53.4 38.1 24.8 13.9 9.7 7.2First year 1,574 853 326 48 110 99 137 5.3 52.5 6.3 2.5 2.0 1.8 1.3Second year 1,249 6 837 64 139 76 127 4.2 0.4 16.3 3.3 2.5 1.4 1.2Third year 986 3 545 116 137 87 98 3.3 0,2 10,6 6.0 2.5 1.6 1.6Fourth year 741 4 244 171 156 79 87 2.5 0.2 4.8 8.8 2.8 1.4 0.9Fifth year 414 2 4 77 125 98 109 1,4 0.1 0.1 4.0 2.3 1.8 1.1Sixth year or more .. . 380 - 1 7 101 94 178 1.3 - - 0.4 1,3 1.7 1.7
Rot enrollee 24.634 758 3,178 1,467 4,769 4,975 9,492 82.2 46.6 61.9 75.2 86.1 90.3 92.8Years of school completed:High school, 4 years 14,251 741 2,535 921 2,615 2,605 4,834 47,5 45.6 49.4 47.4 47.2 47.3 47.3College;
1 year 2.216 7 324 152 410 420 903 7.4 0.4 6.3 7.8 7,4 7.6 8.82 years 2,494 4 247 154 548 561 981 8.3 0.2 4.8 7.9 9.9 10.2 9.63 stars 834 - 29 39 202 186 378 2.8 - 0.6 2.0 3.6 3.4 3.74 years 3.510 38 188 853 890 1.535 11.7 0.4 0.7 9.7 15.4 16.2 15.05 years or more 1,327 - 4 8 141 313 861 4.4 - 0.1 0.4 2.5 5.7 8.4
RHITE
Both sexes 43,540 2,582 8,163 3,149 9.179 9,097 17,370 100.0 100.0 100.0 100.0 100.0 100.0 100.0Enrolled in college 9,265 1,457 3,371 867 1,426 945 1,198 18.7 56.4 41.3 27,5 15.5 10.4 6.9
First year 2,600 1,425 548 97 170 158 205 5.2 55.1 6.7 3.1 1.8 1.7 1.2Second year 2,029 19 1.372 109 219 125 184 4.1 0.7 16.8 3.5 2.4 1.4 1.1Third year 1,677 d 980 177 205 139 162 3.4 0,3 12.0 5.6 2.2 1.5 0.9Fourth year 1,383 6 462 332 312 139 131 2.8 0.2 5,7 10.5 3.4 1.5 0.8Fifth year 729 2 8 141 222 175 183 1,5 0.1 0.1 4,5 2.4 1.9 1.1Sixth year or more 852 - 1 10 298 209 333 1.7 - - 0.3 3.2 2.3 1.9
Not enrolled 40,275 1,125 4,792 2.281 7,753 8,153 16,171 81,3 43.6 58.7 72,5 84.5 89.6 93.1Years of school completed.High school, 4 years 22.812 1,099 3,860 1,423 4,451 4,270 7,709 46.0 42.6 47.3 45.2 48.5 46.9 44.4College.
1 year 3,434 8 447 219 649 710 1,402 6.9 0,3 5.5 6.9 7.1 7.8 3.12 venrs 4,080 7 381 235 816 873 1,768 8.1 0.3 4,7 7,5 8.9 9,6 10.23 years 1,312 2 37 65 256 299 653 2.6 0.1 0.5 2.1 2.8 3.3 3.84 years 5,986 9 61 323 1,376 1,440 2,778 12.1 0.3 0.7 10.3 15.0 15.8 16.05 years or more 2,651 - 7 17 206 561 1,861 5.4 - 0.1 0.5 2.2 6.2 10.7
Male 24,.4 1,251 3,882 1,495 4,508 4,469 8,630 100.0 10' 0 100.0 100.0 100.0 100.0 100.0Enrolled in college 4,707 713 1,676 477 802 476 563 19.4 57.0 43.2 31.9 17.8 10.7 6.5First year 1,247 689 279 51 80 68 80 5.1 55.1 7.2 3.4 1.8 1.5 0.9Second year 987 16 640 64 119 69 79 4.1 1.3 16.5 4.3 2.6 1.5 0.9Third year 854 5 520 93 97 64 76 3.5 0,4 13.4 6.2 2.2 1,4 0.9Fourth year 752 3 232 197 183 78 59 3.1 0.2 6.0 13.2 4.1 1.7 0.7Fifth year 351 4 68 117 78 85 1.4 0.1 4.; 2.6 1.7 1.0Sixth year or more 515 - - 4 207 121 184 2.1 - - 0.3 4,6 2.7 2.1
C( 4,
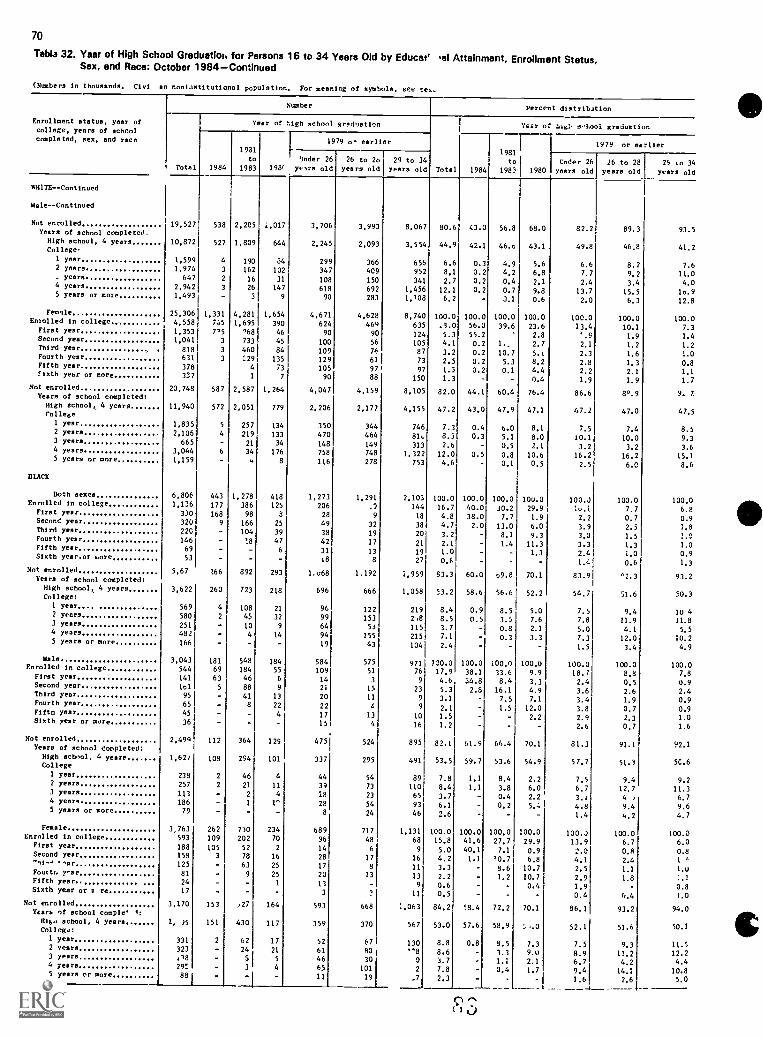
70
Tab la 32. Year of High School Graduatioh for Persons 16 to 34 Years Old by Educat' .al Attainment, Enrollment Status,Sex, and Race: October 1984-Continued
(Numbers in thousands. Cie' an noniastitutional population, For meaning of symbols, see tea.
Enrollment status, year of
college, years of school
Number Percent distribitlon
Year of tigh school graduation Year of
T --.,his:. :taboo' graduation
I 1979 or ea-liercompleted, sex, and race
t
1979 oe earlier1931 1981
II
Under 26 26 to 26 29 to 34 Under 26 26 to 28 25 to 34to to
Total 1984 1983 1981 yetrs old years old years old Total 1984 1983 1980 years old years old years old
WHITE -- Continued
Male -- Continued
Not enrolled 19,527 538 2,205 .0017 3,706 3,993 8,067 80.6 43.0 56.8 68.0 82.2 89.3 93.5Years of school completes'.
Nigh school, 4 years 10,872 527 1,809 644 2,245 2,093 3,554 44.9 42.1 46.0 43.1 49.8 46,8 41.2College.
1 year 1,599 4 190 84 299 366 656 6.6 0.3 4.9 5.6 6.6 8.2 7.62 years 1,974 3 162 102 347 409 952 8,1 0.2 4.2 6.8 7.7 9,2 11.0- years 647 2 16 31 108 150 341 2.7 0.2 0.4 2.1 2,4 3.4 4.04 years 2,942 3 26 147 618 692 1,456 12.1 0.2 0.7 9.8 13.7 15.5 10.95 years or mole 1,493 - 3 9 90 283 1,108 6.2 - J.1 0.6 2.0 6.3 12.8
Femlle 25,306 1,331 4,281 1,654 4,671 4,628 8,740 100.0 100.0 100.0 100.0 100.0 100.0 100.0Enrolled in college 4,558 745 1,695 390 624 469 635 .3.0 56.0 39.6 23.6 13.4 10.1 7.3First year 1,353 7'S '68 46 90 90 124 5.3 55.2 ' 2.8 '.9 1.9 1.4Second year 1,041 3 733 45 100 56 105 4.1 0.2 1,, 2.7 2.1 1.2 1.2Third year . 818 3 460 84 109 76 87 3.2 0.2 10.7 5.1 2.3 1.6 1.0Fourth year 631 3 :29 135 129 61 73 2.5 0.2 5.3 8.2 2.8 1.3 0.8Fifth year 378 4 73 105 97 97 1.5 0.2 0.1 4.4 2.2 2.1 1.1fixth year or more 337 1 7 90 88 150 1.3 - - 0.4 1.9 1.9 1.7Not enrolled 20,748 587 2,587 1,264 4,047 4,159 8,105 82.0 44.1 60.4 76.4 86.6 8°.9 9, 7Years of school completed:
High school, 4 years 11,940 572 2,051 779 2,206 2,177 4,155 47.2 43.0 47.9 47.1 47,2 47.0 47.5College1 year 1,835 5 257 134 350 344 746 7.3 0.4 6.0 8.1 7.5 7.4 8.52 years 2,106 4 219 133 470 464 81, 8.3 0.3 5.1 8.0 10.1 10.0 9.33 years 665 - 21 34 148 149 313 2.6 - 0.5 2.1 3.2 3.2 3.64 years 3,044 6 34 176 758 748 8,322 12.0 0.5 0.8 10.6 16.2 16.2 15.15 years or more 1,159 - 4 8 116 278 753 4.6 - 0,1 0.5 2.5 6.0 8.6
BLACK
Both sexes 6,806 443 1,278 418 1,273 1,291 2,103 100.0 100,0 100,0 100.0 100.J 100.0 10000Enrolled in college 1,136 177 386 125 206 _a 144 16.7 40.0 30.2 29.9
0.17.7 6.8First year 330 168 98 3 28 9 18 4.8 38.0 7.7 1.9 2.2 0.7 0.9Second year 320 9 166 25 49 32 38 4.7 2.0 13.0 6.0 3.9 2.5 1.8Third year 220 - 104 39 38 19 20 3.2 8.1 9.3 3.0 1.5 1.0Fourth year 146 -
'..13 47 42 17 21 2.1 - 1.4 11.3 3.3 1.3 1.0Fifth year 69 - - 6 31 13 19 1.0 - - 1.3 2.4 1.0 0.9Sixth year.or pore 53 - - - 18 8 27 0.f - - - 1.4 0.6 1.3Not enrolled 5,67 ?66 892 293 1,u68 1.192 1,959 83.3 60.0 09.8 70.1 83.9 "1.3 93.2Years of school completed:
High school, 4 years 3,622 260 723 218 696 666 1,058 53.2 58.6 56.6 52.2 54,7 51.6 50.3College:
1 year 569 4 108 21 96 122 219 8.4 0.9 8.5 5.0 7.5 9.4 10 42 years 580 2 45 32 99 153 268 8.5 0.5 3.5 7.6 7.8 11.9 11.83 years 251 - 10 9 64 Si 115 3.7 - 0.8 2.1 5.0 4.1 5.54 years 482 - 4 14 94 155 215 7.1 - 0.3 3.3 7.3 12.0 10.25 years or more 166 - - - 19 43 104 2.4 - - - 1.5 3.4 4.9
Male 3,043 181 548 184 584 575 971 /00.0 100.0 100.0 100.0 100.0 100.0 100.0Enrolled in college 544 69 184 55 109 51 76 17.9 38.1 33.6 9.9 18.7 8.8 7,8First year 141 63 46 6 14 3 9 4.6 34.8 8.4 3.3 2.4 0.5 0.9Second year lol 5 88 9 2i 15 23 5.3 2.8 16.1 4.9 3.6 2.6 2.4Third year 95 - 41 13 20 11 9 3.1 - 7.5 7.1 3.4 1.9 0.9Fourth year 65 - 8 22 22 4 9 2.1 - 1.5 12.0 3.8 0.7 0.9Fifth year 45 - - 4 17 13 10 1.5 - 2.2 2.9 2.3 1.0Sixth year or more 36 - - - 15 4 16 1.2 - - - 2.6 0.7 1.6
Not enrolled 2,499 112 364 129 475 524 895 82.1 61.9 66.4 70.1 81.3 91.1 92.1Years of school completed:High school, 4 year. 1,62/ 108 294 101 337 295 491 53.5 59.7 53.6 54.9 57.7 51.3 5C.6College1 year 238 2 46 4 44 54 89 7.8 1.1 8.4 2.2 7.5 9.4 9.22 years 257 2 21 11 39 73 110 8.4 1.1 3.8 6.0 6.7 12,7 11.33 years 113 - 2 4 18 23 65 3.7 - 0.4 2.2 3.1 4 , 6.74 years 186 - 1 1' 28 54 93 6.1 - 0.2 5.4 4.8 9,4 9.65 years or more 79 - - - 8 24 46 2.6 - - 1.4 4.2 4.7
Female 3,763 262 730 234 689 717 1,131 100.0 100.0 100.0 100.0 100.J 100.0 100.0Enrolled in college 593 109 202 70 96 48 68 15,8 41,6 27.7 29.9 13.9 6.7 6,0First year 188 105 52 2 14 6 9 5.0 40.1 7.1 0.9 2.0 0.8 0.8Second year 158 3 78 16 28 17 16 4.2 1.1 10.7 6.8 4.1 2.4 1 '-ni-4 ',sr 125 - 63 25 17 8 11 3.3 - 8.6 10.7 2.5 1.1 1.0Fourt0 e.-ar 81 - 9 25 20 13 13 2.2 - 1.2 10.7 2.9 1.8 :,1Fifth year 24 - - 1 13 9 0.6 - 0.4 1.9 0.8Sixth year or a re 17 - - - 3 '. 11 0.5 - - - 0.4 6.4 1.0Not enrolled 3,170 153 ,27 164 593 668 :,063 84.2 58.4 72.2 70.1 86.1 93.2 94.0Ycara of school comFle' 1:
His. school, 4 years 1, )5 151 430 117 359 370 567 53.0 57.6 58.9 :,..0 52.1 51.6 50.1College:1 year 331 2 62 17 52 67 130 8.8 0.8 8.5 7.3 7.5 9.3 11.52 veers 323 - 24 21 61 80 "8 8.6 - 1.3 9.0 8.9 11.2 12.23 years t18 - 5 5 46 30 0 3.7 - 1.1 2.1 6.7 4.2 4.44 years 295 - 3 4 65 101 2 7.8 - 0.4 1.7 9.4 14.1 10.85 years or more 88 - - - 11 19 -7 2.3 - - - 1.6 2.6 5.0

71
Tale 33. Enrollment Rates for Persons 3 to 34 Years Old by Age, Race, Hispanic Origin, and Region: October 1984(Numbers in thousands. Civilan noninstitutional population For meanin; of symbols, see text)
kge and race
' S.
enrollmentNortheast
enrollment
Midwestenrollment
Southenrollment
West
enrollment
Number Percept Number Percent Number Percent Number Percent Number Percent
All races 57,313 47.9 11,584 48.4 14,798 48.9 19.365 47.2 11,565 47.13 and 4 years old. 2,608 36.3 538 41.3 604 33.8 893 35.6 573 36.G5 and 6 years old.... . . . ..... .... 6,332 94.5 1,221 95.0 1,608 95.0 2,162 94.5 1,341 93.87 to 13 years old 22,855 99.2 4,287 99.1 5,899 99.2 8,078 99.3 4.590 99.314 to 17 years old 13,793 94.7 2,921 95.6 3,676 95.3 4,707 94.1 2,489 94.018 to 24 years old 8,610 30.7 1,953 33.9 2,235 31.5 2,654 27.7 1,768 31.625 to 34 years old 3,114 7.7 664 8.1 775 7.8 871 6.5 804 9.3
Waite 46,941 47 3 9,840 47.9 12,747 48.4 14,706 46.6 9,649 46.43 and 4 wears old. 2.081 36.0 441 40.9 504 32.4 652 35.8 483 36.45 and 6 years old 5,133 94.6 1,014 95.2 1,3(' 94.5 1,623 94.6 1,125 94.37 to 13 years old.. 18,596 99.2 3,617 99.1 5,05 99.2 6,090 99.3 3,838 99.314 to 17 years old 11,315 94.6 2,490 96.0 3,183 95.5 3,566 93.5 2,076 93.418 to 24 years old 7,219 30.9 1 690 34.0 1,958 31.7 2,108 28.5 1,463 30.525 to 34 years old 2,599 7.6 586 8.1 681 7.8 666 6.3 665 9.0
Black 8,226 50.1 1,415 51.3 1,756 52.1 4,260 48.9 795 50.83 and 4 years old 432 38.2 79 43.6 88 44.6 217 34.8 49 37.45 and 6 years old 941 94.i 163 93.1 204 97.1 485 93.7 90 91.67 to 13 years old 3,429 99.4 548 99.0 741 98.9 1,838 99.5 301 100.014 to 17 years old 2,036 95.2 354 92.9 449 93.7 1,065 96.3 168 97.718 to 24 years old 1,051 27.2 215 31.3 209 26.5 494 24.3 134 37.625 to 34 years old 337 7.0 57 7.3 65 6.8 163 6.3 53 10.5
Hispanic origin' 4,284 47.7 727 50.3 131 51.6 1,332 47.7 1,895 46.23 and 4 years old 151 24.2 25 '8.2 11 27.3 55 31.8 59 18.65 and 6 years old 549 93.9 87 98.3 41 96.2 147 94.4 274 92.07 to 13 years old 1,963 99.1 307 98.0 162 98.8 612 99.2 883 99.514 to 17 years old 975 90.3 168 95.2 60 97.8 323 87.3 423 89.918 to 24 years old 477 23.6 104 30.4 39 30.7 143 21.4 191 21.725 to 34 years old ..... ... .. . .... 169 6.3 37 8.4 18 8.7 50 6.3 64 5.2
1May be of any race.
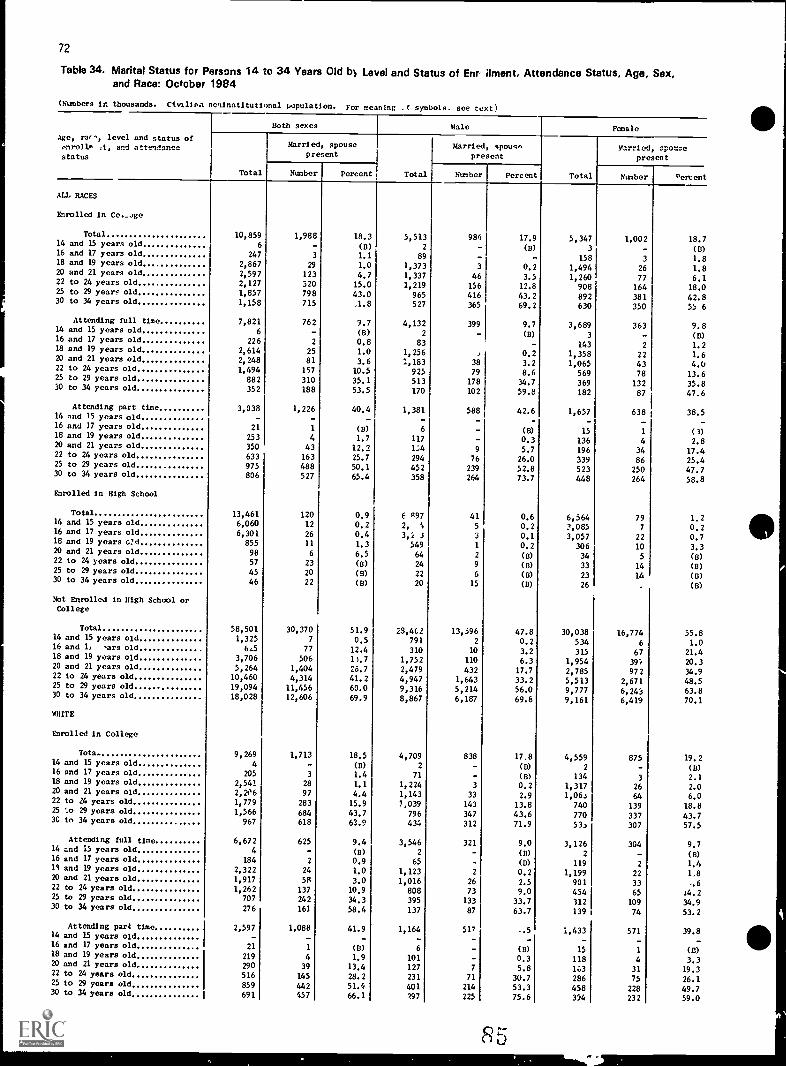
72
Table 34. Marital Status for Persons 14 to 34 Years Old bl Level and Status of Enr ilment, Attendance Status, Age, Sex,and Race: October 1984
(Numbers in thousands. CtvilJaa noninstitutional population. For meaning f symbols. see text)
Age, rar,, level and status ofenroll, ,t, and attendancestatus
Both sexes Male Female
Total
Married, spousepresent
Total
Married, apousopresent
Total
Married, spousepresent
Number Percent Number Percent Number oercent
ALL RACES
Enrolled in Co._,ge
Total 10,859 1,988 18.3 5,513 986 17.9 5,347 1,002 18.714 and 15 years old 6 - (D) 2 - (D) 3 - (B)16 and 17 years old 247 3 1.1 89 - - 158 3 1.818 and 19 years old 2,867 29 1.0 1,373 3 0.2 1,494 26 1.820 and 21 years old 2,597 123 4.7 1,337 46 3.5 1,260 77 6.122 to 24 years old 2,127 320 15.0 1,219 156 12.8 908 164 18.025 to 29 years old 1,857 798 43.0 965 416 43.2 892 381 42.830 to 34 years old 1,158 715 .1.8 527 365 69.2 630 350 53 6
Attending full time 7,821 762 9.7 4,132 399 9.7 3,689 363 9.814 and 15 years old 6 - (13) 2 - (B) 3 - (B)16 and 17 years old 226 2 0.8 83 - 143 2 1.218 and 19 years old 2,614 25 1.0 1,256 , 0.2 1,358 22 1.620 and 21 years old 2,248 81 3.6 1,183 38 3.2 1,065 43 4.022 to 24 years old 1,494 157 10.5 925 79 8.6 569 78 13.625 to 29 years old 882 310 35.1 513 178 34.7 369 132 35.830 to 34 years old 352 188 53.5 170 102 59.8 182 87 47.6
Attending part time 3,038 1,226 40.4 1,381 588 42.6 1,657 638 38.514 and 15 years old - - - - - - - _16 and 17 years old 21 1 (D) 6 - (B) 15 1 (3)18 and 19 years old 253 4 1.7 117 - 0.3 136 4 2.820 and 21 years old 350 43 12.2 1;4 9 5.7 196 34 17.422 to 24 years old 633 163 25.7 294 76 26.0 339 86 25.425 to 29 years old 975 488 50.1 452 239 52.8 523 250 47.730 to 34 years old 806 527 65.4 358 264 73.7 448 264 58.8
Enrolled in High School
Total 13,461 120 0.9 6 497 41 0.6 6,564 79 1.214 and 15 years old 6,060 12 0.2 2, 4 5 0.2 7,085 7 0.216 and 17 years old 6,301 26 0.4 3,2 3 3 0.1 3,057 22 0.718 and 19 years o'd 855 11 1.3 549 1 0.2 306 10 3.320 and 21 years old 98 6 6.5 64 2 (B) 34 5 (13)22 to 24 years old 57 23 (8) 24 9 (D) 33 14 (13)25 to 29 years old 45 20 (B) 22 6 (B) 23 14 (D)30 to 34 years old 46 22 (8) 20 15 (B) 26 (B)
Not Enrolled in High School orCollege
Total 58,501 30,370 51.9 28,462 13,396 47.8 30,038 16,774 55.814 and 15 years old 1,325 7 0.5 791 2 0.2 534 6 1.016 and 1, ars old 6c5 77 12.4 310 10 3.2 315 67 21.418 and 19 years old 3,706 506 147 1,752 110 6.3 1,954 39i 20.320 and 21 years old 5,264 1,404 26.7 2,479 432 17.7 2,785 972 34.922 to 24 years old 10,460 4,314 41.2 4,947 1,643 33.2 5,513 2,671 48.525 to 29 years old 19,094 11,456 60.0 9,316 5,214 56.0 9,777 6,243 63.830 to 34 years old 18,028 12,606 69.9 8,867 6,187 69.8 9,161 6,419 70.1
WHITE
Enrolled in College
'Iota* 9,269 1,713 18.5 4,709 838 17.8 4,559 875 19.214 and 15 years old 4 - (D) 2 - (D) 2 (B)16 and 17 years old 205 3 1.4 71 - (8) 134 3 2.118 and 19 years old 2,54! 28 1.1 1,224 3 0.2 1,317 26 2.020 and 21 years old 2,206 97 4.4 1,143 33 2.9 1,063 64 6.022 to 24 years old 1,779 283 15.9 3,039 143 13.8 740 139 18.825 29 years old 1,566 684 43.7 796 347 43.6 770 337 43.73C to 34 years old 967 618 63.9 434 312 71.9 533 307 57.5
Attending full time 6,672 625 9.4 3,546 321 9.0 3,126 304 9.714 and 15 years old 4 - (B) 2 - (B) 2 - (B)16 and 17 years old 184 2 0.9 65 - (D) 119 2 1.414 and 19 years old 2,322 24 1.0 1,123 2 0.2 1,199 22 1,820 and 21 years old 1,917 58 3.0 1,016 26 2.5 901 3322 to 24 years old 1,262 137 10.9 808 73 9.0 454 65 i4.225 to 29 years old 707 242 34.3 395 133 33.7 312 109 34.930 to 34 years old 276 163 58.4 137 87 63.7 139 74 53.2
Attending part time 2,597 1,088 41.9 1,164 517 ..5 1,433 571 39.814 and 15 years old - - - - - -16 and 17 years old 21 1 (B) 6 - (D) 15 1 (B)18 and 19 years old 219 4 1.9 101 - 0.3 118 4 3.320 and 21 years old 290 39 13.4 127 7 5.8 143 31 19.322 to 24 years old 516 145 28.2 231 71 30.7 286 75 26.125 to 29 years old 859 442 51.4 401 214 53.3 458 228 49.730 to 34 years old 691 457 66.1 197 225 75.6 304 232 59.0

Table 34. Marital Status for Persons 14 to 34 Years Old by Level and Status of Enrollment, Attendance Status, Age, Sex,
and FL1co: October 1984 - Continued
(Numbers in thousanis. Civilian noninstitutional population. For meaning of symbols, gee text)
Age, race, level and status ofenrollment, and attendancestatus
Both sex ,
73
Male Female
Total
Married spousepresent
Number Percent Total
Married spousepresent
Number Percent Total
Married spousepresent
Number Percent
WHITE -- Continued
Enrolled in High School
Total14 and 15 years old16 and 17 years old18 and 19 years old20 and 21 years old22 to 24 years old25 to 29 years old30 to 34 years old
Not Enrolled in High S,. orCollege
Total
14 and 15 years old16 and 17 years old18 and 19 years old20 and 21 years old22 to 24 years old25 to 29 years old30 to 34 years old
BIACK
Enrolled in College
Total
14 and 15 years old16 and 17 years old18 and 19 years old20 and 21 years old22 to 24 years old25 to 29 years old30 34 years old
Attending full time14 and 15 years old16 and 17 vears old18 and 19 years old20 and 21 years old22 to 24 years old
23 to 29 years old30 to 34 years old
Attending part tine14 and 15 years old16 and 17 years old
18 and 19 years old20 and 21 years old22 to 24 years old25 to 29 years old30 to 34 year& old
Enrolled in High School
Total
14 and 15 years old16 and 17 years old18 and 19 years old20 and 21 years old22 to 24 years old25 to 29 years old30 to 34 years old
Not Enrolled in High School orCollege
Total14 an 15 years old16 and 17 years old18 and 19 years old20 and 21 years old22 to 24 years old25 to 29 years cld30 to 34 years old
10,990
5,0655,174
594
5641
36
26
49,029988
5303,004
4,3498,77816,091
15,289
1,1382
38
265
c,4
247
182
131
8092
38
238
233
154
98
47
328
27
41
92
84
84
2,019
794
939
218
34
9
9
15
7,675
282
84
6J9
807
1,399
2,387
2,108
105
10
24
8
6
22
20
15
26,999
7
75
472
1,295
3,883
10,149
11,118
171
15
25
72
60
76
13
11
37
15
95
2
14
35
45
6
3
2
2,381
3
20
77
308
937
1,037
1.0
0.2
0.5
1.4
(B)
(B)
(B)
(B)
55.1
0.7
14.1
15.7
29.8
44.263.1
72.7
15.0
(B)
(B)
5.3
10.0
39.6
45.8
9.4
(B)
(B)
5.5
7.238.0
(B)
28.9
(B)
(B)
14.9
41.5
.33.4
0.3
0.1
1.3
(B)
(B)
(0)
(B)
31.0
3.3
3.3
9.6
22.0
39.2
49.2
5,638
2,510
2,670
3;832
17
15
16
24,139
591
265
1,444
2,067
4,1777,9597,637
544
16
112
129
12699
62
382
16
99
11676
59
16
162
12
13
50
40
46
1,028
371
474143
24c
7
3
3,492174
4G269
363639
1,063945
38
5
2
1
9
6
13
12,061
2
8
102
4111,464
4,6415,433
100
8
10
48
34
45
8
4
27
6
54
6
21
28
1,126
2
6
13
134
420
551
0.7
0.2
0.10.2
(B)
(B)
(B)
(B)
50.0
0.3
3.27.0
19.9
35.158.371.1
18.4
(B)
6.6
7.648.5
(B)
11.9
(B)
7.3
5.3
(B)
(B)
33.7
(B)
(6'
(L
(Bi
(B)
0.1
0.3
(B)
(B)
(B)
(B)
32.2
(B)
2.4
3.6
21.0
39.558.3
5,3532,555
2,504
215
24
24
21
10
24,890
397
265
1,560
2.232
4,601
8,1327,653
5942
22
153
145
121
8369
4282
22
139
117
79
39
31
167
15
28
4244
38
991
423
46!.
75
10
4
2
12
4,183
108
44340
444760
1,324
1,163
67
5
22
7
5
13
14
14,9376
66
370
884
2,419
5,5085,685
71
6
15
24
26
31
4
7
10
9
41
2
8
14
17
4
2
1,255
14
64
173
517
486
1.20.20.93.3
(B)
(B)
(B)
(B)
60.01.4
24.9
23.7
38.7
52.667.774.3
12.0
(B)
(B)
4.212.6
28.)
(B)
7.2(B)
(B)
3.78.9
(B)
(B)
24.3
(B)
(B)
(B)
(B)
(B)
0.4
3.8
(B)
(B)
(B)
(B)
30.0
(B)
4.1
14.422.839.0
41.8

74
Table 35. Enrollment Status of Primary Family Members 3 to 34 Years Old by Educational Attainment of Family Householder,
Level and Control of School, Sex, Race, and Hispadic Origin: October 1984
(Numberr in thousands. Civilian nonInstItutIonel population, Excludes persons in fami.ies in which the householders are members of theArmed Forces. Also excludes family members who ar family householders and farily members who are married, spouse present. For meantngof symbols, see text)
Level and control of school,,enrollment status, sex,race, and Hispanic origin
Total
Years of school completed oy family nouseholder
Elementary school High school College
0 to 4years
5 to 7years
8
years1 to 3years
4
years1 to 3years
4 yearsor more
ALL RACES
All family members 70,781 2,047 3/36 3,293 9,402 27,207 11,835 13,562Enrolled 52,371 1,258 2,129 1,951 6 260 19,981 9,408 11.384
Nursery school and kindergarten 5,838 94 169 136 639 2,188 1,114 1,498Public 3,714 87 149 118 5f,9 1,539 609 643Private 2,124 7 20 18 70 649 505 855
Elementary, 1 to 8 years 26,788 725 1,234 1,022 3,453 10,611 4,766 4,979Public 24,075 707 1,184 940 3,300 9,627 4,173 4,138Private 2,713 18 50 82 153 984 5d; 841
High school, 1 to 4 years 13.234 361 552 626 1.711 5,052 2.303 2,629Public 12.208 352 533 596 1.647 /,732 2.092 2,256Private 1,026 9 19 3( 64 320 211 373
College, full time 5,582 66 147 122 347 1,783 1,037 2,079Public 4,308 52 126 99 284 1.427 809 1,511Private 1,274 14 21 23 63 356 224 568
College, part time 930 13 28 45 109 347 187 200Public 803 13 25 38 95 299 :74 157Private 127 - 2 7 14 43 13 43
Not enrolled:3 to 13 years old 5.124 149 217 197 732 2,236 417 72614 to 34 years old 13.284 640 1.089 1,145 2,360 4,989 1,611 1.451Not high school graduate 2,978 351 458 403 677 774 202 114
14 to 24 years old 2,251 260 33C 283 502 607 183 8525 to 34 years old 727 91 1:', 120 175 167 19 28
High school graduate 10,307 289 6:2 742 1,684 4,216 1.408 1.337NO college 7,106 232 477 62: 1,349 3,086 833 508College, 1 to 3 years 1,931 42 105 83 236 730 366 370College, 4 years or rore 1,270 15 50 38 99 400 209 459
Percent distribution 100.0 2.9 4.9 4.7 13.3 38.4 16.7 19.2Enrolled 100.0 2.4 4.1 3,7 12.0 38.2 18.0 21.1Nursery ,chool and kindergarten 100,0 1.E 2.9 2.3 10.9 37.5 19.1 25.7
Public 100.0 2.3 4.0 :.2 15.3 41,4 16.4 17.3Private 100.0 0.3 0,9 0.9 3,3 30,5 23.8 40.3
Elementary, 1 to 8 years 100.0 2.7 4.6 3.8 12.9 39.6 17.8 18.6Public 100.0 2.9 4.9 3.9 13.7 40.0 17.4 17.2Private 100,0 0.7 1.8 3.0 5.6 36.2 21.6 31.0
High school, 1 to 4 years 100.0 2.7 4.2 4.7 12.9 38.2 17.4 19.9Public 100.0 2.9 4.4 4.9 13.5 38.8 17,1 18.5Private 100.0 0.8 1.8 2.9 6.2 31.2 20.6 36.4
College, full time 100.0 1.2 2.6 2.2 6.2 31.9 18.6 37.2Public 100.0 1.2 2.9 2.3 6.5 33.1 18.8 35.1Private 100.0 1.1 1.7 1.8 4.9 28.0 17.9 44.6
College, part time 100.0 1.4 3.0 4.8 11,7 37.3 20.1 21.5Public 100.0 1.7 3.2 4.8 11.9 37.2 21.7 19.6Private 100.0 - 1.4 5.6 11.4 38.1 10.1 33.5
Not enrolled;3 to 13 years old 100.0 2.9 4.2 3.8 15,3 43.6 15.9 14.214 to 34 yea ad 100.0 4,8 9,2 8,6 17.8 37.6 12.1 10.9Not high 21., gra,unte 100.0 11.8 15.4 13.5 22.7 26.0 6.8 3.8
14 to 24 years old 100.0 11.6 14.7 12.6 22.3 27.0 8,1 3.825 to 34 years old 100.0 12.5 17.6 16.5 24.0 22.9 2.6 3.9
High school graduate 100.0 2,8 6.1 7,2 16.3 40.9 13.7 13.0No college 100.0 3.3 6,7 8,7 19.0 43.4 11.7 7.2College, 1 to 3 years 100.0 2.2 5.4 4.3 12.2 37.8 19.0 19,2College, 4 years or more 100.0 1.2 4.0 3.0 7.8 31.5 16.4 36.1
Male members 37,395 1,118 1.871 1,781 5,13? 14,129 6,253 7.111Enrolled 26,950 665 1,133 984 3.310 10,160 4,827 5.871
Nursery school and kindergarten 2,996 36 45 61 330 1.15A 550 782Public 1,915 35 70 55 293 837 298 327Private 1,083 1 15 37 317 252 455
Elementary. 1 to 8 years 13,759 416 670 500 1,820 5.399 2.489 2.464Public 12,410 409 649 464 1,738 4,901 2.186 2.064Private 1,349 7 21 36 82 498 303 40C
High school. 1 to 4 years 6,805 183 279 346 919 2,540 1,161 1,378Public 6,314 182 270 328 894 2,395 1,064 1,182Private 491 1 9 18 25 145 97 196
College, full tine 2,940 27 88 61 172 907 545 1,138Public 2,263 21 74 50 140 730 431 816Privet 617 a 14 11 32 177 114 322
College, part time 448 3 11 16 69 159 El :09Public 393 3 9 14 62 138 79 89Private 55 - 2 2 7 21 2 20
See footnote at end of table.
f',

75
Table 35. Enrollment Status of Primary Family Members 3 to 34 Years Old by Educational Attainment of Family P- useholder,
Level and Control of School, Sex, Race, and Hispanic Origin: October 1984 Continued
(Numbers in thousands. Civilian noninstitutional population. Excludes persons in families 11 which the householders are members of theArmed Forces. Also excludes family members who are family hc,oeho,fers and family me',ers who are married, spouse present. For ..5iningof symbols, See text
Level and control of school,enrollment status, sex,race, and Hispanic origin
Years of school completed by family householder
Elementary school High school College
0 to 4
Total years5 to 7years
8
years1 to 3years
4
years
1 to 3years
4 yearsOr more
ALL RACES--Cosinusd
Male members--Continued
Not enrolled:3 to 13 years old14 to 34 years oldNot high school graduate
14 to 24 years old25 to 34 years old
High school graduateNo collegeCollege, 1 to 3 yearsCollege, 4 years or more
Female membersEnrolled
Nursery school and kindergartenPublicPrivate
Elementary. 1 to 8 yearsPublicPrivate
High school, 1 to 4 yo.p.s
Public
PrivateCollege, full time
PublicPrivate
College, part timePublic
Private
Not enrolled:3 to 13 years old14 to 34 years oldNot high school g duate
14 to 24 years sd
25 to 34 years oldHigh school graduate
No collegeCollege, 1 to 3 y,arsCollege. 4 year, or more
WHITE
All family membersEnrolled
Nursery school and kindergartenPublic
PrivateElementary. to 8 year
Public
PrivateHigh school. 1 to 4 years
Public
Privatefollow,. full time
Public
PrivateCollege. part time
Public
Private
Not .rolled:
3 to 13 years old
14 to 34 Yen" °IdNot high school graduate
14 to 24 years olo25 to 34 years old
High school graduateNo collegeCollege, 1 to 3 yearsCollege. 4 years or more
SOP footnote at end of table.
2,669 90 116 110 419 1,109 438 3877,776 363 622 586 1,402 2,861 938 8531,999 219 238 273 480 531 132 761,530 168 216 194 362 418 117 55469 51 72 79 118 113 15 21
5,777 144 33f 413 922 2,329 855 7774,070 121 259 347 757 1,742 547 2971,046 16 48 46 123 382 t91 240
661 7 29 20 42 205 117 240
33,386 929 1,565 1,512 4,270 13,078 5,582 6.45125,421 593 996 967 2,950 9,821 4,580 5,5132,840 58 84 75 309 1,033 564 7161,799 52 79 63 276 702 311 3161,041 6 5 12 33 331 253 40013,030 309 563 521 1,634 5.211 2,277 2,51511,665 296 535 476 1,563 4,726 1,993 2,0741.365 11 28 45 71 435 2Z4 4416,429 178 273 280 792 2.512 1,142 1 2525,894 170 263 268 753 2,337 1.028 1,074
535 8 10 12 39 175 114 1782,642 40 59 61 174 877 492 9412,045 32 52 49 143 697 378 695
597 8 7 12 31 180 114 246482 10 17 3C 41 18e 106 90410 10 17 25 34 161 9; 6872 - - 5 7 27 11 22
2,456 59 102 86 362 1,128 379 3395.509 276 467 159 958 2,128 623 598979 132 170 131 197 243 70 38721 92 114 89 140 189 66 31
258 41 56 41 56 54 4 7
4.530 145 297 329 761 1,885 553 5613,036 111 218 274 591 1,344 287 212885 26 57 37 113 347 175 130509 8 22 18 57 194 91 219
57 9 1,435 2.538 2.557 6,448 22.289 9.769 12,1434" 892 1.618 1,547 4.302 16.362 7,813 10.262
7 1 62 122 119 423 1.720 920 1.3362,862 59 104 101 372 1.179 479 5681,840 3 18 18 51 541 441 768
21,693 537 964 801 2,364 8,628 3.920 4.47719,247 i 522 922 73! 2.229 7,744 3.379 3.7182.446 15 42 70 135 884 541 75910,797 250 404 483 1.191 4,179 1.925 2.3689,852 241 394 455 1.134 3,881 1.732 2.016
945 9 10 28 57 298 193 3524,844 38 107 106 250 1,547 883 1.9123.701 28 91 83 197 1,234 688 1.3801.143 10 16 2, 53 ,1, 195 532
759 4 21 38 74 288 164 169648 4 19 31 62 243 154 134111 2 7 12 45 10 35
4,140 102 168 158 ;54 1,869 658 f 2
10,242 441 752 852 1,592 4,058 1,29" 1,2482,125 259 330 290 405 590 160 91
1.652 2O2 244 209 320 458 144 65473 56 86 81 86 122 16 26
8,118 182 422 562 1.187 3.468 1.139 1.1575,548 149 326 475 958 2,531 675 4341,504 26 56 56 154 595 292 3241.066 7 40 31 75 342 172 399

76
Table 35. Enrollmment Status of Primary Family Members 3 to 34 Years Old by 2chicationgd Attainment of Family Householder,
Level and Control ol School, ;ex, Race, and Hispanic f)ctoblor 1984- Continued
(Numbers in thousands. Civilian noninstitutional population. Excludes persona in families in which the houseolders are 'embers of theArmed Forces. Also excludes family members who are family householders and family members who are married, spouse present. For meaningof symbols, s.e text)
Level and control of school,enrollment status, sex,race, and Hispanic origin
Total
Years of school completed by family householder
Elementary school High school Coll ege
0 to 4
years5 to 7years
8
years1 to 3
years4
years1 to 3
years4 yearsor mote
WHITE--Continued
Percent distribution 100.0 2.5 4.4 4.5 11.3 39.0 17.1 21.2Enrolled 100.0 2,1 3.8 3.6 10.1 38.2 18.3 24.0
Nursery school and kindergarten 100.0 1.3 2.6 2.5 9.0 36.6 19.6 28.4Public 100.0 2.1 3.6 3.5 13.0 41.2 16.7 19.8Private 100.0 0.2 1.0 1.0 2.8 :9.4 24.0 41.7
Elementary, 1 to 8 years 100.0 2.5 4.4 3.7 10.9 39.8 18.1 ?0.6Public 100.0 2.7 4.8 3.8 11.6 40,2 17.6 19.3Private 100.0 0.6 1.7 '.9 5.5 36.1 22.1 31.0
High school, 1 to 4 years 100.0 2.3 3.7 4.5 11.0 38.7 17.8 21.9Public 100.0 2,4 4,0 4.6 11.5 39,4 17.6 20.5Private 100.0 0.9 1.1 2.9 6,0 31,5 20.4 37.2
Colley, full time 100.0 0.8 2.2 2.2 5.2 31.9 18.2 39.5Public 100,0 0,8 2.4 2.2 5.3 33.3 18.6 37.3Private 100.0 0.9 1.4 2.0 4.6 27,4 17.1 46.6
College, part time 100.0 0.5 2.8 5.0 9.7 37.9 21.6 22.3Public 100.0 C.7 2.9 4.7 9.6 37.6 23.8 20.7Private 100.0 1.6 6,4 11.2 40.1 9.3 31.4
Not enrolled:
3 to 13 years old 100.0 2,5 4.1 3.8 13.4 45.1 15.9 15.314 to 34 years old 100.0 4.3 7.3 8.3 15.5 39.6 12.7 12.2
Not high school graduate 100.0 12.2 15.5 13,7 19.1 27.8 7.5 4.314 to 24 years old 100.0 12.2 14.8 12.7 19.3 2d.3 8.7 3.925 to 34 years old 100.0 11,9 18.3 17.1 18,1 25.7 3.4 5.5
High school graduate 100.0 2.2 5.2 6.9 14,6 42.7 14.0 14.3No college 100.0 2.7 5.9 8.6 17.3 45.6 12.2 7.8College, 1 to 3 years 100.0 1,8 3.7 3.8 10.3 39.6 19.4 21.5College, 4 years or more 100.0 0.7 3,8 2.9 7.0 32.1 16.1 37.5
Male members 30,380 807 1,399 1,414 3,547 11,648 5,178 6,387Enrolled 22,097 479 863 798 2,278 8,349 4,023 5,305
Nursery school and kindergarten 2,417 29 66 57 220 894 450 703Public 1,479 28 53 31 194 626 235 293Private 938 1 13 6 26 268 215 410
Elementary, 1 to 8 years 11,185 314 525 397 1,253 4,413 2,052 2,2'0Public 9,950 307 508 170 1,182 3,954 1,764 1.864Private. 1,235 7 17 27 71 459 288 3o6
High school, 1 to 4 years 5,556 119 2C3 270 632 2,103 980 1.249Public 5,105 118 19' : 4 611 1,970 891 1,062Private 451 1 4 16 21 133 89 187
College, full time 2,579 18 61 60 125 808 473 1,035Public 1,968 14 50 49 99 641 377 738Private 611 4 11 11 26 167 96 297
College, part time 360 9 14 48 131 67 90Public 307 7 12 4, 110 65 72Private 53 2 2 7 21 2 16
Not enrolled:
3 to 13 years old 2,144 59 86 95 287 920 349 34814 to 34 years old 6,138 268 450 520 981 2,378 806 734Not high school graduate 1.447 170 07 205 295 4C8 102 61
14 to 24 years old 1,148 138 157 155 239 328 90 4225 to 34 years old 299 32 50 56 12 19
High sciool graduate 4,691 9' 243 315 686 1.971 704 673No college 3,268 82 189 269 567 1,468 447 245College, 1 to 3 years 842 12 27 28 82 329 154 210College, 4 ,,.44-s or more 581 4 27 18 37 174 103 218
Female members 26,800 628 1,139 1,143 2,901 10,641 4,591 5,756Enrolled 20,699 412 755 749 2.024 8,013 3,789 4.957Nursery school and kindergarten 2,286 34 56 63 204 826 469 s33
Public 1.38/ 31 51 51 179 554 243 275Private 902 3 5 12 25 272 226 358
Elementary, 1 to 8 years 10,509 222 440 405 1.111 4,215 1,868 2,247Public 9,298 215 415 361 1,047 3,790 1,615 1,854Private 1.211 7 25 44 64 425 253 393
Hign school, 1 to 4 y 5,241 131 202 213 S57 2,076 943 1,120Public 4,747 123 195 201 522 1,911 840 955Private 494 8 7 12 35 165 103 165
College, full Um,. 2,264 21 46 46 125 740 411 878Public 1.733 15 41 34 98 593 311 6.2Private 531 6 5 12 27 147 100 2:
College, part time 3/9 4 12 24 26 157 97 79Public 341 4 12 19 21 :34 89 6.Pri .te 58 5 5 :3 8 17
See footnote at end of table.

77Table 35. Enrol !mew Status of Primary Family Members 3 t., 24 Years Old by Educational Attainment of Family Householder,
Level and Control of School, Sex, Race, and Hispanic Origin: October 1E84-Continued
(Numbers in thousands. Civilian noninstitutional population. Exclut. s persons to families in which the householders :re members of theArmed Forces. Also excludes family members who are family householders and family members .ho ore married, spouse present. For meaningof symbols, see text)
Level and control of school,enrollment status, sex,race. and Hispanic origin
Total
Years o. school completed by family householder
Elementary school
0 to 4
years
WHITE - -Continued
Female members -- Continued
Not enrolled:
3 to 13 years old14 to 34 years old
Not high school graduate14 to 24 years old25 to 24 years old
High school graduateNo collegeColl( :e, 1 to 3 years
College, 4 years or more
BLACK
All family membersEnrolled
Nursery school and iindergartenPublicPrivate
Elementary, ) to 8 yearsPublic
PrivateHigh school, 1 to 4 years
PublicPrivate
College, full timePublicPr.vate
College, part time
PuolicPrivate
Not enrolled:
3 to 13 years old14 to 34 years old
Not high school Fraduate14 to 24 years 'ld.25 .0 34 years old
High school graduateNo collegeCollege, 1 VI 3 yearsCollege, 4 years or more
Percent distributionEnrolled
Nursery school and kindergarterPublicPiivate
Elementary, 1 to 8 ,earsPublicPrivate
High school, 1 to 4 yearsPublicPrivate
College, fullPublic
Peivate
College, port timePublic
Private
time
Not enrolled:
3 to 13 years old
14 to 34 years old
sot high school graduate14 to 24 years old25 to 34 years old
High school graduateN collegeC..slege. 1 to 3 yearsCollege. 4 years or more
See footnote at end of Labia.
High school College
5 to 7 8 1 to 3
years years years4
years
1 to 3
years
4 years
or more
1,996 43 82 63 2674,104 172 302 331 611
678 89 123 85 110504 64 87 54 81174 24 37 31 30
3,427 83 178 245 5002,280 66 137 205 341662 14 28 28 72485 3 13 12 37
11,177 401 769 593 2.7967,730 207 422 310 1,841
904 17 32 10 198692 14 30 10 180212 3 2 18
4,118 100 222 159 1,0243,941 100 216 153 1,007
177 - 6 6 171,E95 66 124 119 4971,938 66 117 119 490
57 - 7 - 7
584 18 39 13 02470 16 34 13114 2 5 -
129 6 5 7
116 6 5 7 .8
13 - - - 2
780 26 34 31 2162,667 168 313 252 739
775 75 120 93 265536 43 80 58 179239 32 41 35 86
1,892 92 194 159 4741,424 74 138 138 377
352 11 48 13 77
116 7 8 3 20
100.0 3.6 6.9 5.3 25.0100.0 2.7 5.5 4.0 23.8100.0 1.9 3.5 1,1 21,9100.0 2.1 4.4 1.5 26.0100.0 1.6 0.8 - 8.5100.0 2.4 5,4 3.9 24.9100.0 2.5 5.5 3.9 25.6100.0 - 3.2 3.6 9.8100.0 3.3 6.2 6.0 24.9100.0 3.4 6.1 6.1 25.3
(111 (0) (0) (B) (B)100.0 3.1 6.7 2.2 15.8130.0 3.4 7.2 2.8 17.3100.0 1.9 4.4 9,4 8.7100.0 4,7 3.9 5,4 23.3100.0 4.8 4.3 6.1 23.9
(0) (8) (0) 20) (0)
100.0 3.4 ',.4 4.0 27.7100.3 6.3 11.7 9.5 27.7100.0 9.7 1!.5 12.1 34.1'00.0 8.0 14.8 10.9 33.3100.0 13.4 17.0 14 36.0100.0 4.9 10,3 4.1 25.i100.0 5.2 9.7 9.7 .6.5100.0 3.2 13.5 5.2 21.',
100.0 5.8 6.6 2.6 17.5
VV
948 3091.680 493
;.2 58
141 5441 4
1,498 434
1,063 228267 13d
168 68
4.073 1.730
2.972 1,345
387 170301 113
86 57
1,648 711
1.575 67273 39
710 315
693 303
17 12
1.4 132149 99
35 33
43 18
39 15
4 3
301 128
800 257
163 36
123 33
40 3
637 221
492 143
10' 594 19
36.. 15.538.4 17.4
42.8 18.843.4 16 340.6 26.940.0 17.340.0 17.1
41.5 2/.1
35.6 15.8
35.8 15.6
(B) (B)
31.5 22.631.7 21.0
30.8 28.833.3 14.0
33.9 12.9(B) (0)
38.6 16.3
30.0 9.7
21.0 4.7
22.9 6.216.7 1.3
33.7 11.7
34.6 10.1
29.3 16.7
35.9 16.3
28551531
23
7
485189114
182
815
6339044
46
253
21835
164150
14
107
78
29
21
16
5
44
138
2321
2
1i5
61
36
18
7.3
8.210.0
A,4
..1.6
6.1
5.519.8
8.27.7
(13)
18.3
16.,
24.,
26.:
14.1
(0)
5.7
5.2
2.9
3.8
0.9
6.14.3
10.2
15.3

78
Table 35. Enrollment Status of Primary Family Members 3 to 34 Years Old by Ed icational Attainment of Fam;:y Householder,Level and Control of School, Sex, Race, and Hispank ')rigin: October 1934Continued
(Numbers in thousands. Civilian noninstitutional population. Excludes persons in families in which the householders are nembers of theArmed Forces. Also excludes family members who are family householders and family members who are narraed, spouse present, For meaningof symbols, see text)
Level and control of school,enrollment status, sex,race, and Hispanic origin
Total
Years of sc6,.,1 completed 0) tartly ho,seholder
Elementary school High school College
0 to 4years
5 to 7
yearsd
yearsI to 3
sears4
years
1 to 3
years
4 years
or nore
ALACK--Continued
Male members 5,740 203 388 290 1,493 2,047 888 431Enrolled 3.905 112 209 138 967 1,482 b'2 325
Nurse-y school and kindergarten 458 S 8 2 96 217 84 45Public 346 5 6 2 87 179 50 16Private 112 - 2 9 38 34 29
Elementary, 1 to 8 years 2,089 57 117 75 535 809 373 1'3Public 2,013 52 114 c9 525 781 360 107Private 76 3 6 10 28 13 16
High school, 1 to 4 years 1.022 42 58 58 274 362 148 79Public 994 42 54 58 270 353 142 75Pr. vase 28 - 4 4 9 6 4
Col.cge, full time 273 7 26 1 45 74 56 63Public 217 5 23 1 39 67 37 44Private 56 2 3 6 7 19 19
College, part time 63 .7 20 II 13Public 63 - - 1 17 20 II 13Private - - - -
Not enrolled:3 to 13 years old 408 27 20 10 124 154 64 1514 to 34 years old 1,42/ 74 159 142 401 411 152 88
Not high school graduate 496 35 75 55 180 109 27 1514 to 24 years old 338 18 53 29 121 79 24 1325 to 34 years old 158 17 21 25 59 29 3 2
Hign school graduate 932 39 84 87 221 302 125 73No college 732 34 63 74 181 246 90 44College, 1 to 3 years 153 2 19 11 37 33 26 23College, 'a years or more 47 3 2 2 3 23 9 6
Female members 5,437 198 381 303 1,303 2.026 842 384Enrolled 3,825 95 213 172 874 1.490 673 308
Nursery school and kinder arten 445 13 24 8 102 169 85 45Public 346 10 24 8 93 121 62 28Private 99 3 - 9 48 23 17
Eler etary, 1 to 8 years 2,029 42 105 84 490 839 339 125Public 1,928 42 102 84 483 793 312 110Private 101 - 3 - 7 46 27 19
High school, 1 to 4 years 973 23 66 61 223 348 '66 83Public 944 23 63 61 220 340 .31 74Private 29 - 3 - 3 8 5 5
College. full time 312 11 13 12 47 111 75 43Public 253 11 11 12 43 82 61 33Private 59 - 2 4 29 14 10
College, part time 66 6 S 6 12 22 7 7
Public 53 6 5 6 10 19 4 3
Private 13 - - . 4 3 4
Not enrolled:3 to 13 years old 373 9 14 21 92 147 64 1 2E14 to 34 years old 1,240 93 154 110 337 389 105 50Not high school graduate
14 to 24 yours old279
198
40
25
4S
26
39
29
84
57
54
4310
IC
,
7
25 to 34 years old 81 15 19 10 27 10High school graduat- 960 53 108 71 252 336 96 43
'o college 592 41 74 63 196 247 53 18College, 1 to 3 years 199 9 28 7 39 70 33 13rollege. 4 years or more 69 3 6 1 i7 19 10 12
HISPANIC OftaCINI
All family 'embers 5,578 989 1.043 429 796 1,385 591 346Enrolled 4,010 6S2 718 2E: 576 1,046 471 281
Nursery school and kindergarten 410 52 57 30 76 115 49 30Public 345 51 55 26 68 80 32 23Private 65 1 z 4 8 26 17 7
Elementary, 1 to 8 years 2,382 398 460 144 333 614 286 146Public 2,216 339 435 1/0 115 557 254 125Private 166 9 25 4 18 57 32 21
High s :tool, 1 to 4 years 921 172 155 75 132 233 102 53Public 866 167 150 71 123 218 89 48Private 55 5 5 4 9 15 12 5
College, full time 240 27 36 10 2d 67 31 43Public 202 22 34 6 27 58 21 34Private 38 5 2 4 1 9 10 6
College, pare time 57 2 9 6 7 16 4 13Public 52 2 9 6 7 12 4 12Private 5 - - - - 4 - 1
See footnote at end of table.

79
Table 35. Enrollment Status of Primary Family Members 3 to 34 Years Old by Educational Attainment of Family Householder,Level and Control of School, Sex, Race, and Hispanic Origin: Oc.tober 1984-Continued
(Numbers in tho' lands. Ci.ilian noninstitutional population. Excludes persons in families in which the householders are members of theArmed Forces lso excludes family members who arc family householders and family members who are married, spouse present. For meaningof symbols, text)
Level and control of school,enrollment status, sex,race, and Hispanic origin
Total
Years of school completed by family householder
Elementary school High school College
0 to 4yearn
5 to 7years
8
years1 to 3
years4
years1 to 3
years
4 yearsor more
HISPANIC ORIGINI-Continued
All family members-ContinuedNot enrolled:
3 to 13 years old 524 79 97 54 104 128 43 1814 to 34 years old 1.044 257 228 109 117 211 77 46Not high school graduate 415 150 130 43 39 31 1314 to 24 years old 307 125 101 24 27 17 1125 to 34 years old 107 26 29 20 12 14 2 6High school graduate 629 108 98 55 i8 180 64 38No college 469 86 78 56 58 141 39 /-College, 1 to 3 years 120 18 19 6 18 24 21 14College, 4 years or more 40 4 1 3 2 15 4 12
Percent distribution 100.0 17.7 18.7 7.7 14.3 24.8 10.6 6.2Enrolled 100.0 16.3 17.9 6.6 14.4 26.1 11.8 7.0Nursery School and kindergarten 100,0 12.7 13.9 7.3 18.5 28.0 12.0 7.3Public 100.0 14.9 16.0 7.6 19.7 25.9 9.3 6.6Private (B) (B) (B) (El) (B) (B) (B) (B)Elementary, 1 to 8 years 100.0 16.7 19., 6.0 14.0 25.8 12.0 6.1Public 100.0 17.6 19.6 6.3 14.2 25.2 11.5 5.6Private 100.0 5.4 14.9 2.7 10.8 34.1 19.3 12.7High school, 1 to 4 years 100.0 18.7 16.8 8.1 14.3 25.3 11 1 5.8Public 100.0 19.3 17.3 8.2 14.2 25.2 10.2 5.6Private (B) (B) (B) (B) (B) (B) (B) (B)College full time 100.0 11.3 15.0 4.2 11.7 27.9 12.9 16.7Public 100.0 10.9 17.0 3.1 13.3 2'' 6 10.3 16.6Private (B) (B) (B) (B) (B) B) (B) (B)College, part time (B) (B) (B) (B) (8) (B) (B) (B)Public (B) (B) 9) (B) (B) (B) (B) (B)Private (B) (B) (B) (B) (B) (B) (B) (B)
Not enrolled:3 to 13 years old 100.0 15.1 18.G 10.4 19.8 24.4 8.3 3.514 to 34 years old 100.0 24.6 21.8 10.4 1' 2 20.2 7.3 4.4Not high school graduate 100.0 36.2 31.4 10.5 9.3 7.4 3.1 2.114 to 24 years old 100.0 40.5 32.8 7.7 8.7 5.6 3.6 1.125 to 34 years old 100.0 23.9 27.3 18.2 11.1 12.6 1.7 5.2"Igh school graduate 100.0 17.2 15.6 10.3 12.4 28.6 10.2 6.0No college 100.0 18.2 16.5 12.0 77.4 30.1 8.2 2.5College, 1 to 3 years 100.0 14.9 15.4 5.3 15.2 20.1 17.8 11.5
'Hay be of any race.

80
Table 36. College Attendance of Primary Family Members 18 to 24 Years Old, by Family Income,Race, and Hispanic Origin: October 1984
(Numbers in thousands. Civilian noninstitutional population. Excludes families r, which the householders are members of the Armed Forces.For meaning of symbols, ste text)
Families, race, and Hispanic origin
Total
Fv.ily income
Under$10,000
$10,000 to$14,999
$15,000 to$19,999
$20,000 to$24,999
$25.000 to$34.999
835,000and over
Not
reported
PRIMARY FAMILIFS
All families 62,895 11,721 8,569 7,229 6,712 10,915 14,282 3,457No member 18 to 24 years old' 50,772 9,504 7,378 6,044 5,540 8,798 10,736 2,773One or more members 18 to 24 years old' 12,113 2,217 1,191 1,186 1,173 2,117 3.545 683
None attending college full time 7,849 1,904 942 863 778 1,276 1,672 412One or more attending college full time 4,264 313 249 323 395 841 1,873 271
One member 18 to 24 years old 9,095 1,780 927 917 885 1,609 2,461 517Not attending college full time 6,283 1,573 752 687 6C8 1,035 1.300 328Attending college full time 2,812 207 175 230 217 574 1,161 189
Two or more members 18 to 24 years old 3,018 437 264 269 288 508 1,084 166None attendig college full time 1,566 331 190 176 170 241 372 81
One attending college full time 775 60 41 64 66 139 365 41Two or more attending college full time 677 46 33 29 52 128 347 41
'slate families 54,291 8,498 7,278 6,203 5.948 9,953 13,253 3,159No member 18 to 24 years old' 44,501 7,228 6,423 5,325 4,984 8,067 9.948 2,526One or more members 18 to 24 years old' ",789 1,269 853 877 965 1,884 3.304 632
None attending college fell U.. 6,086 1,081 679 651 621 1,131 1,542 378One or more attending college fal time 3,703 188 174 226 344 753 1,762 254
Ore member 18 to 24 years old 7,396 1,062 674 708 742 1,430 2,298 481Not ottending college full time 4,933 924 551 546 491 921 1,198 302Attending college full time 2,463 138 123 162 251 509 1,100 179
Two or more members 18 to 24 years old 2,393 207 179 169 223 454 1,006 151one attending college full time 1,153 157 128 :05 130 210 344 76
One attending college full time 627 20 30 40 54 119 326 38Two or more tending college full time 613 30 21 24 39 125 336 37
Black families 7,001 2,828 1,086 890 602 730 662 202No member 18 to 24 years old' 5,041 1,982 795 621 426 547 500 170One or more members 18 to 24 years old' 1,961 846 29: 269 176 182 163 33
None attending college full time 1,524 739 228 186 138 115 92 25One or more attending college full time 437 107 63 83 38 67 71 8
One member 18 to 24 years old.. 1,430 640 216 181 123 140 109 21
Not attending college full tie. 1,153 579 174 121 102 87 72 17
Attending college full time 277 61 42 60 21 53 37 4
Two or more members 18 to 24 year_ old 531 206 75 88 53 41 54 12
None attending college full time 371 160 54 65 36 28 20 8One attending college full time 113 32 9 19 10 14 24 4
Two or more attending college full time 47 14 12 4 7 10 -
Hispanic origin families' 3,574 1,191 637 445 336 448 396 119
No member 18 to 24 years old' 2,730 940 489 350 252 335 279 84
One or more members 18 to 24 years old' 844 252 148 94 84 115 118 35None nttendi.g college full time.
, 642 209 122 76 71 66 71 28
One or more attending college full time 202 43 26 18 13 49 47 7
One member 18 to 24 years oad 595 194 107 63 59 83 72 16
Not attending college full time.... 476 164 90 52 50 55 53 12
Attending college full time 119 30 17 11 9 28 19 4
Two or more members 18 to 24 years old 249 58 41 31 25 32 46 19
one attending college full time 166 45 32 24 21 11 18 16
One attending college full time 46 3 1 4 2 12 17 2
Two or ma a attending college full time 37 10 2 3 2 9 11 1
Percent Distribution
All families with- -
One or more members 18 to 24 years old' 100.0 100,0 100,0 100,0 100.0 100.0 100.0 103.0None attending college full time t4.8 85.9 79,1 72.8 66.3 60.3 47.2 60,3One or me attending college full time 35.2 14.1 20.9 27,2 33,7 39.7 52.8 39.7
One :At* d' g college fall time 29.6 12.0 18.1 24,8 29.2 43.0 33.7Two or more attending college full time 5.6 2,1 2.8 2,4 4.4 6,0 9.8 6.0
White families with- -
One or more members 18 to 24 years old' 100.0 100,0 160.0 100.0 100,0 100.0 100.0 100,0None attending college full time 62,2 85.2 79.6 74.2 64.4 60.0 46.7 59.8One or more attending college full time 37.8 14.8 20.4 25.8 35.6 40,0 53,3 40.2
Onc attending college full time 31.6 12.5 17,9 23,0 31.6 33.3 43.2 34,3
Two or more attending college full time 6.3 2,4 2.5 2,7 4,0 6.6 10,2 5.9
Black families with- -One more members 18 to 24 years old' 100.0 100.0 100,0 100,0 100.0 100.0 100.0 (B)
ae attending college full tire 77.7 87.4 78.4 69.1 78.4 63.2 56.4 (B)
One or -ore attending college full time 22.3 12.6 21.6 30.9 21,6 36.8 43.6 aB)
One attendir: college full time 19.9 11.0 17.5 29.4 17.6 36.9 37.4 (B)
Two or more attending college full time 2,4 1.7 4.1 1,5 4.0 6.1 (B)
Hispanic origin' families with- -One or more members 18 to 24 years old' 100.0 100,0 100.0 100,0 100,0 10C.0 100.0 (B)
None attending college full time 76.1 82.9 82.4 80.9 84.5 57.4 60,2 (B)
One or more attending college full time..., 23.9 17.1 17,6 19.1 15.5 42.6 39.8 (B)
One attending college full time 19.5 13.1 16,2 16.0 13.1 34.8 30.5 (B)
Two or more attending college full time 4.4 4.0 1.4 3,2 2,4 7.8 9.3 (B)
'Includes families with no member 18 to 24 years old and those in which the only member 18 n 24 years old are the family householders. orother members who ore marries, spouse present.
=Excludes families in which the only members 18 to 24 years old are the family householaera, or other members who are married, spousepresent.
'May be of any race.
F;3

81
Table 37. Primary Family Members 18 to 24 Years Old by Family Income, Enrollment Status, Control of School, Marital Status,Sex, Race, and Hispanic Origin: October 1984
(In thousands, Civilian noninstitutional population. Excludes persons in families in which the householders are members of the Armed Forces.For weaning eA symbole, see text)
Level of education, enrollment status, sex,marital status, race, and Hispanic origin
Total
Family Income
Under
$10,000$10,000 to
$14,999$15,000 to
$19,999$20,000 to
$24,999
$25,000 to$34,999
$35,000and over
Notreported
ALL RACES
Married, Spouse P'3sent
Ma,
Enrolled.
Below college..College
Full timePublicPrivate
Part time
PublicPrivate
Not enrolled
Not high school graduateHigh school graduate
No collegeCollege, 1 to 3 yearsCollege, 4 years or more..
FemaleEnrolledBelow collegeCollege
Full timePublicPrivate
Part tim,
PublicPrivate
Not enrolledNot high school graduateHigh school graduateNo college
College, 1 to 3 yearsCollege, 4 years or more
Other Marital Status
Male
EnrolledBelow collegeCollege
Full timePublicPrivate
Part timePublicPrivat.,
Not enrolledNot high school graduateHigh school graduateNo collegeCollege, 1 to 3 yearsCollege, 4 years or more.
Female
EnrolledBelow college.College
Full timePublicPrivate
Part timePublicPrivate
Not enrolleeNot high s.hool graduatenigh school graduateNo collerftCollege 1 to 3 years ............College, 4 years or more
2,367212
11
201
1159025
86
67
19
2,155
5631,591
1,144
324
123
4,303
293
40
253
128104
24
125
112
13
4,010868
3,14S
2,239
663241
8,943
3,742606
3,1362,7562,136
62038033941
5,2011,273
3,9293,010
632
287
7,6703,180
3332,846
2,4711,925
54637532748
4.490855
3,635
2.64266031:
62861
7
53
47
31
16
6
4
2
567
256311
23566
10
926
72
18
56
35
32
3
21
19
2
853
320
533
45169
13
1,303
358
148
209
184
157
II
25
23
945
426519
42583
11
1,648
330102
228196
159
37
32
30
2
1,317
499
818697
101
20
55545
44
33
27
6
11
11
510
138
372
305
54
13
95566
6
59
30
24
6
29
27
2
889
232657
479
143
35
815
25687
1C8
142
124
18
26
23
3
559183
37631736
23
776
236
48
187
153
128
25
34
34
540105435
35656
23
t
409
35
4
30
14
12
2
16
11
5
374
73
30122762
12
758
44
7
37
25
17
8
/2
12
714
126
5871.44
115
28
92528751
235194
154404133
8
63817146740244
21
684
233
25
208173
13241
15
32
3
45171
38128674
21
24220
19
5
14
11
3
222
45
177
12237
18
534
21
2
20
11
7
4
9
9
513
63
451
316
83
52
900
323
62
262
230
175
55
32
29
3
576
146
43034667
17
685
311
41
270236
182
54
34
31
3
374
56
318
216
82
20
33240
41
11
ri
30
26
4
292
28
264
158
70
36
661
54
54
24
20
4
30
29
1
607
73
534
329
140
65
1,595
691
90
600
521
394
12779
71
8
905
155
750
577
120
53
1,239595
41
554486
381
105
68
65
3
644
49
595
430
113
52
140
9
9
4
3
1
5
1
4
131
8
123
63
29
31
346
30
7
24
5
5
19
12
7
315
26289
158
87
44
2,888
1,602
119
1,482
1,3201,006
314
162
144
18
1,286
124
1,161769
242150
2.222
1,258
53
1,206
1,059
812
247
147
117
30
964
39
925
549
208
168
62
4
3
1
1
2
2
58
16
4233
6
3
124
5
4
4
4
119
28
90
62
25
3
518
22646
179
164
125
39
15
15
29266
226
174
40
12
416
217
22195
169
131
38
26
18
8
200
36164
109
26
29

82
Table 37. Primary Family Members 18 to 24 Years Olo by Family Income, Enrollment Status, Contr.)! of School, Marital Status,Sex, Race, and Hispanic Origin: October 1984-Continued
kIn thousands. Civilian noninstitutional population. Excludes persons in families in whi,h the householders are members of the Armed Forces.For meaning of symbols, see text)
Level of education, enrollment status, sex,marital status, race, and Hispanic origin
Total
Fa.ily income
Under
$10,000$10,000 to
$14,999
$15,000 to
$19,999320,000 to
$24,999$25,000 to
t34,999$35,000and over
Notreported
WHITE
Married, Spouse Present
Male 2,140 552 501 367 230 306 124 59
Enrolled.... ....... 188 51 40 33 17 37 I 7 3
Belo. college 11 7 - 4 - - - -
College i77 43 40 29 17 38 7 3
Full time 99 39 30 14 3 8 4 1
Public 75 25 24 12 3 8 3 -
Private 24 14 6 2 - - 1 1
Part tir 78 4 10 15 14 30 3 2
Public 64 4 10 10 11 26 1 2
Private 14 - - 5 3 4 2 -
Not enrolled 1,952 502 462 334 212 269 118 56
Not high school graduate 523 236 127 68 45 23 8 16
High school graduate 1,429 265 334 266 167 245 110 40
No college 1,045 210 273 203 119 150 58 31
College, 1 to 3 years 270 49 48 51 30 63 23 6
College, 4 years or more 114 6 13 12 18 32 29 1
Female 3,898 781 .0 61. 512 628 321 105
Enrolled 253 50 59 37 21 54 27 5
Below college 36 15 6 6 2 - 7 -
College 216 35 52 32 20 54 20 4
Full time 106 21 26 22 11 24 3 -
Public 83 20 20 14 7 20 3 -
Private 23 1 6 8 4 4 - -
Part time 110 14 26 10 9 30 17 4
Public 97 12 24 10 9 29 10 4
Private 13 2 2 - - 1 7 -
Not enrolled 3,645 731 801 654 491 574 294 100
Not high school graduate ...... . .. .... 794 282 222 117 61 65 26 22
High school graduate . 2,851 450 578 536 429 509 268 78
No college 2,041 387 426 410 304 319 140 54
College, 1 to 3 years.... .. ..., .. 578 51 120 100 76 126 84 21
College, 4 years or more 232 12 32 26 49 64 44 3
Other Marital Status
Male 7,258 757 594 661 707 1,430 2.643 467
Enrolled 3,131 171 172 197 263 644 1,477 207
Belo* college 404 44 52 28 48 82 109 40
Colleg' 2,727 127 121 168 216 562 1.368 167
Full time 2.434 120 100 144 192 496 1.230 153
Public 1.868 107 83 11C 146 379 '128 116
Private.. 566 13 17 34 46 117 302 37
Part time 293 7 21 24 24 66 138 14
Public 254 S 18 16 21 53 122 14
Private 39 2 3 8 3 8 16 -
Not enrolled 4,127 586 422 464 443 786 1,165 260
Not high school graduate 932 276 137 116 111 126 108 58
High school graduate 3,i95 310 285 348 332 660 1.058 201
No college 2,421 264 244 307 257 505 693 151
College, 1 to 3 years.. . . .... ..... 518 40 26 32 58 104 220 38
College, 4 years or more.... .. ... 256 6 15 9 17 51 145 12
Female 5.886 809 52? 478 540 1.079 2,071 387
Enrolled 2,648 167 163 151 262 513 1,189 202
Below college 226 54 33 16 31 29 43 19
College 2,421 113 129 134 232 484 1,146 183
Full time 2,117 105 106 119 202 422 1,006 157
Public 1.630 78 95 88 152 331 767 119
Private.... . .. .. . . . 487 27 11 31 50 91 239 38
Part time 304 8 2? 15 30 62 140 26
Public.. ........... ... . .. .... 268 8 23 14 30 60 115 18
Private 36 - - 1 - 2 25 8
Yot enrolled 3,238 643 359 327 277 566 882 185
Nnt high school graduate 548 268 70 54 48 39 36 33
High school graduate 2,690 374 289 274 229 526 846 152
No college 1.917 324 237 203 166 379 510 99
College, 1 to 3 years 489 42 33 52 49 101 188 24
College. 4 years or more 284 8 19 19 14 46 148 29

83Table 37. Primary Family Members 18 to 24 Years Old by Family Income, Enrollment Status, Control of School, MaritallStatus,
Sex, (lace, and 'iispanic Origin: October 1984Continued
(In thousands. Civilian noninstitutional population. Excludes persons in families in which the householders are members of the Armed Forces.For meaning of symbols, see text)
Level of education, enrollment status, sex,marital status, race, and Hispanic origin
Total
Family income
Under$10,000
$10,000 to$14,999
$15,000 to$19,999
$20,000 to$24,999
$25,000 to$34,999
$35,000and over
Notreported
Black
Harried, Spouse Present
Male 169 50 39 35 10 24 9 2Enrolled... ..... .. . .. ........ , . 18 7 4 - 2 3 2 -Below college. - - - - - - -College 18 7 2 3 2 -
Full time 13 5 2 2 3 - -Public 11 3 2 3 - -Private... 2 2 - - - -
Part time 5 2 - 1. -Public 1 - - - -Private.. 4 2 - - - - 2 -
lot enrolled 151 43 36 35 8 21 7 2Not high school graduate 21 10 4 4 - 3 - -High school graduate..... 131 33 32 31 8 18 7 2
No college 78 17 27 21 2 8 1 2College, 1 to 3 years 46 12 5 10 6 7 6 -College, 4 years or more 7 4 - - - 3 - -
Female...... 275 92 75 53 16 24 7 8Enrolled 24 17 2 5 - - - -
Below college. 3 3 - - - - -College 21 14 2 5 - - -
Full time 11 9 - 2 - - -Public 10 8 - 2 - - -Private . 1 1 - - - - -
Part time 10 5 2 3 - - -Public 10 5 2 3 - - -Private. - - - - - - - -
lot enrolled 251 75 72 48 16 24 7 8Not high school graduate. . . . .. . .. 42 18 10 4 - 6 - 4High school graduate... 210 57 63 44 17 19 8 4
No college 135 40 43 28 8 6 6 4College. 1 to 3 years. 69 16 19 14 7 12 2 -College, 4 years or more.. .... ........ ... 6 1 1 2 2 1 - -
3ther Marital Status
Male... ...... .... .... ...... ... ..... 1.412 474 202 226 162 130 178 40Enrolled 467 159 71 70 41 30 87 10Below college 166 93 25 15 11 8 7 6College . .. . 301 66 46 55 29 21 80 4
Full time 238 53 43 41 25 12 60 I.
Public 192 41 41 36 20 2 50 4vote 46 12 2 5 5 10 10 2
Pb time. 63 13 3 14 4 9 20 -Public 63 13 3 14 4 9 20 -Private - - - - - - - -
lot enrolled 946 315 131 157 122 100 92 30Not high school graduate. 301 135 45 49 30 23 12 6High school graduate.... .... .. , 645 180 85 108 92 77 19 24
No college 531 143 70 90 83 63 60 22College, 1 to 3 years... ... . ...... ... 94 35 8 10 9 14 16 2College, 4 years or more 20 2 7 8 - - 3 -
Female. 1,570 779 218 191 125 138 101 19Enrolled ........ .... .... .. ... .. . .. ...... 439 149 55 72 38 70 47 7Below college 88 46 10 7 8 11 3 3College 350 103 45 65 30 59 44 5
Full tine 294 83 34 51 26 56 40 5Public. 242 73 23 42 22 43 35 5
Private. 52 10 11 9 4 13 5 -Part time .. .... ....... 56 20 11 14 4 3 4 -
Public... .. . . .... . . .... ... 46 18 11 12 1 2 1
Privata 10 2 - 2 3 1 3 -
,:ot enrolled 1,132 629 163 118 87 68 54 11Not high school graduate. 277 212 29 17 8 8 1 3
High school graduate . 855 418 134 101 80 59 54 9
No college.... .... ............... 666 348 109 79 49 46 27 8College, 1 to 3 years. 160 58 22 22 29 12 16 1
College, 4 years or more 29 12 3 - 2 1 11 1
Ce

84
Table 37. Nmary Family Members 18 to 24 Years Old by Family Income, Enrollment Status, Control of School, Marital Status,Sex, Race, and Hispanic Origin: October 1984Continued
(In thousands. Civilian noninstitutional population. Excludes persons in families in which the householders are members of the Armed Forces.For meaning of symbols, see text)
Level of education, enrollment status, sex,marital status, race, and Hisp....ic origin
Total
Family income
Under$10,000
$10,000 to$14,999
$15,000 to$19,999
$20,000 to$24,999
$25,000 to$34,999
$35,000and over
Not
reported
HISPANIC ORIGIN'
Married, Spouse Present
Male 205 87 55 24 9 12 11 8Enrolled 9 4 2 2 - 1 - -
Below college 4 2 - 2 - - - -
College 5 2 2 - - 1 - -
Furl time 3 - 2 - - 1 - -
Public. 3 - 2 - - 1 - -
Private.... - - - - - - - -
Part time 2 2 - - - - - -
Public 2 2 - - - - - -
Private... .. ... . . - - - - - - - -
Not enrolled. 196 83 54 21 9 11 11 8
Not high school graduate... .... ............. 101 49 29 9 5 - 3 5
High school graduate 95 33 24 12 4 11 7 4
No college 73 27 13 11 1 11 7 2
College, 1 to 3 years.... .. . 22 6 11 1 3 - - 2
College, 4 years or more - - - - - - - -
Female 387 126 100 46 29 40 27 19
Enrolled 20 3 8 - 4 1 3 -
Below college 5 - 2 - 2 - 2 -
College.... 15 3 7 - 2 1 1 -
Full time 14 3 7 - 2 1 - -
Public.. . .. .... .. .......... .... 12 3 7 - - 1 - -
Private.. ........... .... . . . . .. . 2 - - - 2 - -
Part time 1 - - - - - 1 -
Public.... 1 - - - - - 1 -
Private.. - - - - - - - -
Not enrolled 367 123 92 46 25 38 24 19
Not high school graduate 184 83 50 22 11 5 5 8
High school graduate. 184 40 42 23 15 33 19 11
No college 137 33 33 16 9 23 15 7
College, 1 to 3 years.. ... .... .. . . 38 7 6 5 6 8 2 4
College, 4 years or more.. . . . .. . 9 - 3 2 - 2 2 -
Dther Marital Status
Male 596 153 114 68 67 79 80 34Enrolled 186 41 33 18 17 30 34 13
Below college . . . .... 61 12 16 5 11 5 6 6
College 124 29 17 12 6 25 29 7
Full time 98 29 10 7 2 23 23 4
Public. 91 29 10 4 2 21 21 4
Private. 7 - - 3 - 2 2 -
Part time... . . 26 - 7 5 4 2 6..
Public 24 - 7 3 4 2 6 3
Private 2 - - 2 - - - -
got enrolled 410 112 81 51 50 50 46 21
Not high school graduate. 174 64 41 19 25 15 2 8
High school graduate.. . . .. . .... 236 49 40 31 26 36 44 14
No college 184 39 40 28 20 21 26 11
College, 1 to 3 years. . ..... .. ... 36 6 - 2 6 10 11 3
College, 4 year or more 16 4 - 1 - 5 7 -
Female 567 172 100 54 55 64 100 21
Enrolled 200 38 38 18 23 31 44 8
Below college (0 13 13 1 10 2 2
College 160 24 24 17 14 31 42 7
Full time 134 23 19 13 11 27 35 5
Public 107 18 19 5 11 20 30 5
Private.. . . . .. . .... . ... .. 27 5 - 8 - 7 5 -
Part time 26 1 5 4 3 4 7 2
Public 25 1 5 4 3 4 6 2
Private ....... . .... ... .. . ..... 1 - - - - 1
Hot enrolled 367 134 62 36 32 3? )7 13
Not high school graduate 135 82 21 4 12 - 10 6
High school graduate 232 53 41 32 20 33 47 8
No college 185 40 33 25 17 30 35 6
Coll age, 1 to 3 years. 40 1.3 6 7 3 3 7 2
Col ege, 4 years or more 7 - 2 - - 5 -
1May be of any race.

85
Table 38, Primary Family Members 3 to 17 Years Old by Family Income, Enrollment Status, Level and Control of School,Sex, Race, and Hispanic Origin: October 1984
(Numbers in thousands. Civilian noninstitutional population. Excludes persons enrolled in college. For mei.. ng of symbols. see text)
Lwel and control of school, enrollment status,age, sex, race, and Hispanic origin
I
Total
Family Income
Under$10,000
$10,000 to$14,999
$15,000 to
tI9,999
j20,000 to
$24,999$25,000 to
$34,994$35,000
and overNot
reported
PRIMARY FAMILY MEMBERS
all Races
Male 26,077 5,370 3,190 2,974 3,018 4,723 5,741 1,060Enrolled below college 23,036 4,432 2,720 :."88 2,632 4,249 5.428 988Nursery school and kindergarten 3,003 582 378 .s40 321 573 688 121Public 1,920 524 275 222 207 310 30' 75Private 1,083 58 103 118 114 2.....2 381 46
Elementary, 1 to 8 years 12 '92 2,911 1,751 1,566 1,614 2016 2.924 510Public 1. 441 2,807 1,659 1,432 1,481 2.15 2,450 455Private 1,351 104 92 134 1'3 358 474 55
High school, I to 4 years 6,241 940 590 682 697 1,159 1.816 357Public 5,782 9'74 562 640 658 1,078 1,591 328Private 459 1E 28 42 39 81 225 29
Not enrolled 3,041 938 471 387 386 474 313 723 to 13 years old 2.669 817 423 333 347 412 276 5114 to 17 ye-rs old 372 121 48 54 39 62 37 12
High school graduate 47 4 7 6 9 15 4 3Not high school graduate 326 117 41 48 30 47 33 9
Female 24,874 5,257 3.122 2,859 2,636 4.657 5.298 1,041Enrolled below college 22,088 4,412 2,657 2,480 2,361 4,205 5,009 965Nursery school and kindergarten 2,846 593 394 313 301 543 620 82Public 1,805 508 296 227 187 300 242 45Private 1,041 85 98 86 114 243 378 37
Elementary, 1 to 8 years 13,070 2,821 1,583 1,531 1,392 2.497 2,705 539Public 11,705 2,715 1.468 1,379 .,247 2,194 2,257 445Private 1,365 106 115 152 145 303 448 94
High school, 1 to 4 years 6,172 998 678 636 668 1,164 1,685 344Public 5,651 983 648 587 603 ',043 1,473 314Private 521 15 30 49 65 121 210 30
got enrolled 2,785 845 465 379 275 451 289 803 to 13 years old 2,456 690 421 358 251 415 256 6414 co 17 years old 329 156 44 21 24 37 33 15High school graduate 72 18 11 4 3 16 15 4Not high school graduate 258 138 33 17 21 20 18 11
Yhite
Male 21,286 3,285 2,496 2,457 2,624 4,249 5.269 906flrolled below collage 18,828 2.676 2,10r' 2,116 2,280 3,821 4,981 850Nursery school and kindergarten 2,421 313 297 280 291 506 634 100Public 1,483 279 218 183 188 272 281 61Private 938 34 79 97 103 234 353 39
Elementary, 1 to 8 years 11.215 1,794 1,367 1,291 1,396 2,255 2,672 437Public 9,977 '.718 1.289 1,169 1,272 1,912 2,231 384Private 1,238 76 78 122 124 343 441 53
High school, 1 to 4 years 5,193 565 443 544 591 1,059 L.676 313Public 4,769 551 418 510 559 980 1,459 291Private 424 14 25 34 32 79 217 22
lot enrolled 2,458 613 388 341 344 428 288 553 to 13 years old 2,144 52i 346 290 306 376 254 5114 to 17 years old 314 93 41 5'. 5i, 53 33 4High school graduate 39 2 5 5 9 12 4 2Not high school graduate 275 91 36 46 30 40 29 3
Female 20,181 3,289 2,441 2,329 2.268 4,200 4,757 897:nrolled below college 17,910 2,707 2,053 2,009 2,031 3,790 4,494 827Nursery school and kindergarten 2,292 357 326 256 265 484 539 63Public 1,390 297 252 184 163 256 206 32Private 902 60 74 72 102 228 333 31
Elementary, 1 to 8 years 10,540 1,749 1.224 1,237 1,194 2,260 2.408 468Public 9,329 1,666 1,123 1.124 1,060 1,973 2,006 377Private 1,211 83 101 113 134 287 402 91
High chool, 1 to 4 years 5.078 601 503 517 571 1,044 1,546 296Public 4,592 586 475 474 514 931 1,3.4 269Private 486 15 28 43 57 113 202 27
tot enrolled 2.271 582 388 320 237 410 263 713 of 13 years old 1,996 459 348 307 218 376 233 5614 to 17 years old 275 123 40 13 19 35 31 15
High school graduate 53 9 9 - 3 15 13 4Not high school graduate 223 114 30 13 16 20 18 10

86
Table 33. Primary Family Members 3 to 17 Years Old by Family Income, Enrollment Status, Level and Control of School,Sex, Race, and Hispanic Origin: October 1984Continued
(Numbers in thousands. Civilian noninstitutional population. Excludes persons enrolled in college. For meaning of symbols, see text;
Level and control of school. enrollment status.age sex, rare. and Hispanic origin
Black
Hale
Enrolled below collegeNursery school and kindergarten
PublicPrivate
Elementary. 1 to 8 yearsPublicPrivate
High school. 1 to 4 yearsPublicPrivate
Not enrolled3 to 13 years old14 to 17 years old
High school graduateNot high school graduate
FemaleEnrolled below college
Nursery school and kindergartenPublicPrivate
Elementary, 1 to 8 yearsPublicPrivate
High school, 1 to 4 yearsPublicPrivate
Not enrolled3 to 13 years old14 to 17 years oldHigh school graduateNot high school graduate
Hispanic Origin'
Male
Enrolled below collegeNursery school and kindergarten
PublicPrivate
Elementary. 1 to 8 yearsPublic
PrivateHigh school, 1 to 4 years
PublicPrivate
Not enrolled3to 13 years.old14 to 17 years old
High school graduateNot high school graduate
FemaleEnrolled below college
Nursery school and kindergartenPublicPrivate
Elementary. 1 to 8 year.PublicPrivate
High school. 1 to 4 yearsPublicPrivate
Not enrolled3 to 13 years old14 to 17 years old
High school graduateNot high school graduate
Family income
Under $10,000 to $15,000 to $20,000 to $25,000 to $35.000 NotTotal 310.000 $14,999 $1S,,99 $24,999 $34,999 and over reported
3.864 1,864 534 433 295 340 297 1003,405 1,587 475 402 265 302 284 89
458 238 55 51 20 51 32 12346 218 37 32 12 28 13 7
112 20 18 19 8 23 19 5
2.093 1,006 300 239 166 174 162 472.017 986 287 230 157 166 144 47
76 20 13 9 9 3 18
853 342 120 112 79 78 92 30830 341 118 106 73 78 88 2723 1 2 6 6 - 4 3
459 277 59 30 30 38 13 11
408 254 52 28 30 30 9 451 24 7 2 - 8 4 7
7 1 2 1 3 -
44 23 5 1 5 4 6
3,797 1,767 566 434 277 334 327 923,375 1,532 503 377 254 308 313 90445 211 53 43 28 49 49 13
346 191 32 31 20 38 26 9
99 20 21 12 8 11 23 4
2.036 959 300 236 148 174 172 481.935 942 287 207 139 164 150 47
101 17 13 29 9 10 22 1
894 36! 150 98 79 85 93 28869 361 150 96 70 81 85 2.25 - 2 9 4 8 3
422 236 63 57 23 27 14 2
373 207 59 49 18 25 12 2
49 29 4 8 5 2 2 -
18 9 2 4 2 2 -
31 20 2 5 5 - -
2,160 786 394 271 223 218 196 731,847 632 337 229 208 199 175 66
192 65 40 21 21 26 15 3
167 58 38 19 19 21 9 3
25 7 2 2 2 5 6 -
1,245 453 242 132 133 120 116 491,171 439 238 127 126 96 98 47
74 14 4 5 7 24 18 2
410 114 57 75 54 53 43 14
397 112 55 72 54 49 41 14
13 2 2 3 - 4 2 -
313 154 56 41 15 19 21 7
267 130 50 35 13 12 21 7
46 25 6 7 1 7 - -
3 - 1 2 - - -
42 25 5 5 1 7
2,079 767 j/9 268 211 224 176 541,773 627 323 239 179 203 155 47
219 69 47 37 20 30 10 5
176 61 43 33 18 13 7 3
41 8 4 4 2 17 3 2
1,138 436 192 144 120 123 99 241,046 415 181 129 112 105 81 23
92 21 11 15 8 18 18 1
418 123 84 58 38 51 45 17
379 116 78 55 34 36 42 17
39 7 6 3 4 15 3 -
305 140 56 29 32 20 21 7
257 116 48 26 25 16 20 449 24 7 3 6 4 1 3
3 - - - 3 -
46 24 7 3 6 2 1 3

87
Table 38. Primary Family Members 3 to 17 Years Old by Family Income, Enrollment Status, Level and Control of School,Sex, Race, and Hispanic Origin: October 1984-Continued
(Numbers in thousands. Civilian noninstitutional population. Excludes persons enrolled in college. For zesning of symbols, see text
Level and control of school, enrollment status,age, sex, race, and Hispanic origin
Family income
Under $10,000 to $15,000 to $20,000 to $2',000 to $'5,000 NotTotal $10,000 $14,999 $19,999 $24,999 $34,999 and over reported
PERCENT DISTRIBUTION
All Races
Male 100.0 20.6 12.2 11.4 11.6 18.1 22.0 4.1Enrolled below college 100.0 19.2 11.8 11.2 11,4 18.4 23.6 4.7
Nursery school and kindergarten 100.0 19.4 12.6 11.3 10.7 19.1 22.9 4.0Public 100.0 27.3 14.3 11.5 10.8 16.2 16.0 3.9Private 100.0 5.3 9.5 10.9 10.5 24.3 35.2 4.2
Elementary, 1 to 8 years 100.0 21.1 12.7 11.4 11.7 18.2 21.2 3.7Public 100.0 22.6 13.3 11.5 11.9 17.3 19.7 3.7Private 100.0 7.7 6.8 9.9 9.8 26.5 35.1 4.1High school, 1 to 4 years 100.0 15.1 9.5 10.9 11.2 18.6 29.1 5.7Public 100.0 16.0 9.7 11.1 11.4 18.6 27.5 5.7
Private 100.0 3.5 6.0 9.1 8.5 17.6 48.9 6.3Not enrolled 100.0 30.9 15.5 12.7 12.7 15.6 10.3 2.4
3 to 13 years old 100.0 30.6 15.8 12.5 13.E 15.4 10.4 2.314 to 17 years old 100.0 32.5 12.9 14.4 10.4 16.7 9.9 3.1High school graduate (B) (B) (B) (B) (B) (B) (B) (B)Not hAgh school graduate 100.0 36.0 12.7 14.7 9.3 14.5 10.0 2.8
Female 100.0 21.1 12.6 11.5 10.6 18.7 21.3 4.2Enrolled below college 100.0 20.0 12.0 11.2 10.7 19.0 22.7 4,4Nursery school and kindergarten 100.0 20.8 13.8 11.0 10.6 19.1 21.8 2.9Public 100.3 28.2 16.4 12.5 10.4 16.6 13.4 2.5Private '00.0 8.1 9.4 8.3 10.9 23.4 36.3 3.6Elementary, 1 to 8 years 100.0 21.6 12.1 11.7 10.7 19.1 20.7 4.1
Public 100.0 23.2 12.5 11.8 10.6 18 7 19.3 3.8Private 100.0 7.8 8.5 11.2 10.6 22.2 32.9 6.9High school, 1 to 4 years 100.0 16.2 11.0 10.3 10.8 18.9 27.3 5.6Public 100.0 17.4 11.5 10.4 10.7 18.5 26.1 5.6Private 100.0 2.9 5.8 9.4 '2.5 23.2 40.3 5.7Not enrolled 100.0 30.3 16.7 13.6 9.9 16.2 10.4 2.93 to 13 years old 100.0 28.1 17.2 14.6 10.2 16.9 10.4 2.614 to 17 years old 100.0 47.2 13.4 6.4 7.2 11.1 10.0 4.6
High school graduate (B) (B) (B) (B) (B) (B) (B) (B)Not high school graduate 100.0 53.3 12.7 6.7 8.1 7.9 7.1 4.2
Wvite
Male 100.0 15.4 11.7 11.5 12.3 20.0 24.8 4.3Enrolled below college 100.0 14.2 11.2 11.2 12.1 20.3 26.5 4.5Nursery school and kindergarten 100.0 13.0 12.3 11.6 12.0 20.9 26.2 4.1Public 100.0 1..8 14.7 12.4 12.7 18.4 19.0 4.1
Private 100.0 3.6 8.4 10.3 11.0 24.9 37.6 4.2Elementary, 1 to 8 years 100.0 16.0 12.2 11.5 12.4 20.1 23.8 3.9Public 100.0 17.2 12.9 11.7 12.8 19.2 22,4 3.9Private 100.0 6.2 6.3 9.9 10.0 27.7 35.6 4.3High school, 1 to 4 years 100.0 10.9 8.5 10.5 11.4 20.4 32.3 6.0Public 100.0 11.6 8.8 10.7 11.7 20,6 30,6 6.1Private 100.0 3.2 6.0 8.1 7.6 18.7 51.1 5.2
Not enrolled 100.0 25.0 15.8 13.9 14.0 17.4 11.7 2.23 to 13 years old 100.0 24.3 16.2 13.5 14.3 17.5 11.9 2.414 to 17 years old 100.0 29.5 13.1 16.3 12.2 16.8 10.6 1.4High school graduate (B) (B) (11) (8) (B) (B) (B) (B)Not high school graduate 100.0 33.0 11.1 16.8 10.8 14.6 10.6 1.0
Female 100.0 16.3 12.1 11.5 11.2 20.8 23.6 4.4Enrolled below college 100.0 15.1 11.5 11.2 11.3 21.2 25.1 4.6Nursery school and kindergarten 100.0 15.6 14.2 11.2 11.6 21.1 23.5 2.7
Public 100.0 21.4 18.1 13.2 11.8 18.4 14.8 2.3Private 100.0 6.7 8.2 8.0 11.3 25.3 37.0 3.5Elementary, 1 to 8 years 100.0 16.6 11.6 11.7 11.3 21.4 22.8 4.4Public 1000; 17.9 12.0 12.0 11.4 21.1 21.5 4.0Private 100.0 6.8 8.3 9.3 11.1 23.7 33.2 7.5
High school, 1 to 4 years .... 100.0 11.8 9.9 10.2 11.2 20.6 30.4 5.8Public 100.0 12.8 10.3 10.3 11.2 20.3 29.3 5.8Private 100.0 3.2 5.9 8.8 11.7 23.4 41.6 5.5
Not enrolled 100.0 25.6 17.1 14.1 10.4 18.1 11.6 3.13 to 13 years old 100.0 23.0 17.5 15.4 10.9 18.8 11.6 2.814 to 17 years old 100.0 44.7 14.4 4.7 6.9 12.7 11.2 5.4High school graduate (8) (8) (13) (B) on (P) (8) (11)Not high school graduate 100.0 51.4 13.7 5.8 7.2 9., 8.2 4.7
0

88
Table 38. Primary Family Members 3 to 17 Years Old by Family Income, Enr ,Ilment Status, Level and Control of School,Sex, Race, and Hispanic Origin: October 1984-Continued
(Numbers in thousands. Civilian ncninatitutional population. Excludes persons enrolled itA college. For meaning of symt.as, see text,
Level and control of school, enrollment status,age, sex, race, and Hispanic origin
Total
Enmity income
Under$10,000
t10,000 to$14,999
$15,000 to119,999
$20,000 to$24,999
$25,000 to$34,999
$.6,000and over
Not
reported
Black
Hale 100.0 48.3 13.8 11.2 7.6 8.8 7.7 2.6
Enrolled below college 100.0 46.6 14.0 11.8 7.8 8.9 8.4 2.6
Nursery school and kindergarten 100.0 52.0 12.0 11.1 4.4 11.1 7.0 2.6
Public 100.0 63.2 10.7 9.3 3.3 8.0 3.6 1.9
Private 100.0 17.6 15.7 17.4 7.4 20.7 16.6 4,7
Elementary, 1 to 8 years 100.0 48.1 14.3 11.4 7.9 8.3 7.7 2.2
Public 100.0 48.9 14.2 11.4 7.8 8.2 7.1 2.3
Private 100.0 26.1 17.0 11.5 12.2 ').9 23.4 -
High school, 1 to 4 years 100.0 40.1 14.1 13.1 9.3 9.1 10.8 3.5
Public 100.0 41.1 14.2 12.7 8.7 9.3 10.6 3.3
Private (B) (B) (B) (B) (B) (B) (3) (B)
Not enrolled 100.0 60.5 12.9 6.6 6.6 8.3 2.8 2.3
3 to 13 years old 100.0 62.2 12.8 5.9 7.5 7.4 2.2 0.0
14 to 17 years old (B) (B) (B) (B) (B) (B) (B) (B)
Female 100.0 46.5 14.9 11.4 7.3 8.8 8.6 2.4
Enrolled below college 100.0 45.4 14.9 11.2 7.5 9.1 9.3 2.7
Nursery school and kindergarten 100.0 47.4 11.9 9.7 6.3 11.0 11.0 2.9
Public 100.0 55.1 9.2 9.0 5.6 11.0 7.4 2.6
Private 100.0 20.4 21.4 12.3 7.7 11.1 22.8 4.2
mentary. 1 to 8 years 100.0 47.1 14.7 11.6 7.3 8.5 8.4 2.4
Public 100.0 48.7 14.8 10.7 7.2 8.5 7.7 2.4
Private 100.0 17.3 12.6 28.4 8.5 10.4 21.6 1.3
High school, 1 to 4 years 100.0 40.4 16.8 11.0 8.8 9.5 10.4 3.1
Public 100.0 41.6 1...3 11.1 8.1 9.3 9.8 2.9
Private (B) (B) (B) (B) (8) (B) (B) (13)
Not enrolled 100.0 55.8 14.9 13.5 5.5 6.3 3.4 0.6
3 to 13 years old 100.0 55.5 15.9 13.1 5.0 6.7 3.3 0.6
14 to 17 years old (B) (B) (B) (B) (B) (B) (B) (B)
Hispanic Origin'
Mole 100.0 36.4 18.2 12.5 10.3 :0.1 9.1 3.4
Lr'olled below college 100.0 34.2 18.3 12.4 11.3 10.8 9.5 3.6
Nursery school and kindergarten 100.0 33.9 20.8 10.9 10.9 13.5 7.8 1.6
Public 100.0 35.0 22.6 11.5 11.3 12.3 5.3 2.0
Private (B' (B) (B) (BI (B) (B) (B) (B)
Elementary, 1 to 8 years 100.0 36.4 19.4 10.6 10.7 9.6 9.3 3.9
Public 100.0 37.5 20.3 10.8 10.8 8.2 8.4 4.0
Private (B) (B) (B) 'B) (B) (B) (B) (B)
High school, 1 to 4 years 100.0 27.8 13.9 18.3 13.2 12.9 10.5 3.4
Public 100.0 28.1 13.7 18.2 13.7 12.3 10.4 3.5
Private (B) (B) (B) (B) (B) (B) (B) (B)
Not enrolled 100.0 49.2 17.9 13.2 4.6 6.0 6.8 2.2
3 to 13 years old 100.0 48.5 18.6 12.9 4.9 4.5 7.9 2.6
14 to 17 years old (B) (B) (B) (B) (B) (B) (B) (B)
Female 100.0 36.9 18.2 12.9 10.1 10.8 8.5 2.6
Enrollee below college 100.0 35.3 18.2 13.5 10.1 11.5 8.7 2.6
Nursery school and kindergarten 100.0 31.5 21.5 16.9 9.1 13.7 4.6 2.3
Public 100.0 34.2 24.2 18.7 10.3 7.1 3.7 1.8
Private (B) (B) (B) (B) (B) fB) (B) (B)
Elementary, 1 to 8 years 100.0 38.3 16.9 12.7 10.5 10.8 8.7 2.1
Public 100.0 39.7 17.3 12.4 1C.7 10.0 7.8 2.2
Private 100.0 22.5 12.3 15.9 9.1 19.1 19.8 1.c
High school, 1 to 4 years 100.0 29.4 20.1 13.9 9.1 12.2 10.8 4.1
Public 100.0 30.6 20.6 14.4 9.1 9.6 11.1 4.6
Private (B) (B) (B) (B) (P) (B) (B) (B)
Not enrolled 100.0 46.0 18.2 9.5 10.4 6.6 6.9 2.4
3 to 13 years old 100.0 45.3 18.8 10.2 9.9 6.2 7.9 1.7
14 to 17 years old (B) (B) (13) ()) (B) (B) (B) (B)
May be of any race

Table 39. Single Grath: of Enrollment and High School Graduation Status for Persons 3 to 34 Years Old by Age, Sex, Race, and Hispanic Origin:October 1984(Numbers in thousands. Civilian noninstitutional population. For meaning of symbols, see text
Age, sex,
race, andHispanicorigin
Popu-lation
Enrolled
Not enrolledTotal
Nurs-cry
Kin-der-
garten
Elementary school (year) High school (year) College (year)
NumberPer-
con, 1 2 3 4 3 6 7 8 1 2 3 4 1 2 3 4 5
6 or
more
Highschool
graduate
Not highschool
graduate
ALL RACES
Male 59,746 29,334 49.1 1,201 1,797 1,820 1,711 1,631 1,649 1,670 1,687 1,749 1,865 1,918 1,861 1,636 1,623 1,446 1,206 995 855 418 589 22,673 7,7393 years old 1,847 517 28.0 491 26 - - - - - - - - - - - - - - - - 1,3294 years old 1,830 803 43.9 620 183 - - - - - - - - - - - - - - - 1,0265 years old 1,750 1,569 89.7 83 1,377 105 3- - - - 1816 years old 1,674 1,651 98.6 7 211 1,331 98 5 - - - - 237 years old 1,664 1,648 99.0 - 338 1,220 86 4 - - - - - 178 years old 1,625 1,600 98.5 - 32 345 1,125 92 5 - - - - - - 259 years old 1,636 1,619 99.0 - 10 38 359 1,088 119 3 1 - - - - - - 1710 years old 1,616 1,597 98.8 - 4 2 51 406 1,019 105 8 - - - - 1911 years old 1,653 1,646 99.6 - - 3 4 54 429 1,023 124 7 2 - - - - - 8
12 years old 1,715 1,710 99.7 - - - 2 3 84 470 1,025 119 5 2 - - - - - 413 years old 1,864 1,845 99.0 - - - - - 10 7F 44 1,140 120 9 4 - - - - - 1814 years old 1,942 1,895 97.6 - - - 3 6 83 494 1,161 133 12 2 - - - 2 4515 years old 1,826 1,779 97.4 - - - 1 20 87 468 1,078 119 2 1 1 4616 years old 1,844 1,743 94.5 - - - - 1 - 11 llf 472 1,023 106 8 3 - - 3 9917 years old 1,799 1,603 89.1 - - - - - - - 22 100 352 1,052 7., 2 1 41 15518 years old 1,906 1,156 60.7 - - - - - - - 12 28 78 145 622 65 3 3 461 28819 ears old... . 1,768 768 43.4 - - - - - - - 2 2 9 21 54 228 405 46 2 - 694 30620 years old 1,938 759 39.2 - - - - - 2 - 4 12 12 23 10f 193 373 33 - 887 29221 years old 1,942 646 33.3 - - - - 6 4 4 65 93 189 265 17 1 943 35322 years old 1,912 484 25.3 - - - - - - - - - 6 4 50 79 82 170 80 13 '.,133 29623 years old 2.128 439 20.6 - - - - - - - - - - 1 - 2 55 68 57 107 59 91 1,356 33224 years old 2,150 323 15.0 - - - - - - 2 9 33 58 ?8 76 36 66 1,.!.11 31725 to 29yearsold. 10,303 987 9.5 - - - - - - - - - 8 1 12 138 151 125 150 140 260 7,923 1,39330 to 34yearsold. 9,414 548 5.8 - - 5 4 3 9 61 87 81 55 86 158 /,718 1,148
Female 59,994 27,°78 46.6 1,153 1,687 1,722 1,601 1,553 1.530 1,650 1,644 1,608 1,748 1,837 1,676 1,607 1,617 1,577 1,249 986 741 /14 380 24,635 7,3803 years old 1,763 487 27.6 461 26 - - - - - - - - - - - - - - - - - - 1,2754 years old 1,749 800 45.7 615 185 - - - - - - - - - - - - - - - 9495 years old 1,673 1,5.4 91.7 64 1,348 117 5 - - - - - - - - - - - - 1396 years old 1,600 1,578 98.6 1, 128 1,328 108 2 - - - - - - - - - - - - - - - 227 years old 1,590 1,583 99.6 - 261 1,198 116 4 5 - - - - - - - - - - - 78 years old 1,554 1.542 99.2 - 16 257 1,141 123 3 - - - - - - - - - 129 years old 1,562 1,548 99.1 - - - 31 259 1,101 15G 1 6 - - - - - - - - - - - 1510 years old 1,544 1,537 99.5 - - - 33 256 1,104 136 5 3 - - - - - - - - - 711 year old 1,583 1,574 99.4 - - 2 1 41 307 1,099 119 6 - - - - - - - - - 8
12 years old 1,642 1,627 99.1 - - - 2 6 73 332 1,073 140 2 - - - - - - - - 1513 years old 1,785 1,778 99.6 - - - - - 8 59 3:2 1,209 161 8 1 - - - - - - 714 years old 1,910 1,883 98.6 - - - - - - - 10 63 336 1,301 156 10 5 2 - - - - 2715 ars old 1,712 1,672 97., - - - - - - S 7 46 286 1,146 167 14 2 - - - - 1 3916 years old 1,710 1,631 95.4 - - - - - - - - 4 51 271 1,141 152 19 1 1 - - 7 7217 years old 1,820 1,588 87.3 - - - - - - - - - 14 62 236 1,131 137 6 1 2 - 74 15818 years old 1,825 1,011 55.4 - - - - - - - - - 6 6 31 210 681 74 - 2 - 576 23819 years old 1,929 789 40.9 - - - - - - - - - 4 6 5 37 189 485 59 5 - 843 29720 years old 1,986 696 35.0 - - - - - - - - - - 8 4 13 82 188 356 45 - 1,028 26221 years old 2,093 598 28.6 - - - - - - - - 2 4 67 85 182 241 11 3 1,234 261
22 years old 2,145 413 19.3 - - - - - - - - - - 3 1 11 42 60 69 130 85 12 1,447 28523 years old 2,204 283 12.8 - - - - - - - - - - 1 - 5 33 45 46 80 39 34 1,609 312L4 years old 2,106 246 11. - - - - - - - - - 3 5 1 4 46 41 43 38 40 25 1,557 30325 to 29yearsold. 10,692 919 8.e - - - - - - - - 2 2 5 - 5 13 152 164 144 125 153 155 8,307 1,466J0 to 34 years old. 9,818 660 6.7 - - - - - - - 2 2 3 2 3 18 13L 100 85 73 87 151 7,952 1,205
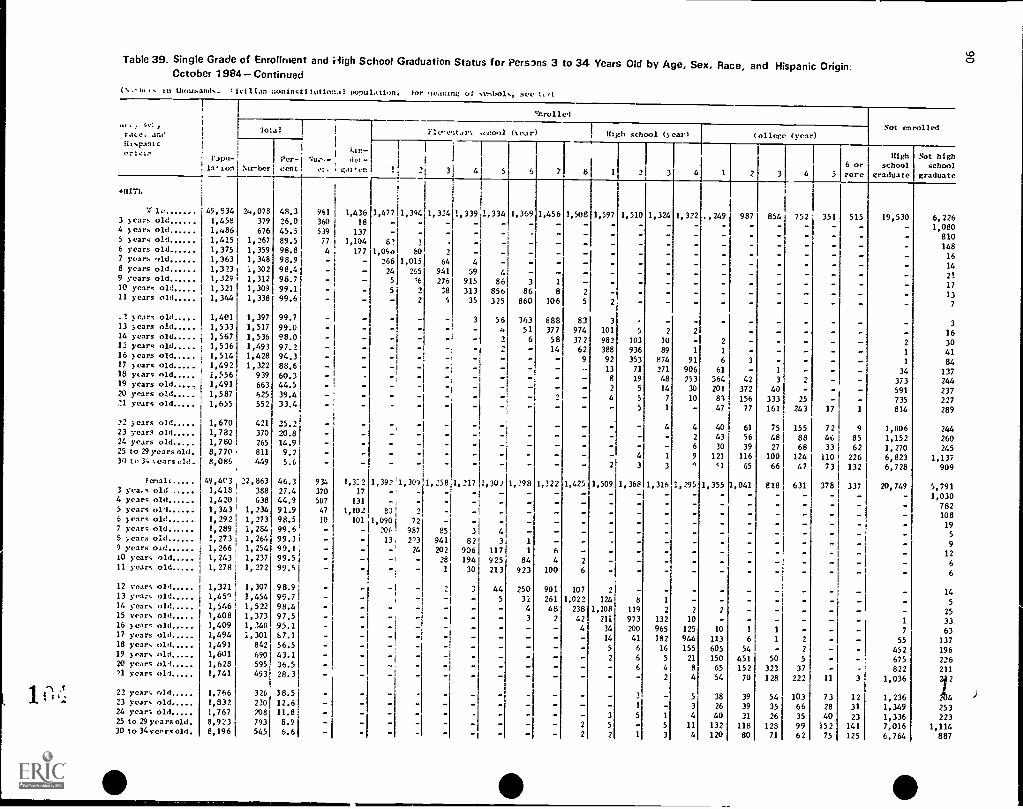
Table 39. Single Grade of Enrollment and Nigh School Graduation Status for Persons 3 to 34 Years Old by Age, Sex, Race, and Hispanic Origin:October 1984-Continued
Ipt in thousands. c ivtltan noninstltutional po!tulation. For -tc.ining of svobols, see
° "' s...:,race. ant'litspantc0:141 r
I rapu-la. ton
Throned-1---- Not enrolled'total
Ian-Nu.-..- des-
e: ga: ten
Flcentar% rnool (%ear) High school (year) College (year)
Ntr-berPer-cent
1
I
1! 3 4 5 6 7 8 1 2 3 4 1 2 3 4 56 orcore
Highschool
graduate
Not highschool
graduate
al11:1.
*.1 le 49,834 2.6,078 48.3 981 1,436 1,47711 1,394 1,324 1,339 1,334 1,369 1,456 1,508 1,597 1,510 1,324 1,322 .,249 987 854 752 351 515 19,530 6,2263 years old 1,458 379 26.0 360 18 - - - - - - 1,0804 years old . 1,686 676 45.5 539 137 - --- -- - - - - - - - 810S years old 1,415 1,267 89.5 77 1,104 82 13 - - - - - - - - - - - - 1486 years old 1,375 1,359 98.8 4 . 177 1,0961 80 2 - - - - - - - - - - - - - - 167 years old 1,363 1,348 98.9 - - 26611,015 64 4 - - - - - - - - - - - - - - - 148 years old 1,323 3,302 98.4 - - 241 265 941 59 4 ----- - - - - - - - - - 219 years old . 1,329 1,312 98.7 - - 51 ''6 276 915 86 3 1 - - - - - - - - - - - - 1710 years old..... 1,321 1,309 99.1 - - 5 2 38 313 856 86 8 2 - - - - - - - - - - - 1311 years old 1,344 1,338 99.6 - - -I 2 4 35 325 860 106 5 2 - - - - - - - - - - 7
.2 years old 1,401 1,397 99.7 - - - 3 56 363 888 83 3 - - - - - - - - 313 years old 1,533 1,517 99.0 - - -1 - - - 4 51 377 974 101 5 2 2 - - - - - - 1614 years old 1,567 1,536 98.0 - 2 6 58 372 982 103 10 - 2 - - - - - 2 3012 years old 1,536 1,493 97.2 - - - 2 - 14 62 388 936 89 1 1 - - - - - 1 4116 years old 1,514 1,428 94.3 - - - - - - 9 92 353 874 91 6 3 - - - - 1 8417 years old 1,492 1,322 88.6 - - - - - - - 13 71 271 906 61 - 34 13718 years old 1,556 939 60.3 - - - - - - - - 8 19 48 753 564 42 3 2 - - 373 24419 years old 1,491 663 44.5 - 5 14 30 201 372 40 - - - 591 23720 years old 1,587 625 39.4 - - 5 7 10 83 156 333 25 - - 735 227:ll years old 1,655 552 33.4 - - - 1 - 47 77 161 243 17 1 814 289
22 years old 1,670 421 25.2 - - - - - - - - - - 4 4 40 61 75 155 72 9 1,006 24423 years oll 1,782 370 20.8 - - - - - - - - - - 2 43 56 48 88 46 85 1,152 26024 years old 1,780 265 14.9 - - - - - - - - - - - 6 30 39 27 68 33 62 1,270 24525 to 29 years old. 8,770 811 9.7 - - - - - 1 9 121 116 100 124 110 226 6,823 1,13730 to 3. sears old. 8,086 449 5.6 - - - - 3 3 `' ci 65 66 47 73 132 6,728 909
Fenalc 49,43 22,863 46.3 934 1,3:2 1,392 1,301 1,258 1,217 1,30a 1,298 1,322 1,425 1,509 1,368 1,316 1,295 1,355 1,041 818 631 378 337 20,749 5,7913 yeas old 1,418 388 27.4 370 17 - - - - - - - - - - - - - - - - - - - 1,0304 years old 1,420 638 44.9 507 131 - - - - - - - - - - - - - - - - - - - 7825 years olI 1,343 1,234 91.9 47 1,102 83 2 - - - - - - - - - - - - - - - - 1086 years old 1,292 1,273 98.5 10 101 1,090 72 - - - - - - - - - - - - - - - - 197 years old 1,289 1,284 99.6 - - 206 987 85 - - - - - - - - - - 58 years old 1,273 1,264 99.3 - - 13 2'3 941 82 3 1 - - - - - - - - - - - - 99 years old 1,266 1,254 99.1 - - - 24 202 906 117 1 6 - - - - - - - - - - - 1210 years old 1,243 1,237 99.5 - - - 28 194 925 84 4 2 - - - - - - - - - - - 611 years old 1,278 1,272 99.5 - 1 30 213 923 100 6 - - - - - - - - - - - 6
12 years old 1,321 1,307 98.9 - - - - 2 3 44 250 901 107 2 - - - - - - - - - - 1413 year, old 1,451 1,454 99.7 - - - - 5 30 261 1,022 124 8 1 - - - - - - - - 514 years old 1,546 1,522 98.4 - - - - - - - 4 48 238 1,108 119 2 2 7 - - - - - - 2515 wears old 1,408 1,373 97.5 - - - - - 3 2 42 21i 973 132 10 - - - - - - 1 3316 years old 1,409 1,340 95.1 - - - - - - - - - 4 34 200 965 125 10 1 7 6317 years old 1,494 1,301 87.1 - - - - - - - - - 14 41 182 944 113 6 1 55 13718 years old...-. 1,491 842 56.5 - - - - - - 6 16 155 605 54 452 19619 years old 1,601 690 43.1 - - - - - - - 2 6 S 21 150 451 50 5 - 675 22620 years old 1,628 595 36.5 - - 8 65 152 323 37 - - 822 211"1 years old 1,741 493 28.3 - - - - - - - - 2 4 54 70 128 222 11 3 1,036 1222 years old 1,766 326 18.5 - - - - - - - - 3 - 5 38 39 54 103 73 12 1,236 7U423 years old 1,832 230 12.6 - - - - - - - - - - 1 - 3 26 39 35 66 28 31 1,349 25324 years old 1,767 708 11.8 - - - - 5 1 4 40 31 26 35 40 23 1,336 22325 to 29 yearsold. 8,923 793 8.9 - - - 5 11 132 118 128 99 152 141 7,016 1,11430 to 34 years old. 8,196 545 6.6 - - 1 3 4 120 80 71 62 75 125 6,764 887
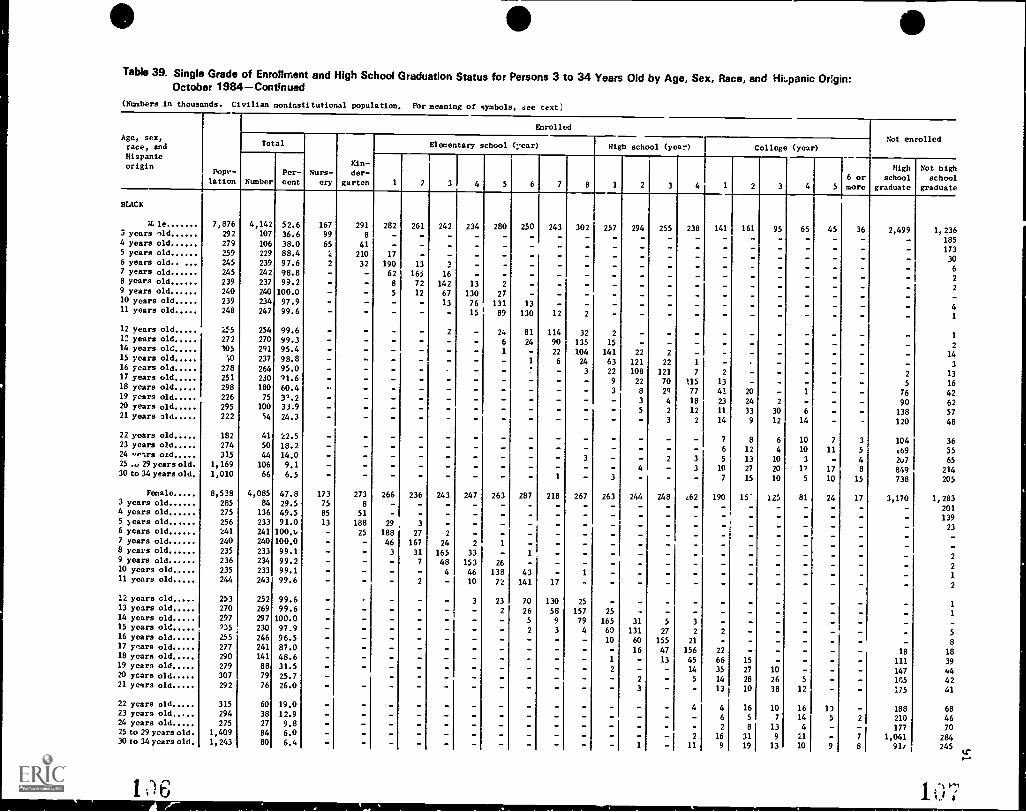
Table 39. Single Grade of Enrollment and High School Graduation Status for Persons 3 to 34 Years Old by Age, Sex, Race, and Hispanic Origin:October 1984 - Continued
(Numbers in thousands. Civilian noninstitutional population. For meaning of symbols, see text)
2
;
Enrolled
Not enrolledAge, sex,race, and Total Elementary school (,car) High school (year) College (year)Hispanic
Kin-High Not highorigin pops- Per- Nurs- der-
6 or school schoollotion Number cent cry garten 1 7 3 4 5 6 7 8 1 2 3 4 1 2 3 4 5 more graduate graduate
BLACK
IL le 7,876 4,142 52.6 167 291 282 261 242 234 280 250 243 302 257 294 255 238 141 161 95 65 45 36 2,499 1,23E3 years old 292 107 36.6 99 8 - - - - - - - - - - - - - - - - 1854 years old 279 106 38.0 65 41 - - - - 1735 years old 259 229 88.4 2 210 17 - - - - 3C6 years old.. 245 239 97.6 2 32 190 13 3 - - - - - f7 years old 245 242 98.8 - 62 165 16 - - - - - -8 years old 239 237 93.2 - 8 72 142 13 - - - - - -9 years old 240 240 100.0 - 5 12 67 130 27 - - - - - - - - - -10 years old 239 234 97.9 - - - 13 76 131 13 - - - - - - - - 411 years old 248 247 99.6 - - - 15 89 130 12 2 - - - - - - 1
12 years old 155 254 99.6 - - 2 - 24 81 114 32 2 - - - - - - - 11: years old 272 270 99.3 - - - - 6 24 90 135 15 - - - - - - - -14 years old 105 291 95.4 - - - - 1 - 22 104 141 22 2 - - - - - 1415 years old V) 237 98.8 - - - 1 6 24 63 121 22 1 - - - -16 years old 278 264 95.0 - - - - - - 3 22 108 121 7 2 - - - 2 1317 years old 251 230 91.6 - - - - - - - - 9 22 70 115 13 - - - - 5 lf18 years old 298 180 60.4 - - - - - - - - 3 8 29 77 41 20 - 1 - - 76 4219 years old 226 75 3'.2 - - - - - - - - - 3 4 18 23 24 2 - - - 90 620 years old 295 100 33.9 - - - - - 2 12 11 33 30 6 - - 138 5721 years old 222 54 24.3 - - - - - - - - - 3 2 14 9 12 14 - 120 GE
22 years old 182 41 22.5 - - - - - - - - - - - - 7 8 6 10 7 3 104 3E23 years old 274 50 18.2 - - - - - - - - - - - - 6 12 4 10 11 5 469 5524 ,ntrs oad 315 44 14.0 - - - - - - 3 5 13 10 3 - 4 2u7 6525 .v29yearsold 1,169 106 9.1 - - - - - - 3 10 27 20 1" 17 8 849 21430 to 34 years old 1,010 66 6.5 - - - 7 15 10 5 10 15 738 20)
Female 8,538 4,085 47.8 173 273 266 236 243 247 263 287 218 267 263 244 248 462 190 15" 125 81 24 17 3,170 1,28:3 years old 285 84 29.5 75 8 - - - - - - - - - - - - - - - - - - - 2014 years old 275 136 49.5 85 51 - - - - - - - - - - - - - - 1355 years old 256 233 91.0 13 188 29 - - - - - 2:6 ycars old 241 241 100.0 - 25 188 27 - - - - -7 years old 240 240 100.0 - - 46 167 24 2 1 - - - - ----- - - -8 years old 235 233 99.1 - - 3 31 165 33 - 1 - - - ----- - - - -9 years old 236 234 99.2 - - - 7 48 153 26 - - - - - - - - -10 years old 235 233 99.1 - - - - 4 46 138 43 - 1 - - - - - - - . - 111 years old 244 243 99.6 - - - 2 - 10 72 141 17 - - - - - - - - -
12 years old 253 252 99.6 - - - 3 23 70 130 25 - - - - - - - - 113 years old 270 269 99.6 - - - - - - 2 26 58 157 25 - - - - - - - 1
14 years old 297 297 100.0 - - - - - - - 5 9 79 165 31 5 3 - - - -15 years old 935 230 97.9 - - - - - - - 2 3 4 60 131 27 2 2 - -16 years old 255 246 96.5 - - - - - - - - - - 10 60 155 21 - - - - - E17 years old 277 241 87.0 -18 lE
18 years old 290 141 48.6 - - - - - - - - - - 1 - 13 45 66 15 - - - 111 3519 years old 279 88 31.5 - - - - - - - - - - 2 - - 14 35 27 10 - - - 147 4420 years old 307 79 25.7 - - - - - - - - - - 2 - 5 14 28 26 5 - - Ins 4121 years old 292 76 26.0 - - - 13 10 38 12 - - 175 41
22 years old 315 60 19.0 - - - - - - - - - - - - - 4 4 16 10 16 17 - 188 6E23 years old 294 38 12.9 -
7 14 5 2 210 4E24 years old 275 27 9.8 - - - - - - - - - - - - - - 2 8 13 4 - - 177 7C25 to 29 years old 1,409 84 6.0 - - - - - - - - - - - - - 2 16 31 9 21 - 7 1,041 28430 to 34 years old 1,243 80 6.4 - - 11 9 19 13 10 9 8 91i 245
ij a

upTable 39. Single Grade of Enrollment and High School Graduation Status for Persons 3 to 34 )(ears Old by Age, Sex, Race, and Hispanic Origin: ha
October 1984-Continued
(Numbers in thousr,ada. Civilian noninstitutional population. For meaning of symbols, see text'
Ag,, sex,race, and
Hispanicorigin
Popu-
lation
EnrolledNot enrolled
Total
Nur,-ery
Kin-der-
garter
Elementary school (year) High school y, .) Collegc (year)
NumberPer-
cent 1 2 3 4 5 6 7 8 1 2 3 4 1 2 3 4 5
6 or
more
Highschool
graduate
Not highschool
graduate
HISPANIC ORIGIN'
Male 4,446 2,161 4.6 52 139 190 140 142 146 150 148 179 149 143 145 114 91 64 68 38 28 17 17 1,084 1,201
3 yetrs old 135 19 14.1 19 - - - - - - - - - - - - - - 1164 ,ears old 164 40 24.4 25 15 - - - - - - - - - - - - - - - - - - - 1245 years old 162 144 88.9 5 115 24 - - - - - - - - - - - - - - 186 years old 153 151 98.7 2 10 127 12 - - - - - - - - - - - - - - - 2
7 years old 136 134 98.5 - 31 92 o 2 - - - - - - - - - - - - - - 2
8 years old L54 148 96.1 6 32 93 15 2 - - - - - - - - - - - 69 years old 120 120 100.0 - 2 3 s7 67 10 1 - - - - - - - - - - -
10 years old 157 157 100.0 - - 3 55 87 10 2 - - - - - - - - - -
11 years old 143 143 100.0 - - - - 8 42 78 12 2 - - - - - - - - - - - -
12 yeas old 154 154 100.0 - - - - - 7 45 90 11 1 - - - - - - - - - - -
13 years old 142 142 100.0 - - - - - - 11 53 68 7 - 2 - - - - - - - -
14 y.ars old 127 121 95.3 - - - - - - 2 2 17 48 50 3 - - - - - - - - - 6
lc years old 163 156 95.7 - - - - 5 17 54 72 8 - - - - - - 6
16 years old 146 134 91.8 -- - - - 3 24 46 47 14 - - - - - - - 12
17 years old 123 95 77.2 - - - - - - 3 5 39 36 2 - - - - - 3 25
18 years old 131 60 45.8 - - - - - - - - - - 4 7 8 22 15 4 1 - - - 32 4019 years old 118 37 31.4 - - - - - - - - - - - 9 4 6 15 2 - - - 56 2620 years old 113 34 30.1 - - - - - - - - - - - 6 8 12 7 - - - 36 4421 years old 146 38 26.0 - - - - - - - - - - - 2 1 - 7 S 11 8 - - 53 55
22 years old 155 28 18.1 - - - - - - - - - - - 2 6 7 6 4 2 2 66 61
23 years old 152 15 9.9 - - - - - - - - - - - 2 2 1 1 3 4 2 76 6124 years old 141 12 8.5 - - - - - - - - - - - - - 2 - 6 2 - 1 2 77 5225 to 29 years old 743 51 6.9 - - - - - - - - - - - - 2 12 10 4 9 7 7 396 29530 to 34 years old 567 26 4.6 - - - - - - - - - - - - - 6 3 4 4 4 5 289 251
Female 4,536 2,124 4o.8 65 153 ,50 185 124 145 144 145 146 100 123 114 130 107 116 76 43 30 13 14 1,202 1,2113 years old 150 24 16.0 23 2 - - - - - - - - - - - - 126i years old 172 66 38.4 38 23 - - - - - - - - - - - - - - - - - - 1t55 years old 131 120 91.6 2 1C8 11 - - - - - - - - - - - - 11
5 years old 138 134 97.1 3 15 96 19 - - - - - - - - - - - - - - - - - 5
7 years old 173 173 100.0 - - 38 122 7 2 4 - - - - - - - - - - - - - - -
B years old 147 144 98.0 - 5 40 83 15 - - - - - - - - - - - - - - - 3
3 years old 133 133 '00.0 - - - 3 28 88 12 - 2 - - - - - - - - - - - -
10 years old 130 130 00.0 - - - 6 30 78 15 - - - - - - - - - - - - -
11 years old 146 146 00.0 - - - - - 10 44 87 12 - - - - - - - - - - - - -
2 years old 120 114 95.0 - - - - - - 6 35 67 6 - - - - - - - - - 5
3 years old 127 125 98.4 - - - - - - - 9 52 51 3 - - - - - - - - - 2
4 years old 136 132 97.1 - - - - - - - 2 11 25 81 13 - - - - - - - 5
1.5 vears old 113 103 91.2 - - - - - - - 3 2 6 23 52 15 1 - - - - - 10I6 years old 121 LO5 86.8 - - - - - - - - - - 5 28 63 9 - - - - - - 15I7 years old 150 128 85.3 - - - - - - - - - 4 14 44 64 3 - - - - 3 1918 years old 155 79 51.0 - - - - - - - - 3 1 18 51 5 - - - 41 3519 years old 156 48 30.8 - - - - - - - - - - - 3 3 4 16 17 5 - - 62 4620 years old 139 45 32.4 - - - - - - - - - 2 2 5 23 12 1 - 49 4621 years old 128 32 25.0 - - - - - - - - - - - - 2 7 2 7 :3 : 2 54 42
22 years old 143 18 12.6 - - - - - - - - - - - - - 2 - 4 4 2 6 - 88 3723 years old 171 9 5.3 - - - - - - - - - - - - - 2 2 - 5 - 77 8524 years old 168 24 14.3 - - - - - - - - - 3 - 2 6 5 4 1 3 - 83 6225 to 29 years old 761 56 7.4 - - - - - - - - - - 3 - - 2 20 9 12 2 . 6 399 30630 to 34 years old 628 36 5.7 - - - - - - - - 2 1 - 1 7 8 1 6 3 6 345 247
'May be of any race.
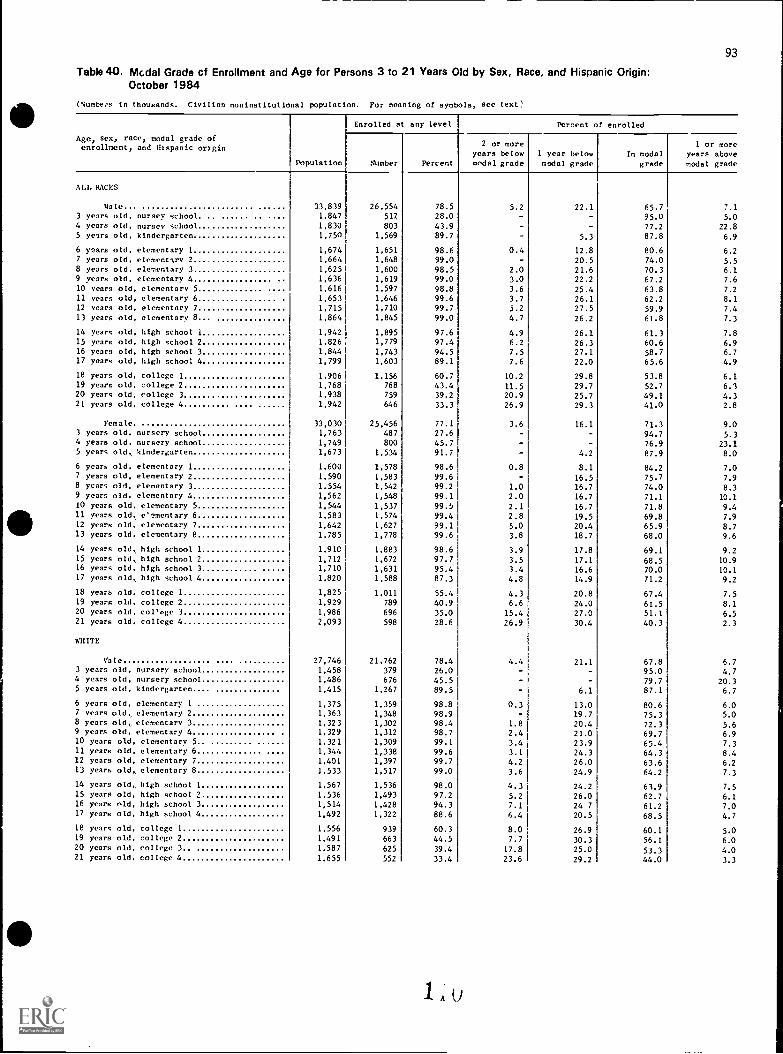
93
Table 40. Mcdal Grade cf Enrollment and Age for Persons 3 to 21 Years Old by Sex, Race, and Hispanic Origin:October 1984
('umbers in thousands. Civilian noninstitutional population. For meaning of symbols, see text)
Age, sex, race, modal grade ofenrollment, and Hispanic origin
Population
Enrolled at any level Percent of enrolled
Number Percent
2 or moreyears belowmedal grade
1 year below
modal gradeIn modal
grade
1 or moreyears abovemodal grade
ALL RACES
Male 33,839 26,554 78.5 5.2 22.1 65.7 7.13 years old, nursey school. .. ...... .. 1,847 517 28.0 - - 95.0 5.04 years old, nursev school 1,830 803 43.9 - 77.2 22.85 years old, kindergarten 1,750 1,569 89.7 - 5.3 87.8 6.9
6 years old, elementary 1 1,674 1,651 98.6 0.4 12.8 80.6 6.27 years old, elementary 2 1,664 1,648 99.0 20.5 74.0 5.58 years old, elementary 3 1,625 1,600 98.5 2.0 21.6 70.3 6.19 years old, elementary 4 1,636 1,619 99.0 3.0 22.2 67.2 7.610 Years old, elementary 5 1,616 1,597 98.8 3.6 25.4 63.8 7.2
11 years old. elementary 6 1,653 1,646 99.6 3.7 26.1 62.2 8.112 years old, elementary 7 1,715 1,710 99.7 3.2 27.5 59.9 7.413 years old, elementary 8 1,864 1,845 99.0 4.7 26.2 61.8 7.3
14 years old, high school i 1,942 1,895 97.6 4.9 26.1 61.3 7.815 years old, high school 2 1,826 1,779 97.4 6.2 26.3 60.6 6.916 years old, high school 3 1,844 1,743 94.5 7.5 27.1 58.7 6.717 years old, high school 4 1,799 1,603 89.1 7.6 22.0 65.6 4.9
18 years old, college 1 1,906 1,156 60.7 10.2 29.8 53.8 6.119 years old, college 2 1,768 768 43.4 11.5 29.7 52.7 6.120 years old, college 3 1,938 759 39.2 20.9 25.7 49.1 4.321 years old, college 4 1,942 646 33.3 26.9 29.3 41.0 2.8
Female. 33,030 25,456 77.1 3.6 16.1 71.3 9.03 years old, nursery school 1,763 487 27.6 - 94.7 5.34 years old, nursery school 1,749 800 45.7 - 76.9 23.15 years old, kindergarten 1,673 1,534 91.7 - 4.2 87.9 8.0
6 years old, elementary 1 1,600 1,578 98.6 0.8 8.1 84.2 7.07 years old, elementary 2 1,590 1,583 99.6 16.5 75.7 7.98 years old, elementary 3 1,554 1,542 99.2 1.0 16.7 74.0 8.39 years old, elementary 4 1,562 1,548 99.1 2.0 16.7 71.1 10.110 years old, elementary 5 1,544 1,537 99.5 2.1 16.7 71.8 9.411 years old, e'ementary 6 1,583 1,574 99.4 2.8 19.5 69.8 7.912 years old, elementary 7 1,642 1,627 99.1 5.0 20.4 65.9 8.713 years old, elementary 8 1,785 1,778 99.6 3.8 18.7 68.0 9.6
14 years old, high school 1 1,910 1,883 98.6 3.9 17.8 69.1 9.215 years old, high school 2 1,712 1,672 97.7 3.5 17.1 68.5 10.916 years old, high school 3 1,710 1,631 95.4 3.4 16.6 70.0 10.117 years old,, high school 4 1,820 1,588 87.3 4.8 14.9 71.2 9.2
18 years old, college 1 1,825 1,011 55.4 4.3 20.8 67.4 7.519 years old, college 2 1,929 789 40.9 6.6 24.0 61.5 8.120 years old, col'ege 3 1,986 696 35.0 15.4 27.0 51.1 6.521 years old, college 4 2,093 598 28.6 26.9 30.4 40.3 2.3
WHITE
Vale 27,746 21,762 78.4 4.4 21.1 67.8 6.73 years old, nursery school 1,458 379 26.0 - 95.0 4.74 years old, nursery school 1,486 676 45.5 - 79.7 20.35 years old, kindergarten 1,415 1,267 89.5 6.1 87.1 6.7
6 years old, elementary 1 1,375 1,359 98.8 0.3 13.0 80.6 6.07 years old, elementary 2 1,363 1,348 98.9 19.7 75.3 5.08 years old, elementary 3 1,323 1,302 98.4 1.8 20.4 72.3 5.69 years old, elementary 4 1,329 1,312 98.7 2.4 21.0 69.7 6.910 years old, elementary 5 1,321 1,309 99.1 3.4 23.9 65.4 7.311 years old, elementary 6 1,344 1,338 99.6 3.1 24.3 64.3 8.412 years old, elementary 7 1,401 1,397 99.7 4.2 26.0 63.6 6.213 years old, elementary 8 1,533 1,517 99.0 3.6 24.9 64.2 7.3
14 years old, high school 1 1,567 1,536 98.0 4.3 24.2 63.9 7.515 years old, high school , 1,536 1,493 97.2 5.2 26.0 62.7 6.116 years mld, high school 3 1,514 1,428 94.3 7.1 24 7 61.2 7.017 years old, high school 4 1,492 1,322 88.6 6.4 20.5 68.5 4.7
18 years old, college 1 1,556 939 60.3 8.0 26.9 60.1 5,019 years old, college 2 1,491 663 44.5 7.7 30.3 56.1 6.020 years old, college 3 1,587 625 39.4 17.8 25.0 53.3 4.021 years old, college 4 1.655 552 33.4 23.6 29.2 44.0 3.3

94
Table 40. Mmiel thede of Enrollment and Age for Persons 3 to 21 Years Old by Sex, Raco, and Hispanic Origin:October 1984- Continued
(Numbers in thousands. Civilian noninstitutional population. For meaning of symbols, see text)
Age, sex, raco, moial grade ofenrollment, and Hispanic origin
WHITE--Continued
Female3 years old, nursery school4 years old, nursery school5 years old, kindergarten
6 years old, elementary 17 years old elementary 28 years old, elemen.ary 39 years old, elementary 410 years old, elementary 511 years old elementary 612 years old, elementary 713 years old, elementary 8
14 years old, high school 115 years old high school 216 years old, high school17 years old, high school 4
18 years old, college 119 years old, college 220 years old, college 321 years old college 4
BLACK
Male3 years olc., nursery school
4 years old, nursery school5 years old, kindergarten
6 years old, elementary 17 years old, elementary 28 years old, elementary 39 years old, elementary 410 years old, elementary 511 years old, elementary 612 years old, elemeAtary 713 years old, elementary 8
14 years old, high school 115 years old, high m.::hocl 2
16 years old, high Lhool 317 years old, high :ohool 4
18 years old, college 119 years old, college 220 years old, college 321 years old, college 4
Female3 years old, nursery school4 years old, nursery school5 years old, kindergarten
6 years old elementary 17 years old elementary 28 years old, elementary 39 years old, olcmenter, 410 years old, elementary 511 years old elementary 612 years old elementary 713 years old, elementary 8
14 years old high school 115 years old, high school 216 years old, h:ga school 317 years old high school 4
18 years old, college 119 years old, college 220 years old, college 321 years old, -ol.ege 4
Enrolled at any level Percent of enrolled
Population Number Percent
2 or moreyears belowmodal grade
1 year belowmodal grade
In modalgrade
1 or more
years abovemodal grade
26,920 ,u,761 77.1 3.2 15.0 73.5 8.31,418 388 27.4 95.4 4.41,420 638 44.9 79.5 20.5
1,343 1:34 91.9 3.8 89.3 6.9
1,292 1,273 98.5 0.8 7.9 R5,6 5.7
1,289 1,284 99.6 16.0 76.9 7.2
1,273 1,264 99.3 1.0 1'.6 74.4 6.8
1,266 1,254 99.1 1.9 14.1 72.2 9.91,243 1,237 99.5 2.3 15.7 74.8 7.3
1,278 1,272 99.5 2.4 16.7 72.6 8.3
1,321 1,307 98.9 3.7 19.1 68.9 8.3
1,459 1,454 2.5 18.0 70.3 9.1
1,546 1,522 98.4 3.4 15.6 72.8 8.2
1,408 1,373 97.5 3.4 15.4 70.9 10.3
1,409 1,340 95.1 2.8 14.9 72.0 10.2
1,494 1,301 87.1 4.2 14.0 72.6 9.4
1,491 842 56.5 3.2 18.4 71.9 6.7
1,601 690 43.1 4.9 21.7 65.4 8.01,628 595 36.5 13.9 25.5 54.3 6.2
1,741 493 28.3 26.4 26.0 45.0 2.8
4,928 3,836 77.8 9.0 27.7 55.2 8.2
292 107 36.6 92.5 7.5
279 106 38.0 61.3 38.7
259 229 88.4 0.9 91.7 7.4
245 239 97.6 0.8 13.4 79.5 6.7
245 242 98.8 25.6 68.2 6.6
239 237 99.2 3.4 30.4 59.9 6.3240 240 100.0 7.1 27.9 54.2 11.3
239 234 97.9 5.6 32.5 56.0 5.6
248 247 99.6 6.1 36.0 52.6 5.7
255 254 99.6 10.2 31.9 44.9 13.4
272 270 99.3 11.1 33.3 50.0 5.6
305 291 95.4 7.9 35.7 48.5 8.2
240 237 98.8 13.1 26.6 51.1 9.7
278 264 95.0 9.8 40.9 45.8 3.4
251 230 91.6 13.5 30.4 50.0 5.7
298 180 60.4 22.2 42.8 22.8 11.7
226 75 33.2 33.3 30.7 32.0 2.7
295 100 33.9 30.0 33.0 30.0 6.0222 54 24.3 22.2 25.9
5,002 3,791 75.9 5.4 21.1 61.2 12.1
285 84 29.5 89.3 9.5275 136 49.5 62.5 37.5
256 233 91.0 5.6 80.7 13.7
241 241 100.0 10.4 78.0 12.0240 240 100.0 19.2 69.6 11.3
235 233 99.1 1.3 13.3 70.8 14.6
236 234 99.2 3.0 20.5 65.4 11.1
235 233 99.1 1.7 19.7 59.2 18.9
244 243 99.6 4.9 29.6 58.0 7.0
253 252 99.6 10.3 27.8 51.6 9.9
270 269 99.6 10.4 21.6 58.4 9.3
297 297 4.7 26.6 55.6 13.1
235 230 9 3.9 26.1 57.0 13.5
255 246 96.5 4.1 24.4 63.0 8.5277 241 87.0 6.6 19.5 64.7 9.1
290 141 48.6 9.9 31.9 46.8 10.6
279 88 31.5 18.2 39.8 30.7 11.4
307 79 25.7 26.6 35.4 32.9 6.3292 76 26.0 34.2 50.0 15.8
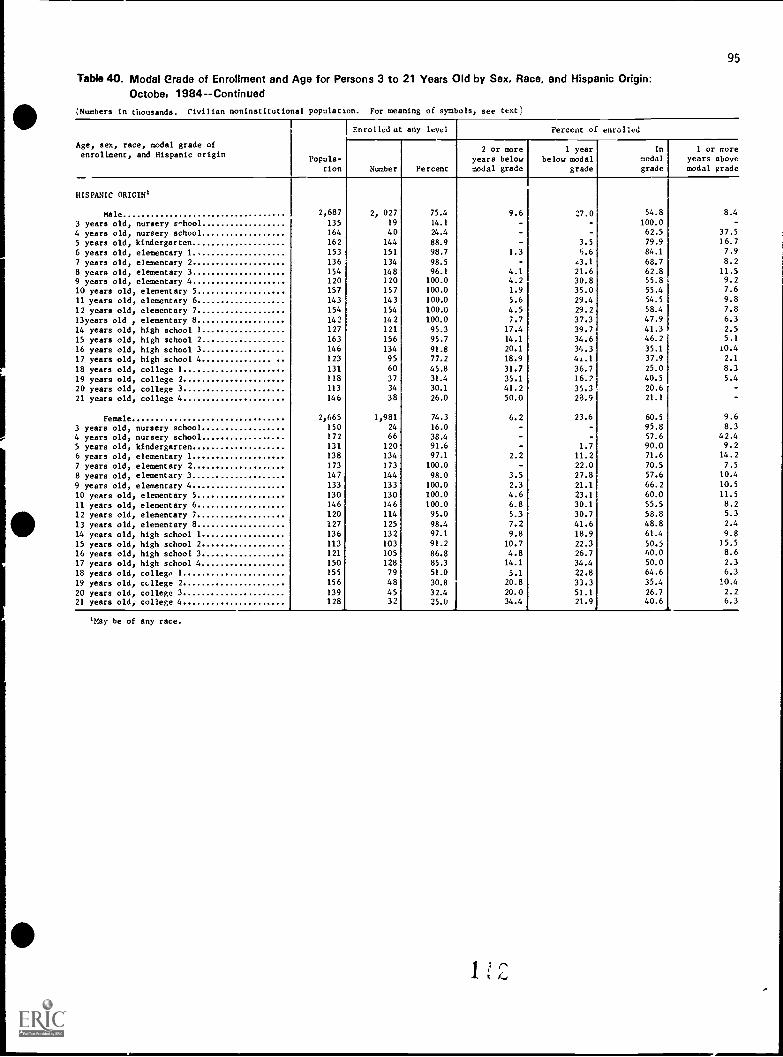
95
Table 40. Modal Grade of Enrollment and Age for Persons 3 to 21 )(ears Old by Sex, Race, and Hispanic Origin:
Octobe, 19E14-Continued
(Numbers in thousands. Civilian noninstitutional population. For meaning of symbols, see text)
Age, sex, race, modal grade ofenrollment, and Hispanic origin
Popula-tion
Enrolled at any level Percent of enrolled
Number Percent
2 or moreyears belowmodal grade
1 year
below modalgrade
In
modal
grade
1 or moreyears abovemodal grade
HISPANIC ORIGIN'
Hale 2,687 2, 027 75.4 9.6 27.0 54.8 8.4
3 years old, nursery s-hool 135 19 14.1 - - 100.0
4 years old, nursery school 164 40 24.4 - - 62.5 37.5
5 years old, kindergarten 162 144 88.9 - 3.5 79.9 16.7
6 years old, elementary 1 153 151 98.7 1.3 6.6 84.1 7.9
7 years old, elementary 2 136 134 98.5 c3.1 68.7 8.2
8 years old, elementary 3 154 148 96.1 4.1 21.6 62.8 11.5
9 years old, elementary 4 120 120 100.0 4.2 30.8 55.8 9.2
10 years old, elementary 5 157 157 100.0 1.9 35.0 55.4 7.6
11 years old, elementary 6 143 143 100.0 5.6 29.4 54.5 9.8
12 years old, elementary 7 154 154 100.0 4.5 29.2 58.4 7.8
13years old , elementary 8 142 142 100.0 7.7 37.3 47.9 6.3
14 years old, high school 1 127 121 95.3 17.4 39.7 41.3 2.5
15 years old, high school 2 163 156 95.7 14.1 34.6 46.2 5.1
16 years old, high school 3 146 134 91.8 20.1 34.3 35.1 t0.4
17 years old, high school 4 123 95 77.2 18.9 4/.1 37.9 2.1
18 years old, college 1 131 60 45.8 31.7 36.7 25.0 8.3
19 years old, college 2 118 37 31.4 35.1 16.7 40.5 5.4
20 years old, college 3 113 34 30.1 41.2 35.1 20.6
21 years old, college 4 146 38 26.0 50.0 23.9 21.1 -
Female 2,665 1,981 74.3 6.2 23.6 60.5 9.6
3 years old, nursery school 150 24 16.0 - 95.8 8.3
4 years old, nursery school 172 66 38.4 - - 57.6 42.4
5 years old, kindergarten 131 120 91.6 - 1.7 90.0 9.2
6 years old, elementary 1 138 134 97.1 2.2 11.2 71.6 14.2
7 years old, elementary 2 173 173 100.0 - 22.0 70.5 7.5
8 years old, elementary 3 147 144 98.0 3.5 27.8 57.6 10.4
9 years old, elementary 4 133 133 100.0 2.3 21.1 66.2 10.5
10 years old, elementary 5 130 130 100.0 4.6 23.1 60.0 11.5
11 years old, elementary 6 146 146 100.0 6.8 30.1 55.5 8.2
12 years old, elementary 7 120 114 95.0 5.3 30.7 58.8 5.3
13 years old, elementary 8 127 125 98.4 7.2 41.6 48.8 2.4
14 years old, high school 1 136 132 97.1 9.8 18.9 61.4 9.8
15 years old, high school 2 113 103 91.2 10.7 22.3 50.5 15.5
16 years old, high school 3 121 105 86.8 4.8 26.7 60.0 8.6
17 years old, high school 4 150 128 85.3 14.1 34.4 50.0 2.3
18 years old, college 1 155 79 51.0 5.1 22.8 64.6 6.3
19 years old, college 2 156 48 30.8 20.8 33.3 35.4 10.4
20 years old, college 3 139 45 32.4 I 20.0 51.1 26.7 2.2
21 years old, college 4 128 32 25.0 1 34.4. 21.9 40.6 6.3
'May be of any race.
t

96
Table 41. Persons 35 Years Old and Over by Enrollment and Attendance Status, Labor Force Status, Marital Status, Sex,and Race: October 1984
(In thousands. Civilian noninstitutional population. For meaning of symbols, see text)
Enrollment and attendance status, laborforce status, and marital status
All races white Black and other races
Both sexes Male Female Both sexes Male Female Both sexes Male Female
ENROLLMENT STATUS
Total 101,528 46,777 54,749 89,371 41,442 47,929 12,157 5,337 6,820Enrolled in school:
Below college level 123 50 73 102 42 60 21 8 13In college 1,445 476 970 1,252 402 851 193 74 119
Full time 264 95 170 229 82 148 35 13 22Part time 1,181 381 800 1,023 320 703 158 61 97
Not enrolled in school 99,960 46,253 53,706 88.017 40,998 47,018 11,943 5,255 6,688
LABOR FORCE STATUS
In labor force 57,512 32,819 24,694 50,342 29,201 21,143 7,170 3.618 3,551Enrolled in college 1,114 401 713 970 346 624 144 55 89
Enrolled full time 126 46 80 114 46 68 12 - 12Enrolled part time 988 355 633 856 300 556 132 55 77
Not enrolled in college 56,398 32,418 23,981 49,372 28,855 20,519 7,026 3,563 3,462
Not in labor force 44,014 13,961 30,055 39,027 12,242 26,786 4,987 1,719 3,269Enrolled in college 332 74 258 283 55 228 49 19 30
Enrolled full time 138 48 90 115 35 80 23 13 10
Enrolled part time 194 26 168 168 20 148 26 6 20Not enrolled in college 43,682 13,887 29,797 38,744 12,187 26,558 4,938 1,700 3,239
MARITAL STATUS
Married, spouse present 71,258 37,087 34,171 64,637 33,549 31,088 6,621 3,538 3,083Enrolled in college 996 368 628 891 320 571 105 48 57
Enrolled full time 152 56 96 136 50 86 16 6 10Enrolled part time 844 312 532 755 270 485 89 42 47
Not enrolled in college 70,262 36,719 33,543 63,746 33,229 30,517 5,516 3,490 3,026
Other marital status 30,270 9,692 20,578 24,734 7,893 16,841 5,536 1,799 3,737Enrolled in college 449 108 342 361 82 280 88 26 62Enrolled full time 112 39 74 93 32 62 19 7 12Enrolled part time 337 69 268 268 50 218 69 19 50
Not enrolled in college 29,821 9,584 20,236 24,373 7,811 16,561 5,448 1.773 3,675

97
Table 42. Attendance Status of College Undergraduates 16 to 34 Years Old by Sex, Age, and Type, Year, and Control ofCollege: October 1984
(Numbers in thousands. Civilian noninstitutional population. For meaning of symbols, see text)
Age, type, year, and control of college
Both sexes Male Female
Totalenrolled
Attending full time
Totalenrolled
Attending full time
Totalenrolled
Attending full time
Number Percent Number Percent Number Percent
ALL COLLEGES
Total 9,052 6,817 75.3 4,503 3,517 78.1 4,548 3 299 72.516 and 17 years old 247 226 91.5 89 83 93.3 159 143 89.918 and 19 years old 2,867 2,614 91.2 1,373 1,256 91.5 1,495 1,358 90.820 and 21 years old 2,565 2,221 86.6 1,318 1,166 88.5 1,246 1.055 84.722 to 24 years old 1,547 1,067 69.0 874 658 75.3 673 409 60.825 to 29 years old 1,150 496 43.1 565 271 48.0 584 225 38.530 to 34 years old 676 193 28.5 284 85 29.9 394 110 27.9
Year:
First 3,018 2,189 72.5 1,444 1,091 75.6 1,574 1,099 69.8Second 2,454 1,835 74.8 1.206 942 78.1 1,249 892 71.4Third 1,980 1,518 76.7 994 774 77.9 985 744 75.5Fourth 1,599 1,275 79.7 859 712 82.9 741 563 76.0
Control:Public 7,237 5,318 73.5 3.635 2,781 76.5 3,602 2,537 70.4Private 1,816 1,499 82.5 869 737 84.8 948 762 80.4
TWO-YEAR COLLEGES
Total 2.756 1,579 57.3 1.333 812 60.9 1,422 766 53.916 and 17 years old 51 42 (B) 16 14 (B) 36 27 (B)18 and 19 years old 943 770 81.7 440 364 82.7 503 406 80.820 and 21 years old 525 330 62.9 284 190 66.7 241 140 58.422 to 24 years old 442 190 42.9 235 119 50.8 207 71 34.025 to 29 years old 476 168 35.3 227 87 38.2 248 81 32.730 to 34 years old 319 79 24.9 131 39 29.4 188 41 21.1
Year:First 1,361 790 58.1 592 365 61.6 769 426 55.3Second 1,113 693 61.2 583 398 68.3 531 295 55.6Third 281 95 33.9 159 50 31.4 122 45 37.2
Control:Public 2,496 1,388 55.6 1,220 726 59.5 1,276 662 51.9Private 260 191 73.5 113 87 76.6 147 104 71.0
FOUR-YEAR COLLEGES
Total 5,940 4,975 83.8 3,012 2,588 85.9 2,928 2,387 81.516 and 17 years old 130 122 94.1 45 41 (B) 85 82 96.618 and 19 years old 1,829 1,759 96.2 894 858 96.0 935 901 96.420 and 21 years old 1,961 1,825 93.1 1,001 949 94.8 960 876 91.222 to 24 years old 1,067 849 79.6 622 525 84.4 445 324 72.825 to '9 years old 631 311 49.3 313 170 54.2 318 141 44.530 to 34 years old 323 109 33.9 136 46 33.4 186 64 34.2
Year.First 1,435 1,249 8' 0 756 661 87.3 679 588 86.6Second 1,273 1,085 85.2 587 515 87.6 686 570 83.1Third 1,632 1,367 83.7 809 701 ,.6 823 66o 80.9Fourth 1,599 1,275 79.7 859 712 32.9 741 563 76.0
Control:Public 4,474 3,729 83.4 2,309 1,974 85.5 2,165 1,755 81.1Private 1,466 1,246 85.0 703 614 87.4 764 632 82.8
First and second years 2,708 2,333 86.2 1,344 1.175 87.5 1,365 1,158 84.916 and 17 years old 128 122 95.4 45 41 (B) 82 81 98.718 and 19 years old 1,721 1,659 96.4 848 816 96.2 873 843 96.620 and 21 years old 389 333 85.6 200 178 88.9 189 155 82.222 to 24 years old 201 127 63.: 127 88 69.5 74 39 (B)25 to 29 years old 182 65 35.8 86 40 46.4 96 25 26.430 to 34 years old 87 26 30.3 37 13 (13) 50 14 (B)
Control:Public 1,980 1,694 85.6 993 862 86.8 987 832 84.3Private 729 639 87.7 350 313 89.3 378 326 86.3
TYPE OF COLLEGE NOT REPORTEP
Total, 16 to 34 years old 356 263 7'.8 158 117 74.1 198 146 73.6

98
Table 43, Year of High School Graduation for College Undergraduates 16 to 34 Years Old by Type and Year of College andSex: October 1984
(In thousands. Civilian noninstitutional population. For me,ning of symbols, see text)
Year and type of
Male Female
Year of Figh school graduation Year of high school graduation
college 1979 or earlier 1979 or earlier
1981 1981
Under 23 26 to 28 29 to 34 Under 26 26 to 28 '9 to 34to to
Total 1984 1983 1980 years old years old years old Total 1984 1983 1980 years old years old yeas old
ALL COLLEGES'
Total 4,503 801 1,942 483 586 327 365 4,548 865 1,952 399 543 341 449
First year 1,444 771 347 61 96 75 95 1,574 853 326 49 110 98 138
Second year 1,206 21 760 78 146 89 113 1,249 6 836 64 138 77 127
Third year 994 5 585 112 127 77 88 985 3 545 116 137 87 97
Fourth year 859 3 248 232 218 87 71 741 4 244 171 156 79 87
TWO-YEAR COLLEGES
Total 1,333 237 525 96 172 134 169 1,422 312 480 88 198 138 207
First year 592 230 173 36 50 45 57 769 310 189 35 81 64 91
Second year 583 7 299 50 87 64 76 531 2 259 39 87 53 91
Third year 159 51 10 35 16 37 122 31 15 29 22 25
FOUR-YEAR COLLEGES
Total 3,012 516 1.364 382 397 182 172 2,928 494 ',392 308 Ji..7 193 213
First year 756 501 151 25 36 25 20 679 486 101 13 18 28 33
Second year 587 7 444 28 52 23 34 686 3 554 23 50 24 31
Third year 809 5 520 97 92 46 48 823 2 492 101 99 62 67
Fourth year 859 3 248 232 218 87 71 741 4 244 171 156 79 87
'Includes type not mported, not shoan separately.
Table 44. En.ollment Status in 1983 for College Undergraduates 14 to 24 Years Old by Type of College, EducationalAttainment, Age, and Sex: October 1984
(In thousands. CiviliaL noninstitutional population)
Age, years of college completed,and type of college
Both sexes Male Female
Enrolled Not enrolled Enrolled Not enrolled Enrolled '0t enrolled
Total Oct. 1983 Oct. 1983 Total Oct. 1983 Oct. 1983 Total Oct. 1983 Oct. 1983
ALL COLLEGES
Total 7,231 6,146 1,084 3,657 3,125 A2 3,574 3,021 552
14 to 17 years old 253 230 22 91 81 11 162 149 13
18 and 19 years old 7,867 2,613 254 1,372 1,265 107 1,495 1,348 147
0 and 21 years old 2,565 2,178 387 1,318 1,127 191 1,246 1 050 195
'2 to 24 years old 1,547 1,125 422 874 651 222 673 473 200
Years of college completed:None 2,540 1,965 574 1,251 968 282 1,290 998 292
1 year or more 4,690 4,180 511 2.407 2,155 249 2,285 2,024 260
TWO-YEAR COLLEGES
Total 1,961 1,497 464 975 752 223 986 745 241
14 to 17 years old 51 47 4 16 14 1 36 33 3
18 and 19 years old 943 849 94 440 403 37 503 446 57
20 and 21 years old 525 371 154 284 206 78 241 165 75
22 to 24 years old 442 229 213 235 129 106 207 100 107
Years of college completed:None 1,054 742 312 479 338 141 576 405 171
1 year or more 907 754 153 497 413 82 411 341 70
FOUR-YEAR COLLEGES
Total 4,987 4,437 549 2,562 2,281 281 2,424 2,156 268
14 to 17 years old 130 117 12 45 38 8 85 80 5
18 and 19 years old 1,820 1,680 149 894 825 69 935 855 80
20 and 21 years old 1,961 1,755 206 1,001 901 100 960 854 106
22 to 24 years old 1,067 885 182 622 517 104 445 367 78
Years of college completed:
None 1,306 1.100 206 700 580 120 606 520 86
1 year or more 3,6L0 3.337 343 1,862 1,701 161 1,818 1,635 182
First and second years 2,439 2.112 327 1,220 1,043 177 1,219 1,069 150
14 to 17 years old 128 115 12 45 38 8 82 78 5
18 and 19 years old 1,721 1,576 145 848 779 69 873 797 76
20 Rnd 21 years old 389 295 94 200 148 52 189 147 42
22 to 24 years old 201 126 75 127 78 49 74 48 26
Years of college completed:None 1,300 1,096 204 695 576 120 605 520 85
1 year or more 1,138 1,016 124 525 467 58 614 549 65
TYPE OF COLLEGE NOT REPORTED
Total, 14 to 24 years o:C 283 212 71 120 92 28 164 I 120 43
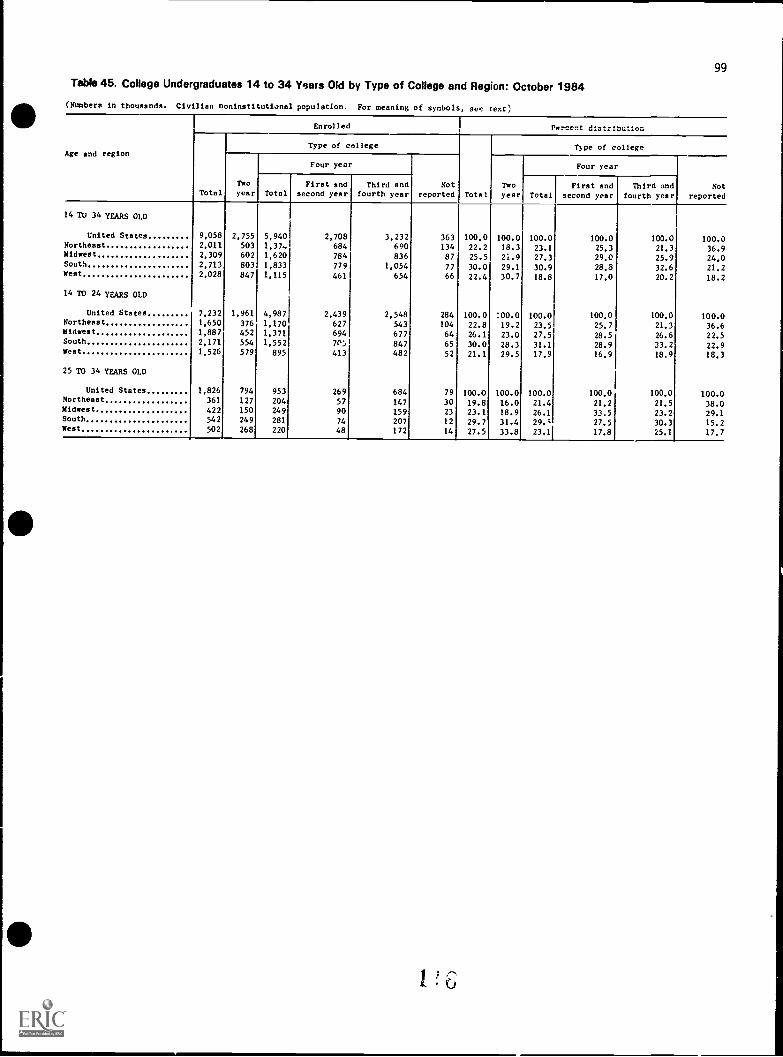
99
Tab4e 45. College Undergraduates 14 to 34 Years Old by Type of College and Region: October 1984
(Numbers in thousands. Civilian noninstitutional population. For meaning of symbols, see text)
Age and region
Enrolled Percent distribution
Total
Type of college
Total
Type of college
Twoyear
Four year
Notreported
Twoyear
Four year
Not
reportedTotalFirst and
second yearThird and
fourth year TotalFirst and
second yearThird and
fourth year
14 To 34 YEARS OLD
United States 9,058 2,755 5,940 2,708 3,232 363 100.0 100.0 100.0 100.0 100.0 100.0Northeast 2,011 503 1,37» 684 690 134 22.2 18.3 23.1 25.3 21.3 36.9Midwest 2,309 602 1,620 784 836 87 25.5 2i.9 27.3 29.0 25.9 24.0Soutti 2,713 803 1,833 779 1,054 77 30.0 29.1 30.9 28.8 32.6 21.2West 2,028 847 1,115 461 654 66 22.4 30.7 18.8 17.0 20.2 18.2
14 TO 24 YEARS OLD
United States 7,232 1,961 4,987 2,439 2,548 284 100.0 100.0 100.0 100.0 100.0 100.0Northeast 1,650 376 1,170 627 543 104 22.8 19.2 23.5 25.7 21.3 36.6Midwest 1,887 452 1,371 694 677 64 26.1 23.0 27.5 28.5 26.6 22.5South 2,171 554 1,552 7P; 847 65 30.0 28.3 31.1 28.9 33.2 22.9West 1,526 579 895 413 482 52 21.1 29.5 17.9 16.9 18.9 18.3
25 TO 34 YEARS OLD
United States 1,826 794 953 269 684 79 100.0 100.0 100.0 100.0 100.0 100.0Northeast 361 127 204 57 147 30 19.8 16.0 21.4 21.2 21.5 38.0Midwest 422 150 249 90 159 23 23.1 18.9 26.1 33.5 23.2 29.1South 542 249 281 74 207 12 29.7 31.4 29.E 27.5 30.3 15.2West 502 268 220 48 172 14 27.5 33.8 23.1 17.8 25.1 17.7

100
Table 46. Marital Status of College Undergraduates 14 to 34 Years Olc by Type of College, Attendance Status, Age, andSex: October 1984
(Number.; in thousands. Civilian non1nstitutional population. For meaning of symbols, see text
Roth sexes Male Female
kge, attendance status, and type of college Married, spouse Married, spouse Married, spousePresent present Present
Total Total Totalenrolled Number Percent enrolled Number Percent enrolled Number Percent
41.L COLLEGES
Total 9,058 1,320 14.6 4,506 622 13.8 4,551 697 15.3'4 to 19 years.old 3,120 32 1.0 1,464 3 0.2 1,657 29 1.820 and 21 years old 2,565 124 4.8 1.318 46 3.5 1.246 77 6.2?2 to 24 years old 1,547 248 16.0 874 117 13.4 673 131 19.5?5 to 34 years old 1,828 916 50.1 849 457 53.8 978 459 46.9
Attending full time 6,823 517 7.6 3,520 261 7.4 3,302 257 7.814 to 19 years old 2,846 26 0.9 1,341 3 0.2 1,504 24 1.6?0 and 21 years old 2,221 81 3.6 1,166 37 3.2 1,055 43 4.1?2 to 24 years old 1,067 1/3 11.1 658 61 9.3 409 57 13.9?5 to 34 years old 689 292 42.4 356 158 44.4 335 132 39.4
MO-YEAR COLLEGES
Total 2,756 569 20.6 1,333 261 19.6 1,422 308 21.6'4 to 19 years old 994 13 1.3 456 2 0.4 539 11 2.0?0 and 21 years old 525 35 6.7 284 8 3.0 241 27 11.122 to 24 years old 442 114 25.8 235 57 24.1 207 57 27.725 to 34 years old 795 406 51.1 358 194 54.2 436 212 48.6
Attending full time 1,579 161 10.2 812 84 10.3 766 77 10.14 to 19 years old 812 11 1.4 378 2 0.5 433 9 2.1?0 and 21 years.old 330 15 4.4 190 5 2.9 140 9 6.5'2 to 24 years old 190 38 19.9 119 25 20.7 71 13 (8)'5 to 34 years old 247 97 39.3 126 51 40.5 122 46 37.7
FOUR -YEAR COLLEGES
Total 5,940 677 11.4 3,012 323 10.7 2,928 353 12.14 to 19 years old 1,959 15 0.8 939 1 0.1 1,020 14 1.420 and 21 years old 1,961 81 4.1 1,001 32 3.2 960 49 5.1'2 to 24 years old 1.067 122 11.4 622 54 8.7 445 68 15.2'5 to 34 years old 954 460 48.2 449 237 52.8 504 223 44.2
Attending full time 4,975 330 6.6 2,588 163 6.3 2.387 167 7.014 to 19 years old 1,881 12 0.6 899 1 0.1 983 12 1.2,0 and 21 years old 1,825 63 3.5 949 29 3.1 876 34 3.922 to 24 years old 849 74 8.7 5?5 33 6.2 324 41 12.725 to 34 years old 420 181 43.1 216 100 46.3 205 80 39.0
."..st and second years 2,708 221 8.2 1,344 107 8.0 1.365 114 8.44 to 19 years old 1,849 14 0.8 893 955 14 1.5T and 21 years old 389 20 5.1 20C 8 3.9 189 12 6.4'2 to 24 years old 201 38 18.9 127 17 13.2 74 21 (B)5 to 34 years old 269 149 55.4 123 82 66.7 146 67 45.9
Attending full time 2,333 83 3.6 1,175 45 3.8 1.158 39 3.314 to 19 years old 1,781 12 0.7 857 924 12 1.3T and 21 years old 333 13 3.9 178 5 3.1 155 7 4.8.2 to 24 years.old 127 16 12.2 88 7 8.2 39 8 (8)25 to 34 years old 91 43 47.3 52 32 (B) 39 11 (8)
NPE OF COLLEGE NOT REPORTED
Total, 14 to 34 years old 362 74 20.7. 161 38 23.5 701 36 17.8

101Table 47. Undergraduate Attendancq Status of Primary Family Members 14 to 34 Yttars Old by Educational Attainment ofFamily Householder and Type and Control of College: October 1984
Also excludes family members who are family householders and family members who are married, spouse presert. For meaning of symbols,
(In thousands. Civilian noninstitutional population. Fxcludes person4 in families in which the householders are members of the Armed Forces.
see text)
Years of school completed by family householder
Type and control of collegeand attendance status
Elementary High school College
0 to 4 5 to 7 8 1 to 3 4 1 to 3 4 yea,Totalenrolled years years years years years years or more
ALL COLLEGES
Total 6,083 74 166 156 423 2,025 1,174 2,057Public 4,818 62 141 129 353 1,661 946 1,528Full time 4,102 51 120 96 266 1,384 787 1.399Part time 716 11 21 33 87 277 159 129Private 1,266 12 23 27 72 376 228 529Full time 1,165 12 21 22 58 336 216 500Part time 101 - 2 5 14 40 12 29
Male 5,083 57 125 141 321 1,675 923 1,842Full time 4,444 47 108 103 251 1.435 801 1.697Part time 643 9 17 38 69 240 123 143
Female 999 17 40 15 103 360 251 214Full time 024 15 34 15 73 783 203 200Part time 175 2 6 - 30 75 48 14
TWO-YEAR COLLEGES
'Fatal 1,593 35 53 53 145 637 327 344Public 1,442 31 50 47 133 565 309 310Full time 1,022 24 41 33 80 395 208 242Part time 420 7 9 14 53 170 101 68
Private 151 4 3 6 13 73 19 34Full time 124 4 1 3 9 59 17 31Part time 27 - 2 3 4 14 2 3
Male 1,288 27 37 50 103 52Z 249 299Full time 943 21 27 33 73 375 176 237Part time 346 5 10 17 3U 148 73 62
Female 304 8 16 3 41 114 79 44Full time 203 6 15 3 16 78 49 36Part timeII 101 2 1 - 25 35 29 9
FOUR-YEAR COLLEGES
Total 4,239 34 101 100 250 1.321 790 1,644Public 3,182 25 83 79 197 1,032 601 1,164
Full time 2,915 24 72 62 167 936 548 1,106Part time 267 1 11 17 30 96 53 58
Private 1,057 8 17 21 54 289 188 480Full time 985 8 17 19 46 263 178 454Part time 72 - - 2 8 26 10 26
Male 3,590 26 80 88 200 1,095 624 1,473Full time 3,319 26 74 69 165 1,009 579 1.399Part time 273 1 6 19 35 86 46 78
Female 649 8 21 12 51 226 165 166Full time 582 8 16 12 48 190 147 160Part time 66 - 5 - 3 35 18 5
First and second years 2,187 21 52 55 133 714 409 803
Public 1,604 15 44 46 104 536 307 552Full time 1,495 15 41 33 89 509 284 525Part time 109 - 3 13 15 27 23 27
Private 583 6 8 9 29 178 102 251Full tire 552 6 8 9 27 168 95 239Part time 31 - - - 2 10 7 12
Male 1,878 15 43 50 108 601 323 738Full time 1,764 15 40 37 93 572 303 705Part time 114 - 1 13 15 29 20 34
Female 309 6 9 5 26 114 86 64Full time 283 6 9 5 23 105 76 59Part time 26 - - 2 9 10 5
TYPE OF COLLEGE NOT REPORTED
Totr'. 14 to 34 years old 251 5 12 3 28 77 57 69
1 1 E,

102
Table 48. Primary Family Members 18 to 24 Years Old Enrolled as Undergraduetes by Family Income, Marital Status,Type and Control of College, and Sex: October 1984
(In thousands. Civilian noninatitotional population. Excludes persons in i.-111es An ihich the householders are members of the Armed Forces.For -"caning of symbols, See text)
Type and control of college, sex,and marital status Total
enrolled
Family income
Under$10,000
$10,000 to$14,999
$15,000 to$19,999
$20,000 to$24,999
$25,000 to$34,999
$35,000and over
rA.
reported
MARRIED, SPOUSE PRESENT
All colleges 391 106 91 49 31 74 23 3
Control:Public 321 84 79 40 27 70 16 3
Private 59 22 11 11 3 4 7
Sex:Male 162 52 34 19 16 32 6
Female 219 54 57 30 15 42 17 3
Two-year colleges 155 31 42 22 12 39 8
Control:Public 142 23 39 22 12 38 7
Private 14 8 4 - - - 1
Sex:Male 65 15 17 9 4 19 -
Female 90 16 25 13 8 20 8
Four-year colleges 203 66 46 21 19 33 14 3
Control:
Public.. ......... .... .... ... ........ 163 52 40 14 15 30 9 3
Private 39 14 4 9 3 4 5
Sex:
Male 85 31 17 7 12 11 6
Female 118 35 29 14 7 22 8 3
First and second years 65 26 16 9 4 3 4 3
Control:Public 53 21 16 5 3 1 3 3
Private 12 5 - 4 1 1
Sex:Male 23 12 3 3 4
Female 42 14 13 3 4 3
Type of college not reported... 23 9 3 2 1 -
OTHER MARITAL STATUS
All colleges 5,687 420 341 423 509 1,096 2.547 351Control:
Public 4,515 356 295 341 404 871 1,985 270Private 1,171 66 45 82 105 228 561 80
Sex:
Male 2,956 198 167 221 248 566 1,393 169Female 2,731 222 179 202 261 530 1,154 182
Two-year colleges... ... ... .............. 1,509 155 118 118 158 299 578 84Control:
Public 1,369 141 110 102 138 271 527 83Private 139 14 7 17 20 28 52 1
Sex:
Male 782 65 53 59 77 151 336 43Ifemale. 727 90 65 59 81 148 242 41
Four-year colleges 3,998 246 212 291 333 775 1,906 235Control:
Public. 3,012 201 174 229 252 581 1,411 164Private 986 47 37 62 81 195 494 70
SexMale ..... .. .... ... ............... 2,100 121 104 155 168 410 1,031 111Female 1,898 125 108 136 165 365 875 124
First and second years 2,065 119 151 173 157 386 954 125Control:
Public 1,519 94 129 141 112 276 691 75Private 547 26 21 31 44 110 261 50
Sex:
Male 1,067 63 80 92 84 184 508 56Female 998 56 71 81 73 202 446 69
lype of college not reported 180 19 11 14 18 22 63 32

0
103
Appendix A. Summary Tables
Table A-1. Year of College in Which Enrolled for College Students 14 Years CM and Over by Type of School,Full Time Status, Race, Hispanic Origin, and Sex: October 1985 and 1984
(Numbers in thousands. Civilian noninstitutional population. For meaning of symbols, see text)
Sex, race, Hispanic origin, andtype of college
Tot31
Year of college in which enrolled
1st to 4th 5th or higher
6 orenrolled Total 1 2 3 4 Total 5 higher
1985
BOTH SEXES
All Races
Total 12,524 10,097 3,291 2,856 2,155 1,795 2,427 1,115 1,311Enrolled full time 8,035 7,033 2,178 1,953 1,489 1,413 1,002 431 571Two-year college 1,654 1,640 819 687 110 25 14 9 5Four-year college 6,045 5,073 1,195 1,214 1,322 1,342 972 416 . 556Not reported 336 319 164 52 58 46 17 7 10
Enrolled part time 4,489 3,0E5 1,114 903 666 382 1,424 684 740Two-year college 1,942 1,762 794 640 240 88 180 95 85Four-year college 2,363 1,149 234 240 404 270 1,214 580 634Not reported 184 154 85 23 21 24 30 9 22
White
Total 10,782 8,626 2,803 2,400 1,862 1,561 2,156 1,003 1, 3Enrolled full time 6,862 6,010 1,837 1,649 1,300 1,225 851 372 480Two-year college 1,364 1,355 669 570 93 22 9 4 5Four-year college 5,219 4,389 1.030 1,036 1,157 1,165 830 362 469Not reported 278 267 137 43 49 37 12 6 6
Enrolled part time 3,920 2,615 966 751 562 336 1,305 631 674Two-year college 1,663 1,499 690 542 193 74 165 86 79Fou.'-% 3ar college 2,101 987 206 190 351 240 1,115 538 576Not reported 155 130 69 19 19 22 25 7 18
Black
Total 1,208 1,069 349 344 220 156 138 65 74Enrolled full time 804 736 245 224 150 117 68 34 34Two-year college 218 216 113 92 9 1 2 2 -Four -year college 535 474 109 124 134 107 61 31 30Not reported 51 47 23 8 7 e
... 5 1 4Enrolled part time 403 333 104 119 71 39 70 30 40Two-year college 192 184 72 77 27 7 8 6 3Four-year college 189 132 22 39 42 30 57 23 34Not reported 22 17 10 4 1 2 5 2 3
Hispanic Origin'
Total 665 555 221 151 102 81 110 43 67Enrolled full time 402 341 138 90 58 55 62 26 36Two-year college 131 131 76 42 7 6 - -Four-year college 246 184 44 43 47 49 62 26 36Not reported 26 26 18 4 3
Enrolled part time 262 214 82 62 43 26 48 17 31Two-year college 125 125 63 43 14 5 - -Four-year college 124 79 10 19 29 21 45 13 31Not reported 13 10 10 4 4
I20

104
Table A-1. Year of College in Which Enrolled for College Students 14 Years Old and Over by Type of School,Full Time Status, Race, Hispanic Origin, and Sex: October 1985 and 1984-Continued
(Numbers in thousands. Civilian noninstitutional population. For meaning of symbols, see text)
Sex, race, Hispanic origin, andtype of college
Totalenrolled
Year of college in which enrolled
1st to 4th 5th or higher
Total Total 5
6 orhigher
MALE
All Races5,906 4,F ,7 1,426 1,271 994 977 1,239 531 708
Enrolled full time 4,062 3.54 1,041 919 719 774 607 239 369Two-year college 719 710 368 294 40 8 9 6 3Four-year college 3,158 2,569 588 591 650 740 589 230 358Not reported 185 175 85 34 30 26 10 3 7
Enrolled part time 1,844 1,213 384 351 275 202 632 292 340Two-year college 745 673 274 247 113 39 73 37 36Four-year college 1,024 481 84 93 152 152 544 252 292Not reported.. 75 59 27 11 10 11 15 4 12
White
Total 5,101 4,006 1,212 1,092 847 855 1,096 483 613Enrolled full time 3,476 2,963 869 799 623 672 514 209 305Two-year college 592 586 300 246 32 8 6 4 3Four-year college 2,728 2,226 495 526 563 642 501 203 299Not reported 157 151 74 26 28 22 6 3 3
Enrolled part time 1,625 1,043 343 294 224 183 582 274 308Two-year college 634 568 247 209 77 35 66 33 33Four-year college 925 423 73 76 138 136 502 237 264Not reported ... 66 52 22 9 9 11 14 4 11
Black
Tota I 518 459 154 125 102 78 59 20 39Enrolled full time 383 350 125 87 76 63 33 13 20Two-year college 87 85 45 38 2 2 2Four-year college 269 242 69 42 72 59 27 10 16Not reported 28 24 11 8 2 3 4 4
Enrolled part time 135 109 29 38 26 15 26 8 19Two-year college 72 69 20 29 21 3 - 3Four-year college 57 35 7 7 5 15 23 8 15Not reported 6 5 3 2 1 - 1
Hispanic Origin'
Total 301 235 102 47 36 50 66 30 36Enrolled full time 177 139 66 27 15 31 39 15 24Two-year college 43 43 33 6 4 - -Four-year co;lege 122 83 22 18 15 27 39 15 24Not reported 12 12 10 2 -
Enrolled part time 124 97 37 20 21 19 27 16 12Two-year college 61 61 34 15 8 5 - -Four -year college 59 35 2 6 13 14 24 12 12Not reported 4 - - 4 4
FEMALE
All Races
Total 6,618 5,430 1,865 1,585 1,161 819 1,188 585 603Enrolled full time 3,974 3,578 1,136 1,034 770 639 395 193 203Two-year college 935 930 451 393 70 16 5 3 2Four-yea: college 2,888 2,504 607 623 672 602 383 185 198Not reported.. 151 144 78 18 28 20 7 4 3
Enrolled part time 2,644 1,852 729 552 391 180 793 392 401Two-year college 1,197 1,089 520 393 128 49 108 59 49Four-year college 1,338 668 151 147 252 118 670 328 342Not reported 109 94 58 12 11 13 15 5 10

105
Table A-1. Year ef College in Which Enrolled for Coilege Students 14 Years Old and Over by Type of School,Full Time Status, Race, Hispanic Or'iin, and Sex: October 1985 and 1984-Continued
(Numbers in thousands. Civilian noninstitutiona I population. For meaning of symbols, see text)
Sex, race, Hispanic origin, andtype of college
Totalenrolled
Year of college in which enrolled
1st to 4th 5th or higher
Total 1 2 3 4 Total 56 or
higher
FEMALE-Continued
White
Total 5,681 4,620 1,591 1,308 1,015 706 1,061 520 541Enrolled full time 3,385 3,048 968 851 67i 553 338 163 175Two-year college 772 769 369 324 61 15 3 1 2Four-year college 2,492 2,163 536 510 594 523 329 159 170Not reported 122 116 63 17 21 15 6 3 3
Enrolled part time 2,295 1,572 623 457 339 154 723 357 366Two-year college 1,029 930 443 332 116 39 99 53 46Four-year college 1,177 564 133 114 213 104 613 301 312Not reported 89 78 47 11 10 11 11 3 8
Black
Total 689 610 195 218 119 78 79 44 35Enrolled full time 421 386 120 137 74 55 35 22 14Two-year college 131 131 68 55 8 1 - -Four - year college 266 232 40 63 61 48 34 '4 14Not reported 24 23 12 - 5 5 1 1
Enrolled part time 258 224 75 81 45 23 44 22 21Two-year college 120 114 52 48 7 7 6 6Four-year college 132 98 15 31 37 14 34 15 19Not reported 16 12 7 2 1 2 4 2 2
Hispanic Origin'
Total 363 320 119 104 66 31 44 12 31Enrolled full time 225 202 73 63 43 24 23 11 12Two-year college 87 87 42 36 7 2Four-year college 124 101 23 25 32 22 23 11 12Not reported 14 14 8 2 3 -
Enrolled part time 138 118 46 41. 23 8 21 1 20Two-year college 63 63 29 28 7Four-year college 65 44 8 13 16 8 21 1 20Not repo.ced 10 10 10
1984
BOTH SEXES
All Races
Total 12,305 9,910 3,319 ..,678 2,157 1,756 2,395 1,040 1,355Enn.11ed full time 8,086 6,692 2,240 1,883 1,556 1,313 1,093 438 655Two-year college 1,721 1,690 823 728 112 27 30 18 12Four-year college 6,026 4,989 1,259 1,098 1,388 1,244 1,037 404 633Not reported 339 312 158 57 56 41 27 17 10
Enrolled part time 4,21S 2,918 1,078 795 601 443 1,302 601 700Two-year coliNe 1,793 1,604 750 534 225 95 189 102 86Four-year college 2,268 1,179 252 238 360 329 1,089 494 595Not reported 158 134 73 23 16 20 24 5 19
White
Total 10,522 8,416 2,361 2,226 1,816 1,513 2,105 913 1,193Enrolled full time 6,901 5,947 1,907 1,574 1,323 1,143 954 388 566Two-year college 1,404 1,379 682 586 94 17 25 15 11Four-year college 5,217 4,316 1,101 939 1,186 1,090 902 356 545Not reported 280 253 124 49 44 36 27 17 10
Enrolled past time 3,621 2,469 954 652 493 370 1,152 525 627Two-year college 1,523 1,347 658 436 169 85 176 93 83Four-year college 1,967 1,010 235 196 310 269 957 429 529Not reported 130 112 t1 20 15 16 18 3 15
122

106
Table A-1. Year of College in Which Enrolled for College Students 14 Years Old and Over by Type of School,Full Time Status, Race, Hispanic Origin, and Sex: October 1985 and 1984Continued
(Numbers in thousands. Civilian noninstitutional population. For meaning of symbols, see text)
Sex, race, Hispanic origin, andtype of college
Totalenrolled
Year of college in which enrolled
1st to 4th 5th or higher
Total 1 2 3 4 Total 5
6 orhigher
BOTH SEXESContinueH
Black
Total 1,274 1,109 356 343 247 164 165 86 79
Enrolled full time 837 777 269 228 164 117 60 22 37
Two-year college 235 233 111 104 10 7 2 2
Four-year college 552 494 129 117 143 1";6 58 22 35
Not reported 50 50 29 7 11 3 -
Enrolled part time 437 332 87 115 83 48 105 63 42
Two-year college 199 190 67 80 37 6 9 8 1
Four-year college 225 133 15 32 45 42 92 54 38
Not reported 13 9 6 3 1 - 4 2 2
Hispanic Origin'
Total 563 483 187 152 86 59 80 35 45
Enrolled full time 364 329 124 104 56 44 36 18 18
Two-year college 109 108 64 44 - - 1 1 -
Four -year college 236 206 52 59 51 44 31 13 18
Not reported 19 15 8 2 6 - 4 4 -
Enrolled part time 199 154 63 48 29 15 45 18 27
Two-year college 98 91 40 32 13 6 8 2 6
Four-year college 91 56 18 14 16 8 37 16 21
Not reported 7 7 5 2 - - -
MALE
AU Races
Total 5,989 4,725 1,510 1,261 1,050 904 1,263 511 752
Enrolled full time 4,227 3,573 1,106 958 789 720 654 238 416
Two-year college 855 844 370 406 58 9 12 8 4
Four-year college 3,205 2,582 667 523 707 685 623 216 407
Not reported 167 148 69 29 23 26 19 14 5
Enrolled part time 1,762 1,152 404 303 261 184 610 273 337
Two-year college 725 636 266 214 122 35 88 54 35
Four-year college 974 464 108 78 136 142 511 219 292
Not reported 62 52 31 11 4 7 10 10
White
Total 5,111 4,021 1,305 1,032 898 786 1,090 431 659
Enrolled full time 3,628 3,067 948 800 689 630 561 206 354
Two-year college 713 705 319 329 49 8 9 5 4
Four-year college 2,776 2,243 573 447 622 601 533 197 346
Not reported 139 119 56 24 19 21 19 14 5
Enrolled part time 1,484 954 357 232 209 156 529 224 305
Two-year college 597 515 230 164 89 32 81 47 35
Four-year college 837 397 104 59 116 118 440 178 262
Not reported 50 41 23 9 3 7 8 8
Black
Total 590 491 147 170 102 72 99 54 45
Enrolled full time 388 347 116 112 62 57 41 14 27
Two-year college 90 90 33 53 4 - - -
Four -year college 276 235 74 54 54 53 41 14 27
Not reported 22 22 9 5 4 3 - -
Enrolled part time 202 144 32 58 39 15 58 39 18
Two-year college 93 87 25 39 23 - 7 7 -
Four-year college 102 51 3 17 16 15 51 33 18
Not reported 7 7 4 3 1 -
.1 c..)

107
.
Table A-1. Year of College in Which Enrolled for College Students 14 Years Old and Over by Type of School,Full Time Status, Race, Hispanic Origin, and Sex: October 1985 and 1984Continued
(Numbers in thousands. Civilian noninstitutional population. For meaning of symbols, see text)
Sex, race, Hispanic origin, andtype of college
Totalenrolled
Year of college in which enrolled
1st to 4th 5th or higher
Total Total 5
6 orhigher
MALEContinued
Hispanic Origin'
Total 248 203 64 68 41 30 45 21 25Enrolled full time 166 140 41 48 29 21 25 12 13Two-year college 45 45 16 29Four-year college 111 89 23 18 27 21 22 9 13Not reported 10 6 2 2 3 4 4
Enrolled part time 82 63 23 20 11 8 20 8 12Twc ,ar college 44 38 15 16 5 2 6 6Foi -year college 36 22 5 5 7 14 8 6Not reported 2 2 2
Female
All Races
Total 6,316 5,185 1,809 1,417 1,107 852 1,132 529 603Enrolled full time 3,859 3,419 1,135 925 767 592 440 200 239Two-year college 865 847 453 322 54 18 18 10 8Four-year college 2,821 2,408 592 576 680 559 414 188 226Not leported 172 165 89 27 33 15 8 3 5
Enrolled part time 2,458 1,766 674 492 340 259 692 329 363Two-year college 1,068 968 485 321 103 59 100 49 51Four-year college 1,294 716 144 160 225 187 578 275 303Not reported 96 82 45 11 12 13 14 5 9
White
Tota I 5,410 4,395 1,556 1,194 918 727 1,015 482 534Enrolled full time 3,273 2,880 959 774 634 513 393 182 212Two-year college 691 674 363 257 45 9 17 10 7Four-year college 2,441 2,072 528 492 564 488 369 169 200Not reported 141 134 68 25 25 15 8 3 5
Enrolled part time 2,137 1,515 596 420 284 214 622 300 322Two-year college 927 832 427 272 79 53 95 47 48Four-year college 1,130 612 131 137 193 151 518 251 267Not reported 81 71 38 11 12 10 10 3 7
Black
Total 684 618 208 173 145 92 66 32 33Enrolled full time 449 430 153 116 102 60 18 8 10Two-year college 144 142 78 51 6 7 2 2Four-year college 276 260 55 63 89 52 17 8 8Not reported 28 28 20 2 7 - -
Enrolled part time 235 188 55 57 44 32 47 24 23Two-year college 106 103 42 41 14 6 3 1 1
Four-year college 122 82 11 15 29 26 41 21 20Not reported 6 2 2 4 2 2

108
Table Al. Year of College in Which Enrolled for College Students 14 Years Old and Over by Type of School,Full Time Status, Race, Hispanic Origin, and Sex: October 1985 and 1984Continued
(Numbers in thousands. Civilian noninstitutional population. For meaning of symbols, see text)
Sex, race, Hispanic origin, andtype of ccqlege
Total
Year of college in which enrolled
1st to 4th 5th or higher
6 orenrolled Total 1 2 3 4 Total 5 higher
-EholiALE Continued
Hispai lriginl
Tota' 315 280 123 83 45 :,) 35 15 20
Enrol;ed full time 199 188 82 56 27 23 10 5 5
Two-year college 64 63 47 15 - 1 1
Four-year college 126 117 29 41 24 23 9 4 5Not reported 9 9 6 - 3 -
Enrolled part time 117 92 40 27 11.: 6 25 9 15
Two-year college 54 52 24 16 8 4 2 2
four-year college 57 34 13 9 10 3 23 8 15
Not reported 5 5 3 2 - -
Nc:e: Two-year classification is not edited with respect to year of college enrollment (see text).
'Persons of Hispanic Origin may be of any race. -
125

109
Table A-2. School Enrollment of Persons 3 to 34 Years Old, by Level and Control of School, Race, andHispanic Origin: October 1955 to 1985
(Numbers in thousands. Civilian noninstitutional population. For meaning of symbols, see text)
Level and controlof school 1985 1984 1983 1982 1981' 19812 1980 1979 1978 1977 1976 1975 1970 1965 19605 19552
Al! Races
Total enrolled 58,014 57,313 57,745 57,905 58,390 56,940 57,348 57,854 58,616 60,013 60,482 60,969 60,357 54,101 46,260 37,426
Nursery school 2,491 2,354 2,350 2,153 2,058 2,026 1,987 1,869 1,824 1,618 1,526 1,748 1,096 520 (NA) (NA)Public 854 761 809 729 663 657 633 636 587 562 476 574 333 127 (NA) (NA)Private 1,637 1,593 1,541 1,423 1,396 1,369 1,354 1,233 1,237 1,056 1,050 1,174 763 393 (NA) (NA)
Kindergarten 3,815 3,484 3,361 3,299 3,161 3,069 3,176 3,025 2,989 3,191 3,490 3,393 3,183 3,057 2,092 1,628Public 3,22! 2,953 2,706 2,746 2,616 2,540 2,690 2,593 2,493 2,665 2,962 2,851 2,647 2,439 1,691 1,365Private 594 531 656 553 545 529 486 432 496 526 528 542 536 618 401 263
Elementary school 26,866 26,838 27,198 27,412 27,795 27,059 27,449 27,865 28,490 29,234 29,774 30,446 33,950 32,474 30,349 25,458Public 23,803 24,120 24,203 24,381 24,758 24,083 24,398 24,756 25,252 25,983 26,698 27,166 30,001 27,596 25,814 22,078Private 1,083 2,718 2,994 3/131 3,037 2,976 3,051 3,109 3,238 3,251 3,075 3,279 3,949 4,878 4,535 3,379
High school 13,979 13,777 14,010 14,123 14,642 14,349 14,556 15,116 15...75 15,753 15,742 15,683 14,715 12,975 10,249 7,961Public 12,764 12,721 12,792 13,004 13,523 13,249 (NA) 13,994 14,231 14,505 14,541 14,503 13,545 11,517 9,215 7,181Private 1,215 1,057 1,218 1,118 1,119 1,100 (NA) 1,122 1,244 1,248 1,201 1,180 1,170 1,457 1,033 780
College 10,863 10,859 10,825 10,919 10,734 10,437 10,180 9,978 9,838 10,217 9,950 9 697 7,413 5,675 3,570 2,379Public 8,379 8,467 8,185 8,354 8,159 7,911 (NA) 7,699 7,427 7,925 7,739 7,704 5,699 3,840 2,307 1,515Private 2,483 2,392 2,640 2,565 2,576 2,525 (NA) 2,280 2,410 2,292 2,211 1,994 1,714 1,835 1,262 864
College:Full time 7,720 7,822 7,711 7,736 7,569 7,384 7,147 7,010 6,979 7,196 7,176 7,105 5,763 4,414 2,68t (NA)
Percent 71.1 72.0 71.2 70.8 70.5 70.7 70.2 70.3 70.9 70.4 72.1 73.3 77.7 77.8 75.1 (NA)Part time 3,143 3,037 3,114 3,183 3,166 3,053 3,033 2,968 2,859 3,021 2,773 2,592 1,650 1,261 887 (NA)
White
Total enrolled 47,452 46,941 47,423 47,662 48,169 47,098 47,673 48,225 48,843 50,151 50,761 51,430 51,719 47,451 40,348 32,929
Nursery school 2,087 1,915 1,932 1,783 1,685 1,657 1,637 1,537 1,456 1,314 1,246 1,432 893 451 (NA) (NA)Public 6t7 543 563 504 447 4111 432 428 351 372 318 392 198 93 (NA) (NA)Private 1,470 1,372 1,369 1,279 1,238 1,216 1,205 1,110 1,105 942 929 1,040 695 358 (NA) (NA)
Kindergarten 3,060 2,788 2,769 2,677 2,597 2,514 2,595 2,437 2,452 2,611 2,881 2,845 2,706 2,648 1,849 1,484Public 2,545 2,319 2,181 2,189 2,130 2,060 2,172 2,069 2,009 2,153 2,423 2,363 2,233 2,086 1,485 1,244Private 515 469 588 489 467 453 423 368 444 458 457 483 473 562 364 240
Elementary school 21,593 21,730 22,054 22,297 22,663 22,081 22,510 22,959 23,524 24,262 24,776 25,412 28,638 27,679 26,035 22,185Public 18,817 19,282 19,340 19,583 19,924 19,390 19,743 20,174 20,551 21,312 21,947 22,351 24,923 22,976 21,696 18,947Private 2,776 2,449 2,714 2,713 2,739 2,691 2,768 2,785 2,973 2,950 2,829 3,059 3,715 4,703 4,339 3,238
High school 11,378 11,240 11,425 11,577 12,062 11,862 12,056 12,583 12,897 13,152 13,214 13,224 12,723 11,356 9,122 7,036Public 10,258 10,266 10,339 10,541 11,035 10,849 (NA) 11,549 11,741 11,980 12,093 12,112 11,599 9,961 8,124 6,303Private 1,120 974 1,086 1,036 1,027 1,013 (NA) 1,033 1,156 1,172 1,121 1,112 1,12' 1,395 999 733
College 9,334 9,269 9,242 9,328 9,162 8,983 8,875 8,709 8,514 8,812 8,644 8,516 6,755 5,317 3,342 2,224Public 7,131 7,163 6,949 7,102 6,906 6,754 (NA) 6,672 6,368 6,743 6,657 6,724 5,168 3,568 2,126 1,429
Private 2,203 2,105 2,293 2,227 2,256 2,229 (NA) 2,037 2,145 2,069 1,987 1,792 1,591 1,749 1,215 795
College:Full time 6,597 6,672 6,532 6,579 6,452 6,349 6,212 6,058 5,974 6,165 6,170 6,183 5,221 4,111 (NA) (NA)
Percent 70.7 72.0 70.7 70.5 70.4 70.7 70.0 69.6 70.2 70.0 71.4 72.6 77 1 77.3 (NA) (NA)
Black
Total enrolled 8,444 8,226 8,199 8,262 8,350 8,282 8,251 8,317 8,416 8,564 8,518 8,400 7,829 47,252 45,910 44,498
Nursery school 332 340 326 305 284 294 294 278 312 250 226 276 179 72 (NA) (NA)Pubn^ 212 179 215 192 182 187 180 185 210 171 146 171 129 37 (NA) (NA)Privy.. 1:11 161 111 113 102 107 115 95 102 78 80 105 49 35 (NA) (NA)
Kindergarten 625 563 476 508 474 477 490 497 451 496 542 468 426 407 243 144Public 562 513 427 463 412 415 1
440 443 414 447 482 426 374 353 206 121Private 63 51 48 45 62 62 50 54 38 51"; 60 42 53 54 37 23
Elementary school 4,307 4,123 4,153 4,194 4,291 4,281 4,259 4,296 4,356 4,387 4,430 4,509 4,868 4,796 4,313 3,273Public 4,131 3,947 3,964 3,974 4,087 4,072 4,058 4,053 4,154 4,166 4,256 4,344 4,668 4,620 4,118 3,131Private 17f, 177 189 220 204 208 202 243 202 221 175 105 200 176 195 142
High school 2 131 2,061 2,143 2,128 2,168 2,150 2,200 2,245 2,276 2,327 2,258 2,199 1,834 1,619 1,127 926Public 2,068 2,002 2,057 2,073 2,102 2,085 (NA) 2,171 2,211 2,269 2,187 2,140 1,794 1,556 1,092 878Private 63 59 86 55 65 65 (NA) 74 65 59 71 59 41 62 34 48
College 1,049 1,138 1,102 1,127 1,133 1,080 1,007 1,002 1,020 1,103 1,062 948 522 358 227 155Public 880 918 858 865 898 857 (NA) 814 822 916 887 782 422 272 180 86Private 190 220 245 263 235 223 (NA) 188 199 187 175 166 100 86 46 69
College:Full time 767 810 806 800 815 776 723 748 753 803 817 742 417 218 (NA) (NA)
Percent 73.1 71.2 73.1 71.0 71.9 71.9 71.8 74.6 738 72.8 76.9 78.3 81.8 79.6 (NA) (NA)
126

110
Table A-2. School Enrollment of Persons 3 to 34 Years Old, by Level and Control of School, Race, andHispanic Origin: October 1955 to 1985-Continued
(Numbers in thousands. Civilian noninstitutional population. For meaning of symbols, see text)
Level and controlof school 1985 1984 1983 1982 1981' 19812 1980 1979 1978 1977 1976 1975 1970 1965 19603 19553
Hisp;nic Origin5
Total enrolled 5,070 4,284 4,618 4,478 4,551 4,378 4,263 3,608 3,455 3,516 3,623 3,741 (NA) (NA) (NA) (NA)
Nursery school 168 117 108 83 131 126 146 89 87 75 68 85 (NA) (NA) (NA) (NA)Public 105 78 60 46 68 66 70 50 47 30 38 47 (NA) (NA) (NA) (NA)Private 63 39 48 37 63 60 75 39 39 46 30 39 (NA) (NA) (NA) (NA)
Kindergarten 364 -13 335 329 306 292 263 226 231 220 262 235 (NA) (NA) (NA) (NA)Public 315 267 285 291 282 268 234 210 198 206 242 218 (NA) (NA) (NA) (NA)Private 49 26 50 37 24 23 30 16 33 14 20 17 (NA) (NA) (NA) (NA)
Elementary school 2,803 2,384 2,548 2501 2,474 2,373 2,363 1,934 1,893 1,874 1,934 2,062 (NA) (NA) (NA) (NA)Public 2,607 2,218 2,323 2,276 2,239 2,146 2,134 1,745 1,704 1,654 1,768 1,858 (NA) (NA) (NA) (NA)Private 196 166 225 225 235 227 228 189 188 220 165 204 (NA) (NA) (NA) (NA)
High school 1,156 966 1,104 1,072 1,130 1,101 1,048 920 868 928 932 948 (NA) (NA) (NA) (NA)Public 1,090 909 1,027 995 1,055 1,026. (NA) 875 825 836 867 888 (NA) (NA) (NA) (NA)Private 167 57 77 77 74 72 (NA) 45 43 92 65 61 (NA) (NA) (NA) (NA)
College 579 524 523 49:' 510 486 443 440 377 418 427 411 (NA) (NA) (NA) (NA)Public 464 433 441 398 398 379 (NA) 365 315 357 354 358 (NA) (NA) (NA) (MA)Private 116 91 82 96 112 107 (NA) 75 62 60 73 53 (NA) (NA) (NA) (NA)
College:Full time 381 356 335 312 343 326 294 314 231 287 297 287 (NA) (NA) (NA) (NA)
Percent 65.8 67.9 64.1 63.3 67.3 67.1 66.4 71.4 61.3 68.7 696 698 (NA) (NA) (NA) (NA)
'Controlled to 1980 census-based population estimates2Controlled to 1970 census-based population estimates3Data are for the population 5 to 34 years old.4Data are fcr Black and other races.5Persons of Hispanic origin may be of any race.
11)"'
i . a

111
Table A-3. Percentage of Persons 3 to 34 Years Old Enrolled in School, by Age, Sex, and Race:October 1955 to 1985
(Civilian noninstitutional population. For meaning of symbols, see text)r
Age and sex 1985 1984 1983 1982 19811 19812 1980 1979 1978 1977 1976 1975 1970 1965 19603 19553
ALL RACES
Total, 3 to 34 years 48.3 47.9 48.4 48.6 48.9 49.1 49.7 50.3 51.2 52.5 53.1 53.7 56.4 55.5 56.4 50.83 and 4 years 38.9 36.3 37.5 36.4 36.0 36 1 36.7 35.1 34 2 32.0 31.3 31.5 20.5 10.6 (NA) (NA)5 and 6 years 96.1 94.5 95.4 95.0 94.0 94.1 95.7 95.8 95.3 95.8 95.5 94.7 89.5 84.4 80.7 78.17 to 9 years 99.1 99.0 98.9 99.2 99.2 99.2 99.1 99.2 99.3 99.5 99.2 99.3 99.3 993 99.6 99.210 to 13 years 99.3 99.4 99.4 99.1 99.3 99.3 99.4 99.1 99.0 99.4 99.2 99.3 99.2 99A 99.514 and 15 years 98.1 97.8 98.3 98.5 98.0 97.9 98.2 98.1 98.4 98.5 98.2 98.2 98.1 98.9 97.8 86.916 and 17 years 91.7 91.5 91.7 90.6 90.6 90.7 89.0 89.2 89.1 88.9 89.1 89.0 90.0 87.4 82.618 and 19 years 51.6 50.1 50.4 47.8 49.0 49.1 46.4 45.0 45.4 46.2 46.2 46.9 47.7 46.3 38.4 31.520 and 21 years 35.3 33.9 32.5 34.0 31.6 31.7 31.0 30.2 29.5 31.8 '32.0 31.2 31.9 27.6 19.4 11.122 to 24 years 16.9 17.3 16.6 16.8 16.5 16.4 16.3 15.8 16.3 16.5 17.1 16.2 11.9 13.2 8.725 to 25 years 9.2 9.1 9.8 9.6 9.0 8.9 9.3 9.6 9.4 10.8 10.0 10.1 7.5 6.1 4.9 4.230 to 34 years 6.1 6.3 6.4 6.3 6.9 6.9 6.4 6.4 6.4 6.9 6.0 6.6 4.2 3.2 2.4 1.6
Male, 3 to 34 years. 49.2 49.1 49.7 49.7 50.2 50.4 50.9 51.8 52.9 54.3 55.1 56.0 59.7 58.8 60.0 54.93 and 4 years 36.7 35.9 38.1 36.4 36.8 33.7 37.0 34.6 34.0 32.1 30.9 30.6 21.2 10.2 (NA) (NA)5 and 6 years 95.3 94.0 95.1 94.7 94.2 94.2 95.0 96.3 95.1 94.7 95.6 94.3 88.9 84.4 80.8 78.17 to 9 years 99.0 98.8 98.8 99.2 98.9 98.9 99.0 99.0 99.1 99.5 98.9 99.2 99.3 993 99.6 99.210 to 13 years. 99.2 89.3 99.3 99.0 99.2 99.2 99.4 98.9 98.8 99.2 99.1 98.9 98.8 99.3 99.414 and 15 years 98.3 97.5 98.4 98.7 98.2 98.2 92.7 98.3 98.4 98.7 98.6 98.4 98.2 99.0 97.9 88.616 and 17 years 92.4 91.8 91.8 91.3 90.7 90.8 89.1 90.8 89.5 90.0 90.5 90.7 91.3 88.0 84.518 and 19 years 52.2 52.4 50.4 48.9 50.5 50.5 47.0 46.6 47.8 48.4 48.2 49.9 54.4 55.6 47.8 42.520 and 21 years 36.5 36.2 35.2 35.2 32.1 32.2 32.6 31.6 31.7 34.6 33.6 35.3 42.7 37.6 27.1 18.122 to 24 years 18.8 20.1 19.4 18.5 19.2 19.1 17.8 17.6 19.1 19.7 20.7 20.0 21.2 21.1 15.025 to 29 years 9.4 9.6 10.7 10.1 9.6 9.5 9.8 10.4 10.9 12.6 13.0 13.1 11.0 9.4 8.4 7.030 to 34 years 5.4 5.8 5.8 5.6 6.2 6.2 5.9 6.0 6.5 7.1 6.8 7.7 5.3 4.5 3.7 2.1
Female, 3 to 34 years 47.4 46.6 47.0 47.5 47.7 47.9 48.5 49.0 49.5 50.7 51.0 51.5 53.2 52.3 52.8 47.03 and 4 years 41.2 36.7 36.9 36.4 35.2 35.4- 35.5 35.6 34.5 32.0 31.6 32.4 19.8 10.9 (NA) (NA)5 and 6 years 97.0 95.1 95.8 95.3 93.8 93.9 96.4 95.2 95.5 96.9 95.5 95.2 90.2 84.4 80.6 78.17 to 9 years 99.2 99.3 99.0 99.2 99.5 99.5 99.2 99.4 99.5 99.5 99.4 99.5 99.3 993 99.6 99.110 to 13 years 99.4 99.4 99.5 99.3 99.4 99.4 99.4 99.4 99.2 99.6 99.3 99.6 99.5 99.5 99.514 and 15 years 97.9 98.2 98.2 98.3 97.7 97.7 97.7 97.9 98.4 98.3 97.8 98.0 98.0 98.7 97.6 85.216 to 17 years 90.9 91.2 91.6 89.9 90.5 99.6 88.8 87.6 88.8 87.7 87.7 87.2 88.6 86.9 80.618 and 19 years 51.0 48.0 50.3 46.8 47.5 47.7 45.8 43.4 43.0 44.0 44.4 44.2 41.6 37.7 30.0 22.520 and 21 years 34.1 31.7 29.9 32.9 31.2 1.2 29.5 28.9 27.5 29.1 30.6 27.4 23.6 19.5 13.1 6.122 to 24 years 15.1 14.6 13.9 15.1 13.9 14.0 14.9 14.1 13.6 13.6 13.8 12.6 9.4 6.5 3.425 to 29 years 9.1 8.6 8.5 9.0 8.4 8.3 8.8 8.8 7.9 9.1 7.3 7.2 4.3 3.1 1.8 1.830 to 34 years 6.8 6.7 7.0 6.9 7.5 7.5 7.0 6.7 6.2 6.7 5.2 5.6 3.1 2.1 1.2 1.1
WHITE
Total, 3 to 34 years 47.8 47.3 47.7 47.9 48.2 48.3 48.9 49.6 50.3 51.6 52.3 53.1 56.2 55.5 56.4 50.83 and 4 years 38.6 36.0 37.6 35 9 35.6 35.6 36.3 33.9 32.7 31.1 30.4 30.9 19.9 10.3 (NA) (NA)5 and 6 years 96.4 94.6 95.7 94.9 93.9 94.0 95.8 95.8 95.4 95.6 95.8 94.8 90.3 85.3 82.0 79.27 to 9 years 99.3 99.0 98.9 99.2 99.3 99.3 9i...3 99.2 99.3 99.5 99.1 99.4 93.3 99A 99.7 99.310 to 13 years 99.3 99.4 99.3 99.2 99.3 99.3 99.4 99.2 99.0 99.4 99.2 99.3 99.1 99.4 99.514 and 15 years 98.1 97.8 98.4 98.6 98.1 98.1 98.3 98.2 98.4 98.3 98.1 98.3 98.2 99.0 98.1 87.616 to 17 years 91.6 91.2 91.4 90.3 90.4 90.5 88.6 89.0 88.7 88.5 89.1 89.3 90.6 87.8 83.318 and 19 years 52.4 51.1 50.9 47.9 48.5 48.6 46.3 44.5 44.9 45.5 45.4 46.5 48.7 47.1 38.9 32.120 and 21 years 36.1 34.3 33.4 35.1 32.6 32.7 31.9 31.1 Z9.6 31.8 '32.5 31.8 33.1 29.4 20.6 11.622 to 24 years 17.0 17.2 16.4 16.2 16.2 16.2 16.4 15.7 16.1 16.3 17.0 16.8 15.7 14.1 9.325 to 29 years 9.2 9.1 9.4 9.6 8.5 8.5 9.2 9.7 9.4 10.6 1u.0 10.0 7.7 6.5 5.2 4.230 to 34 years 6.2 6.1 6.2 6.1 6.7 6.7 6.3 6.3 6.2 6.6 5 7 6.6 4.2 3.2 2.6 1.6
Male, 3 to 34 years. 48.5 48.3 48.9 49.9 49.2 49.4 50.0 50.7 51.9 53.3 54.2 55.4 59.6 59.0 60.3 54.93 and 4 years 37.3 35.8 38.2 36.3 16.8 36.8 38.0 33.5 33.1 31.7 29.9 30.8 20.7 10A (NA) (NA)5 and 6 years 95.7 94.1 95.1 94.8 94.3 94.3 95.2 96.3 95.3 94.3 95.8 94.3 89.7 84.8 82.3 79.07 to 9 years 99.3 98.7 98.8 99.2 99.1 99.1 98.8 99.0 99.2 99.6 98.8 99.2 99.3 993 99.7 99.410 to 13 years 99.2 99.3 99.3 99.1 99.2 99.2 99.4 99.0 98.9 993 99.1 99.0 98.8 99.3 99.514 and 15 years 98.2 97.6 98.3 95.8 98.3 98.3 98.7 98.3 98.3 98.7 98.5 98.5 98.3 99.1 98.1 89.116 to 17 years 92.5 91.5 91.6 91.0 90.5 90.5 88.8 90.3 88.9 89.5 90.6 91.0 92.2 88.6 85.218 and 19 years 51.9 52.6 50.7 48.5 49.2 49.3 47.5 46.1 47.2 47.7 46.9 49.6 56.0 56.6 49 5 43.920 and 21 years 37.2 36.3 36.6 36.5 33.3 33.4 33.7 32.2 32.0 34.7 34.2 36.3 45.0 39.9 29.2 19.322 to 24 years 19.0 20.2 19.2 18.0 19.1 19.0 18.2 17.6 19.2 19.4 20.4 20.5 22.6 233 16.325 to 29 years 9.5 9.2 10.il 10.2 9.1 9.1 9.6 10.5 10.9 12.6 12.9 13.1 11.2 10.0 8.9 7.130 to 34 years 5.4 5.6 5.4 5.5 6.0 6.0 5.6 5.9 6.4 6.8 6.5 7.5 6.1 4.5 4.0 2.2
1 2 8

112
Table A-3. Percentage of Persons 3 to 34 Years Old Enrolled in School, by Age, Sex, and Race:October 1955 to 1985-Continued
(Civilian noninstitutionat population. For meaning of symbols, see text)
Age and sex 1985 1984 1983 1982 1981' 19812 1980 1979 1978 1977 1976 1975 1970 1965 19603 19553
Female, 3 to 34 years 47.0 46.3 46.6 46.9 47.1 47.2 47.9 48.4 48.7 49.9 50.4 50.9 52.9 52.2 52.7 46.93 and 4 years 39.9 36.1 36.0 35.5 34.3 34.5 34.6 34.4 32.2 30.5 31.0 30.9 19.1 10.3 (NA) (NA)5 and 6 -ors 97.1 95.2 96.5 95.0 93.5 93.7 96.4 95.3 95.6 96.9 95.8 95.3 90.9 85.7 81.6 79.57 to 9 S 99.3 99.3 99.0 99.2 99.5 99.5 99.2 99.5 99.5 99.5 99.5 99.5 99.3 99.4 99.7 99.310 to 13 years 99.3 99.4 99.4 99.4 99.4 99.4 99.4 99.5 99.2 99.6 99.3 99.6 99.5 99.5 99.614 and 15 years 97.9 98.0 98.4 98.4 97.8 97.8 97.8 98.1 98.5 98.4 97.6 98.1 98.1 98.9 98.1 85.916 to 17 years 90.8 91.0 91.2 89.6 90.4 90.5 88.4 87.7 88.4 87.4 87.7 87.5 89.0 87.0 81.418 and 19 years 52.9 49.6 51.1 47.4 47.8 47.9 45.1 43.0 42.7 43.4 44.0 43.5 41.8 38.3 29.7 22.420 and 21 years 35.0 32.3 30.5 33.7 31.9 32..".., 30.2 30.0 27.4 29.0 30.9 27.5 24.1 20.9 13.5 6222 to 24 years 15.0 14.2 13.6 14.5 13.4 13.5 14.8 13.9 13.0 13.3 13.7 12.2 9.7 6.3 3.525 to 29 years 9.0 8.9 8.5 9.0 7.9 7.9 8.9 9.0 7.9 8.8 7.1 7.0 4.4 3.2 1.8 1.530 to 34 years 6.9 6.7 6.9 6.7 7.4 7.4 7.0 6.7 6.0 6.3 4.8 5.7 3.1 2.0 1.2 1.0
BLACK
Total, 3 to 34 years 50.9 50.1 50.8 51.6 52.5 53.4 53.9 55.0 56.3 57.7 57.9 57,7 57.4 455.6 555.9 550.73 and 4 years 42.7 38.2 36.2 38.6 36.7 36.7 38.2 40.8 41.3 35.2 34.5 33.5 22.7 11.8 (NA) (NA)5 and 6 years 95.7 94.1 94.7 95.4 94.5 94.3 95.4 96.0 93.9 96.5 94.0 94.3 84.9 79.1 73.3 71.17 to 9 years 98.4 99.5 99.1 99.2 98.8 98.8 99.4 99.4 99.5 99.3 99.3 9b.3 £9.3 98.9 99.310 to 13 years 99.5 99.3 99.7 98.9 b. I 99.4 99.4 98.7 98.9 99.0 98.8 99.2 99.3 99.3 99.0982
14 and 15 years 97.9 97.9 97.8 98.1 97.1 97.1 97.9 97.4 98.5 98.8 99.0 97.4 97.6 98.1 95.9 82216 to 17 years 91.7 92.4 92.6 91.6 91.3 91.4 90.6 90.8 91.2 90.8 89.0 86.9 85.7 83.9 76.918 and 19 years 44.1 44.3 46.1 43.6 48.2 48.5 45.7 46.6 46.2 48.3 50.4 47.1 40.1 39.6 34.6 27.620 and 21 years 27.7 27.7 23.4 24.3 23.4 23.5 23.4 23.7 25.6 29.5 28.2 27.1 22.8 12.8 11.9 7 222 to 24 years 13,7 15.7 15.6 17.0 14.7 14.7 13.6 15.0 15.0 15.2 16.4 14.2 8.0 6.2 4.425 to 29 years 7.4 7.4 7.8 8.4 9.9 9.9 8.8 7.9 8.7 11.3 9.4 9.4 4.8 2.1 2.9 4.930 to 34 years 5.1 6.5 7.6 7.0 7.2 7.2 6.8 6.8 7.9 9.0 8.1 7.1 3.4 2.4 1.0 1.8Male, 3 to 34 years. 52.6 52.6 52.9 53.2 54.5 55.7 56.1 57.8 58.7 60.3 61.1 60.3 59.5 57.7 58.3 54.43 and 4 years 34.6 37.2 37.1 37.4 34.8 34.6 36.6 40.4 37.9 32.4 36.3 29.5 22.3 9.5 (NA) (NA)5 and 6 years 94.6 92.8 95.6 93.9 94.5 94.3 94.1 96.6 93.2 96.0 94.4 94.6 84.2 81.0 71.8 72.87 to 9 years 98.2 99.5 98.9 99.3 98.5 98.5 99.5 99.0 99.4 99.1 99.5 99.3 99.2 993 99,4 88 210 to 13 years 99.1 99.1 99.4 98.4 99.2 99.2 99.4 98.4 98.8 98.6 98.8 99.0 99.1 99.4 98.714 and 15 years 98.2 96.9 98.4 97.8 97.3 97.2 98.5 68.5 99.0 99.0 99.5 97.6 98.0 98.7 97.0 85.216 to 17 years 91.8 93.2 91.8 92.2 92.1 92.1 90.8 94.6 92.8 92.5 90.9 88.2 85.4 82.2 79.118 and 19 years 49.5 48.6 46.6 46.5 51.9 52.2 42.8 48.0 50.5 50.5 54.9 49.9 41.3 47.5 36.9 32.920 and 21 years 29.7 29.7 23.5 20.9 20.6 20.8 23.0 26.9 25.2 31.0 2R.0 28.7 27.8 18.5 13.7 9222 to 24 years 13.2 17.5 17.2 17.4 14.7 14.6 13.3 14.6 14.7 18.5 18.7 14.7 9.6 4.3 6.325 to 29 years 5.7 9.1 8.5 8.4 10.8 10.8 10.6 8.1 9.5 12.1 11.0 11.8 6.1 2.6 3.9 6.230 to 34 years 3.9 6.6 7.1 5.6 6.5 6 5 7.3 6.3 7.8 9.2 8.8 8.6 3.6 2.3 1.0 1.9
Female,3 to 34 years 49.4 47.8 48.8 50.2 50.6 51.4 5...J 52.5 54.1 55.4 55.0 55.3 55.5 53.6 53.7 47.43 and 4 years 50.2 39.2 35.2 39.8 38.7 38.9 39.7 41.2 44.8 38.1 32.6 37.6 23.2 14.1 (NA) (NA)5 and 6 years 97.1 95.3 93.6 97.0 94.4 94.4 96.7 95.5 94.7 97.0 93.6 93.9 85.7 77.3 74.9 69.47 to 9 years 98.7 99.5 99.3 99.1 99.1 99.0 99.3 99.7 99.6 99.4 99.1 99.3 99.5 98.6 99.1 98.110 to 13 years 99.9 99.4 100.0 99.5 99.6 99.5 99.3 99.0 99.1 99.4 98.8 99.4 99.5 99.2 99.314 and 15 years 97.6 99.0 97.1 98.3 97.0 97.0 97.4 96.4 98.0 98.5 98.4 97.2 97.2 97.6 94.8 80.516 to 17 years 91.6 91.7 93.4 91.0 90.5 90.6 90.4 87.1 89.6 89.1 87.0 85.6 85.9 85.6 74.718 and 19 years 39.0 40.3 45.7 41.0 44.9 45.2 48.2 45.4 42.4 46.3 46.4 44.7 38.9 32.5 32.2 23.120 and 21 years 26.0 25.9 23.3 27.2 25.7 25.6 23.7 21.1 26.0 28.2 28.4 25.8 18.9 8.0 10.4 5522 to 24 years 14.1 14.1 14.2 16.6 14.7 14.8 13.9 15.3 15.2 12.6 14.5 13.8 6.7 7.8 2.825 to 29 years 8.8 6.0 7.2 8.4 9.1 9.2 7.4 7.7 8.1 10.7 8.1 7.5 3.6 1.7 2.1 3.830 to 34 years 6.2 6.5 8.0 8.1 7.7 7.8 6.5 7.3 8.0 8.9 7.6 5.9 3.3 2.4 1.0 1.7
'Controlled to 1980 census-based population estimates2Controlled to 1970 census-based population estimates3Data are for the population 5 to 34 years old.4Data are adjusted to include Black only.5Data are for Black and other races.
o

Table A-4. Age Distribution of College Students 14 Years Old and Over, by Sex: October 1947 to 1985(Numbers in thousands. Civilian noninstitutional population. For meaning of symbols, see ext)
Age and sex 1985 1984 1983 1982 1381' 19812 1980 1979 1978 1977 1976 1975 1974 1973 1972 1971a 19703 19663 19603 19553 19503 1947'
NUMBER
Both Sexes
Total, 14 years and over 12,524 12,304 12,320 12,308 12,127 11,814 11,387 11,380 11,141 11,546 11,139 10,880 9,852 8,966 9,096 8,087 7,413 5,675 3,570 2,379 2,175 2,31114 to 17 years ...... 262 253 260 254 232 226 249 311 274 274 281 293 309 295 295 284 260 264 222 147 180 18818 and 19 years 2,907 2,867 2,940 2,929 3,044 3,024 2,933 2,244 2,899 2,913 2,937 2,943 2597 2,517 2,680 2,726 2,594 2,215 1,:99 745 733 62020 and 21 years ..22 to 24 years ...... ..
2,6162,014
2,597
2,1272,4952,042
2,6892,060
2,5451,98e
2,4841,897
2,4231,870
2,3531,794
2,2981,798
2,430
1,799
2,398
1,8462,313
1,679
2,1921,527
2,0731,465
2,1181,461
1,9971,487
1,857
1,3541,326
940
790
509 1'1 05 939 1,088
25 to 29 years ..... ... 1,884 1,857 1,921 1,859 1,717 1,627 1,641 1,679 1,619 1,809 1,686 1,616 1,482 1,278 1,229 1,067 939 614 491 494 324 32130 to 34 years 1,180 1,158 1,167 1,129 1,211 1,179 1,062 996 950 992 803 853 720 551 531 527 410 316 259 183 (NA) 9435 years and over... . . 1,661 1,445 1,495 1,389 1,393 1,377 1,207 1,402 1,303 1,329 1,189 1,183 1.025 787 763 (NA) (NA) (NA) (NA) (NA) (NA) (NA)
Male
Total, 14 years Bad over 5,906 5,989 6,010 5,899 5,825 5,638 5,430 5,480 5580 5,882 5,785 5,911 5,402 5,048 5,218 4,850 4,401 3,503 2,339 1,579 1,474 1,68714 to 17 years 131 91 108 112 96 94 98 129 106 112 105 128 145 121 141 129 130 113 99 57 74 8718 and 19 years 1,349 1,373 1,340 1,376 1,450 1,432 1,369 1,341 1,391 1,396 1,391 1,426 1,267 1,293 1,366 1,444 1,346 1,218 734 432 396 34320 and 21 years ..22 to 24 years
1,3131,087
1,337
1,219
1,310
1,170
1,346
1,1151,2391,144
1,212
1,0801,246
9891,192
9751,202
1,0281,280
1,036
1,2091,073
1,2561,011
1,206
9431,130
9371,170
9981,0901,065
1,083902
804
699503411
872
25 to 29 years . ... . 942 965 1,055 968 909 858 853 893 922 1,035 1,067 1,025 951 867 848 787 684 458 399 337 314 30130 to 34 years ..... .. 522 527 521 492 533 517 477 423 474 511 451 498 420 329 330 334 256 211 193 107 (NA) 8435 years and over.. . . 561 476 506 490 453 443 405 487 457 520 489 589 478 371 365 (NA) (NA) (NA) (NA) (NA) (NA) (NA)
Fe male
Total, 14 years and over G618 6,315 6,310 6,410 6,303 6,178 5,957 5,900 5,559 5,657 5,354 4,969 4,449 3,919 3,877 3,238 3,013 2,172 1,231 800 701 32414 to 17 years 129 161 153 141 138 132 153 183 168 162 176 184 165 174 153 154 130 151 123 90 108 10118 and 19 years 1,559 1,494 1,1330 1553 1,594 1592 1565 1503 1507 1,517 1546 1517 1,335 1,224 1,314 1,281 1,248 997 565 313 338 27720 and 21 years 1,303 1,260 1,185 1,343 1,305 1,271 1,178 1,161 1,098 1,151 1,199 1,058 986 944 948 MEI 774 522 287
285 247 21622 to 24 /ears ...... 926 908 872 945 B42 817 882 C18 770 763 773 668 584 528 464 423 452 241 9825 to 29 years 941 892 865 891 808 789 788 786 897 774 619 590 531 411 381 280 255 156 92 89 10 2030 to 34 years 658 630 645 637 677 682 590 533 476 481 352 357 300 222 200 192 154 105 68 43 (NA) 1035 years and over 1,100 970' 939 900 91?, 934 802 914 B45 809 700 614 548 416 418 (NA) (NA) (NA) (NA) (NA) (NA) (NA)
PERCENT
Both Sexes
Total, 14 years and over 100.0 100 0 100 0 100 0 100.0 100.0 100.0 100.0 100.0 100 0 100.0 100 0 100.0 100 0 100.0 100.0 100 0 100.0 100 0 100.0 100.0 100.014 to 17 years 2.1 2.1 2.1 2.1 1.9 1.9 2.2 2.7 25 2.4 2.5 2.7 3.1 33 3.2 3.5 35 4.7 6.2 6.2 83 8.118 and 19 years 23.2 20 3 239 23 8 25.1 25.6 25.8 25.0 26.0 25.2 26.4 27.0 26.4 28.1 29 5 33.7 35 0 390 36.4 31.3 33.7 26.020 and 21 years .. . 20.9 21.1 20.3 21.8 21.0 21.0 21.3 20.7 20 e 21 0 21.5 21.3 22.2 23.1 23.3 24.7 25.1 23 4 22.1
39.1 43 2 47.122 to 24 years 16 1 17.3 166 16.7 16.4 16.1 16 4 153 16.1 15 6 166 15 4 15.5 163 16.1 18.4 183 166 14 325 to 29 years 15.0 15.1 156 15.1 14.2 13 8 14.4 148 14.5 15.7 '5.1 14.9 15.0 143 13.5 13.2 12.7 10.8 138 17.1 149 13930 to 34 years ...... . . 4.4 94 95 92 10.0 10.0 93 8.8 8.5 86 7.2 7.8 7.3 8.1 58 6.5 5.5 56 73 6.3 (NA) 4.135 years and o4er.. 13 3 117 12.1 11.3 11.5 11.7 10.6 12.3 11.7 11.5 10.7 10.8 10.4 89 8.6 (NA) (NA) (NA) (NA) (NA) (NA) (NA)
Male
Total, 14 years and over 100 0 100.0 100 0 100 0 100.0 100 0 100 0 100.0 100 0 100.0 100 0 100.0 100 0 100.0 100 0 100.0 100.0 100 0 100.0 100.0 100 0 100 014 to 17 years ...... 2.2 1.5 1.8 19 1.6 1.7 1.8 2.4 1.9 1.9 1.8 2.2 2.7 2.4 2.7 2.7 3.0 32 4.2 36 5.0 5.218 and 19 years .. .. 22.8 22.9 22.3 23 3 24.9 25.4 25.2 24.5 24.9 23 7 24.0 24.1 23.4 25 6 26.2 29.8 30 6 34 8 31.4 27 4 26 8 20 320 and 21 years ......22 to 24 years
22 2184
22320.4
218195
22.818.9
21.319.8
21.519.2
22.918 2
21 817.8
21.5
18.421.7
17.6
20 9186
21.2
17.1
22.317.5
22.4186
22.419.1
22.522.0
24.620 5
23.0
20 0
21.5
17 641.0 469 513
25 to 29 years 15.9 16.1 17.6 16.4 15.6 15.2 15.7 16 3 16.5 17.6 18.4 17.3 17.6 17.2 16.3 16.2 15.5 13.1 17.1 21.3 213 17.830 to 34 years . . ..... . 8 8 88 8.7 83 9.2 9.2 8.7 8.4 85 8,7 7.8 8.4 7.8 65 6.3 8.9 5.8 60 83 68 (NA) 5.035 ,ears and over 9.5 7.9 8.4 8 3 7.8 7 9 7.5 8 9 8.2 8.8 8.5 9.6 8.8 73 7.0 (NA) (NA) (NA) (NA) (NA) (NA) (NA)
1301 'o !

Table A-4. Age Distribution of College Students 14 Years Old and Over, by Sex: October 1947 to 1985-Continued(Numbers in thousands. Civilian noninstitutional pop ilation. For meaning of symbols, see ext)
Age and sex 1985 1984 1983 1982 1981' 19812 1980 1579 1978 1977 1976 1975 1974 1973 "472 19713 19703 '9653 19603 19553 19504 19473
PERCENT - Continued
Female
Total, 14 years and over 100 0 100 0 100 0 100 0 100 0 100 0 100 0 100 0 100 0 100 0 100.0 100 0 100.0 100 0 100.0 100 0 100 C '00 0 100 0 100 0 100 0 100 014 to 17 years .. 1.9 25 24 22 22 21 26 31 30 29 33 33 37 4.4 39 48 43 70 100 113 15.1 16218 and 19 years . . 23 6 23 7 25 4 24 2 25 3 25.8 26 3 25 5 27 1 26 8 28 9 30.5 30 0 31.2 33 9 39 6 41.4 45 9 45 9 391 48 2 44 420 and 21 years ... 19 7 20 0 18 8 210 20 7 20 7 19 8 19 7 19 7 20 3 22 2 21.3 22 2 24 1 24 4 28.0 25.7 24 0 23.335 6 35.2 34 622 to 24 years . . 140 14.4 138 147 134 132 148 139 13.9 135 144 134 13.1 13.5 120 131 150 11.1 8025 to 29 years . . 14 2 14 1 13 7 139 12.8 124 13 2 13 3 12 5 13 7 11.6 119 11.9 10.5 9.8 87 85 7.2 75 86 1.4 3.230 to 34 years . . 9 9 100 10.2 99 107 10.7 99 90 86 85 6.6 7.2 ?7 57 5.2 59 5.1 48 54 5.4 (NA) 1.63 5 years and over . . . .. 16 6 15 4 15 7 14 0 14 9 15.1 13 5 15.5 15 2 14 3 13 1 12 4 12" 10 6 10 8 (NA) (NA) (NA) (NA) (NA) (NA) (NA)
'Controlled to 1980 censusbased populttion estmates.=Controlled to 1970 censusbased population estmates30ata for 1947 and 1955 to 1971 are for persons 14 to 34 years old'Data for 1950 are for pemo ns 14 to 29 years old.
I Is

115
Table A-5. College Enrollment of Persons 14 to 34 Years Old, by Sex, Race, and Hispanic Origin: October1965 to 1985
(In thousands. Civilian noninstitional population. For meaning of symbols, see text)
Sex, race, andHispanic origin 1985 1984 1983 1982 19811 19812 1980 1979 1978 1977 1976 1975 1970 1965
All Races
Total, enrolled incollege ...... 10,863 10,859 10,825 10,919 10,734 10,437 10,180 9,978 9,838 10,217 9,950 9,697 7,413 5,675
Male 5,345 5,513 5,504 5,409 5,372 5,193 5,025 4,993 5,124 5,369 5,296 5,342 4,401 3,503Female 5,518 5,347 5,321 5,510 5,363 5,244 5,155 4,986 4,714 4,848 4,654 4,355 3,013 2,172
Year of collage:First year 2,956 3,024 2,987 2,990 3,096 3,032 2,957 2,885 2,766 2,936 2,632 2,886 2,212 1,861Second year 2,585 2,454 2,624 2,617 2,560 2,500 2,411 2,291 2,286 2,364 2,535 2,376 1,739 1,256Third year 1,931 1,981 1,805 1,815 1,799 1,744 1,716 1,653 1,658 1,681 1,748 1,492 1,248 896Fourth year 1,642 1,599 1,595 1,688 1,598 1,543 1,403 1,458 1,445 1,427 1,356 1,354 1,074 803Fifth year or higher 1,749 1,802 1,814 1,810 ,582 1,618 1,692 1,691 1,681 1,810 1,680 1,589 1,140 859
White
Total, enrolled incollege 9,334 9,269 9,242 9,328 9,162 8,983 8,875 8,70 8,514 8,812 8,644 8,516 6,759 5,317
Male 4,633 4,709 4,718 4,650 4,620 4,514 4,438 4,400 4,508 4,717 4,658 4,771 4,066 3,326Female 4,701 4,559 4,524 4,679 4,543 4,469 4,437 4,309 4,006 4,035 3,986 3,743 2,693 1,991
Black
Total, enrolled incollege 1,049 1,138 1,102 1,127 1,133 1,080 1,007 1,002 1,020 1,103 1,062 948 522 274
Male 458 544 497 482 505 474 437 434 452 490 489 442 253 126Female 591 59' I 605 645 628 606 570 568 569 614 573 506 269 148
Hispanic Origin3
Total, enrolled incollege 579 524 523 493 510 486 443 440 377 418 427 411 (NA) (NA)
Male 280 232 253 216 258 243 222 226 196 223 223 219 (NA) (NA)Female 299 292 270 278 252 243 221 214 181 194 204 192 (NA) (NA)
'Controlled to 1980 census-based population.2Controlled to 1970 census-based population.3Persons of Hispanic origin may be of any race.
1

116
Table A-6. College Enrollment of Student 14 to 34 Years Old, by Type of College, Attendance Status, Age,cnd Sex: October 1970 to 1985
(In thousands. Civilian noninstitutional population. For meaning of symbols, see text)
Age, sex, full-time status,and type of college 1985 1984 1983 1982 19811 19812 1980 1979 1978 1977 1976 1975 1970
ALL COLLEGE STUDENTS
Total, 14 to 34 years. 10,863 10,859 10,825 10,919 10,734 10,437 10,180 9,978 9,839 10,218 9,950 9,697 7,413
ALL UNDERGRADUATES
Total, 14 to 34 years 9,114 9,058 9,012 9,110 9,053 8,819 8,488 8,287 8,158 8,408 8,270 8,108 6,27414 to 19 years 3,169 3,120 3,200 3,183 3,276 3,250 3,182 3,156 3,173 3,184 3,216 3,237 2,85420 and 21 years..... 2,58f, 2,565 2,464 2,657 2,511 2,451 2,393 2,308 2,247 2,378 2,358 2,255 1,80322 to 24 years 1,475 *1,547 1,475 1,526 1,458 1,387 1,316 1,297 1,233 1,206 1,224 1,072 86625 to 34 years 1,884 1,828 1,873 1,745 1,808 1,731 1,599 1,526 1,506 1,640 1,472 1,546 750
Public 7,211 7,242 7,014 7,174 7,035 6,833 (NA) 6,541 6,340 6,683 6,578 6,598 4,910Private 1,903 1,816 1,998 1,935 2,018 1,985 (NA) 1,746 1,816 1,724 1,692 1,510 1,363
Male, 14 to 34 years 4,385 4,506 4,488 4,450 4,443 4,303 4,111 4,106 4,188 4,372 4,301 4,393 3,627Full time 3,402 3,519 3,417 3,451 3,397 3,303 3,192 3,163 3,221 3,304 3,291 3,394 3,045Part time 984 987 1,071 999 1,046 1,000 920 943 967 1,068 1,010 999 582
Female, 14 to 34 years. 4,728 4,551 4,525 4,660 4,610 4,517 4,377 4,183 3,969 4,027 3,969 3,715 2,646Full time. 3,452 3,302 3,314 3,355 3,343 3,285 3,123 3,051 2,948 3,002 3,090 2,902 2,164Part time 1,276 1,249 1,211 1,305 1,266 1,231 1,254 1,132 1,021 1,025 879 813 482
Full Time
Total, 14 to 34 years 6,854 6,823 6,729 6,807 6,740 6, a; 6,315 6,225 6,169 6,304 6,381 6,296 5,20814 to 19 years 2,900 2,846 2,895 2,880 2,983 2/%10 2,897 2,892 2,872 2,855 2,963 2,987 2,68520 and 21 years 2,237 2,221 2,124 2,286 2,157 2,1:16 2,107 1,994 1,919 2,075 2,033 1,958 1,62822 to 24 years 1,017 1,067 993 979 986 93? 810 814 821 775 821 696 59125 to 34 years 701 689 718 662 613 585 500 525 559 598 563 655 301
Part Time
Total, 14 to 34 years 2,259 2,237 2,282 2,304 2,312 2,231 2,173 2,062 1,988 2,104 1,889 1,812 1,06614 to 19 years 269 274 305 302 293 291 282 264 302 329 253 250 16920 and 21 years 349 344 340 372 353 343 286 314 328 301 325 297 17522 to 24 years 457 480 482 547 471 450 505 483 412 431 403 376 27525 to 34 years 1,184 1,139 1,153 1,083 1,195 1,146 1,098 1,001 947 1,042 909 891 449
TWOYEAR COLLEGESTUDENTS
Total, 14 to 34 years 2,772 2,756 2,931 3,011 2,892 2,801 2,666 2,407 2,453 2,510 2,435 2,561 1,69214 to 19 years 959 994 1,050 1,088 1,144 1,125 1,080 933 966 933 907 1,024 89520 and 21 years 558 525 595 604 566 549 450 403 427 455 444 431 28122 to 24 years 403 442 405 494 414 392 417 407 391 380 367 354 23425 to 34 years 851 795 882 826 768 735 721 664 670 741 718 752 283
Public 2,516 2,496 2,663 2,750 2,646 2,559 (NA) 2,233 2,247 2,362 2,282 2,437 1,559Private 256 260 268 260 245 241 (NA) 174 206 148 153 123 133
Male, 14 to 34 years 1,179 1,333 1,370 1,359 1,333 1,280 1,135 1,106 1,214 1,253 1,272 1,412 1,001Full time 678 812 786 832 801 773 739 661 679 681 734 850 726Part time 501 521 584 527 532 506 456 445 535 572 538 562 275
Female, 14 to 34 years 1,593 1,422 1,560 1,652 1,559 1,521 1,472 1,301 1,239 1,256 1,163 1,148 691Full time 860 766 852 905 842 825 759 680 664 691 696 717 452Part time 733 656 709 74? 717 696 713 621 575 565 467 431 239
Full Time
Total, 14 to 34 years 1,538 1,579 1,638 1,737 1,643 1,599 1,498 1,341 1,343 1,372 1,430 1,567 1,17714 to 19 years 779 812 855 883 927 910 884 749 778 718 764 865 78620 and 21 years 341 330 374 381 357 346 287 251 243 283 261 274 19722 to 24 years 174 190 159 214 170 162 160 156 157 162 177 155 11425 to 34 years 244 247 250 260 188 181 167 185 167 208 228 274 80
1 , 1 %.)

117
Table A-6. College Enrollment of Student 14 to 34 Years Old, by Type of College, Attendance Status, Age,and Sex: October 1970 to 1985-Continued
(In thousands. Civilian nomnstitutior ..i population. For meaning of symbols, see text)
Age, sex, full-time status,and type of college 1985 1984 1983 1982 19811 19812 1980 1979 1978 1977 1976 1975 1970
TWO-YEAR COLLEGESTUDENTS-Continued
Part Time
Total, 14 to 34 years 1,234 1,177 1,293 1,274 1,249 1,202 1,168 1,066 1,110 1,138 1,005 994 51514 to 19 years 180 182 195 206 217 214 195 184 190 216 143 159 10920 and 21 years 217 19... 221 223 209 203 163 152 184 172 183 67 8422 to 24 years 229 252 245 280 243 230 256 251 234 218 190 199 12025 to 34 years 607 548 631 566 579 554 554 479 503 533 490 478 203
GRADUATE STUDENTS
-otal, 14 to 34 years 1,749 1,802 1,814 1,810 1,681 1,618 1,692 1,691 1,681 1,81C 1,680 1,590 1,14014 to 21 years 31 32 32 32 34 34 30 44 51 57 42 57 5422 tc 24 years 540 580 568 535 530 511 554 497 565 593 622 607 48825 to 34 years 1,179 1,190 1,214 1,244 1,120 1,074 1,104 1,149 1,063 1,161 1,017 923 599
Public 1,168 1,225 1,171 1,180 1,124 1,078 (NA) 1,157 1,087 1,241 1,161 1,105 789Private 581 576 643 630 558 540 (NA) 534 594 568 519 484 351
Male, 14 to 34 years 959 1,007 1,017 960 929 890 914 888 935 995 994 949 774Full time 550 612 623 568 514 491 500 469 477 548 542 542 432Part time 409 395 394 392 415 399 414 419 458 447 452 407 142
Female, 14 to 34 years 790 794 797 850 753 728 777 804 745 813 686 640 366Full time 313 387 359 362 314 305 332 317 334 338 254 267 123Part time 477 407 438 488 439 423 445 487 411 475 432 373 243
1Controlled to 1980 census-based population esf mates.2Controlled to 1970 census-based population esfmates.
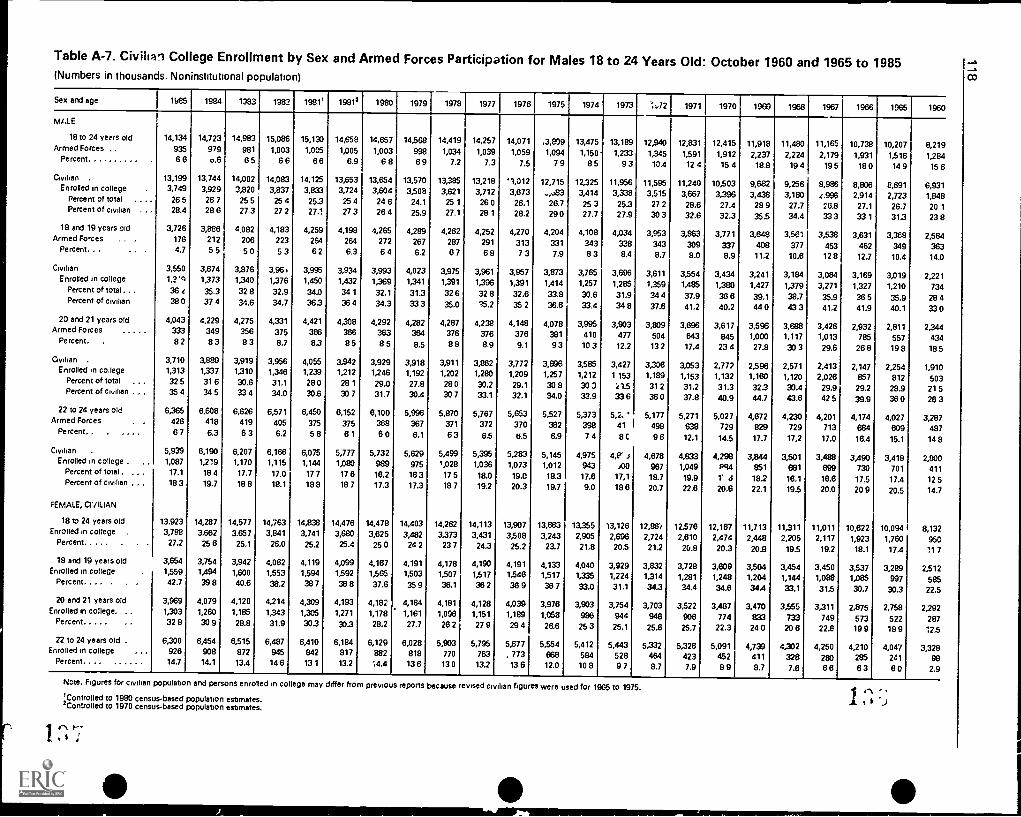
Table A-7. Civilian Col ege Enrollment by Sex and Armed Forces Participation for Males 18 to 24 Years Old: October 1960 and 1965 to 1985(Numbers in thousands. Noninstitutional population)
Sex and age 1885 1984 1383 1982 1981' 19812 1980 1979 1978 1977 1976 1975 1974 1973 '1:42 1971 1970 1969 1968 1967 1966 1965 1960
M/.LE
18 to 24 yerrs old 14,134 14,723 14,983 15,086 15,130 14,658 14,657 14,568 14,419 14,257 14,071 ,3,809 13,475 13,189 12,940 12,831 12,415 11,918 11,480 11,165 10,738 10,207 8,219Armed Forces .. 935 979 981 1,003 1,005 1,005 1,003 998 1,034 1,039 1,059 1,094 1,150 W 1,233 1,345 1,591 1,912 2,237 2,224 2,179 1,931 1,516 1,284Percent 66 0.6 65 66 66 6.9 68 69 7.2 7.3 7.5 79 85 93 10.4 124 154 18.8 194 195 180 149 156Civilian . 13,199 13744 14,002 14,083 14,125 13,653 13,654 13,570 13,385 13,218 '3,012 12,715 12,325 11,956 11,595 11,240 10,503 9,682 9,256 8,986 8,806 8,691 6,931Enrolled in college 3,749 3,929 3,820 3,837 3,833 3,724 3,604 3,508 3,621 3,712 3,673 ...,083 3,414 3,338 3,515 3,667 3,396 3,438 3,180 c,996 2,914 2,723 1,848Percent of total . . .. 26 5 26 7 25 5 25 4 253 25 4 24 6 24.1 25 1 26 0 26.1 26.7 25 3 25.3 27 2 28.6 27.4 28 9 27.7 26.8 27.1 26.7 20 1Percent of civilian . .. 28.4 28 6 27 3 27 2 27.1 27 3 26 4 25.9 27.1 28 1 28.2 29 0 27.7 27.9 30 3 32.6 32.3 35.5 34.4 33 3 33 1 31.3 23 8
18 and 19 years old 3,726 3,886 4,082 4,183 4,259 4,198 4,265 4,289 4,262 4,252 4,270 4,204 4,108 4,034 3,953 3,863 3,771 3,648 3,561 3,538 3,631 3,368 2,584Armed Fottes . . . 176 212 206 223 264 264 272 267 287 291 313 331 343 338 343 309 337 408 377 453 462 349 363Percent... 4.7 55 50 53 62 6.3 64 6.2 67 68 73 7.9 83 8.4 8.7 8.0 8.9 11.2 10.6 128 12.7 10.4 14.0
Civilian 3,550 3,674 3,876 3,961 3,995 3,934 3,993 4,023 3,975 3,961 3,957 3,873 3,765 3,696 3,611 3,554 3,434 3,241 3,184 3,084 3,169 3,019 2,221Enrolled in college 1,2'0 1,373 1,340 1,376 1,450 1,432 1,369 1,341 1,391 1,396 1,391 1,414 1,257 1,285 1,359 1,485 1,380 1,427 1,379 3,271 1,327 1,210 734Percent of total .. . 36 t 35.3 32 8 32.9 34.0 34 1 32.1 31.3 32 6 32 8 32.6 33.8 30.6 31.9 34 4 37.9 36 6 39.1 38.7 35.9 36 5 35.9 28 4Percent of civilian 38 0 37 4 34.6 34.7 363 36 4 34.3 33 3 35.0 '15.2 35 2 36.6 33.4 34 8 37.6 41.2 40.2 44 0 43 3 41.2 41.9 40.1 33 020 and 21 years old 4,043 4,229 4,275 4,331 4,421 4,308 4,292 4,282 4,287 4,238 4,148 4,078 3,995 3,903 3,809 3,696 3,617 3596 3,688 3,426 2,932 2,811 2,344Armed Forces 333 349 356 375 366 366 363 364 376 376 376 381 410 477 504 643 845 1,000 1,117 1,013 785 557 434Percent. . 82 83 83 8.7 83 85 85 8.5 88 8.9 9.1 93 103 12.2 132 17.4 234 27.8 303 29.6 268 198 185
Civilian . 3710 3,880 3,919 3,956 4,055 3,942 3,929 3,918 3,911 3,862 3,772 3,696 3,585 3,427 3,306 3,053 2,772 2596 2,571 2,413 2,147 2,254 1,910Enrolled in cortege 1,313 1,337 1,310 1,346 1,239 1,212 1,246 1,192 1,202 1,280 1,209 1,257 1,212 1 153 1,189 1,153 1,132 1,160 1,120 2,026 857 812 503Percent of total . . . 32 5 31 6 30.6 31.1 28 0 28 1 29.0 27.8 28 0 30.2 29.1 30 8 30 3 k 3.5 31 2 31.2 31.3 323 33.4 29.9 29.2 28.9 215Percent of civilian . , . 35 4 34 5 33 4 34.0 30.6 33 7 31.7 30.4 30 7 33.1 32.1 34.0 33.9 33 6 36 0 37.8 40.9 44.7 43.6 42 5 39.9 36 0 26 322 to 24 years old 6,365 6,608 6,626 6,571 6,450 6,152 6,100 5,9% 5,870 5,767 5,653 5527 5,373 5,2. ' 5,177 5,271 5,027 4,672 4,230 4,201 4,174 4,027 3,287Armed Forces 426 418 419 405 375 375 368 367 371 372 370 382 398 41 498 638 729 829 729 713 884 609 487Percent.. . , 6 7 6.3 63 6.2 58 61 60 6.1 63 6.5 8.5 6.9 74 8C 96 12.1 14.5 17.7 17,2 17.0 16.4 15.1 148
Civilian . 5,939 6,190 6,207 6,166 6,075 5,777 5,732 5,629 5,499 5,395 5,283 5,145 4,975 4,fr d 4,678 4,633 4,298 3,844 3,501 3,488 3,490 3,418 2,000Enrolled in college . .. 1,087 1,219 1,170 1,115 1,144 1,080 989 975 1,028 1,036 1,073 1,012 943 AO 967 1,049 P44 851 681 699 730 701 411Percent of total. . . . 17.1 18 4 17.7 17.0 17 7 17 6 16.2 16 3 17 5 18.0 19.0 18.3 17.6 17,1 18.7 19.9 1' d 18.2 16.1 16.6 17.5 17.4 12 5Percent of civilian . , . 18 3 19.7 18 8 18.1 18 8 18 7 17.3 17.3 18 7 19.2 20.3 19.7 9.0 18 6 20.7 22.6 20.8 22.1 19.5 20.0 20 9 20.5 14.7
FEMALE, CIVILIAN
18 to 24 years old 13.923 14,287 14,577 14,263 14,838 14,476 14,478 14,403 14,262 14,113 13,907 13,683 13,355 13,126 12,86) 12576 12,167 11,713 11,311 11,011 10,822 10,094 8,132Enrolled in college . 3,788 3.662 3.657 3,841 3,741 3,680 3,625 3,482 3,373 3,431 3,508 3,243 2,905 2,898 2,724 2,610 2,474 2,448 2,205 2,117 1,923 1,760 950Percent 27.2 25 6 25.1 26.0 25.2 25.4 25 0 24 2 23 7 24.3 25.2 23.7 21.8 20.5 21.2 20.8 20.3 20.9 19.5 19.2 18.1 17.4 11 7
18 and 19 years old 3,654 3,754 3,942 4,062 4,119 4,099 4,167 4,191 4,178 4,190 4,191 4,133 4,040 3,929 3,832 3,728 3,609 3504 3,454 3,450 3537 3,289 2512Enrolled in coliege 1,559 1,494 1,600 1553 1,594 1592 1,565 1,503 1507 1,517 1546 1517 1,335 1,224 1,314 1,281 1,248 1,204 1,144 1,088 1,085 997 585Percent. . .. . . 42.7 39 8 40.6 38.2 38 7 38 8 37.6 35 9 36.1 38 2 36 9 36 7 33.0 31.1 34.3 34.4 34.6 34.4 33.1 31.5 30.7 30.3 22.520 and 21 years old 3,969 4,079 4,120 4,214 4,309 4,193 4,182 4,184 4,181 4,128 4,039 3,976 3,903 3,754 3,703 3522 3,487 3,470 3,555 3,311 2,875 2,758 2,292Enrolled in college. .. 1,303 1,260 1,185 1,343 1,305 1,271 1,178 1,161 1,096 1,151 1,189 1,053 998 944 946 906 774 833 733 749 573 522 287Percent 32 8 30 9 28.8 31.9 303 33.3 28.2 27.7 26 2 27 9 29 4 26.6 25 3 25.1 25.6 25.7 22.3 240 20 6 22.6 199 189 12.522 to 24 years old . 6,300 6,454 6,515 6,487 6,410 6,184 6,129 6,028 5,903 5,795 5,677 5,554 5,412 5,443 5,332 5,326 5,091 4,739 4,302 4,250 4,210 4,047 3,328Enrolled in college 926 908 872 945 842 817 882 818 770 763 . 773 668 584 528 464 423 452 411 328 280 285 241 98Percent. . 14.7 14.1 13.4 14 6 13 1 13.2 14.4 13 6 13 0 13.2 13 6 12.0 10 8 9 7 8.7 7.9 8 9 8.7 7.6 6 6 6 3 e 0 2.9
Note. Figures for civilian population and persons enrolled in college may differ from previous reports because evisedcivilian figu es were used for 1965 to 1975.
;Controlled to 1980 census based population estimates.`Controlled to 1970 censusbased population estimates,
1 1.1,1 s $

119
Appendix B. Definitions and Explanations
Population coverage. The figures in this report forOctober 1984 and 1985 are sample survey data andrelated to the civilian noninstitutional population ofthe 50 States and the District of Columbia. The esti-'nation procedure used for this survey involves theinflation of the weighted sample results to indepen-dent estimates of the civilian noninstitutiona! popula-tion of the United States by age, race, and sex. Theseindependent estimates are based on civilian noninsti-tutional population counts from the decennial cen-suses and are updated with statistics on births, deaths,immigration, and emigration and statistics on tt-.,strength of the Armed Forces. Data published for 1972through 1980 were based on independent populationestimates derived by updat:4 the 1970 decennialcensus counts. Starting with the data collected in theOctober 1981 Currs.nt Population Survey (CPS), inde-pendent estimates were based on civilian noninstitu-tional population controls for age, race, and sex estab-lished by the 1980 decennia: census.
The April 1980 ::erisus population oount differedsomewhat from 1*- indepk ndent estimates for April1980 derived b. updating 1970 census populationfigures. The April 1980 census count of the civiliannoninstitutional population was 222,420,441, com-pared with the 1970 census based figure of 217,400,244used for the CPS. Basif...aay, this difference had lift'..impact on summary or proportional measures, sucnas medians and percent distributions; however, use ofthe new controls could have significant effect on theabsolute numbers.
School enrollment. The school enrollment statisticsfrom the current su. y are based on replies to theenumerator's inquiry as to whether the person wasenrolled in school. Enumerators were instructed tocount as enrolled anyone who had been enrolled atany time during the current term or school year in anytype of graded public, parochial, or other privateschool in the regular school system. Such schoolsinclude nursery schools, kindergartens, elementaryschools, high schools, colleges, universities, and pro-fessional schools. Attendance may be on either afull-time or part-time basis and during the day or night.Thus, regular schooling is that which may advance a
toward an elementary or high school diploma,or a college, university, or professional school degree.
135
Children enrolled in nursery schools and kindergartenare included in the enrollment figures for regularschools, and are also shown separately.
Special schools are those which are not in theregular school system, such as trade schools or busi-ness colleges. Persons attending special schools arenot included in the enrollment figures.
Persons enrolled in classes which do not requirephysical presence in school, such as correspondencecourses or other courses of independent study, and intraining courses given directly on the job, are alsoexcluded from the count of those enrolled in school,unless such courses are being counted for credit at aregular school.
College enrollment. The college enrollment statisticsare based on replies to the enumerator's inquiry as towhether the person was attending or enrolled incollege. Enumerators were instructed to count asenrolled anyone who had been enrolled at any timeduring the current term or school year, except thosewho have left for the remainder of the term. Thus,regular college enrollment includes those personsattending a 4-year or 2-year college, university, orprofessional school (such as medical or law school) incourses that may advance the student toward a rec-ognized college or university degree (e.g., BA or MA).Attendance may be either full time or part time, duringthe day or night.
Two-year and four-year colleges. Students enrolledin college were asked to report whether the college inwhich they were enrolled was a 2-year college (junioror community college) or a 4-year college or univer-sity. Students in the first 3 years were classified by thetype of college they reported. Students ;n the fourthacademic year of college or higher were assumed tobe in a 4-year college or university.
School enrollmein in year preceding current survey.An inquiry on enrollment in regular school or collegein October of the preceding year was asked for per-sons 14 to 24 years old who were enrolled in collegeor not currently attending regular school.
Level of school. The statistics on level of schoolindicate the number of persons enrolled at each offive levelsnursery, kindergarten, elementary school(first to eighth grades), high school (ninth to twelfthgrades), and college or professional school. The last
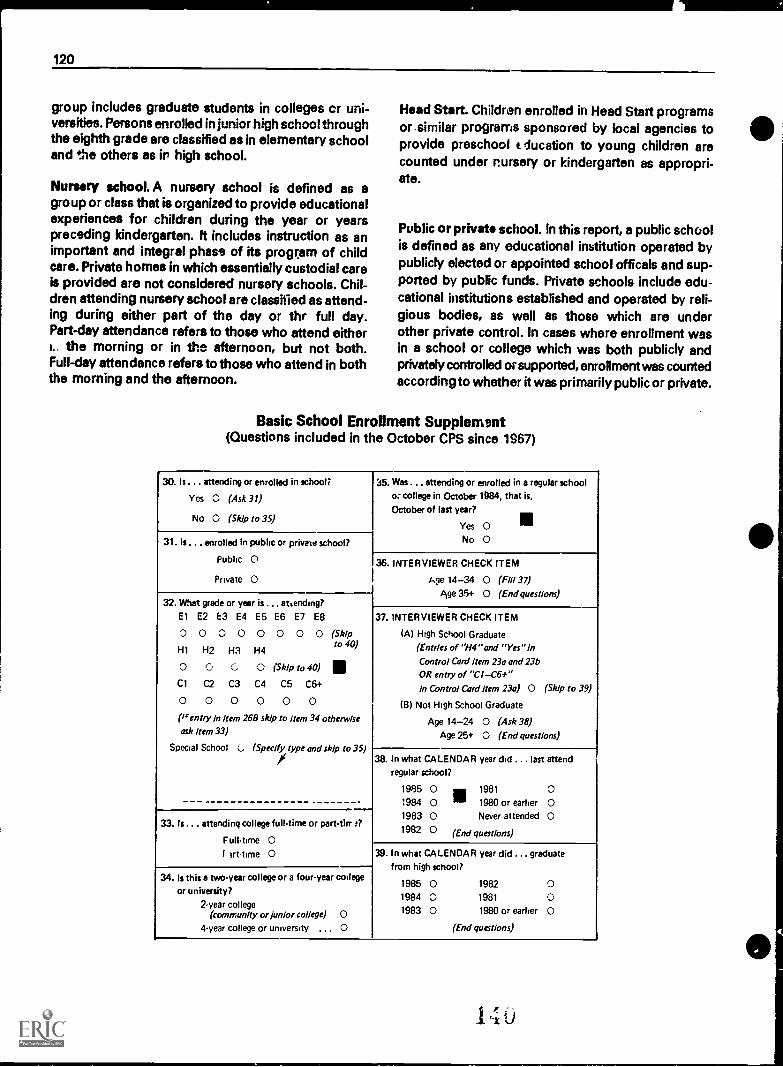
120
group includes graduate students in colleges or uni-versities. Persons enrolled in junior high school throughthe eighth grade are classified as in elementary schooland the others as in high school.
Nursery school. A nursery school is defined as agroup or class that is organized to provide educationalexperiences for children during the year or yearspreceding kindergarten. It includes instruction as animportant and integral phase of its program of childcare. Private homes in which essentially custodial careis provided are not considered nursery schools. Chil-dren attending nursery school are classified as attend-ing during either part of the day or the full day.Part-day attendance refers to those who attend eitherI. the morning or in the afternoon, but not both.Full-day attendance refers to those who attend in boththe morning and the afternoon.
Head Start. Children enrolled in Head Start programsor- similar programs sponsored by local agencies toprovide preschool Education to young children arecounted under nursery or kindergarten as appropri-ate.
Public or private school. In this report, a public schoolis defined as any educational institution operated bypublicly elected or appointed school officals and sup-ported by public funds. Private schools include edu-cational institutions established and operated by reli-gious bodies, as well as those which are underother private control. In cases where enrollment wasin a school or college which was both publicly andprivately controlled or supported, enrollment was countedaccording to whether it was primarily public or private.
Basic School Enrollment Supplement(Questions included in the October CPS since 1967)
30. Is... attending or enrolled in school?
Yes 0 (Ask 31)
No 0 (Skip to 35)
35. Was ...attending or enrolled in a regular schoolcl: college in October 1984, that is,
October of last year?
Yes 0 leNo 031. Is ... enrolled in public or private school?
Public 0
Private 0
36. INTERVIEWER CHECK ITEM
Age 14-34 0 (Fill 37)Age 35+ o (End questions)
32. What grade or year is ... attending?El E2 E3 E4 E5 E6 E7 E80 0 0 0 0 0 0 0 (SkipH1 H2 H3 H4
to 40)
0 0 0 0 (Skip to 40)
Cl C2 C3 C4 C5 C6+
0 0 0 0 0 0("entryentry In Item 26B skip to Item 34 otherwise
ask Item 33)
Special School G (Specify type and skip to 35)/
37. INTERVIEWER CHECK ITEM
IA) High School Graduate
(Entries of 114" and "Yes" in
Control Card Item 23o and 23b
OR entry of "C1 C6+"In Control Card Item 23a) 0 (Skip to 39)
(B) Not High School Graduate
Age 14-24 0 (Ask 38)Age 25+ 0 (End questions)
38. In what CALENDAR year did ... last attendregular school?
1985 0 1981 01984 0 1980 or earlier 01983 0 Never attended 01982 0 (End questions)
33. Is ... attending college full-time or parttirr s?
Full-time 0I lrturne 0 39. In what CALENDAR year did ... graduate
from high school?
1985 0 1982 01984 0 1981 ..,r-,
1983 0 1980 or earlier 0
(End questions)
34. Is this a two-year college or a four-year college
or university?
2year college(community or Junior college) 0
4year college or university , .. 0
t U1

121
Full-time and part-time attendance. College studentswere classified, in this report, according to whetherthey were attending school on a full-time or part-timebasis. A student was regarded as attending college fulltime if he/she was taking 12 or more hours of classesduring the average school week, and part time ifhe/she was taking less than 12 hours of classes duringthe average school week.
Modal grade. Enrolled persons are classified accord-ing to their relative progress in school, that is, whetherthe grade or year in which they were enrolled wasbelow, at, or above the modal (or typical) grade forpersons of their age at the time of the survey. Themodal grade is the year of school in which the largestproportion of students of a given age is enrolled.
Age. The age classification is based on the age of theperson at his/her last birthday.
Race. The population is divided into three groups onthe bL sis'of raceWhite, Black, and other races. Thelast category in:Aides American Indians, Japanese,Chinese, other Asian and Pacific Islanders, and anyother race except White and Black. In this report, otherraces is not shown separately.
Hispanic origin. Information on origin or descent wasobtained by asking, 'What is (this person's) origin ordescent?" Responses generally refer to a person'sperceived national or ethnic lineage and do not nec-essarily indicate the country of birth of himself/herselfor his/her parents.
Persons of Hispanic origin are persons who reportedthemselves as Mexican American, Chicano, Mexican,Mexicano, Puerto Rican, Cuban, Central or SouthAmerican, or other Hispanic origin. However, all per-sons who reported themselves as Mexican American,Chicano, Mexican, or Mexicano were combined intothe one categoryMexican. Persons of Hispanic ori-gin may be of any race.
Marital status. The marital status category shown inthis report, "marled, spouse present," includes per-sons who are currently married and living with theirspouse.
The category "other marital status" includes per-sons who are single (never married), separated, divorced,or widowed.
Family. The term "family," as used here, refers to agroup of two persons or more, related by blood,marriage, or adoption and residing together; all suchpersons are considered members of one family.
.1)4 1
Primary family. A primary family is a family thatincludes among its members the persons or couplewho maintains the household.
Family head. In the CPS, the term "head of family"was used to refer to the person maintaining thehousehold. This practice was discontinued in surveysconducted after the 1980 Census of Population. How-?Ater, in surveys taken prior to the 1980 Census ofPopulation "family head" was used. In those surveys,husbands in husband-wife families were classified as"family heads." Women were only "family heads" ifno spouse was present. The person who maintainsthe household is now called the "family householder."
Head versus householder. In the 1980 census, theBureau of the Census discontinued the use of theterms "head of household" and "head of family."Instead, the terms "householder" and "family house-holder" were used. Recent social changes resulted ingreater sharing of household responsibilities amongthe adult members and, therefore, made the term"head" inappropriate in the analysis of household andfamily data. Specifically, the Bureau reconsidered itslongtime practice of always classifying the husband asthe head when he and his wife are living together.
In the 1980 census, tha householder was the firstadult household member !isted on the census ques-tionnaire. The instructions called for listing first theparson (or one of the persons) in whose name thehome is owned or rented. If a home is owned jointlyby a marriea couple, either the husband or the wifewas listed first, thereby becoming the reference per-son, or householder, to whom the relationship ofother household members was recorded. The sameprocedure was followed in the CPS surveys con-ducted after the 1980 census. Therefore, the Bureau ispublishing the responses on relationship as given inthe CPSthe husband or wife could be the familyhouseholder.
Years of school completed. Data on years of schoolcompleted were derived from the combination ofanswers to two questions: (1) "What is the highestgrade of school he/she has ever attended?" and (2)"Did he/she finish this grade?"
The questions on educational attainment apply onlyto progress in "regular" schools. Such schools includegraded public, and private, (including parochial) ele-mentary and high schools (both junior and seniorhigh), colleges, univeraii es, and professional schools,whether day schools or night schools. Thus, regularschooling is that which may advance a person towardan elementary school certificate, high school diploma,or a college, university, or professional school degree.Schoolino in other than regular schools was countedonly if the credits obtained were regarded as transfer-able to a school in the regular school system.

122
Family income. In this report, family income is derivedfrom a single question asked of the household respond-ent when a household first enters the sample and isupdated on the 1-year anniversary of entry. Incomeincludes money income from jobs; net income frombusiness, farm, or rent; pensions; dividends; interest;social security payments; and any other money income.The income of nonrelatives living in the household isexcluded, but the income of all family members 14years old and over, including those temporarily livingaway, is included. It should be noted that while char-auteristics of the person, such as age and maritalstatus, and the composition of families refer to thedate of the interview, family income statistics refer toreceipts over a 12-month period starting 12 to 16months prior to the interview.
The income tables include in the lowest incomegroup those who were classified as having no incomein the 12-month reference period and those reportinga loss in net income from farm and nonfarm self-employment or in rental income.
The detailed income tables include a separate cat-egory for families for which no income informationwas obtained. In most other CPR's showing incomedata, the missing income data have been allocated.
The money income level of families shown in thisreport may be somewhat understated. Income datafrom the October control card are based on therespondent's estimate of total family money income inbroad, fixed income intervals. Income data collectedin the March supplement to fie CPS are based onresponses to 11 direct questions asked about eachperson 14 years old and over and identifying 23different sources of income in the preceding calendaryear. Previous research has shown that the use ofbroad income intervals to record money income tendsto reduce the rate of nonreporting, while increasingthe likelihood that the amounts reported will be sig-nificantly understated as compared with results frommore detailed questions.
Metropolitan-nonmetropolitan residence. Data formetropolitan and nonmetropolitan areas are availablein this report for October 1985 only. The CurrentPopulation Survey .vas undergoing a major redesignfrom April 1984 to June 1985, which affected theestimates of geographic components and, therefore,data for October 1984 have been omitted from thisreport. The major purpose of the redesign was tomake use of data from the 1980 census in order toupdate the sampling frame, to improve the efficiencyand quality of the survey, and to meet the increasedneed for State data. Technical aspects of the redesignare discussed in appendix C.
The population residing in metropolitan statisticalareas (MSA's) constitutes the metropolitan popula-tion. MSA's are defined by the Office of Management
and Budget for use in the presentation of statistics byagencies of the Federal Government. An MSA is ageographic area consisting of a large population nucleus,together with adjacent communities which have ahigh degree of economic and social integration withthat nucleus. The definitions specify a boundary aroundeach large city so as to include most or all its suburbs.Entire counties form the MSA building blocks, exceptin New England where cities and towns are used. Theformer term SMSA was changed to MSA in 1983.
An area qualifies for recognition as an MSA if (1) itincludes a city of at least 50,000 population, or (2) itincludes a Census Bureau-defined urbanized area ofat least 50,000 with a total metropolitan population ofat least 100,000 (75,000 in New England). In additionto the county containing th main city or urbanizedarea, an MSA may include other counties havingstrong commuting ties to the central county. If speci-fied conditions are met, certain large MSA's are des-ignated as consolidated MSA's (CMSA's) and dividedinto component primary MSA's (PMSA's).
Central cities. The largest city in each MSA is alwaysdesignated a central city. There may be additionalcentral cities if specified requirements, designed toidentify places of central character within the MSA,are met. Although the largest central cities are gener-ally included in the title of the MSA, there may becentral cities that are not part of the title. The balanceof the MSA outside the central city or cites often isregarded as equivalent to "suburbs."
In July 1985, the CPS began carrying the metwiol-itan statistical area definitions announced by the Officeof Management and Budget on June 30,1984. Figurespublished from the CPS in the early 1980's and through-out mrst of the 1970's referred to metropolitan areasas defined on the basis of the .970 census. Sincethere are important differences in the population clas-sified as metropolitan using the 1970 and 1984 defini-tions, comparisons should be avoided.
Comparability of metropolitan estimates. The newCPS metropolitan estimates have consistently beenhigher than independent estimates of the metropoli-tan population prepared by the Census Bureau; thenew CPS non metropolitan estimates have been lowerthan the independent estimates. For example, betweenJuly 1985 and August 1986, the magnitude of themonthly differences varied fro... 900,000 to 2.5 millionpersons, so that the proportion of the populationliving in metropolitan areas according to the CPS hasranged from 0.4 to 1.0 percentage points higher thanthe independent estimate. The difference in levelbetween the two sets of estimates is partially attribut-able to the basic CPS sample design, which, becauseof sampling variability, includes an oversample of
142
-

123
metropolitan households and an undersample of non-metropolitan households. The monthly variations resultfrom the exit and entrance of rotation groups, eachwith slightly different metropolitan-nonmetropolitanproportions, into the sample. The apparent overesti-mation of metropolitan and underestimation of non-metropolitan population in the CPS relative to theBureau's independent estimates should be taken intoaccount when using the data.
Geographic regions. The four major regions of theUnited States, for which data are presented, representgroups of States, as follows:
Northeast Connecticut, Maine, Massachusetts, NewHampshire, New Jersey, New York, Pennsylvania,Rhode Island, and Vermont.
Midwest7 Illinois, Indiana, Iowa, Kansas, Michigan,Minnesota, Missouri, Nebraska, North Dakota, Ohio,South Dakota, and Wisconsin.
SouthAlabama, Arkansas, Delaware, District of Colum-bia, Florida, Georgia, Kentucky, Louisiana, Maryland,
'Formerly North Central.
Mississippi, North Carolina, Oklahoma, South Caro-lina, Tennessee, Texas, Virginia, and West Virginia.
West Alaska, Arizona, California, Colorado, Hawaii,Idaho, Montana Nlevada, New Mexico, Oregon, Utah,Washington, and Wyoming.
Symbols. The following symbols are used through-out the tables:
Represents zero or rounds to zero.
B The base of the derived figure is less than75,000.
(X) A applicable.
(NA) Not available.
Rounding of estimates. Individual figures are roundedto the nearest thousand without being adjusted togroup totals which are independently rounded. Withfew exceptions, percentages are based on the roundedabsolute numbers.

125
Appendix C. Source and Reliability of the Estimates
SOURCE OF DATA
Most of the estimates in this report are based ondata obtained in October 1985 from the Current Pop-ulation Survey (CPS) conducted by the Bureau of theCensus and from supplementary questions to theCPS. Some estimates are based on data obtainedfrom the CPS in earlier years. The monthly CPS dealsmainly with labor force data for the civilian noninsti-tutional population. Questions relating to labor forceparticipation are asked about each member in everysample househole. In addition, supplementary ques-tions regardin school ....lrollment are asked about alleligible household members 3 years old and overeach October.
The present CPS sample was initially selected fromthe 1980 census files with coverage in all 50 Statesand the District of Columbia. The sample is continuallyupdated to reflect new construction. Each month,approximately 60,000 housing units are eligible forinterview. Of this number, about 2,500 units are vis-ited, but interviews are not obtained because theoccupants are not found at home after repeated callsor are unavailable for some other reason.
Since the inception of the CPS in 1948, the samplehas been redesigned several times to upgrade thequality and reliability of the data and to meet changingdata needs. The most recent changes were institutedbeginning in April 1984 and resulted in implementa-tion of the new design being completed in July 1985.
Description of the October Current Population Survey
The table below shows the impact of redesign onsome aspects of the CPS sample designs in useduring the referenced data collection periods.
ESTIMATION
The estimation procedure usea in this survey involvesthe inflation of the weighted sample results to inde-pendent estimates of the total civilian noninstittitionalpopulation of the United States by age, race, sex, andHispanic categories. These independent estimates arebased on statistics from the decennial censuses ofpopulation; statistics on births, deaths, immigrationand emigration; and statistics on the strength of theArmed Forces. The independent population estimatesused in this report to obtain data for 1981 and later arebased on the 1980 decennial census. In earlier reportsin this series (P-20), data for 1972 through 1980 wereobtained using independent population estimates basedon the 1970 decennial census. Estimates for earlieryears were based on earlier censuses.
RELIABILITY OF THE ESTIMATES
Since the CPS estimates were based on a sample,they may differ somewhat from the figures that wouldhave been obtained if a complete census had beentaken using the same questionnaires, instructions, andenumerators. There are two types of errors possible inan estimate based on a sample survey: sampling andnonsampling. The accuracy of a survey result depends
Time period Number of sampleareas
Housing units eigible
Interviewed Not interviewed
October 1985 729 57,500 2,500October 1984 1629/729 59,000 2,500October 1981 to 1983 629 58,000 2,500October 1980 629 63,000 3,000October 1978 to 1979 614 53,500 2,500October 1972 to 1977 461 45,000 2,000Oc .ober 1971 449 45,000 2,000October 1967 to 1970 449 48,000 2,000October 1965 to 1966 Z57 33,500 1,500October 1960 2333 33,500 1,500
'The CPS was redesigned following the 1980 Decennial Census of Population and Housing. During phase-in of the new design with the old,housing units from both designs were in the sample.
2Three sample areas were added in 1960 to represent Alaska and Hawaii after statehood.
144

126
on both types of errors, but the full extent of thenonsampling error is unknown. Consequently, partic-ular care should be exercised in the interpretation offigures based on a relatively small number of cases oron small differences between estimates. The standarderrors provided for the CPS estimate3 primarily indi-cate the magnitude of the rampling error. They alsopartially measure the effect of some nonsamplingerrors in responses and enumeration, but do notmeasure any systematic biases in the data. (Bias is thedifference, averaged over all possible samples, betweenthe sample estimates and the desired value.)
Nonsampling Variability. Nonsampling errors can beattributed to mar y sources; e.g., inability to obtaininformation about all cases in the sample, definitionaldifficulties, differences in the interpretation of ques-tions, inability or unwillingness on the part of therespondents to provide correct information, inabilityto recall information, errors made in data collectionsuch as in recording or coding the data, errors made inprocessing the data, errors made in estimating valuesfor missing data, and failure to represent all units withthe sample (undercoverage).
Undercoverage in the CPS results from missedhousing units and missed persons within sample house-holds. Overall undercoverage 3S compared to thelevel of the 1980 decennial census is about 7 percent.!t is known that CPS undercoverage varies with age,sex, and race. Generally, undercoverage is larger formales than for females and larger for Blacks and otherraces combined than for Whites. Ratio estimation toindependent age-sex-race population controls, as describedpreviously, partially corrects for the bias due to surveyundercoverage. However, biases exist in the esti-mates to the extent that missed persons in missedhouseholds or missed persons in interviewed house-holds have different characteristics from those ofinterviewed persons in the same age-sex-race group.Further, the independent population controls usedhave not been adjusted for undercoverage in the 1980census.
For additional information on nonsampling error,including the possible impact on CPS data vt:renknown, refer to Statistical Policy Working Paper 3, AnError Profile: Employment as Measured by the Cur-rent Population Survey, Office of Federal StatisticalPolicy and Standards, U.S. Department of Commerce,197C and Technical Paper 40, The Current PopulationSurvey: Design and Methodology, Bureau of the Cen-sus, U.S. Department of Commerce.
Sampling Variability. The standard errors given inTables C-1 through C-4 are primarily measures ofsampling variability, that is, of the variation that occurredby chance because a sample rather than tie entirepopulation was surveyed. The sample estimate and its
standard error enable one to construct confidenceintervals, ranges that would include the average resultof all possible samples with a known probability. Forexample, if all possible samples were selected, eachof these being surveyed under essentially the samegeneral conditions and using the same sample design,and if an estimate and its standard error were calcu-lated from each sample, then approximately 90 per-cent of the intervals from 1.6 standard errors belowthe estimate to 1.6 standard errors above the estimatewould include the average result of all possible sam-ples. The average estimate derived from all possiblesamples is or is not contained in any particular com-puted interval. However, for a particular sample, onecan say with specified confidence that the averageestimate derived from all possible samples is includedin the confidence interval.
Some statements in the report may contain esti-mates followed immediately by a number in parenthe-ses. For those statements, one has only to add to andsubtract from the estimate the number in parenthesesto calculate upper and lower bounds of the 90-percentconfidence interval. For example, if a statement con-tains the phrase "grew by 1.7 percent (.±. 1.0%)," the90- percent confidence interval for the estimate, 1.7percent, would be from 0.7 percent to 2.7 percent.
Standard errors may also be used to perform hypoth-esis testing, a procedure for distinguishing betweenpopulation parameters using sample estimates. Themost common type of hypothesis appearing in thisreport is that the population parameters are different.An example of this would be comparing the percent ofadults who were high school graduates in 1985 tothose in 1975. Tests may be performed at variouslevels of significance, where a level of significance isthe probability of concluding that the parameters aredifferent when, in fact, they are identical.
All statements of comparison in the text have passeda hypothesis test at the 0.10 level of significance. Thismeans that, for all the differences cited in the text, theestimated difference between characteristics is greaterthan 1.6 times the standard error of the difference.
Comparability Of Data. In using metropolitan andnon metropolitan data, caution should be used in com-paring estimates for 1977 and 1978 to each other or toany other years. Methodological and sample designchanges occurred in these years resulting in relativelylarge differences in the metropolitan and nonmetro-politan area estimates. However, estimates fo 1979and later are comparable as are estimates for 1976and earlier.
Caution should also Ix? used when comparing esti-mates for 1981 and later, which reflect 1980 census-based population controls, with estimates from earlieryears. This change in population controls had rela-tively little impact on summary measures such as
145

127
means, medians, and percent distributions, but didhave a significant impact on levels. For example, useof 1980-based population controls results in about a2-percent increase in the civilian noninstitutional pop-ulation and in the number of families and households.Thus, estimates of levels for 1981 and later will differfrom those for earlier years by more than what couldbe attributed to actual changes in the population, andthese differences could be disproportionately greaterfor certain subpopulation groups than for the totalpopulation.
In addition, the estimates in this report for 1985 arebased on revised survey weighting procedures forpersons of Hispanic origin. In previous, years theestimation procedures used in this survey invo!vedthe inflation of weighted sample results to indepen-dent estimates of the noninstitutional population byage, sex, and race. There was, therefore, no specificcontrol of the survey estimates for the Hispanic-originpopulation. During the last several years, the Bureauof the Census has developed independent populationcontrols for the Hispanic-origir population by sex anddetailed age groups and has dopted revised weight-ing procedures to incorporate these new controls. Itshould be noted that the independent populationestimates include some, but not all, illegal immigrants.
Note when using small estimates. Summary mea-sures (such as medians, and percent distributions) areshown in the report only when the base is 75,000 orgreater. Because of the large standard errors involved,there is little chance that summary measures wouldreveal useful information when computed on a smallerbase. Estimated numbers are shown, however, eventhough the relative standard errors of these numbersare larger than those for corresponding percentages.These smaller estimates are provided primarily topermit such combinations of the categories as serveeach data user's needs. Also, care must be taken inthe interpretation of small differences. For instance,even a small amount of nonsampling error can causea borderline difference to appear significant or not,thus distorting a seemingly-valid hypothesis test.
Standard error tables and their use. In order toderive standard errors that would be applicable to alarge number of estimates and could be prepared at amoderate cost, a number of approximations wererequired. Therefore, instead of providing an individualstandard error for each estimate, generalized sets ofstandard errors are provided for various types ofcharacteristics. As a result, the sets of standard errorsprovided give an indication of the order of magnitudeof the standard error of an estimate rather than theprecise standard error.
The figures presented in tables C-1 through C-4 areapproximations to the standard errors of various schoolenrollment estimates for persons in the United States.
To obtain the approximate standard error for a spe-cific characteristic, the appropriate standard error intables C-1 through C-4 must be multiplied by thefactor for that characteristic given in table C-5. Thesefactors must be applied to the generalized standarderrors in order to adjust for the combined effect of thesample design and the estimating procedure on thevalue of the characteristic. Standard errors for inter-mediate values not shown in the generalized tables ofstandard errors may be approximated by linear inter-polation.
The standard errors in tables C-1 through C-4 andthe factors in table C-5 were calculated using the bparameters in table C-5. The parameters may be useddirectly to calculate the standard errors for estimatednumbers and percentages. Methods for computationare given in the following sections.
Standard errors of estimated numbers. The approx-imate standard error, Sx, of an estimated numbershown in this report can be obtained in two ways. Itmay be obtained by use of the formula
Sx = fs (1)
where f is the appropriate factor from table C-5 and sis the standard error of the estimate obtained byinterpolation from table C-1 or C-2.
Alternatively, the standard error for estimates maybe approximated by formula (2) from which the stand-ard errors in tables C-1 and C-2 were calculated. Useof this formula will provide more accurate results thanthe use of formula (1) above.
TSx =V T x2 + bx (2)
Here x is the size of the estimate, T is the total numberof persons in a specific age group and b is theparameter in table C-5 associated with the particularcharacteristic. If T is not known, for Total or White use100,000,000; for Black and Hispanic use 10,000,000.
Illustration of the computation of the standard errorof an estimated number. Table A shows that in 1985there were 5,865,000 children aged 3 to 5 yearsenrolled in preprimary school and 10,733,000 totalchildren in that age group. Using formula (1) with f =1.1 from table C-5 and s = 73,900 from table C-1, thestandard error of 5,865,000 is (1.1) (73,900) = 81,300.The value of s = 73,900 was obtained by linearinterpolation in two directions in Table I. The firstinterpolation was between 10,000,000 persons and25,000,000 total persons for both 5,000,000 and 7,500,000estimated persons and yielded the values 77.0 for
146
1

128
5,000,000 estimated persons and 68.0 for 7,500,000estimated persons. The second interpolation was betweenthese two values to get the value corresponding to5,865,000 persons.
Alternatively, te!s. C-5 indicates that the appropri-ate b parameter to use in calculating a standard errorfor this estimate is b = 2,698. Using formula (2), theapproximate standard error is
2698E5,000 st.V
10 733 ,000(5,865,000)2 + (2,698) (5,865,000)
The 90-percent confidence interval is from 5,729,000to 6,001,000 children (using 1.6 times the standarderror). Therefore, a conclusion that the average esti-mate from all possible samples lies within a rangecomputed in this way would be correct for roughly 90percent of all possible samples.
Standard errors of estimated percentages. The reli-ability of an estimated percentage, computed usingsample data for both numerator and denominator,depends upon both the size of the percentage and thesize of the total upon which this percentage is based.Estimated percentages are relatively more reliablethan the corresponding estimates of the numeratorsof the percentages, particularly if the percentages are50 percent or more. When the numerator and &nom-inator of the percentage are in different categories,use the factor or parameter from table C-5 indicatedby the numer Au:. The approximate standard error,S (x,p), of an estimated percentage can be obtainedby use of the formula
S(,p) = fs. (3)
In this formula, f is the appropriate factor from tableC-5 and s is the standard error on the estimate fromtable C-3 or C-4. Alternatively, the standard error maybe approximated by the following formula from whichthe standard errors in tables C-3 and C-4 were calcu-lated. Use of this formula will give more accurateresults than use of formula above
S(X,p) = Vx
(p) (100 - p)b
(4)
Here x is the size of the subclass of persons orhouseholds which is the base of the percentage, p isthe percentage (0 < p < 100), and b is the parameterin table C-5 associated with the particular characteris-tic in the numerator of the percentage.
Illustration of the computation of the standard errorof an estimated percentage. Table A shows that anestimated 54.7 percent of the 8,700,000 White chil-dren aged 3 to 5 years were enrolled in preprimary
school in 1985. Using formula (3) with f = 1.1 fromtable C5 and s = .9 from table C-3, the standard errorof 54.7 percent is (1.1) (0.9) = 1.0. Alternatively, usingformula (5) with the appropriate b parameter of 2,698from table C-5, the standard error of 54.7 percent isgiven by
..\/ 2,6988,700,000
(54.7) (45.3)
Thus, a 90-percent confidence interval for this esti-mate, using the standard error found by formula (4), isfrom 53.3 to 56.1 percent.
Standard error of a difference. For a difference betweentwo sample estimates, the standard error is approxi-mately equal to
"."(x .y) = VS + S2x y (5)
where Sx and Sy are the standard errors of theestimates x and y, respectively. The estimates can benumbers, percents, etc. This will represent the actualstandard error quite accurately for the difference betweentwo estimates of the same characteristic in two differ-ent areas or for the difference between separate anduncorrelated characteristics in the same area. If, how-ever, there is a high positive (negative) correlationbetween the two characteristics, the formula will over-estimate (underestimate) the true standard error.
Illustration of the calculation of the standard error ofa difference. Table B of this report shows that inOctober 1985 an estimated 33.4 percent of F50,000Black children 3 years old were enrolled in preprimaryschool as compared to 28.5 percent of 2,919,000White children of the same age. Using formula (4) withthe appropriate b parameter of 2,698 from table C-5,the approximate standard error of 33.4 percent a 3.3,and the approximate standard error of 28.5 percent is1.4. The apparent difference between these two esti-mates is 4.9 percent, and the standard error associ-ated with the difference is
3.6 = V(3.3)2 + (1.4)2
The 90-percent confidence interval on the differenceof 4.9 percent is from -0.9 to 10.7 percent. Therefore,a conclusion that the average estimate of the differ-ence derived from all possible samples lies within arange computed in this way would be correct for
1 4 7

129
roughly 90 percent of all samples. Since this intervalcontains zero, we cannot conclude at the 90-percentsignificance level that the percentage of Black children
3 years of age enrolled in preprimary school is differ-ent from the percentage of White children of the sameage group.
Table C-1. Generalized Standard Errors for Estimated Numbers of Perscns: Total or White(Numbers in thousands)
Estimated number of persons
102030405075
100200300400600750
1,0002,0003,0004,0005,0007,500
10,00020,00030,00040,00050,00075,000 =
100,000
100 250 1 500
4.6 4.7 4.86.1 6.5 6.77.0 7.8 8.17.4 8.8 9.27.6 9.6 10.26.6 11.0 12.1
11.8 13.69.6 16.7
16.713.6
Total persons in age group'
1,000 2,500 5,000 10,0001 25,000 50,000 100,000
4.8 4.8 4.8 4.8 4.8 4.8 4.86.7 6.8 6.8 6.8 6.8 6.8 6.88.2 8.3 8.3 8.3 8.3 8.3 8.39.4 9.5 9.S 9.6 9.6 9.6 9.6
10.5 10.6 10.7 10.7 10.7 10.7 10.712.7 13.0 13.1 13.1 13.1 13.2 13.2
14.4 14.9 15.1 15.1 15.2 15.2 15.219.2 20.6 21.1 21.3 21.4 21.5 21.522.0 24.7 25.5 25.9 26.2 26.3 26.323.6 27.9 29.2 29.8 30.2 30.3 30.324.0 30.4 32.3 33.1 33.7 33.8 33.920.8 34.8 38.4 40.0 41.0 41.3 41.5
37.2 43.0 45.6 47.1 47.6 47.830.4 52.7 60.8 65.2 66.6 67.3
52.7 69.7 78.1 80.7 82.043.0 74.5 88.1 92.2 94.2
- - 76.0 96.2 102.0 104.865.8 110.2 121.4 126.6
117.8 136.0 144.296.2 166.6 192.3
- 166.6 220.3136.0 235.6
240.4208.2
- Not applicable.
la. These standard errors must be multiplied by the appropriate factor in table C-5 to obtain the standard error for a specific characteristic.
b. To estimate standard errors for years 1956 to 1966 multiply the above standard errors by 1.14; for 1967 to 1980, multiply by 0.93.
c. The standard errors were calculated using the formula, V_(brn x2 + bx , where b = 2,312 (from table C-5), and T is the total numberof persons in an age group.
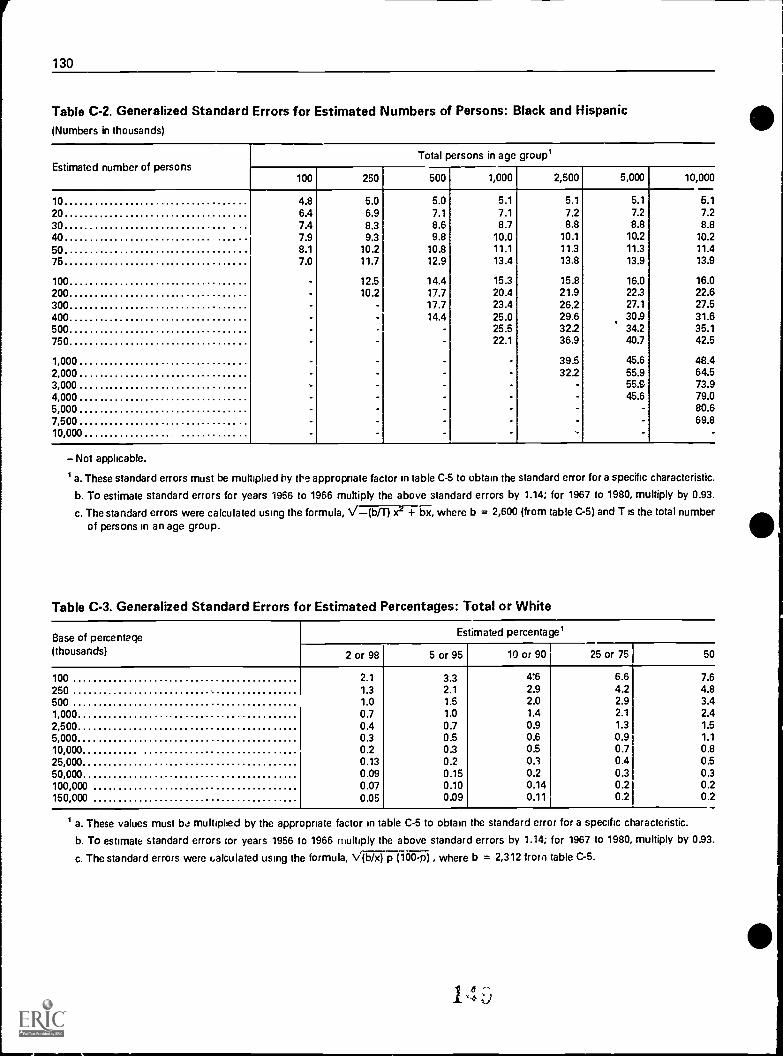
130
Table C-2. Generalized Standard Errors for Estimated Numbers of Persons: Black and Hispanic(Numbers in thousands)
Estimated number of personsTotal persons in age group'
100 250 500 1,000 2,500 5,000 10,000
10 4.8 5.0 5.0 5.1 5.1 5.1 6.1
20 6.4 6.9 7.1 7.1 7.2 7.2 7.230 7.4 8.3 8.6 8.7 8.8 8.8 8.8
40 7.9 9.3 9.8 10.0 10.1 10.2 10.2
50 8.1 10.2 10.8 11.1 11.3 11.3 11.4
76 7.0 11.7 12.9 13.4 13.8 13.9 13.9
100 12.5 14.4 15.3 15.8 16.0 16.0200 10.2 17.7 20.4 21.9 22.3 22.6300 - 17.7 23.4 26.2 27.1 27.5400 14.4 25.0 29.6 30.9 31.6500 - 25.5 32.2 34.2 35.1750 - 22.1 36.9 40.7 42.5
1,000 - 39.5 45.6 48.42,000 - - 32.2 55.9 64.53,000 - - 55.0 73.94,000 - - 45.6 79.05,000 - - - 80.67,500 - - - 69.810,000 . . .
- Not applicable.
I a. These standard errors must be multiplied by the appropriate factor in table C-5 to obtain the standard error for a specific characteristic.
b. To estimate standard errors for years 1956 to 1966 multiply the above standard errors by 1.14; for 1967 to 1980, multiply by 0.93.
c. The standard errors were calculated using the formula, \ -(b/T) x2 + bx, where b = 2,600 (from table C-5) and T is the total numberof persons in an age group.
Table C-3. Generalized Standard Errors for Estimated Percentages: Total or White
Base of percentage(thousands)
Estimated percentage'
2 or 98 5 or 95 10 or 90 25 or 75 50
100 2.1 3.3 4:6 6.6 7.6250 1.3 2.1 2.9 4.2 4.8500 1.0 1.5 2.0 2.9 3.4
1,000 0.7 1.0 1.4 2.1 2.4
2,500 0.4 0.7 0.9 1.3 1.5
5,000 0.3 0.5 0.6 0.9 1.1
10,000 0.2 0.3 0.5 0.7 0.825,000 0.13 0.2 0.3 0.4 0.550,000 0.09 0.15 0.2 0.3 0.3100,000 0.07 0.10 0.14 0.2 0.2150,000 0.05 0.09 0.11 0.2 0.2
a. These values must be multiplied by the appropriate factor in table C-5 to obtain the standard error for a specific characteristic.
b. To estimate standard errors tor years 1956 to 1966 multiply the above standard errors by 1.14; for 1967 to 1980, multiply by 0.93.
c. The standard errors were Calculated using the formula, V (b/x) p (100-P) , where b = 2,312 from table C-5.

131
Table C-4. Generalized Standard Error; for Es 'mated Percentages: Black and Hispanic
Base of percentage(thousands)
Estimated percentage'
2 or 98 5 or 95 10 or 90f
25 or 75 50
75 2.6 4.1 5.6 8.1 9.3100 2.3 3.5 4.8 7.0 8.1250 1.4 2.2 3.1 4.4 5.1600 1.0 1.6 2.2 3.1 3.61,000 0.7 1.1 1.5 2.2 2.52,500 0.5 0.7 1.0 1.4 1.65,000 0.3 0.5 0.7 1.0 1.110,000 0.2 0.4 0.5 0.7 0.815,000 0.2 0.3 0.4 0.6 0.720,000 0.2 0.2 0.3 0.5 0.6
1 a. These standard errors must be multiplied by the appropriate factors in table C-5 to obtain the standard error for a specific characteristic.b. To estimate standard errors for years 1956 to 1966 multiply the above standard errors by 1.14: for 1967 to 1980, multiply by 0.93.c. The standard errors were calculated using the formula, ./(b/x) p (100-p) , where b = 2,600 from table C-5.
Table C-5. Parameters and Factors to be Used for School Enrollment Characteristics for Direct Computationof Standard Errors
(Use for 19R1 and later years)
Chat acteristic Parameters Factors
b fPersons enrolled in school
3 to 34 years old:Total or WhiteBlackHispanic on:in
14 to 34 years old:Total or WhiteBlackHispanic origin
Children enrolled in school
3 to 6 years old:Total or WhiteBlackHispanic origin
3 to 13 years old:Total or WhiteBlackHispanic origin
2 3122,6002,600
2,3122,6002,600
2,6982,6982,698
2,6982,6982.698
1.01.01.0
1.01.01.0
I a. For nonmetropolitan data cross-tabulated with other data, multiply f by 1.2 and the b parameter by 1.5.b. Multiply the b parameter by 0.87 for CPS data collected from 1967 to 1980 and by 1.3 for CPS data collected from 1956 to 1366.c. For regional data, multiply the b parameter by 0.99 for the Northeast, 1.02 forthe Midwest, 0.98 for the South, and 0.84 for the West.
*U.S. G.Y.O. 198P-m1-478.81,10q
1 r70 U

Current Population ReportsSchool EnrollmentSeries P-20
No.No.No.No.No.
No.No.No.No.No.
No.No.No.No.No.
No.No.No.No.No.
1
12192430
3440434552
6466748093
101110117126129
SchooSchooSchooSchooSchoo
SchooSchooSchooSchooSchoo
SchooSchooSchooSchooSchoo
SchooSchooSchooSchooSchoo
Enrollment of the Civilian Population: October 1946Enrollment of the Civilian Population: April 1947Enrollment of the Civilian Population: October 1947Enrollment of the Civilidn Population: October 1948Enrollment of the Civilian Population: October 1949
Enrollment of the Civilian Population: October 1950Enrollment: October 1951Enrollment: October 1952Enrollment, Educational Attainment and Illiteracy: October 1952Enrollment: October 1953
Enrollment: October 1954Enrollment: October 1955Enrollment: October 1956Enrollment: October 1957Enrollment: October 1958
Enrollment: October 1959Enrollment, and Education of Young Adults c.ild Their Fathers: OctoberEnrollment: October 1961Enrollment: October 19(.,2Enrollment: October 1963
1960
No. 148 School Enrollment: October 1964No. 162 School Enrollment: October 1965No. 167 School Enrollment: October 1966No. 183 Characteristics of Students and Their Colleges: October 1966No. 190 School Enrollment: October 1968 and 1967
No. 206 School Enrollment: October 1969No. 222 School Enrollment: October 1970No. 231 Undergraduate Enrollment in Two-Year and Four-Year Colleges: October 1970No. 236 Undergraduate Enrollment in Two-Year and Four-Year Colleges: October 1971No. 241 Social and Economic Characteristics of Students: October 1971
No. 252 College Plans of High School Seniors: October 1972No. 257 Undergraduate Enrollment in Two-Year and Four-Year Colleges: October 1972No. 260 Social and Economic Characteristics of Students: October 1972No. 268 Nursery School and Kindergarten Enrollment: October 1973No. 270 College Plans of High School Seniors: October 1973
No. 272 Social and Economic Characteristics of Students: October 1973No. 281 Income and Expenses of Students Enrolled in Postsecondary Schools: October 1973No. 284 College Pans of High School Seniors: October 1974No. 286 School EnrollmentSocial and Economic Characteristics of Students: October 1974No. 289 Major Field of Study of College Students: October 1974
No. 299 College Plans of High School Seniors: October 1975No. 303 School EnrollmentSocial and Economic CharacteristicsNo. 318 Nursery School and Kindergarten Enrollment of Children
Oct ber 1967 to October 1976No. 319 School EnrollmentSocial and Ec nomic CharacteristicsNo. 333 School EnrollmentSocial and nomic Characteristics
No. 337 Relative Progress of Children in school: 1976No. 342 Travel to School: October 1978No. 343 Vocational School Experience: October 1976No. 346 School EnrollmentSocial and Economic Characteristics of Students: October 1978No. 348 Living Arrangements of College Students: October 1976
No. 351 Major Field of Study of College Students: October 1978No. 360 School EnrollmentSocial and Economic CharacteristicsNo. 400 School EnrollmetSocial and Economic CharacteristicsNo. 408 School EnrollmentSocial and Economic CharacteristicsNo. 413 School EnrollmentSocial and Economic Characteristics
of Students: October 1975and Labor Force Status of Their Mothers:
of Students: October 1976of Students: October 1977
of Students: October 1979of Students: October 1981 and 1980of Students: October 1982of Students: October 1983
Ser;es P-23
No. 121 Private School Enrollment, Tuition, and Enrollment Trends: October 1979
1 Fi 1