documentación y análisis geométrico del patrimonio...
TRANSCRIPT
Documentación y análisis geométrico del patrimonio arquitectónico a partir de métodos fotogramétricos con una y múltiples imágenes
4.2 A PHOTOGRAMMETRIC AND COMPUTER VISION-BASED APPROACH FOR AUTOMATED 3D ARCHITECTURAL MODELING AND ITS TYPOLOGICAL ANALYSIS
Resumen: Actualmente, en la digitalización del patrimonio arquitectónico, a la
dificultad en el proceso de toma de datos hay que sumar un mayor grado de
especialización en el manejo de software tanto láser como fotogramétrico. Gracias a
los avances en la integración de la fotogrametría y la visión computacional así como
en parte de los métodos y algoritmos numéricos de cálculo, es posible poder aspirar
al paso del 2d (imágenes) al 3d (nubes de puntos) de forma automática, flexible y con
calidad. Este artículo presenta un método novedoso concretado en el desarrollo de
una herramienta, PW-Photogrammetry Workbench y su utilidad para el modelado
arquitectónico. Esta herramienta permite, a partir de imágenes, generar modelos
tridimensionales a escala en forma de nubes de puntos que superan incluso la
resolución de los sistemas láser y que además pueden ir acompañadas de las
correspondientes ortofotos con textura fotográfica de alta resolución. El método
permite abordar estudios sobre la tipología de la arquitectura y ha sido testeado de
forma exitosa sobre un muestreo de diez edificios religiosos representativos de cada
una de las tipologías detectadas en los municipios fronterizos de la comarca de Aliste,
Zamora (España).
Palabras clave: modelado basado en imágenes; fotogrametría; visión
computacional; correspondencia; patrimonio cultural; arquitectura; desarrollo de
software; análisis tipológico
35

Remote Sens. 2014, 6, 5671-5691; doi:10.3390/rs6065671
remote sensing ISSN 2072-4292
www.mdpi.com/journal/remotesensing
Article
A Photogrammetric and Computer Vision-Based
Approach for Automated 3D Architectural Modeling and
Its Typological Analysis
Jesús García-Gago 1, Diego González-Aguilera
1,*, Javier Gómez-Lahoz
1
and Jesús Ignacio San José-Alonso 2
1 Department of Cartographic and Terrain Engineering, Polytechnic School of Avila, University of
Salamanca, Hornos Caleros 50, 05003 Avila, Spain;
E-Mails: [email protected] (J.G.-G.); [email protected] (J.G.-L.) 2
Lab of Architectural Photogrammetry, High Technical School of Architecture ,University of
Valladolid, Av. Salamanca 32, 47014 Valladolid, Spain; E-Mail: [email protected]
* Author to whom correspondence should be addressed; E-Mail: [email protected];
Tel.: +34-920-353-500; Fax: +34-920-353-501.
Received: 13 March 2014; in revised form: 12 June 2014 / Accepted: 12 June 2014 /
Published: 17 June 2014
Abstract: Thanks to the advances in integrating photogrammetry and computer vision, as
well as in some numeric algorithms and methods, it is possible to aspire to turn 2D
(images) into 3D (point clouds) in an automatic, flexible and good-quality way. This article
presents a new method through the development of PW (Photogrammetry Workbench)
(and how this could be useful for architectural modeling). This tool enables the user to turn
images into scale 3D point cloud models, which have a better quality than those of laser
systems. Moreover, the point clouds may include the respective orthophotos with
photographic texture. The method allows the study of the typology of architecture and has
been successfully tested on a sample of ten religious buildings located in the region of
Aliste, Zamora (Spain).
Keywords: image-based modeling; photogrammetry; computer vision; matching; cultural
heritage; architecture; software development; typological analysis
OPEN ACCESS
37
Remote Sens. 2014, 6 5672
1. Introduction
There is no doubt that photogrammetry is gaining an audience. Furthermore, it stands as a serious
competitor against the popular laser scanner systems, both terrestrial (TLS (Terrestrial Laser Scanner))
and aerial (ALS (Airborne Laser Scanner)) and both static and dynamic systems (MLMS (Mobile
LiDAR Mapping System)) [1]. The success of photogrammetry lies in two aspects: the reliability of
the system and the fact that it uses the image as the most valuable source of information, as well as the
beneficial “marriage” with computer vision [2]. This hybridization has made it possible to overcome
two important obstacles. First, the automation in the orientation process and the reconstruction process
itself, which results in dense 3D models that, in some cases, have a higher resolution than those
obtained from laser scanners. Second, the flexibility of the image capturing process, as, due to the
substantial technological development of photogrammetric software in recent years, it is possible to
use any type of image. It even allows any type of camera, calibrated or uncalibrated [3], smartphone or
tablet [4]. Photogrammetry has even a third advantage: its commitment to the accuracy and reliability
of the results [5]. This means that, for many uses, photogrammetry stands out as a serious competitor
against the low-cost laser systems.
Terrestrial photogrammetry makes it possible to obtain precise 3D models of highly irregular
elements, in a non-contact way, that minimizes the measurement time and enables the evaluation of the
structural safety of any construction [6]. It can also be combined with other techniques, such as
ground-penetrating radar (GPR) for archaeological purposes, with great success [7]. In addition, the
radiometric content of the data allows the introduction of analytical constraints derived from the
regular shape of architectural surfaces to obtain accurate 3D CAD models [8].
There are also many tools that, for different purposes and at a low cost, or even free and open
source, allow us to turn 2D images into 3D point clouds. Such a challenge requires solving two
preliminary important geometric issues. First, knowing the internal parameters of the camera (focal
length, principal point coordinates and lens distortion parameters) and, second, knowing the external
parameters (spatial and angular position) [9]. For years, photogrammetry has succeeded in solving
those issues by applying rigorous laboratory and/or field calibration processes and also thanks to a
well-planned network of pass and control points. However, the integration of algorithms and
techniques from computer vision has enabled such obstacles and dependence to be overcome and
automatically solved during the 3D model calculation process (structure from motion (SfM)) [10,11].
More specifically, the main advances concern multiple image matching strategies based on FBM
(feature-based matching) and ABM (area-based matching), which allow one to obtain, by means of
collinearity equations [5], the spatial and angular position of the image, as well as a preliminary
dispersed geometry of the scene in an arbitrary and local system of coordinates [12]. Once the image
resections are solved, the direct process may begin multiple direct intersections; this process also
sustained on the concept of collinearity, which leads to the reconstruction of the 3D model or a
dimensional-metric analysis of the object or scene. In this process, major advances have once again
taken place thanks to matching techniques. The process starts from the powerful, although constrained
to the favorable geometry of the so-called normal case, semi-global matching (SGM) [13]. This
technique allows the creation of dense 3D point clouds models from multiple images with the same
resolution as the GSD (ground sample distance) of the image; that is, each pixel of the image renders a
38
Remote Sens. 2014, 6 5673
specific point of the model. Apero-Micmac [14] is a good example of open source software, as well as
other commercial photogrammetric tools (eATE, NGATE, Dense Matcher, ISAE, Match-T, Xpro,
Tridicon, PhotoScan, etc.). Nevertheless, the use of patch-based methods based on surfels has also
helped develop the creation of dense models from multiple images with oblique and converging
geometry [15,16]. In this regard, Patch-based Multi-View Stereo (PMVS) [17] (Furukawa and Ponce,
2009) takes a hybrid approach based on providing a dense set of small oriented rectangular patches on
the pixel level. Moreover, it includes a visibility filter, which allows deleting false matched points.
However, the greatest disadvantage of these commercial and web-based tools (Bundler, Photosynth,
Photofly Insight 3D, 123Catch) is that they are based on computer vision algorithms, which calculate
the image orientation by using independent models. The main drawbacks of this approach are that the
internal parameters of the camera are not treated in a thorough and global way and that the exterior
parameters must be transmitted from one model to another, thus being subject to an exponential
propagation error. Therefore, the outcome is far from the rigorous orientation of photogrammetric
bundle adjustment, which is based on a global minimization error approach and, in addition, on the
explicit inclusion of internal parameters, either as unknowns (self-calibration) or as previously
calculated. As a result, the quality is not as good as expected. Another great disadvantage of
commercial and web-based tools is the computational cost due to both the number and the size of the
images, especially if we are working with large format images. Therefore, it can be concluded that
there is still a lot to do and that we need to aspire to parallel and GPU programming, which may not
allow us to work in real time, but will help us get acceptable processing times and image volumes.
In this regard, the article presents the tool, Photogrammetry Workbench, as an attempt to bring
photogrammetry and computer vision even closer with the aim of avoiding the aforementioned
disadvantages, applied to architectural modeling. The starting point is to rigorously tackle the image
orientation process by carrying out a preliminary approximation based on computer vision and a
precise and reliable refinement resulting from photogrammetric bundle adjustment. Then, the tool
enables the user to choose the generation method that creates the dense 3D model according to the
geometry of the image acquisition network, which has been previously calculated. That is to generate a
dense model from vertical and horizontal images with the SGM (semi-global matching) strategy, or to
create the dense model from oblique multiple images by encircling the object with a “ring” and using
the patch-based method. In this way, quality 3D model generation can be achieved thanks to the
rigorous orientation procedures of photogrammetry. As a result of the automatic 3D modeling, graphic
information is obtained—orthophotos—which enable the analysis of architectural cultural heritage.
The article is structured as follows; after the Introduction, Section 2 details the method for turning
2D images into 3D point clouds placing strong emphasis on the processing steps (image matching and
object reconstruction). Section 3 covers the typological analysis of ten churches in the border towns of
the region of Aliste (Zamora, Spain), using PW (Photogrammetry Workbench) for the architectural
modeling. Section 4 summarizes and condenses the main article contributions together with the
possible future action lines.
39
Remote Sens. 2014, 6 5674
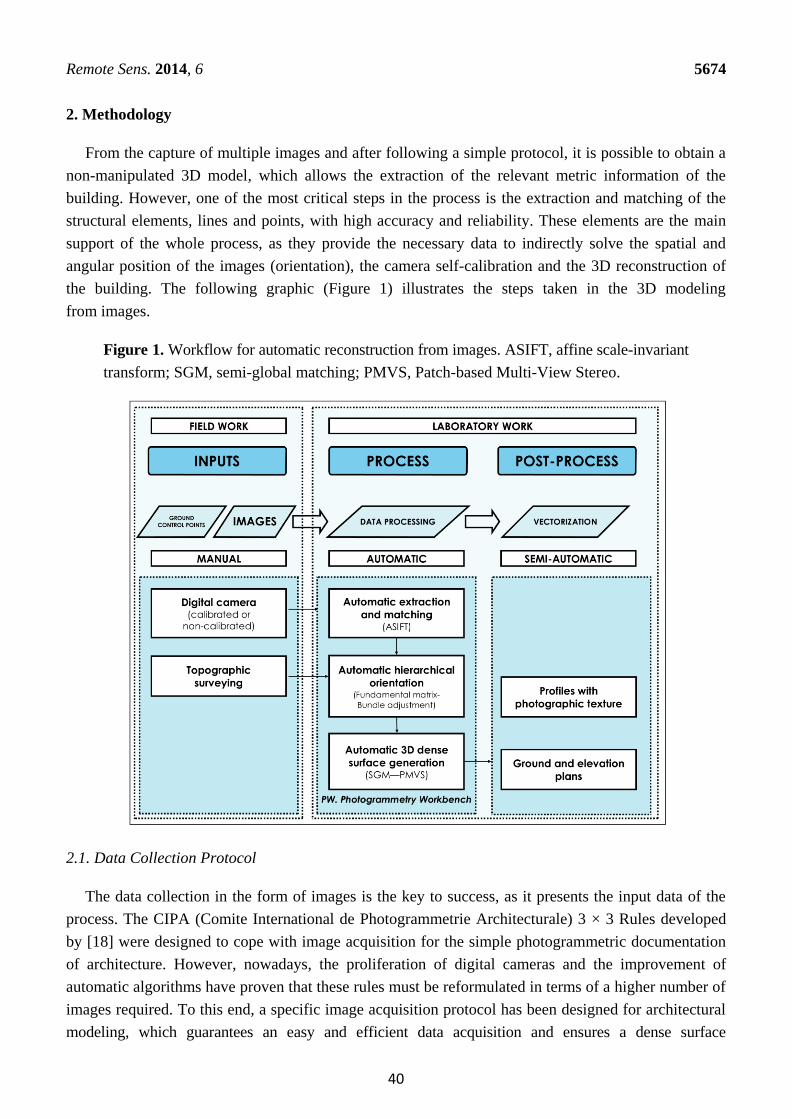
2. Methodology
From the capture of multiple images and after following a simple protocol, it is possible to obtain a
non-manipulated 3D model, which allows the extraction of the relevant metric information of the
building. However, one of the most critical steps in the process is the extraction and matching of the
structural elements, lines and points, with high accuracy and reliability. These elements are the main
support of the whole process, as they provide the necessary data to indirectly solve the spatial and
angular position of the images (orientation), the camera self-calibration and the 3D reconstruction of
the building. The following graphic (Figure 1) illustrates the steps taken in the 3D modeling
from images.
Figure 1. Workflow for automatic reconstruction from images. ASIFT, affine scale-invariant
transform; SGM, semi-global matching; PMVS, Patch-based Multi-View Stereo.
2.1. Data Collection Protocol
The data collection in the form of images is the key to success, as it presents the input data of the
process. The CIPA (Comite International de Photogrammetrie Architecturale) 3 × 3 Rules developed
by [18] were designed to cope with image acquisition for the simple photogrammetric documentation
of architecture. However, nowadays, the proliferation of digital cameras and the improvement of
automatic algorithms have proven that these rules must be reformulated in terms of a higher number of
images required. To this end, a specific image acquisition protocol has been designed for architectural
modeling, which guarantees an easy and efficient data acquisition and ensures a dense surface
40
Remote Sens. 2014, 6 5675
reconstruction. Three different acquisition protocols are proposed in order to cope with as best as
possible the size, morphology and external elements (i.e., occlusions, obstacles, etc.) of the buildings.
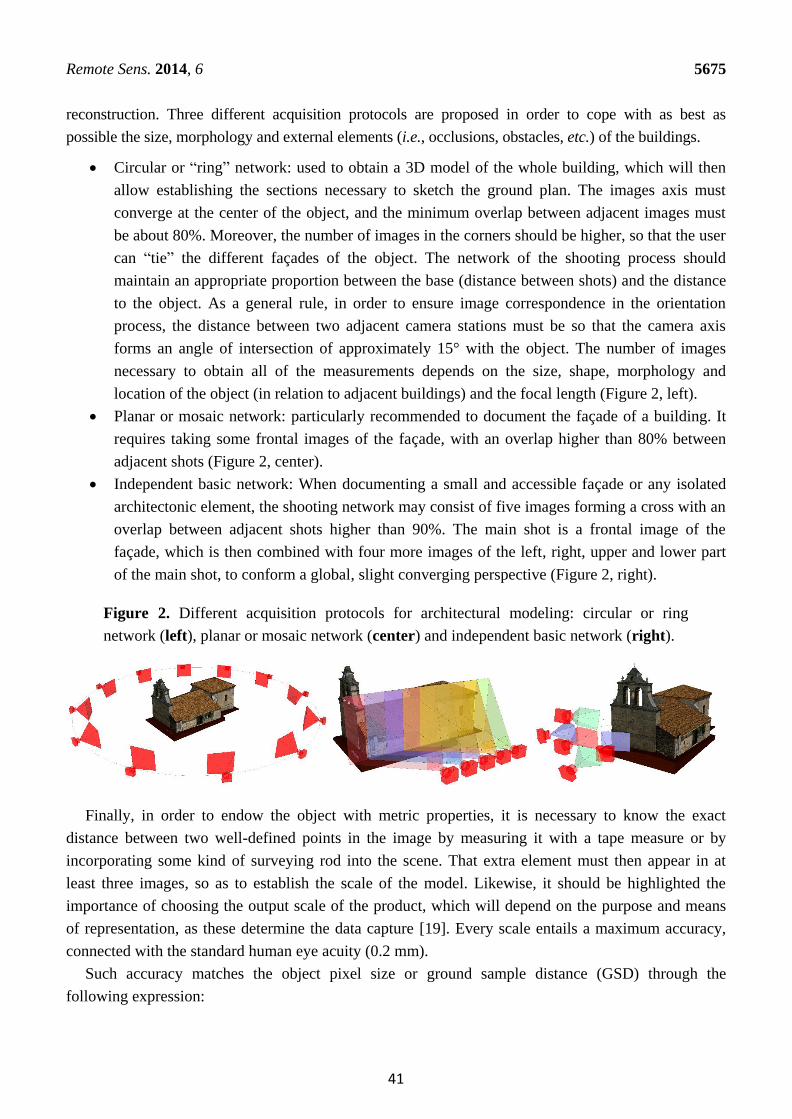
Circular or “ring” network: used to obtain a 3D model of the whole building, which will then
allow establishing the sections necessary to sketch the ground plan. The images axis must
converge at the center of the object, and the minimum overlap between adjacent images must
be about 80%. Moreover, the number of images in the corners should be higher, so that the user
can “tie” the different façades of the object. The network of the shooting process should
maintain an appropriate proportion between the base (distance between shots) and the distance
to the object. As a general rule, in order to ensure image correspondence in the orientation
process, the distance between two adjacent camera stations must be so that the camera axis
forms an angle of intersection of approximately 15° with the object. The number of images
necessary to obtain all of the measurements depends on the size, shape, morphology and
location of the object (in relation to adjacent buildings) and the focal length (Figure 2, left).
Planar or mosaic network: particularly recommended to document the façade of a building. It
requires taking some frontal images of the façade, with an overlap higher than 80% between
adjacent shots (Figure 2, center).
Independent basic network: When documenting a small and accessible façade or any isolated
architectonic element, the shooting network may consist of five images forming a cross with an
overlap between adjacent shots higher than 90%. The main shot is a frontal image of the
façade, which is then combined with four more images of the left, right, upper and lower part
of the main shot, to conform a global, slight converging perspective (Figure 2, right).
Figure 2. Different acquisition protocols for architectural modeling: circular or ring
network (left), planar or mosaic network (center) and independent basic network (right).
Finally, in order to endow the object with metric properties, it is necessary to know the exact
distance between two well-defined points in the image by measuring it with a tape measure or by
incorporating some kind of surveying rod into the scene. That extra element must then appear in at
least three images, so as to establish the scale of the model. Likewise, it should be highlighted the
importance of choosing the output scale of the product, which will depend on the purpose and means
of representation, as these determine the data capture [19]. Every scale entails a maximum accuracy,
connected with the standard human eye acuity (0.2 mm).
Such accuracy matches the object pixel size or ground sample distance (GSD) through the
following expression:
41
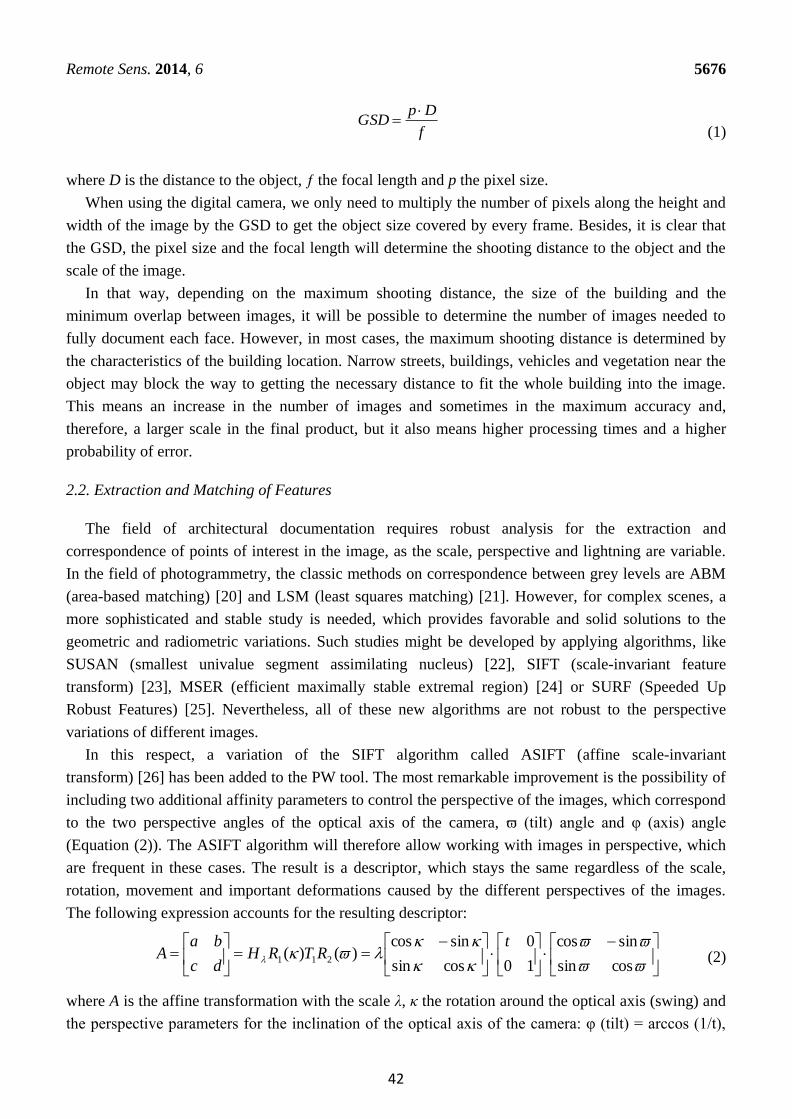
Remote Sens. 2014, 6 5676
f
DpGSD
(1)
where D is the distance to the object, ƒ the focal length and p the pixel size.
When using the digital camera, we only need to multiply the number of pixels along the height and
width of the image by the GSD to get the object size covered by every frame. Besides, it is clear that
the GSD, the pixel size and the focal length will determine the shooting distance to the object and the
scale of the image.
In that way, depending on the maximum shooting distance, the size of the building and the
minimum overlap between images, it will be possible to determine the number of images needed to
fully document each face. However, in most cases, the maximum shooting distance is determined by
the characteristics of the building location. Narrow streets, buildings, vehicles and vegetation near the
object may block the way to getting the necessary distance to fit the whole building into the image.
This means an increase in the number of images and sometimes in the maximum accuracy and,
therefore, a larger scale in the final product, but it also means higher processing times and a higher
probability of error.
2.2. Extraction and Matching of Features
The field of architectural documentation requires robust analysis for the extraction and
correspondence of points of interest in the image, as the scale, perspective and lightning are variable.
In the field of photogrammetry, the classic methods on correspondence between grey levels are ABM
(area-based matching) [20] and LSM (least squares matching) [21]. However, for complex scenes, a
more sophisticated and stable study is needed, which provides favorable and solid solutions to the
geometric and radiometric variations. Such studies might be developed by applying algorithms, like
SUSAN (smallest univalue segment assimilating nucleus) [22], SIFT (scale-invariant feature
transform) [23], MSER (efficient maximally stable extremal region) [24] or SURF (Speeded Up
Robust Features) [25]. Nevertheless, all of these new algorithms are not robust to the perspective
variations of different images.
In this respect, a variation of the SIFT algorithm called ASIFT (affine scale-invariant
transform) [26] has been added to the PW tool. The most remarkable improvement is the possibility of
including two additional affinity parameters to control the perspective of the images, which correspond
to the two perspective angles of the optical axis of the camera, ϖ (tilt) angle and φ (axis) angle
(Equation (2)). The ASIFT algorithm will therefore allow working with images in perspective, which
are frequent in these cases. The result is a descriptor, which stays the same regardless of the scale,
rotation, movement and important deformations caused by the different perspectives of the images.
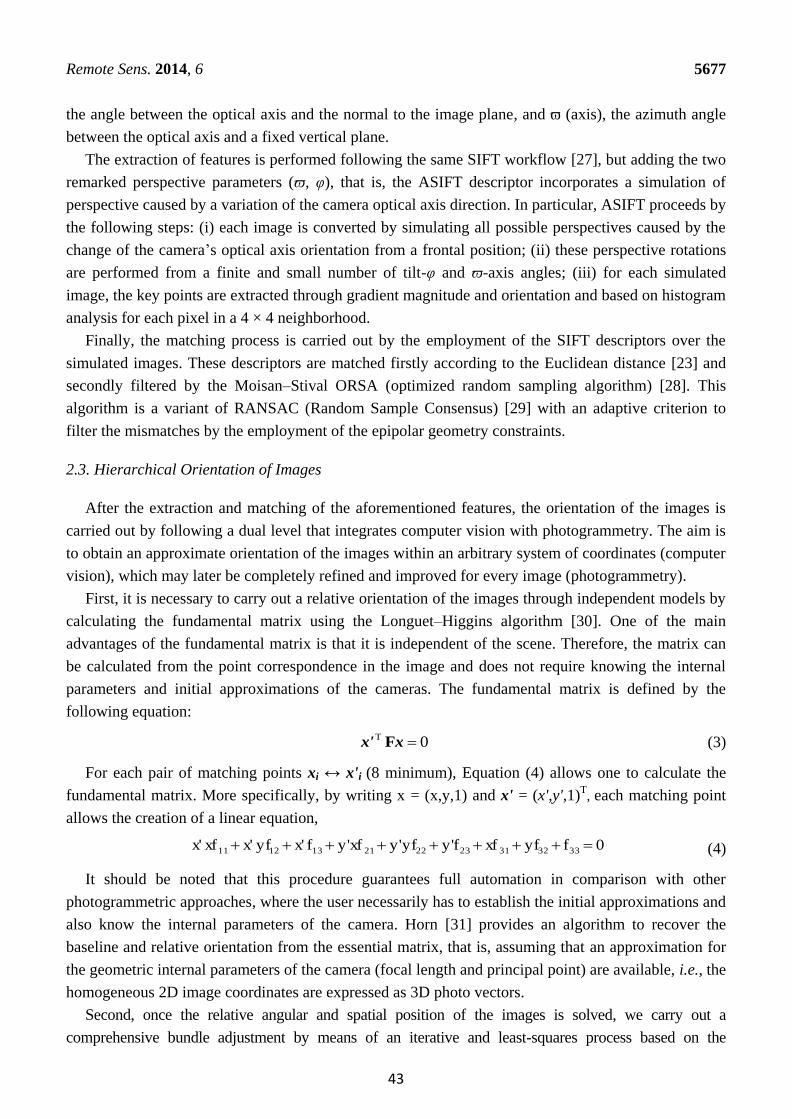
The following expression accounts for the resulting descriptor:
cossin
sincos
10
0
cossin
sincos)()( 211
tRTRH
dc
baA (2)
where A is the affine transformation with the scale λ, κ the rotation around the optical axis (swing) and
the perspective parameters for the inclination of the optical axis of the camera: φ (tilt) = arccos (1/t),
42
Remote Sens. 2014, 6 5677
the angle between the optical axis and the normal to the image plane, and ϖ (axis), the azimuth angle
between the optical axis and a fixed vertical plane.
The extraction of features is performed following the same SIFT workflow [27], but adding the two
remarked perspective parameters (ϖ, φ), that is, the ASIFT descriptor incorporates a simulation of
perspective caused by a variation of the camera optical axis direction. In particular, ASIFT proceeds by
the following steps: (i) each image is converted by simulating all possible perspectives caused by the
change of the camera’s optical axis orientation from a frontal position; (ii) these perspective rotations
are performed from a finite and small number of tilt-φ and ϖ-axis angles; (iii) for each simulated
image, the key points are extracted through gradient magnitude and orientation and based on histogram
analysis for each pixel in a 4 × 4 neighborhood.
Finally, the matching process is carried out by the employment of the SIFT descriptors over the
simulated images. These descriptors are matched firstly according to the Euclidean distance [23] and
secondly filtered by the Moisan–Stival ORSA (optimized random sampling algorithm) [28]. This
algorithm is a variant of RANSAC (Random Sample Consensus) [29] with an adaptive criterion to
filter the mismatches by the employment of the epipolar geometry constraints.
2.3. Hierarchical Orientation of Images
After the extraction and matching of the aforementioned features, the orientation of the images is
carried out by following a dual level that integrates computer vision with photogrammetry. The aim is
to obtain an approximate orientation of the images within an arbitrary system of coordinates (computer
vision), which may later be completely refined and improved for every image (photogrammetry).
First, it is necessary to carry out a relative orientation of the images through independent models by
calculating the fundamental matrix using the Longuet–Higgins algorithm [30]. One of the main
advantages of the fundamental matrix is that it is independent of the scene. Therefore, the matrix can
be calculated from the point correspondence in the image and does not require knowing the internal
parameters and initial approximations of the cameras. The fundamental matrix is defined by the
following equation:
0T xx' F (3)
For each pair of matching points xi ↔ x'i (8 minimum), Equation (4) allows one to calculate the
fundamental matrix. More specifically, by writing x = (x,y,1) and x' = (x',y',1)T, each matching point
allows the creation of a linear equation,
0fyfxffy'yfy'xfy'fx'yfx'xfx' 333231232221131211 (4)
It should be noted that this procedure guarantees full automation in comparison with other
photogrammetric approaches, where the user necessarily has to establish the initial approximations and
also know the internal parameters of the camera. Horn [31] provides an algorithm to recover the
baseline and relative orientation from the essential matrix, that is, assuming that an approximation for
the geometric internal parameters of the camera (focal length and principal point) are available, i.e., the
homogeneous 2D image coordinates are expressed as 3D photo vectors.
Second, once the relative angular and spatial position of the images is solved, we carry out a
comprehensive bundle adjustment by means of an iterative and least-squares process based on the
43

Remote Sens. 2014, 6 5678
collinearity condition [5] and by adding the object coordinates to allow a full georeferencing of the images
(Equation (5)). These object coordinates are incorporated into the orientation process thanks to the targets
spread about the scene or by means of natural points, whose coordinates are measured by expeditious
topographic survey (i.e., tape measure, manual measurement devices). In those cases when the internal
calibration parameters (focal length, principal point and lens distortion) are unknown, this step enables us
to add the calibration parameters of the camera to the equation as unknown quantities (self-calibration).
)S(Zr)S(Yr)S(Xr
)S(Zr)S(Yr)S(Xrfy)y-(y
)S(Zr)S(Yr)S(Xr
)S(Zr)S(Yr)S(Xrfxx-(x
Z33Y23X13
Z32Y22X120
Z33Y23X13
Z31Y21X110
)
(5)
where x and y are the image coordinates; X, Y, Z are the object control points coordinates from the
targets or natural points that allow the georeferencing of the scene; rij are the rotation matrix elements,
which include the rotation of the camera; SX, SY, SZ are the object coordinates of the points of view of
the camera; f is the principal distance; x0, y0 the principal point coordinates of the image; and ΔX, ΔY
the translations due to the radial and tangential distortion of the lens according to Equation (6).
2 4 6 2 2
1 2 3 1 2 1 2
2 4 6 2 2
1 2 3 1 2
2 2
2 2
p
p
xx x f x r k r k r k x r p p x y b x b y
f
yy y f y r k r k r k p x y y r p
f
(6)
This is the Fraser model [32], which takes into account additional parameters compared to the
Gaussian distortion model [33]: besides the principal distance (f) and principal point coordinates
(xp, yp), the radial distortion (k1, k2, k3) and tangential distortion (p1, p2) parameters are included.
Furthermore it considers terms for affinity (b1) and non-orthogonality (b2).
Two important considerations must be taken into account: (a) the bundle adjustment can be carried
out with or without the knowledge of the camera’s parameters. In the first case, the interior and the
lens distortion parameters are entered by their known value. In the second case, they must be
considered as unknown (self-calibration) and solved with the whole set of unknowns; (b) this is the
moment in which an absolute datum can be defined. This can be done by means of the object
coordinates of ground control points measured with any topographic method or even by means of
geometric constraints that define the 7 parameters of the coordinate frame.
2.4. Dense Model Generation
On the basis of the robust orientation of the image, a dense matching process has been developed.
Depending on the geometry of the shooting configuration, the process will use either an SGM or a
PMVS strategy by means of the projectivity Equation (7) [12]. This allows generating a dense model
capable of determining the exact 3D coordinate of the object for each pixel.
ikik SXRDCx (7)
44
Remote Sens. 2014, 6 5679
where X is the object point, x the corresponding point in the image, R the camera rotation matrix, S the
center of projection of the camera, C the internal calibration function and D the lens distortion
function; and the k and i subscripts refer to the point and the image, respectively.
The SGM process consists of minimizing an energy function (8) along the 8 basic directions of a
pixel (every 45°). This function consists of a cost function, M (pixel matching cost), which accounts
for the degree of similarity of the pixels between two images, x and x', and the inclusion of two
restrictions, P1 and P2, which account for potential gross errors in the SGM process. In addition, a
further restriction based on the epipolar geometry of photogrammetry [34] has been added to the
SGM process. This restriction allows limiting the search space for each pixel, so that the high
computational cost of generating a dense model from multiple images is reduced, thus achieving better
processing times.
x Nx Nx
xxxxx
x x
DDTPDDTPDxMDE' '
'2'1 11,)( (8)
where E(D) represents the energy function to be minimized on the basis of disparity (parallax) between
matching features; function C (pixel matching cost) evaluates the degree of similarity between pixel p
and its correspondent q by means of its disparity or parallax Dp; the terms P1 and P2 represent two
restrictions, which avoid potential gross errors in the dense matching process caused by disparities in
one or more pixels.
On the other hand, the PMVS method allows obtaining a dense model through a hierarchical and
sequential process, which includes matching, expansion and filtering. In the matching phase, the points
of interest and corners are extracted by applying the Harris [35] and the difference-of-Gaussian (DoG)
operators. Later, a multiple image matching process is carried out on the basis of the previous
extraction and the normalized cross-correction (NCC) operator [36]. After the initial matching,
expansion and filtering functions are applied, which allow extending the initial matching to the nearest
pixels, as well as detecting and deleting erroneous matches by applying visibility restrictions.
3. Results and Discussion
3.1. Context
The area of study is the region of Aliste (Zamora), with a total of 33 towns grouped into six
municipalities. The region of Aliste is located to the west of the province of Zamora (Spain), bounded
on the north by the mountain range of “La Culebra”, and adjacent to the regions of Sanabria and
La Carballeda. It is bordered to the east by the regions of “Tierras de Tábara” and “Tierras de Alba”,
and to the south by the region of Sayago. The west is adjacent to the Portuguese border, in the area
known as “la raya” (“The line”). Such a location highlights the outlying position, both geographic and
socioeconomically, which has marked the region throughout time. This area has been chosen due to its
geographical location, near the Portuguese border and the region of Sanabria, of which there are
previous similar studies. Therefore, it is possible to undertake comparative studies of the different
typologies of religious buildings. A total of 32 parish churches and five chapels have been analyzed
(Table 1).
45
Remote Sens. 2014, 6 5680
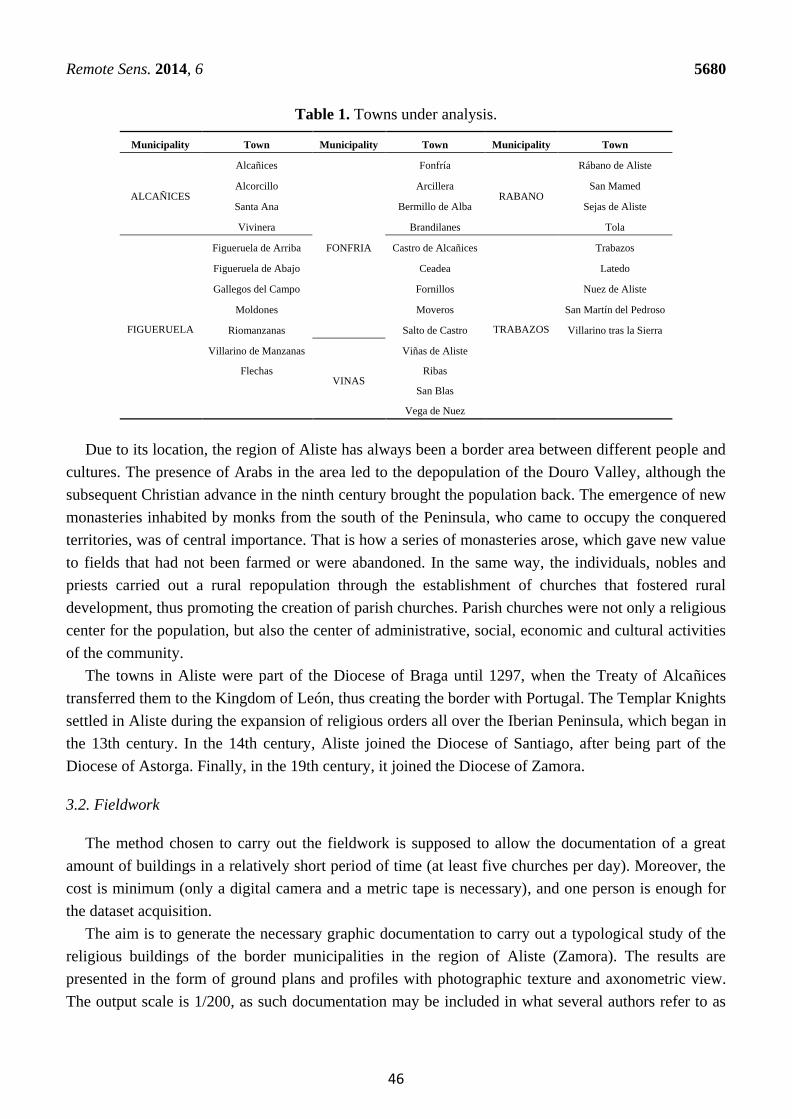
Table 1. Towns under analysis.
Municipality Town Municipality Town Municipality Town
ALCAÑICES
Alcañices
FONFRIA
Fonfría
RABANO
Rábano de Aliste
Alcorcillo Arcillera San Mamed
Santa Ana Bermillo de Alba Sejas de Aliste
Vivinera Brandilanes Tola
FIGUERUELA
Figueruela de Arriba Castro de Alcañices
TRABAZOS
Trabazos
Figueruela de Abajo Ceadea Latedo
Gallegos del Campo Fornillos Nuez de Aliste
Moldones Moveros San Martín del Pedroso
Riomanzanas Salto de Castro Villarino tras la Sierra
Villarino de Manzanas
VINAS
Viñas de Aliste
Flechas Ribas
San Blas
Vega de Nuez
Due to its location, the region of Aliste has always been a border area between different people and
cultures. The presence of Arabs in the area led to the depopulation of the Douro Valley, although the
subsequent Christian advance in the ninth century brought the population back. The emergence of new
monasteries inhabited by monks from the south of the Peninsula, who came to occupy the conquered
territories, was of central importance. That is how a series of monasteries arose, which gave new value
to fields that had not been farmed or were abandoned. In the same way, the individuals, nobles and
priests carried out a rural repopulation through the establishment of churches that fostered rural
development, thus promoting the creation of parish churches. Parish churches were not only a religious
center for the population, but also the center of administrative, social, economic and cultural activities
of the community.
The towns in Aliste were part of the Diocese of Braga until 1297, when the Treaty of Alcañices
transferred them to the Kingdom of León, thus creating the border with Portugal. The Templar Knights
settled in Aliste during the expansion of religious orders all over the Iberian Peninsula, which began in
the 13th century. In the 14th century, Aliste joined the Diocese of Santiago, after being part of the
Diocese of Astorga. Finally, in the 19th century, it joined the Diocese of Zamora.
3.2. Fieldwork
The method chosen to carry out the fieldwork is supposed to allow the documentation of a great
amount of buildings in a relatively short period of time (at least five churches per day). Moreover, the
cost is minimum (only a digital camera and a metric tape is necessary), and one person is enough for
the dataset acquisition.
The aim is to generate the necessary graphic documentation to carry out a typological study of the
religious buildings of the border municipalities in the region of Aliste (Zamora). The results are
presented in the form of ground plans and profiles with photographic texture and axonometric view.
The output scale is 1/200, as such documentation may be included in what several authors refer to as
46
Remote Sens. 2014, 6 5681
the “preliminary level of documentation” [37,38], this being the minimum scale recommended. The
scale demands a minimum accuracy of 40 mm.
The photos were taken with a reflex camera, Canon EOS 350D, set to the lowest ISO and with an
aperture in the range from ƒ/4 to ƒ/5. Moreover, the focal length, 18 mm, was fixed throughout the
shooting process. According to Equation (1), a 1/200 scale allows a maximum distance to the object of
112.5 m, which means a footprint of 138 × 92 m in every shot. Therefore, the shooting distance is
lower than the maximum recommended, thus guaranteeing a higher accuracy than the minimum
required for the 1/200 scale. However, the major problem was the width of the streets that surrounded
the churches, as they define the maximum distance allowed to take the photos, as well as the part of the
scene that can fit into every image and, therefore, the minimum number of images needed.
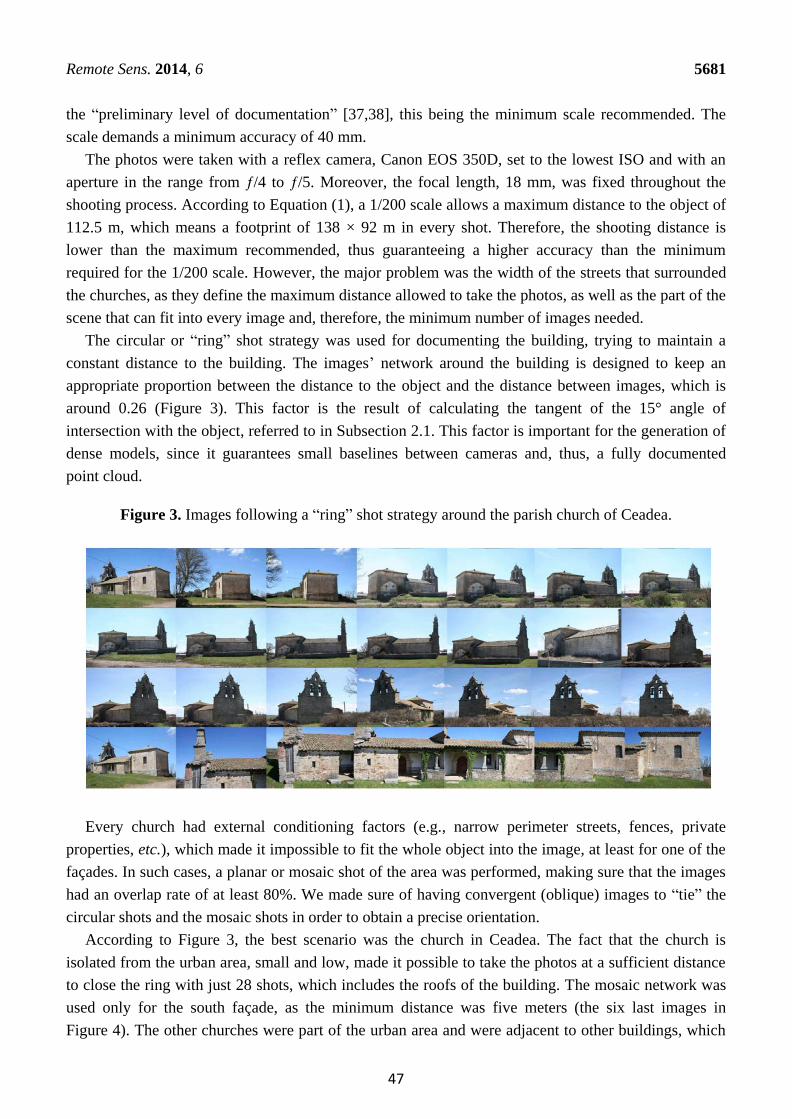
The circular or “ring” shot strategy was used for documenting the building, trying to maintain a
constant distance to the building. The images’ network around the building is designed to keep an
appropriate proportion between the distance to the object and the distance between images, which is
around 0.26 (Figure 3). This factor is the result of calculating the tangent of the 15° angle of
intersection with the object, referred to in Subsection 2.1. This factor is important for the generation of
dense models, since it guarantees small baselines between cameras and, thus, a fully documented
point cloud.
Figure 3. Images following a “ring” shot strategy around the parish church of Ceadea.
Every church had external conditioning factors (e.g., narrow perimeter streets, fences, private
properties, etc.), which made it impossible to fit the whole object into the image, at least for one of the
façades. In such cases, a planar or mosaic shot of the area was performed, making sure that the images
had an overlap rate of at least 80%. We made sure of having convergent (oblique) images to “tie” the
circular shots and the mosaic shots in order to obtain a precise orientation.
According to Figure 3, the best scenario was the church in Ceadea. The fact that the church is
isolated from the urban area, small and low, made it possible to take the photos at a sufficient distance
to close the ring with just 28 shots, which includes the roofs of the building. The mosaic network was
used only for the south façade, as the minimum distance was five meters (the six last images in
Figure 4). The other churches were part of the urban area and were adjacent to other buildings, which
47
Remote Sens. 2014, 6 5682
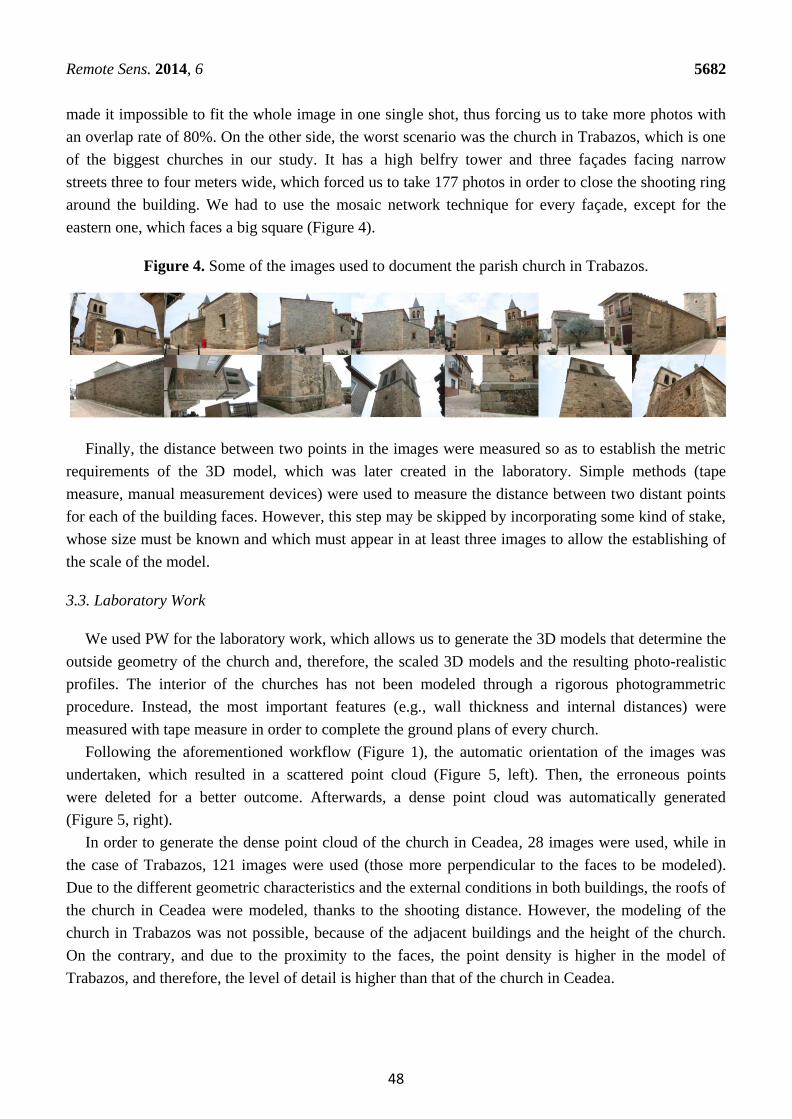
made it impossible to fit the whole image in one single shot, thus forcing us to take more photos with
an overlap rate of 80%. On the other side, the worst scenario was the church in Trabazos, which is one
of the biggest churches in our study. It has a high belfry tower and three façades facing narrow
streets three to four meters wide, which forced us to take 177 photos in order to close the shooting ring
around the building. We had to use the mosaic network technique for every façade, except for the
eastern one, which faces a big square (Figure 4).
Figure 4. Some of the images used to document the parish church in Trabazos.
Finally, the distance between two points in the images were measured so as to establish the metric
requirements of the 3D model, which was later created in the laboratory. Simple methods (tape
measure, manual measurement devices) were used to measure the distance between two distant points
for each of the building faces. However, this step may be skipped by incorporating some kind of stake,
whose size must be known and which must appear in at least three images to allow the establishing of
the scale of the model.
3.3. Laboratory Work
We used PW for the laboratory work, which allows us to generate the 3D models that determine the
outside geometry of the church and, therefore, the scaled 3D models and the resulting photo-realistic
profiles. The interior of the churches has not been modeled through a rigorous photogrammetric
procedure. Instead, the most important features (e.g., wall thickness and internal distances) were
measured with tape measure in order to complete the ground plans of every church.
Following the aforementioned workflow (Figure 1), the automatic orientation of the images was
undertaken, which resulted in a scattered point cloud (Figure 5, left). Then, the erroneous points
were deleted for a better outcome. Afterwards, a dense point cloud was automatically generated
(Figure 5, right).
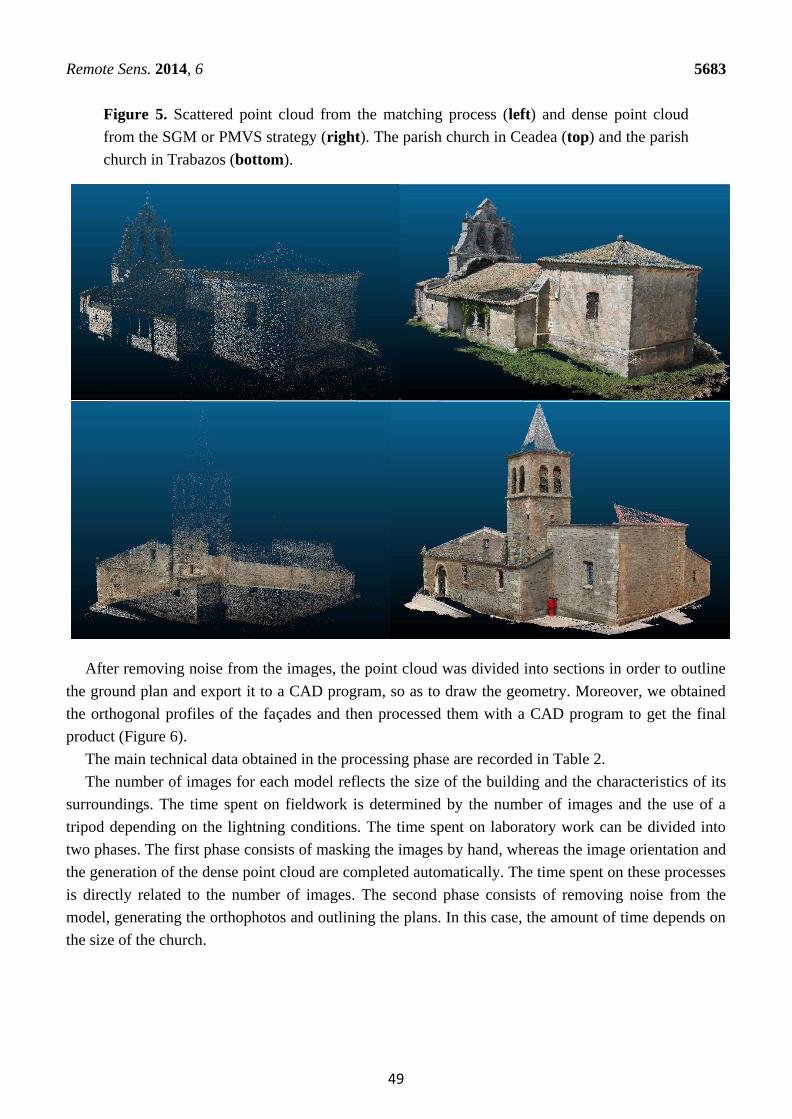
In order to generate the dense point cloud of the church in Ceadea, 28 images were used, while in
the case of Trabazos, 121 images were used (those more perpendicular to the faces to be modeled).
Due to the different geometric characteristics and the external conditions in both buildings, the roofs of
the church in Ceadea were modeled, thanks to the shooting distance. However, the modeling of the
church in Trabazos was not possible, because of the adjacent buildings and the height of the church.
On the contrary, and due to the proximity to the faces, the point density is higher in the model of
Trabazos, and therefore, the level of detail is higher than that of the church in Ceadea.
48
Remote Sens. 2014, 6 5683
Figure 5. Scattered point cloud from the matching process (left) and dense point cloud
from the SGM or PMVS strategy (right). The parish church in Ceadea (top) and the parish
church in Trabazos (bottom).
After removing noise from the images, the point cloud was divided into sections in order to outline
the ground plan and export it to a CAD program, so as to draw the geometry. Moreover, we obtained
the orthogonal profiles of the façades and then processed them with a CAD program to get the final
product (Figure 6).
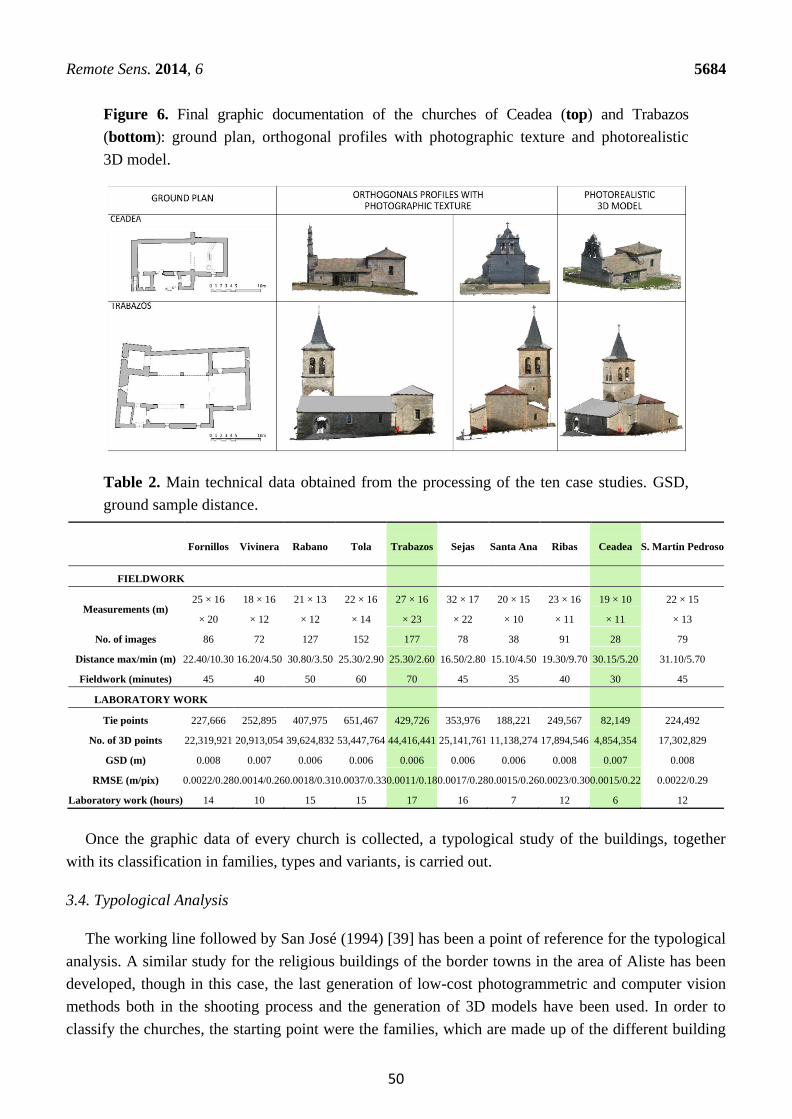
The main technical data obtained in the processing phase are recorded in Table 2.
The number of images for each model reflects the size of the building and the characteristics of its
surroundings. The time spent on fieldwork is determined by the number of images and the use of a
tripod depending on the lightning conditions. The time spent on laboratory work can be divided into
two phases. The first phase consists of masking the images by hand, whereas the image orientation and
the generation of the dense point cloud are completed automatically. The time spent on these processes
is directly related to the number of images. The second phase consists of removing noise from the
model, generating the orthophotos and outlining the plans. In this case, the amount of time depends on
the size of the church.
49
Remote Sens. 2014, 6 5684
Figure 6. Final graphic documentation of the churches of Ceadea (top) and Trabazos
(bottom): ground plan, orthogonal profiles with photographic texture and photorealistic
3D model.
Table 2. Main technical data obtained from the processing of the ten case studies. GSD,
ground sample distance.
Fornillos Vivinera Rabano Tola Trabazos Sejas Santa Ana Ribas Ceadea S. Martin Pedroso
FIELDWORK
Measurements (m) 25 × 16
× 20
18 × 16
× 12
21 × 13
× 12
22 × 16
× 14
27 × 16
× 23
32 × 17
× 22
20 × 15
× 10
23 × 16
× 11
19 × 10
× 11
22 × 15
× 13
No. of images 86 72 127 152 177 78 38 91 28 79
Distance max/min (m) 22.40/10.30 16.20/4.50 30.80/3.50 25.30/2.90 25.30/2.60 16.50/2.80 15.10/4.50 19.30/9.70 30.15/5.20 31.10/5.70
Fieldwork (minutes) 45 40 50 60 70 45 35 40 30 45
LABORATORY WORK
Tie points 227,666 252,895 407,975 651,467 429,726 353,976 188,221 249,567 82,149 224,492
No. of 3D points 22,319,921 20,913,054 39,624,832 53,447,764 44,416,441 25,141,761 11,138,274 17,894,546 4,854,354 17,302,829
GSD (m) 0.008 0.007 0.006 0.006 0.006 0.006 0.006 0.008 0.007 0.008
RMSE (m/pix) 0.0022/0.28 0.0014/0.26 0.0018/0.31 0.0037/0.33 0.0011/0.18 0.0017/0.28 0.0015/0.26 0.0023/0.30 0.0015/0.22 0.0022/0.29
Laboratory work (hours) 14 10 15 15 17 16 7 12 6 12
Once the graphic data of every church is collected, a typological study of the buildings, together
with its classification in families, types and variants, is carried out.
3.4. Typological Analysis
The working line followed by San José (1994) [39] has been a point of reference for the typological
analysis. A similar study for the religious buildings of the border towns in the area of Aliste has been
developed, though in this case, the last generation of low-cost photogrammetric and computer vision
methods both in the shooting process and the generation of 3D models have been used. In order to
classify the churches, the starting point were the families, which are made up of the different building
50
Remote Sens. 2014, 6 5685
systems, and these, in turn, divided into subsystems and variants. The study was limited to the
classification of the parish churches in the rural areas of Aliste, as they are the most numerous and
representative group.
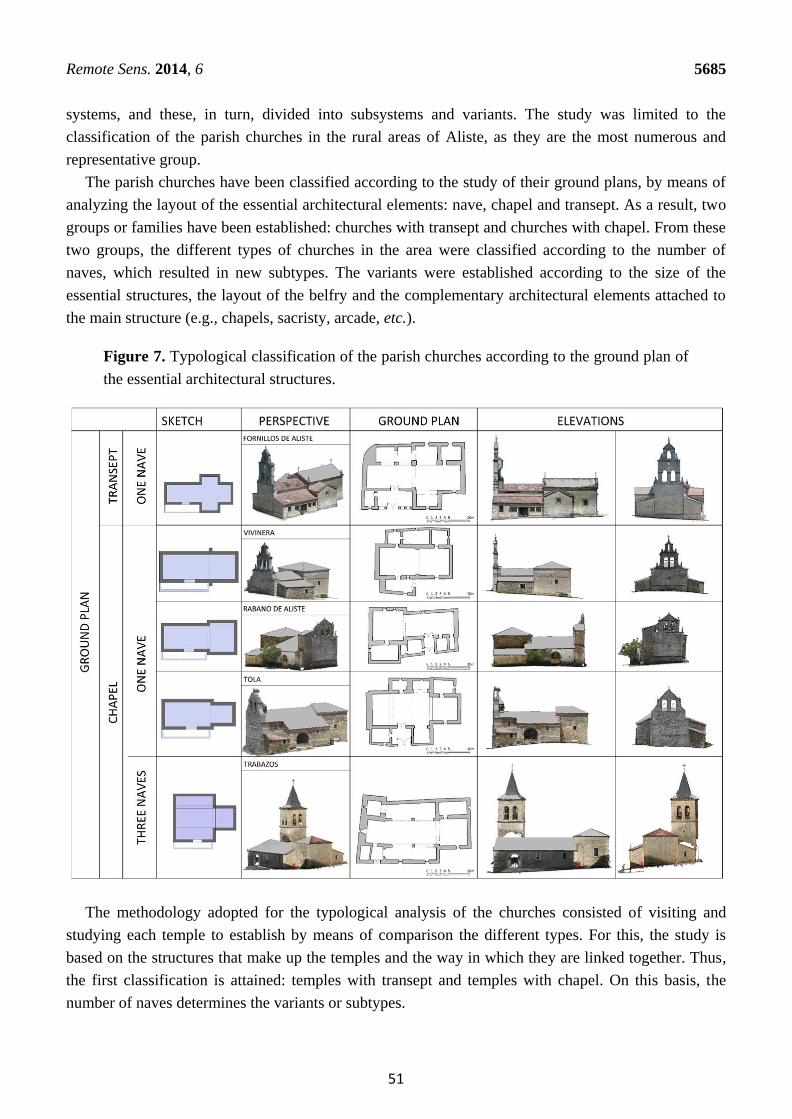
The parish churches have been classified according to the study of their ground plans, by means of
analyzing the layout of the essential architectural elements: nave, chapel and transept. As a result, two
groups or families have been established: churches with transept and churches with chapel. From these
two groups, the different types of churches in the area were classified according to the number of
naves, which resulted in new subtypes. The variants were established according to the size of the
essential structures, the layout of the belfry and the complementary architectural elements attached to
the main structure (e.g., chapels, sacristy, arcade, etc.).
Figure 7. Typological classification of the parish churches according to the ground plan of
the essential architectural structures.
The methodology adopted for the typological analysis of the churches consisted of visiting and
studying each temple to establish by means of comparison the different types. For this, the study is
based on the structures that make up the temples and the way in which they are linked together. Thus,
the first classification is attained: temples with transept and temples with chapel. On this basis, the
number of naves determines the variants or subtypes.
51
Remote Sens. 2014, 6 5686
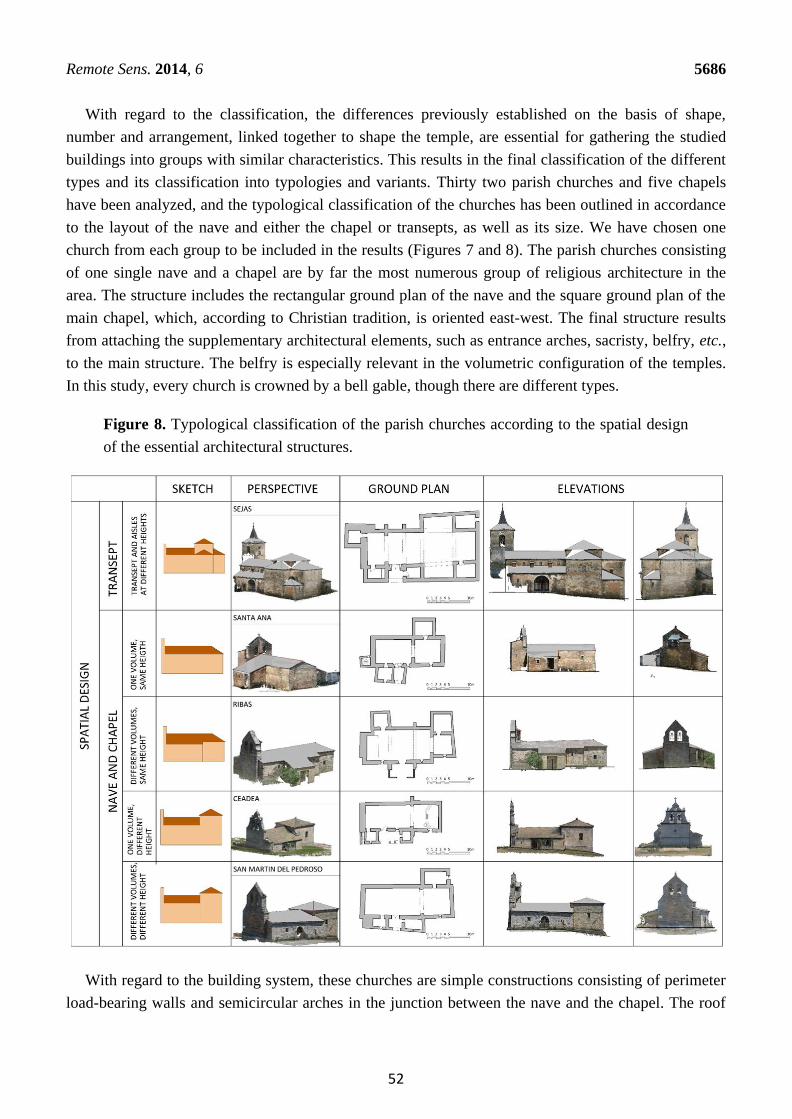
With regard to the classification, the differences previously established on the basis of shape,
number and arrangement, linked together to shape the temple, are essential for gathering the studied
buildings into groups with similar characteristics. This results in the final classification of the different
types and its classification into typologies and variants. Thirty two parish churches and five chapels
have been analyzed, and the typological classification of the churches has been outlined in accordance
to the layout of the nave and either the chapel or transepts, as well as its size. We have chosen one
church from each group to be included in the results (Figures 7 and 8). The parish churches consisting
of one single nave and a chapel are by far the most numerous group of religious architecture in the
area. The structure includes the rectangular ground plan of the nave and the square ground plan of the
main chapel, which, according to Christian tradition, is oriented east-west. The final structure results
from attaching the supplementary architectural elements, such as entrance arches, sacristy, belfry, etc.,
to the main structure. The belfry is especially relevant in the volumetric configuration of the temples.
In this study, every church is crowned by a bell gable, though there are different types.
Figure 8. Typological classification of the parish churches according to the spatial design
of the essential architectural structures.
With regard to the building system, these churches are simple constructions consisting of perimeter
load-bearing walls and semicircular arches in the junction between the nave and the chapel. The roof
52
Remote Sens. 2014, 6 5687
consists of a wood couple roof (a gabled roof in the nave and a hipped roof in the chapel) in those
cases where the chapel is higher than the nave.
The variants of this type of buildings are determined by the volumetric ratio between the nave and
the chapel (Figure 8). Therefore, there are some churches in which the nave and chapel are the same
size and height, others where the nave and the chapel have the same width, but the chapel is higher
than the nave and, finally, those where the nave and the chapel have different sizes and heights. The
most numerous group within the churches in this study belong to the latter group, thus being the
prevailing typology of religious architecture in the area. The last variation would be a church where the
chapel and the nave have a different width and height, thus creating two well-differentiated parts
within the essential spaces of the temple.
The group made up of churches with three naves and one chapel is the less numerous one. The
structure consists of two side naves attached to the main nave and chapel, which are accessed from the
central nave through semicircular arches on columns.
The parish churches of one nave and crossing are the biggest ones and are normally located in the
most populated towns.
4. Conclusions
The study shows the capacity of photogrammetric programs, which are aimed towards the full
automation of the cartographic modeling process, for the architectural interpretation of religious
buildings. By means of a relatively simple working methodology, used both in the shooting and
processing phase, accurate and high graphic quality results can be obtained. Thanks to
photogrammetric tools, the aim of creating a typological classification of the parish churches in the
region of Aliste has been made easier and is based on technical data.
The following conclusions from the present study can be drawn:
(a) The graphic quality of the models is supported basically by the point quantity, between
20 and 50 million points, which usually equals or surpasses the resolution provided by
terrestrial laser systems (TLS).
(b) Even though the data volume may seem high, the working times must be taken into account:
between 30 and 60 min of fieldwork and from 6 to 16 h of laboratory work, which, once
again, can be compared with laser scanner performance. The image capture times are lower
than those of a laser scanner (between 1/2 and 1/3 depending on the TLS performance),
whereas the laboratory work times are similar. Therefore, compared to laser scanner
technology in terms of devices availability and the difficulty of processes, photogrammetry
stands out as a more advantageous solution.
(c) The high degree of accuracy (root mean square deviation of block adjustment; the results
range from 1/4 to 1/3 of a pixel) is mainly due to the high level of redundancies (high
number of tie points), which allows the user to adjust the images accurately
(d) The high level of redundancies (tie points), between 80,000 and 650,000 with an average of
about 300,000, is due to the high number of images, between 28 and 177 with an average of
about 90. Although the number of images may seem excessive, this issue must be contrasted
to the time spent in the process.
53
Remote Sens. 2014, 6 5688
(e) The results are highly consistent with each other: RMS are always between 0.18 and
0.33 pixels or between 0.0011 and 0.0037 mm, which guarantee the quality and reliability of
the methodology chosen for the study.
(f) The different number of images needed for each church, which ranges from 28 to 177, as
stated before, depends on the surroundings of the religious building, as well as on the
possibility of fitting the whole object into the image. The size of the building is also
important, although all the different aspects do not result in relevant differences, either in
time or accuracy.
(g) With regard to the typological analysis, the approach developed improves the current
techniques for the recording of architectural cultural heritage. Moreover, the method is
suitable to carry out a typological classification study, where the reduction of image capture
times (between 1/2 and 1/3, as stated above) allows the researcher to document a great
number of buildings/architectural heritage in little time and by non-specialist staff, due to
the simplicity of the process. Besides, the high resolution of the models, with GSDs between
0.006 and 0.008 mm, indicates that the method could be used for projects that require
larger scales.
(h) These methods are appealing to architects due to their simplicity and speed. Better quality
and more robust surveys are obtained, as not only the shape of the building was accessed,
but also the information about its color and texture. The fieldwork hours are reduced with no
negative effect on accuracy, and it is easier to systematize the process, by following the
protocol set out in the present study.
With regard to future action lines, it is worth mentioning:
The aim would be to apply the methodology to other contexts and architectural typologies, in order
to compare the scope and validity of the method. This could lead to the creation of a good practices
guide to help the inexperienced user choose a line of action that optimizes the relation between
accuracy and working time.
It will be important to look at further ways of adding any type of metric constraint to the
methodology, so as to avoid manual measuring between several points of the object, thus reducing the
working times and, more importantly, reducing the potential sources of error.
Finally, the implementation of processing strategies that enable progress on the automation
of point clouds should also be undertaken, in order to facilitate the process of turning point clouds into
vector models.
Author Contributions
All authors contributed extensively to the work presented in this paper.
Conflicts of Interest
The authors declare no conflict of interest.
54
Remote Sens. 2014, 6 5689
References
1. Haala, N.; Peter, M.; Kremer, J.; Hunter, G. Mobile lidar mapping for 3D point cloud collection in
urban areas—A performance test. Int. Arch. Photogramm. Remote Sens. Spat. Inf. Sci. 2008, 37,
1119–1127.
2. Schindler, K. An overview and comparison of smooth labeling methods for land-cover
classification. IEEE Trans. Geosci. Remote Sensi. 2012, 50, 4534–4545.
3. Liu, G.-H.; Liu, X.-Y.; Feng, Q.-Y. High-accuracy three-dimensional shape acquisition of a
large-scale object from multiple uncalibrated camera views. Appl. Opt. 2011, 50, 3691–3702.
Gruen, A.; Akca, D. Mobile Photogrammetry. In Dreiländertagung SGPBF, DGPF und OVG; In
Proceedings of 2007 Wissenschaftlich-Technische Jahrestagung der DGPF, Muttenz, Basel,
19–21 June 2007; Volume 16, pp. 441–451.
4. Kraus, K. Photogrammetry. Fundamentals and Standard Processes; Dummlers Verlag: Bonn,
Germany, 1993; Volume 1.
5. Arias, P.; Caamano, J.C.; Lorenzo, H.; Armesto, J. 3D modeling and section properties of ancient
irregular timber structures by means of digital photogrammetry. MICE Comput.-Aided Civ.
Infrastruct. Eng. 2007, 22, 597–611.
6. Lorenzo, H.; Arias, P. A methodology for rapid archaeological site documentation using
ground-penetrating radar and terrestrial photogrammetry. Geoarchaeology 2005, 20, 521–535.
7. Arias, P.; Armesto, J.; Vallejo, J.; Lorenzo, H. Close range digital photogrammetry and software
application development for planar patterns computation. Dyna 2009, 76, 7–15.
8. Robertson, D.P.; Cipolla, R. Structure from Motion. In Practical Image Processing and Computer
Vision; John Wiley: Hoboken, NJ, USA, 2009; p. 49.
9. Quan, L. Image-Based Modeling; Springer: New York, NY, USA, 2010.
10. Szeliski, R. Computer Vision: Algorithms and Applications; Springer: New York, NY, USA,
2011; p. 824.
11. Hartley, R.; Zisserman, A. Multiple View Geometry in Computer Vision; Cambridge University
Press: Cambridge, UK, 2000.
12. Hirschmüller, H. Accurate and Efficient Stereo Processing by Semi-Global Matching and Mutual
Information. In Proceedings of the 2005 IEEE Computer Society Conference on Computer Vision
and Pattern Recognition, San Diego, CA, USA, 20–25 June 2005.
13. Deseilligny, M.P.; Clery, I. Apero, an Open Source Bundle Adjusment Software for Automatic
Calibration and Orientation of Set of Images. In Proceedings of the 2011 ISPRS Commission V
Symposium, Image Engineering and Vision Metrology, Trento, Italy, 2–4 March 2011;
Volume XXXVIII-5/W16; pp. 269–276.
14. Habbecke, M.; Kobbelt, L. Iterative Multi-View Plane Fitting. In Proceedings of the
2006 International Fall Work-Shop Vision, Modeling, and Visualization. Aachen, Germany,
22–24 November 2006; pp. 73–80.
15. Seitz, S.M.; Curless, B.; Diebel, J.; Scharstein, D.; Szeliski, R. A Comparison and Evaluation of
Multi-View Stereo Reconstruction Algorithms. In Proceedings of the 2006 IEEE Computer
Society Conference on Computer Vision and Pattern Recognition, Washington, DC, USA, 17–22
June 2006; Volume 1, pp. 519–528.
55
Remote Sens. 2014, 6 5690
16. Furukawa, Y.; Ponce, J. Accurate, dense, and robust multiview stereopsis. IEEE Trans. Pattern
Anal. Mach. Intell. 2010, 32, 1362–1376.
17. Waldhäusl, P.; Ogleby, C. 3 × 3 rules for simple photogrammetric documentation of architecture.
Int. Arch. Photogramm. Remote Sens. 1994, 30, 426–429.
18. Patias, P.; Santana Quintero, M. Introduction to Heritage Documentation. In CIPA
Heritage Documentation Best Practices and Applications; Stylianidis, E., Patias, P.,
Santana Quintero, M., Eds.; The ICOMOS & ISPRS Committee for Documentation of Cultural
Heritage: Athens, Greece, 2011; Volume XXXVIII-5/C19, pp. 9–13.
19. Joglekar, J.; Gedam, S.S. Area based image matching methods—A survey. Int. J. Emerg. Technol.
Adv. Eng. 2012, 2, 130–136.
20. Gruen, A. Adaptive least squares correlation: A powerful image matching technique. S. Afr. J.
Photogramm. Remote Sens. Cartogr. 1985, 14, 175–187.
21. Smith, S.M.; Brady, J.M. Susan—A new approach to low level image processing. Int. J. Comput.
Vis. 1997, 23, 45–78.
22. Lowe, D.G. Object Recognition from Local Scale-Invariant Features. In Proceedings of the 1999
IEEE International Conference on Computer Vision, Kerkyra, Greece, 20–27 September 1999;
Volume 2, pp. 1150–1157.
23. Matas, J.; Chum, O.; Urban, M.; Pajdla, T. Robust Wide Baseline Stereo from Maximally Stable
Extremal Regions. In Procceding of the 2002 British Machine Vision Conference, Citeseer,
Cardiff, UK, 2–5 September 2002; pp. 384–393.
24. Bay, H.; Ess, A.; Tuytelaars, T.; van Gool, L. Speeded-up robust features (surf). Comput. Vis.
Image Underst. 2008, 110, 346–359.
25. Morel, J.-M.; Yu, G. Asift: A new framework for fully affine invariant image comparison.
SIAM J. Imaging Sci. 2009, 2, 438–469.
26. Lowe, D.G. Distinctive image features from scale-invariant keypoints. Int. J. Comput. Vis. 2004,
60, 91–110.
27. Moisan, L.; Stival, B. A probabilistic criterion to detect rigid point matches between two images
and estimate the fundamental matrix. Int. J. Comput. Vis. 2004, 57, 201–218.
28. Fischler, M.A.; Bolles, R.C. Random sample consensus: A paradigm for model fitting with
applications to image analysis and automated cartography. Commun. ACM 1981, 24, 381–395.
29. Longuet-Higgins, H.C. A computer algorithm for reconstructing a scene from two projections.
Nature 1981, 293, 133–135.
30. Horn, B.K.P. Recovering baseline and orientation from essential matrix. J. Opt. Soc. Am. 1990,
1–10.
31. Fraser, C.S.; Shortis, M.R.; Ganci, G. Sensor and System Calibration. In Multisensor System
Self-Calibration; Society of Photo-Optical Instrumentation Engineers (SPIE): Philadelphia, PA,
USA, 1995; pp. 2–18.
32. Brown, D. Close-range camera calibration. Photogramm. Eng. 1971, 37, 855–866.
33. Luhmann, T.; Robson, S.; Kyle, S.; Harley, I. Close Range Photogrammetry: Principles, Methods
and Applications; Whittles: Dunbeath, UK, 2007; p. 528.
34. Harris, C.; Stephens, M. A Combined Corner and Edge Detector. In The Fourth Alvey Vision
Conference; University of Sheffield Printing Office: Manchester, UK, 1988; pp. 147–151.
56
Remote Sens. 2014, 6 5691
35. González, R.C.; Woods, R.E. Digital Image Processing, 3rd ed.; Addison-Wesley: Massachusetts,
MA, USA, 1992.
36. Almagro Gorbea, A. Levantamiento Arquitectónico; Universidad de Granada: Granada,
Spain, 2004.
37. Letellier, R.; Schmid, W.; LeBlanc, F.; Eppich, R.; Chabbi, A. Recording, Documentation, and
Information Management for the Conservation of Heritage Places: Guiding Principles;
Getty Conservation Institute: Los Angeles, CA, USA, 2007.
38. San José Alonso, J.I. Arquitectura Religiosa en Sanabria: Sus Espacios, Organizaciones y
Tipologías; Instituto de Estudios Zamoranos Florián de Ocampo: Zamora, Spain, 1994.
© 2014 by the authors; licensee MDPI, Basel, Switzerland. This article is an open access article
distributed under the terms and conditions of the Creative Commons Attribution license
(http://creativecommons.org/licenses/by/3.0/).
57