does design-build (db) outperform construction …
TRANSCRIPT
DOES DESIGN-BUILD (DB) OUTPERFORM CONSTRUCTION
MANAGEMENT AT RISK (CMAR)? A COST AND SCHEDULE
COMPARATIVE STUDY OF DB PROJECTS AND CMAR PROJECTS
Min Ma1, José L. Fernández-Solís, Ph. D
1, Jing Du, Ph. D
2
1Master’s Student of Construction Management, Department of Construction Science,
Texas A&M University, 400 Bizzell St., College Station, TX77843, USA; Email:
1Associate Instructional Professor, Department of Construction Science, Texas A&M
University, 400 Bizzell St., College Station, TX77843, USA
2Assistant Professor, Department of Construction Science, Texas A&M University, 400
Bizzell St., College Station, TX77843, USA
ABSTRACT
Design-Build (DB) and Construction Management at Risk (CMAR) are two
widely used alternative project delivery systems in the construction industry. Previous
studies have found inconclusive results on which of the two has better cost and schedule
performances when applied in construction projects. This study chose unit cost, change
order factor, cost growth, schedule growth, and construction intensity as the metrics to
measure the cost and schedule performance of both DB projects and CMAR projects.
Two statistical analysis tools, Analysis of Variance and Wilcoxon Signed Rank Test,
were applied to see if there is any difference between the two project delivery systems’
means of the five measurements. The test results were used to determine which project
delivery system has better performance in the real world. The results showed that
Design-Build is superior to Construction Management at Risk in construction intensity,
while Construction Management at Risk has better performance on the change order,
cost growth, and schedule growth. And there is no difference in unit cost.
KEY WORDS: Design Build, Project Management at Risk, Cost and Schedule, Case
studies

INTRODUCTION
According to the definition of Associated General Contractors (AGC) (2004),
Project Delivery Systems/Methods/Methodologies (PDS) is “the comprehensive process
of assigning the contractual responsibilities for designing and constructing a project. A
delivery method identifies the primary parties taking contractual responsibility for the
performance of the work.” In other words, it is a process by which the construction will
be designed and constructed (Francom et al. 2014). Thomsen (2006) believed that
relationships among various parties are also part of a project delivery system how to
define responsibility is crucial in PDS. In the construction industry, choosing a proper
delivery system is critical to the success of a construction project. Researchers and
practitioners in the Architecture Engineering Construction industry believe that different
PDS have a direct effect on different project management performances.
Design-Bid-Build
Design-Bid-Build (DBB) is the traditional project delivery method and has been
widely used in the past decades. In a project that uses DBB, the owner first chooses two
independent entities, the architect and the general contractor (GC), to perform design
and construction work in a separate way. DBB causes project management problems like
overrun change orders, budget overages, and schedules delays (Shakya 2013; Francom et
al. 2014). In such background, the Alternative Project Delivery Systems/Methods
(APDM) have become more popular and gained more attention in the Architecture
Engineering Construction industry (Francom et al. 2014).
Alternative Project Delivery Methods/Systems
Alternative Project Delivery Methods/Systems include Design-Build (DB),
Construction Management at Risk (CMAR) or Construction Management/General
Contractor (CM/GC), Integrated Project Delivery (IPD), Competitive Sealed Proposal
(CSP), Engineer Procure Construct (EPC) and others (Francom et al. 2014; Kulkarni et
al. 2012); DB and CMAR are the most recognized and utilized methods among all
APDM. DB refers to the delivery system where owners choose one entity to be
responsible for both design and construction work; the entity usually gets involved after
“the performance requirements are defined” by owners (Ghavamifar and Touran 2008).
In CMAR, the project delivery procedures and responsible entities are almost the same
as DBB, except general contractors will be chosen before the construction phase. They
get involved in the early design phase and provide construction management services to
the architects and help reduce design deficiencies.
APDM vs. DBB
Previous researchers and studies claimed that Alternative Project Delivery
Systems outperform the traditional Design Bid Build. APDM has advantages on
integration, collaboration, improved cost and schedule performance, and facilities
qualities in both vertical and horizontal construction projects (Rojas and Kell 2008;
Shakya 2013; Konchar and Sanvido 1998; Francom et al. 2014; Kulkarni et al. 2012). In
a study conducted by Fernane (2011), a lower contract award cost growth and total cost
growth were found in DB projects compared with DBB projects. Shrestha and Fernane
(2016) used Analysis of Variance (ANOVA) to compare DB projects with DBB projects
and found the same conclusion as Fernane (2011). Studies by Alternative (1999) and
Adams (2003) claimed similar cost savings benefits of DB projects.” Francom (2015)
concluded that CMAR has a better baseline of performance on cost and scheduling
compared with DBB.
On the other hand, Minchin Jr. et al. (2013) used statistical methods including
Student’s t-test and nonparametric Mann-Whitney U test to compare the cost and
schedule performance of DB projects and DBB projects. According to their research,
DBB projects outperformed DB projects in cost management, and there was no
significant difference in schedule performance was found. Carpenter and Bausman
(2016) also found that the satisfaction level of the quality of buildings and services were
almost the same between DBB projects and CMAR projects, although CMAR projects
were said to be more effective at schedule management and cost control. Another study
conducted by Ibbs et al. (2003) showed that using DB as a project delivery method
might bring timesaving benefits, but with regard to cost savings and higher productivity,
there was no significant difference always between DB projects and DBB projects (Ibbs
et al. 2003).

REVIEW OF LITERATURE
Col Debella and Ries (2006) performed a comparative study on projects that used
Multiple Prime with Agent (MPwA), Multiple Prime (MP), and Single Prime (SP). In
this study, the researchers found that there were no significant differences in cost growth
nor change orders between MP and SP; SP brought advantages in litigation. The
schedule differences of the three project delivery systems could not be studied due to the
data limitations.
Konchar and Sanvido (1998) collected data about 351 projects using project
delivery systems including DB, DBB, and CMAR, by sending out surveys. The purpose
of their study was to compare the costs, schedule, and quality performance in
construction projects using different project delivery systems. They performed both
univariate analysis including two-sample t-test and Mood’s median tests and
multivariate analysis like linear regression models. According to the result of their
statistical analysis, DB was the best among the three project delivery systems. CMAR
outperformed DBB in terms of unit cost, construction speed, delivery speed, cost
growth, and schedule growth. DBB projects had the worst performance among the three.
The study Konchar and Sanvido (1998) conducted opened the door of
comparison studies between DB and CMAR delivery systems. Their study is also the
most comprehensive one in terms of the sample size. Almost every later research
targeting similar topics cited their work and compared findings with the conclusion of
Konchar and Sanvido (1998). However, William (2003) identified the following
weaknesses in the work of Konchar and Sanvido (1998):
1) The study did not find any statistically significant difference between cost
and schedule growth;
2) The study did not take the variance of the data sample into account;
3) The comparisons on construction speed and delivery speed are meaningless
because of the different inherent characteristics of each project delivery
system: “The comparison is akin to comparing marathon runners against
milers and then both against sprinters on the basis of how long their races
take to run and finding sprinters superior because they finish in a shorter
amount of time than either milers or marathoners!” (William, 2003);
4) The measurements that Konchar and Sanvido (1998) used to quantify
“quality” are subjective and not reliable.
With the help of R-language, Charoenphol et al. (2016) were able to evaluate the
cost performance of DB, DBB, and CMAR delivery systems at the confidence level of
95%. They collected data from construction projects that were completed from
01/01/2008 to 07/01/2015 in the horizontal construction industry of Utah. By using
ANOVA and planned contrast statistical methodology, they concluded that DBB
outperformed CMAR and DB (CMAR outperformed DB) in cost growth factor and
change order cost factor, which is contrary to the conclusion of Konchar and Sanvido
(1998).

Maharjan (2013) sent a survey collecting data about the satisfaction level of
owners in water and waste projects (35% of 455 participants responded). In a later study
of the same questionnaire, Shrestha et al. (2014) found out that although DB was
believed to have advantages on schedule growth, cost growth, and cost saving, no
statistical significance was found. On the other hand, the overall satisfaction level of
owners was significantly higher in projects using DB than ones using CMAR.
Shakya (2013) designed a performance comparison study of DB and CMAR in
highway projects using data from the Department of Transportation in California,
Colorado, Connecticut, Florida, Idaho, Kentucky, Louisiana, Maine, Michigan,
Minnesota, Montana, Nevada, Ohio, Oregon, South Carolina, and Utah. By performing
One-Way ANOVA test, DB was found to be more efficient in contract award cost
growth and total cost growth than CMAR; no statistical significance was found in
change order cost factor and construction intensity.
Korkmaz et al. (2010) used univariate analysis (One-Way ANOVA and regress
analysis) and concluded that CMAR and DB outperformed DBB in delivery speed; no
comparison study was done between CMAR projects and DB projects.

PROBLEM STATEMENT
Although many efforts have been put into the area of comparing traditional
Design-Bid-Build with new Alternative Project Delivery Systems, little research has
been done in comparing different Alternative Project Delivery Systems. The differences
between various Alternative Project Delivery Systems have not been fully studied and
understood. First, previous studies on CMAR and DB show conflicting conclusions.
Some studies claimed that CMAR outperformed DB (Charoenphol et al. 2016). Some
concluded that DB is better than CMAR on project cost and schedule performances
(Konchar and Sanvido 1998). Second, among the previous studies, most of them reached
convincing conclusions on the comparison of cost performance of various project
delivery systems; however, their study on schedule differences suffered from data and
methodology limitations. Therefore, this study plans to perform a comparison study
between DB projects and CMAR projects using statistical analysis methods. The
research goal is to find out if there is any statistically significant difference in the cost
and schedule performance of DB projects and CMAR projects and then compare the
results with previous studies.
METHODOLOGY
Data
The purpose of this study is to find out which project delivery system, Design-
Build (DB) or Construction Management at Risk (CMAR), has better cost and schedule
performance. The study used data provided by Dr. José L. Fernández-Solís. The dataset
includes the actual and planned unit cost, actual total costs, total gross square feet (GSF),
and actual and planned total duration of 73 commercial buildings built in Texas between
2000-2017. To minimize the influence of time value and inflation on project costs, the
study adjusted all costs and used their present value in 2016 for future statistical
analysis. The time value adjustment tool was provided by a Master’s student, Daniel
Wheeler (B. S. Agribusiness Finance, Texas A&M University). As all 73 projects were
built in Texas, no location adjustment was needed.
Among the 73 projects, 16 of them used Design-Build as their delivery system
and 57 projects used Construction Management at Risk. The sample projects used both
Guaranteed Maximum Price (GMP) contracts and Competitive Sealed Proposal (CSV)
contracts. 39 projects used CSP contracts and 34 used GMP contracts. The
documentation and calculation of the 73 sample projects were carefully checked. Project
No. 42 was found out to have been documented incorrectly and was excluded. The final
sample dataset of this study consisted of 72 projects, 15 of which used DB and 57 of
which used CMAR. The study divided them into three groups using both PDS types and
Contract types. The three sample groups are projects using DB and CSV (Group
DBCSV), projects using CMAR and CSV (Group CMARCSV), and projects using
CMAR and GMP (Group CMARGMP).
Measurements
The measurements used to evaluate project cost and schedule performance in this
study are the following:
Unit Cost = Actual Total Project Cost / Gross Square Feet (Konchar and Sanvido 1998) (1)
Construction Change Order Amount = Actual Total Project Cost - Projected Total Project Cost
(Construction Industry Institute[CII] n.d.; Charoenphol et al. 2016; Konchar and Sanvido 1998) (2) Project Cost Growth = Construction Change Order Amount / Projected Total Project Cost (CII n.d.;
Charoenphol et al. 2016; Konchar and Sanvido 1998) (3) Change Order Factor = Construction Change Order Amount / Actual Total Project Cost (CII n.d.;
Charoenphol et al. 2016; Konchar & Sanvido 1998) (4)
Project Schedule Growth = (Actual Total Project Duration – Initial Predicted Project Duration) / Initial
Predicted Project Duration (CII n. d.) (5) Construction intensity (SF/day/1000) = Total Square Feet of Building / Final Design and Construction
Duration/1000 (Engineering News Record 2015) (6) Unit Cost (1), Project Cost Growth (3), and Change Order Factor (4) will be used
to measure the cost performance of project delivery systems. The sample projects have
various sizes and were built to fulfill different functions, making it meaningless to
directly compare total costs among various projects. To minimize the influence on the
final conclusion, the Unit Cost (1) is used instead of total costs to measure the cost
performance of PDS. Project Cost Growth (3) and Change Order factor (4) are
performance metrics that evaluate the cost control management. Cost Growth factor (4)
tells how fast and how much actual project costs are growing above planned projected
costs. Change Order factor (3) shows how much change orders affect the total project
costs (Charoenphol et al. 2016). Similarly, projects that used fast-tracking construction
methods could achieve shorter durations in a similar situation. To minimize the effect of
other factors when testing the efficiency of the DB and CMAR in schedule control
management, this study will use project Schedule Growth (5) and Construction Intensity
(6) instead of actual durations as the measurements of project schedule performance. For
metric (1) & (2), there is no conclusion on when higher or lower numbers are better; for
metric (3)-(5), the lower calculation results represent a better performance than higher
ones; for metric (6), the higher values are preferred.
Statistics and Statistical Tests
The ideal statistic should be the one which is able to reflect the “typical value” of
a population. Then the study could compare the typical values of DB projects and
CAMR projects and analyze the typical differences between the two groups. Mean and
Median are both commonly-used statistics for representing typical value. They are both
good indicators of the location of a typical value in a population. Using Mean as the
statistic will compromise the conclusions from the effects of wild outliers. However,
Median as a statistic does not hold or reflect the attributes of a group; it only indicates
the typical location of a typical value. Lehmann (1997) also pointed out that “the mean
value provides a moderately better estimate of the central value than the median for the
case of a Gaussian.” As the author would test the normality of data and make the data
obey normal distribution by taking the logarithms to achieve more confidence in the
conclusion, Mean is more proper for this study. For these two reasons, the author chose
to use Mean instead of Median as the statistic in this study.
The author used Analysis of Variance (ANOVA) to analyze the group means of
five metrics. ANOVA is a statistical tool that tests if there are any significant differences
among different group means. First, the values of the five chosen measurements of 72
projects were calculated independently. The second step was to preprocess the data,
calculate the values of five metrics, and test if the calculation results of metrics roughly
obeyed the normal distribution; if not, the author took their logarithms and tested for
normality. If the logarithms obeyed normal distributions, the study used the logarithms
in the next steps. Third, the study used ANOVA to test if there was a statistically
significant difference between the means of five metrics of DB projects and CMAR
projects. Wilcoxon Signed Rank Test was also performed to check if the results of
ANOVA were reliable. In the second phase is was to compare the results with the
conclusions of previous studies.

NORMAL DISTRIBUTION
To use ANOVA, the data must meet the three requirements: independence of
observations, normality, and equal variance. First, it is obvious that the sample projects
are independent of each other: knowing the variables of one project does not necessarily
predict any information about other projects. So the independence assumption is
satisfied. This study used the Normal Quantile Plot in JMP to test if the data obey the
normal distribution. The results show that the distribution of three groups’ change order
factor, cost growth, and project schedule growth value could be assumed as normal;
construction intensity and unit cost were skewed, necessitating the author used their
logarithms to perform the test again. The second test showed normality for construction
intensity and unit cost. The study thus used the logarithms of unit cost and construction
intensity in further analysis. The original Normal Quantile Plots of unit cost and
construction intensity are included in Appendix B. The final Normal Quantile Plots of
five measurements by three groups are shown below:
Figure 1 Normal Quantile Plots of Log (Unit Cost)
Figure 2 Normal Quantile Plots of Change Order

Figure 3 Normal Quantile Plots of Cost Growth
Figure 4 Normal Quantile Plots of Project Schedule Growth
Figure 5 Normal Quantile Plots of Log (Construction Intensity)

SUMMARY
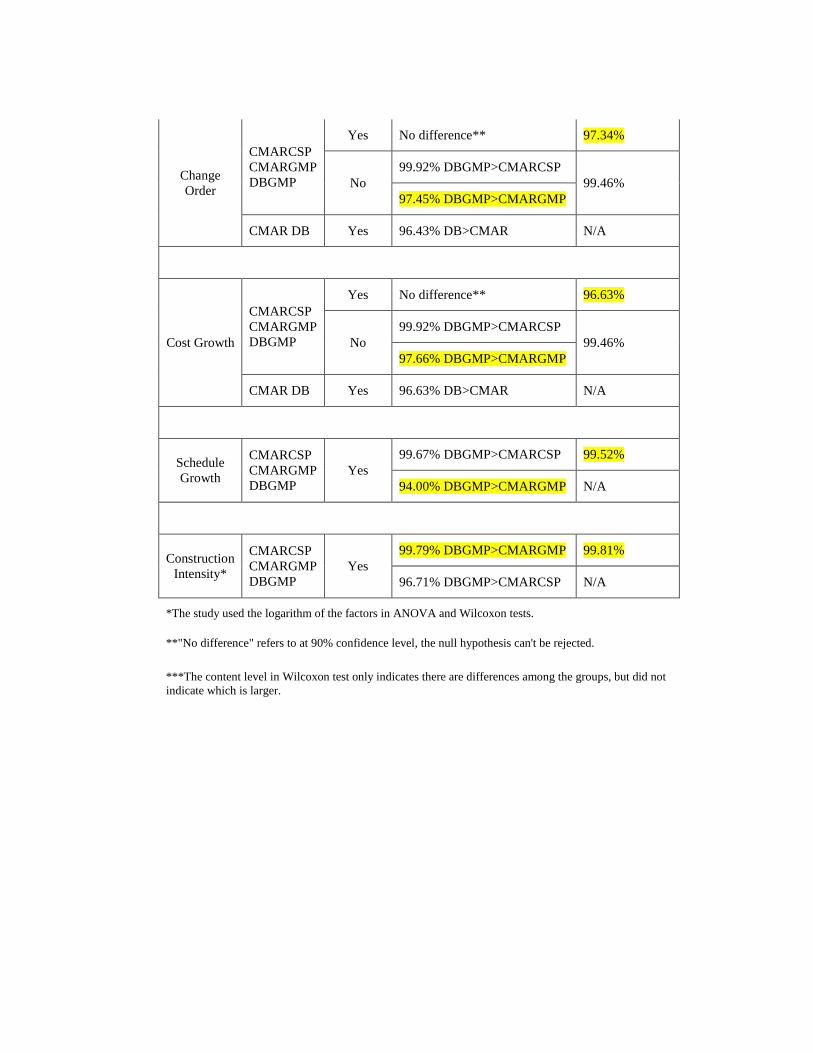
A summary table of the ANOVA and Wilcoxon Signed Rank Test results is
presented in Table 1. It is clear that no matter what kind of tests are applied, including
outliers or not, how the samples are grouped, there is no significant difference between
the unit cost of DB projects and CMAR projects.
At 94% and 96% confidence level, the schedule growth factor and construction
intensity of DB projects are larger than CMAR projects when using the same type of
contracts, which indicates the possibility that CMAR projects perform better in schedule
growth control and DB projects perform better at construction intensity; at more than 99%
confident level, the schedule growth factor and construction intensity of DB projects is
larger than CMAR projects when using different types of contracts, but such differences
are not necessarily caused by PDS. The test results of the Wilcoxon Signed Rank Test on
schedule growth and construction intensity support the same conclusions.
There is no significant difference in the means of change order factor and cost
growth factor between CMAR and DB projects when they used different types of
contracts and when the outliers are included. However, when the outliers are excluded,
the test results show that at more than 97% confidence level, both change order factors
and cost growth factors of DB projects are larger than CMAR projects when using the
same type of contracts, which indicates the possibility that CMAR performs better in
change order control and cost growth control; at more than 99% confidence level, the
change order factor and cost growth factor of DB projects are larger than CMAR when
using different types of contracts, although such difference may not be purely caused by
PDS types. The Wilcoxon test results indicate that at more than 97% confidence level,
there are differences among the means of change order factors and cost growth of the
three groups. Since the Wilcoxon Signed Rank Test minimizes the effect of outliers, the
Wilcoxon test results in this study can be viewed as the evidence that the previous
conclusions regarding DB and CMAR without outliers are reasonable.
Table 1 Summary of ANOVA & Wilcoxon Tests Results
Factor Grouping Include
Outliers? ANOVA Wilcoxon***
Unit Cost*
CMARCSP
CMARGMP
DBGMP
Yes No difference** No difference**
No No difference** No difference**
CMAR DB Yes No difference** No difference**
Change
Order
CMARCSP
CMARGMP
DBGMP
Yes No difference** 97.34%
No
99.92% DBGMP>CMARCSP
99.46%
97.45% DBGMP>CMARGMP
CMAR DB Yes 96.43% DB>CMAR N/A
Cost Growth
CMARCSP
CMARGMP
DBGMP
Yes No difference** 96.63%
No
99.92% DBGMP>CMARCSP
99.46%
97.66% DBGMP>CMARGMP
CMAR DB Yes 96.63% DB>CMAR N/A
Schedule
Growth
CMARCSP
CMARGMP
DBGMP
Yes
99.67% DBGMP>CMARCSP 99.52%
94.00% DBGMP>CMARGMP N/A
Construction
Intensity*
CMARCSP
CMARGMP
DBGMP
Yes
99.79% DBGMP>CMARGMP 99.81%
96.71% DBGMP>CMARCSP N/A
*The study used the logarithm of the factors in ANOVA and Wilcoxon tests.
**"No difference" refers to at 90% confidence level, the null hypothesis can't be rejected.
***The content level in Wilcoxon test only indicates there are differences among the groups, but did not
indicate which is larger.

COMPARISON
Table 2 shows the comparison of the conclusions of this study and previous
studies. This study found that there is no significant difference between unit costs of DB
projects and CMAR projects, while Konchar and Sanvido (1998) claimed that the unit
costs of DB projects are actually smaller than CMAR projects.
When the outliers in the dataset were excluded, this study showed that the
CMAR projects have better performance on change order and cost growth management,
which is the same as the conclusions of Charoenphol et al. (2016); Shakya (2013)
claimed that there is no difference in the two factors (change order and cost growth)
between DB projects and CMAR projects; Konchar and Sanvido (1998) concluded that
DB projects have a better performance on cost growth factors while Korkmaz et al.
(2010) and Maharjan (2013) did not find a difference.
Both this study and the study of Konchar and Sanvido (1998) found that DB
projects have a better performance on construction intensity, while no significant
difference was found in the studies by Kormaz et al. (2010) and Shakya (2013).
This study’s conclusion is contradicted with previous studies’ conclusions on
schedule growth factors: Konchar and Sanvido (1998) concluded that DB projects did
better on schedule growth management while the test results of this study show that
CMAR projects did better. However, no difference was found in the study of Maharjan
(2013).
This study reached conclusions that conflict with those of previous studies. One
important reason is that the sample projects used are from different sectors. This study
used commercial building projects, and previous researchers used projects from
wastewater, transportation, and other sectors. In fact, this study has different conclusions
with previous studies might indicate that one type of project delivery system could be
more efficient in one sector than the others.
Another reason is that this study divided projects into groups by the contract type
and the project delivery systems type. If the sample projects in previous studies used
different contract types, the conclusions would be different.
Finally, all of the sample projects used in this study were built in Texas, while
previous studies used sample projects located across the United States. Different
locations and built years would affect the final conclusions.

Table 2 Comparison of Results with Previous Studies
Authors Method Compared Factors Conclusion*
Charoenphol, D., Stuban, S.
M., & Dever, J. R. (2016). ANOVA Cost Growth & Change Order CMAR>DB
Shrestha, P. P., Maharjan, R.,
Shakya, B., & Batista, J.
(2014).
Survey Satisfaction Level of Owners DB>CMAR
Shakya, B. (2013). ANOVA
Contract Award Cost Growth DB>CMAR
Total cost growth No Difference
Change Order &Construction Intensity No Difference
Maharjan, R. (2013). Survey
Schedule Growth & Cost Growth No Difference
Satisfaction level No Difference
Konchar, M., & Sanvido, V.
(1998).
ANOVA;
Liner
Regression
Models
Unit Cost DB>CMAR
Construction speed DB>CMAR
Delivery speed DB>CMAR
Cost growth DB>CMAR
Schedule Growth DB>CMAR
Korkmaz, S., Riley, D., &
Horman, M. (2010).
Multivariate
Analysis Delivery Speed No Difference
This Study
ANOVA&
Wilcoxon
Test
Unit Cost No Difference
Construction Intensity DB>CMAR
Schedule Growth CMAR>DB
Change Order &Cost Growth
CMAR>DB
without
outliers
* ">"means the previous one is better than the latter one

LIMITATIONS & ASSUMPTIONS
The conclusions of this study suffer from the following limitations:
a. The sample size is relatively small, the conclusions may not convincingly reflect
the attributes of the true populations.
b. Technically, every project is unique and has its own characteristics, making it
difficult, if not impossible, to ensure all the other variables remain the same. This
leads to the second limitation of this study;
c. The way the sample projects were not randomly selected.
d. The chosen measurements have their own deficiencies and sometimes fail to
accurately measure the cost and schedule performance of construction projects.
e. The deficiencies of the chosen economic methods used to adjust costs value from
various years to the same year would affect the final conclusions;
f. There is more than one factor affecting owners’ decisions when choosing the
project delivery systems for construction projects. The owners may choose to use
one particular project delivery system because they think this PDS is effective in
controlling change order amounts or schedule baseline. In other words, PDS in a
construction project is correlated with other variables, including cost, schedule,
project size, and other. When multiple independent variables exist and correlated,
the test results of univariate analysis would not be as convincing. The
conclusions of this study would be more convincing if Multivariate Analysis
Methods were applied to analyze the importance of the correlated variables in
this study in predicting the dependent variables (Abdi 2003). However, because
of the lack of data, the study could not perform such tests.

CONCLUSION
This work designed a comparative study in the cost and schedule performances
of DB projects and CMAR projects. Unit Cost, Change Order, Cost Growth, Schedule
Growth, and Construction Intensity are five metrics used to evaluate the projects’ cost
and schedule performances. With the help of ANOVA and Wilcoxon Signed Rank Test,
the author was able to find that CMAR projects may perform better on schedule and cost
while DB projects have advantages on construction intensity in the real world.
The future work could be done in the following areas:
a. The conclusions are only made toward commercial construction projects in
Texas. Future studies could use projects across the United States from all sectors
to do a comparison between Design-Build and Construction Management at
Risk;
b. Now that the comparison has been done between DB and CMAR projects, the
future researchers can start analyzing the reasons behind the results: why do
CMAR projects have better performance in project cost management? why do
DB projects have an advantage in construction intensity? The future studies can
be made in the explanation of the comparison results of DB and CMAR, and find
out the casual relationship;
c. Because of the data size is relatively small, this study did not group projects by
their size. For future study, when there are enough data, the researchers could
divide projects by their project size, and compare the projects that have the same
size but different project delivery systems to see what would the conclusion be;
d. When conducting Design Build and Construction Management at Risk
comparison studies, the dependent variables like cost and duration are correlated.
For example, in some construction projects, the larger the budget is, the longer
the duration is. In such circumstance, a Multivariate analysis methods called
cluster analysis should be applied to identify groups variables that share similar
attribute and reach out more convincing conclusions.

APPENDIX A
The time value adjustment tool used in this study is provided by Daniel Wheeler,
which is shown as following:

APPENDIX B
The original Normal Quantile Plots of Unit Cost and Construction Intensity are
shown as following:

LIST OF REFERENCES
“Alternative Delivery Method Investigation for the Lake Pleasant Water Treatment
Plant.” (1999).
Abdi, H. (2003). “Multivariate analysis.” Encyclopedia for research methods for the
social sciences. Thousand Oaks: Sage, 699-702.
Adams, T. (2003). “Design–build–operate gains popularity in US market.” Water World,
(April 3, 2011).
American Institute of Architects – Associated General Contractors of America (2011).
“AIA-AGC_Primer_on_Project_Delivery_2nd_Edition-FINAL.”
<https://www.agc.org/sites/default/files/Files/Programs%20%26%20Industry%2
0Relations/AIA-AGC_Primer_on_Project_Delivery_2nd_Edition-FINAL.pdf>
Anderson, D. R., Sweeney, D. J., and Williams, T. A. (1996). Statistics for business and
economics, St. Paul: West Publishing Company. Associated General Contractors of America (2004). Project delivery systems for
construction. Associated General Contractors of America.
Carpenter, N., and Bausman, D. C. (2016). “Comparing Owner Perceptions vs.
Performance Reality on Construction Management at Risk Public School
Projects.” The Professional Constructor.
Charoenphol, D., Stuban, S. M., and Dever, J. R. (2016). “Using Robust Statistical
Methodology to Evaluate the Cost Performance of Project Delivery Systems: A
Case Study of Horizontal Construction.” Journal of Cost Analysis and
Parametrics, 9(3), 181-200. Col Debella, D., and Ries, R. (2006). “Construction delivery systems: A comparative
analysis of their performance within school districts.” Journal of construction
engineering and management, 132(11), 1131-1138. Construction Industry Institute (CII). (n.d.). “Performance metric formulas and
definitions.” Construction Industry Institute, <https://www.construction-
institute.org/nextgen/publications/pas/general/GeneralLargeMetricsDefinition.pd
f>
“Construction cost.” Dictionary of Construction,
<http://www.dictionaryofconstruction.com/definition/construction-cost.html>
(Oct 01, 2017)
Culp, G. “ALTERNATIVE PROJECT DELIVERY METHODS DO THEY SAVE
TIME AND MONEY?” <http://smithculp.com/wp-
content/uploads/2016/01/AlternativeDeliveryPaper.021513.pdf> “Duration.” Dictionary of Construction,
<http://www.dictionaryofconstruction.com/definition/duration.html> (Oct 01,
2017)
Engineering News Record. (2015). Building cost index,
<http://enr.construction.com/economics/>
Fernane, J. D. (2011). “Comparison of design-build and design-bid-build performance of
public university projects.”
Francom, T., Asmar, M. E., and Ariaratnam, S. T. (2014). “Using alternative project
delivery methods to enhance the cost performance of trenchless construction
projects.” Construction Research Congress 2014: Construction in a Global
Network (pp. 1219-1228).
Francom, T. C. (2015). “Performance of the Construction Manager at Risk (CMAR)
Delivery Method Applied to Pipeline Construction Projects.” Ghassemi, R., and Becerik-Gerber, B. (2011). “Transitioning to Integrated Project
Delivery: Potential barriers and lessons learned.” Lean construction journal. Ghavamifar, K., and Touran, A. (2008). “Alternative project delivery systems:
Applications and legal limits in transportation projects.” Journal of Professional
Issues in Engineering Education and Practice, 134(1), 106-111.
Harper, C. M., Molenaar, K. R., and Cannon, J. P. (2016). “Measuring Constructs of
Relational Contracting in Construction Projects: The Owner’s
Perspective.” Journal of Construction Engineering and Management, 142(10),
04016053.
Howell, D. C. (2012). Statistical methods for psychology. Cengage Learning. Ibbs, C. W., Kwak, Y. H., Ng, T., and Odabasi, A. M. (2003). “Project delivery systems
and project change: Quantitative analysis.” Journal of Construction Engineering
and Management, 129(4), 382-387.
Konchar, M., and Sanvido, V. (1998). “Comparison of US project delivery
systems.” Journal of construction engineering and management, 124(6), 435-
444. Korkmaz, S., Riley, D., and Horman, M. (2010). “Piloting evaluation metrics for
sustainable high-performance building project delivery.” Journal of Construction
Engineering and Management, 136(8), 877-885.
Kulkarni, A., Rybkowski, Z. K., and Smith, J. (2012). “Cost comparison of collaborative
and IPD-like project delivery methods versus competitive non-collaborative
project delivery methods” (Doctoral dissertation, Texas A and M University). Lehmann, K. (1997). Mean Versus Median,
http://www.chemeddl.org/alfresco/service/api/node/content/workspace/SpacesSt
ore/7bafa0fb-dbf8-4a57-87ea-67fd10faa97c/MeanVsMedian.pdf?guest=true (Oct
01, 2017)
Maharjan, R. (2013). “Evaluation of Alternative Project Delivery Methods in Water and
Wastewater Projects.”
Minchin Jr, R. E., Li, X., Issa, R. R., and Vargas, G. G. (2013). “Comparison of cost and
time performance of design-build and design-bid-build delivery systems in
Florida.” Journal of Construction Engineering and Management, 139(10),
04013007.
Moon, H., Cho, K., Hong, T., and Hyun, C. (2011). “Selection model for delivery
methods for multifamily-housing construction projects.” Journal of Management
in Engineering, 27(2), 106-115.

Moynihan, G. P., and Harsh, C. (2015, January). “Current State of Construction Project
Delivery Methods.” IIE Annual Conference, Institute of Industrial and Systems
Engineers (IISE), (p. 174).
Müller, J. W. (2000). “Possible advantages of a robust evaluation of
comparisons.” Journal of research of the National Institute of Standards and
Technology, 105(4), 551. Pocock, J. B. (1996). The Relationship Between Alternative Project Approaches,
Integration, and Performance (No. AFIT-96-011). AIR FORCE INST OF TECH
WRIGHT-PATTERSON AFB OH. Ohrn, L. G., and Rogers, T. (2008). “Defining project delivery methods for design,
construction, and other construction-related services in the United States.”
International Proceedings of the 44th Annual Conference. Rojas, E. M., and Kell, I. (2008). “Comparative analysis of project delivery systems cost
performance in Pacific Northwest public schools.” Journal of Construction
Engineering and Management, 134(6), 387-397. “Schedule.” Dictionary of Construction,
<http://www.dictionaryofconstruction.com/definition/schedule.html> (Oct 01,
2017)
Shakya, B. (2013). “Performance Comparison of Design-Build and Construction
Manager/General Contractor Highway Projects.”
Shrestha, P. P., and Fernane, J. D. (2016). “Performance of Design-Build and Design-
Bid-Build Projects for Public Universities.” Journal of Construction Engineering
and Management, 143(3), 04016101. Shrestha, P. P., Maharjan, R., Shakya, B., and Batista, J. (2014). “Alternative project
delivery methods for water and wastewater projects: the satisfaction level of
owners.” Construction Research Congress 2014: Construction in a Global
Network (pp. 1733-1742).
Thomsen, C. (2006). “Project delivery processes.”
<http://www.3di.com/rnd/Files/Essays/Project%20Delivery%20Strategy.pdf>
(Dec 23, 2007)
Williams, G. (2003). “An evaluation of public construction contracting methods for the
public sector in Oregon using data envelopment analysis” (Doctoral dissertation,
Ph. D. dissertation., Portland State Univ., Portland, Ore).