does gender influence online survey participation?: a ... · does gender influence online survey...
TRANSCRIPT

Does Gender Influence Online Survey Participation?:
A Record-linkage Analysis of University Faculty
Online Survey Response Behavior
by
William G. Smith, PhD
San José State University
June, 2008

Online Survey Response Behavior
2
INTRODUCTION
Does it make sense to imagine a “typical” survey respondent, and if so, what are
the characteristics of such a person? Further, does what is known about demographic
factors that correlate to response behavior with regard to traditional modes of survey
administration, mail and telephone, apply to surveys administered online? Because
surveys have served for more than a century as a convenient, inexpensive, and reliable
way to gather large amounts of data and have informed decisions over an enormous range
of topics, answering these questions is critical. However, even after a century of use,
much is still unknown about who actually responds to surveys and why. Survey non-
response behavior is notoriously complex, poorly understood, and is influenced by an
unknown number of rather mechanical factors, including survey length, pre-notification,
follow-up reminders, survey format and graphical presentation (Goyder, 1987; Sheehan,
2001), and determining what factors influence or correlate with survey non-response
behavior is difficult in part because detailed information about non-respondents is often
impossible to gather.
In some cases it is possible to compare data about the sampling frame available
from non-survey-based sources with survey response data to determine if there are
differences in respondents and non-respondents on variables of interest (Goyder, 1987).
One technique, called record-linking, provides such a mechanism for direct comparison
of survey data with information about all members of the sampling frame (both
respondents and non-respondents). Although conducting a record-linking study requires
access to information about all members of the sampling frame under study, many

Online Survey Response Behavior
3
groups, such as professional organizations, clubs that keep registries, trade unions,
various branches of the armed forces and the like maintain information about their
members and so quite a number of potential sampling frames for record-linking studies
exist.
Survey response and non-response studies have shown that trends in who
responds to surveys do indeed exist, at least with regard to traditional modes of survey
administration. In general, more educated and more affluent people are more likely to
participate in surveys than less educated and less affluent people (Curtin, Presser, and
Singer, 2000; Goyder, Warriner, & Miller, 2002; Singer, van Hoewyk, & Maher, 2000),
women are more likely to participate than men (Curtin et al 2000; Moore & Tarnai, 2002;
Singer et al 2000), younger people are more likely to participate than older people
(Goyder, 1986; Moore & Tarnai, 2002), and white people are more likely to participate
than non-white people (Curtin et al 2000; Groves, Singer, & Corning, 2000; Voight,
Koepsell & Daling, 2003). Relevance of the survey topic has also been shown to
influence response rates (Groves et al, 2000), as has response burden (Goyder, 1987)
survey fatigue (Saxon et al, 2003), and even such factors as the focus of the study, the
methods of contact, the methods of data collection, and the wording of the questionnaire
title (Dillman, 2000; Dillman & Frey, 1974; Goyder, 1987; Hox & Deleeuw, 1994; Lund
& Gram, 1998; Miller, 1991).
Because administering surveys online is a comparatively new mode of survey
deployment, mode effects specific to online surveys are not as well-characterized nor as
clearly understood as those regarding more traditional modes. But because the use of
online surveys in social science research is quickly becoming routine in some areas and is

Online Survey Response Behavior
4
certain to continue growing in importance (Dillman et al,1999) it is important to describe
online mode effects where they exist and explain their presence as richly as possible. This
study seeks to add to the emerging literature helping to define and understand the
correlation between demographic characteristics of members of the sampling frame and
online survey response behavior by investigating how socio-demographic factors, gender
in particular, affect online survey response behavior.
A record-linking technique is employed to compare the gender and other
demographic data of online survey respondents directly to available demographic data of
all members of the sampling frame. The sampling frame is chosen in order to minimize
the possible effect of as many other potential correlates to non-response behavior as
possible; thus, the sampling frame consists entirely of university faculty members of a
large research university in the southeastern United States with a full-time faculty of
approximately 1000. Gathering data from such a sampling frame is assumed to minimize
potential swamping effects of education level, as all members of the sampling frame are
extremely highly educated relative to the general population. Likewise, because
university faculty members are roughly homogeneous with regard to Internet access
(Fleck & McQueen, 1999), geographic location, occupation, and to a lesser extent
income, it is assumed that restricting the sampling frame in this way will reduce the
effects of many other potential socio-demographic correlates.
Data from respondents to a web-based survey of the university’s faculty members
are compared with socio-demographic data maintained by the university’s division of
human resources, university colleges, and departments for socio-demographic correlates
with gender. In the case where a significant difference in response rate of males and

Online Survey Response Behavior
5
females is observed, demographic information about the members of the sampling frame
is examined to determine if the gender difference appears to be fundamental or, instead,
appears epiphenomenal to other potential factors, such as the academic rank or tenure
status of respondents.
LITERATURE REVIEW
Record-Linking
Record-linking is one of four general approaches to non-response analysis (the
other being time-of-response analysis, non-response follow-up studies, and panel
surveys) (Porter & Whitcomb, 2005). The advantage of record-linking studies, of course,
is the opportunity to consider response data in the context of data about all members of
the sampling frame, and the logic behind record-linking techniques is straightforward: a
sampling frame for which records of all members is identified, a survey is administered
within that sampling frame, and survey response data is linked to records for all members
of the sampling frame. Analysis of linked data can then be used to understand aspects of
non-response behavior (Goyder, 1986, 1987; Goyder et al, 2002; Moore & Tarnai, 2002;
Porter & Whitcomb, 2005).
Online Survey non-response
The increasing availability of computers and Internet connections signals the
growth of what has already become an important avenue for administering surveys
(Dillman et al, 1999; Dillman & Bowker, 2001) and points to the need to determine
whether, and to what extent, what is known about survey non-response to traditional
surveys administered via mail or telephone corresponds to surveys administered online.

Online Survey Response Behavior
6
The relative novelty of online surveying notwithstanding, reports suggest that although
response rates are typically lower for online surveys as compared to traditional surveys
(McMahon et al., 2003; Solomon, 2001; Couper, 2001; De Leeuw and Heer, 2002), many
demographic and other correlates with non-response to online surveys may indeed mirror
those of more traditional modes of survey administration (Couper et al, 2007; May,
2000).
However, it is unclear whether all correlates to online non-response mirror those
of more traditional modes of administration. Some investigations of online survey
response behavior suggest that, in contrast to traditional surveys, men may respond to
web-based surveys in greater proportions than women ((Kehoe & Pitkow, 1996; Kwak
and Radler, 2002; Sax, Gilmartin &Bryant, 2003; Smith & Leigh, 1997), although other
studies report that, similar to traditional survey modes, women respond in greater
proportions than men (Kwak & Radler, 2002; Sax et al, 2004; Underwood, Kim, &
Mattiea, 2000). Clearly, a more detailed understanding of the influence of such a basic
demographic factor as gender on online survey response behavior is of critical concern to
everyone who conducts or relies upon research involving online surveys.
METHODOLOGY
This study considers the following general research questions in a bounded
population of well-educated middle-class and upper-middle-class professional people:
Are web-based survey non-respondents different from survey respondents? If so, is there
a relationship between non-response and demographic characteristics of members of the
sampling frame? Specifically, this study investigated whether differences in non-response
Online Survey Response Behavior
7
error in a web-based survey of higher education faculty members results from differences
in web-based survey response rates along three demographic dimensions: gender,
academic rank, and tenure status.
Participants
Nine-hundred-eighty-one full-time faculty members of a large state university in
the southeastern U.S. were invited via an email message to participate in an online
survey. Five days later, a follow-up email was sent. These two emails constituted all of
the efforts made to solicit responses from the sampling frame.
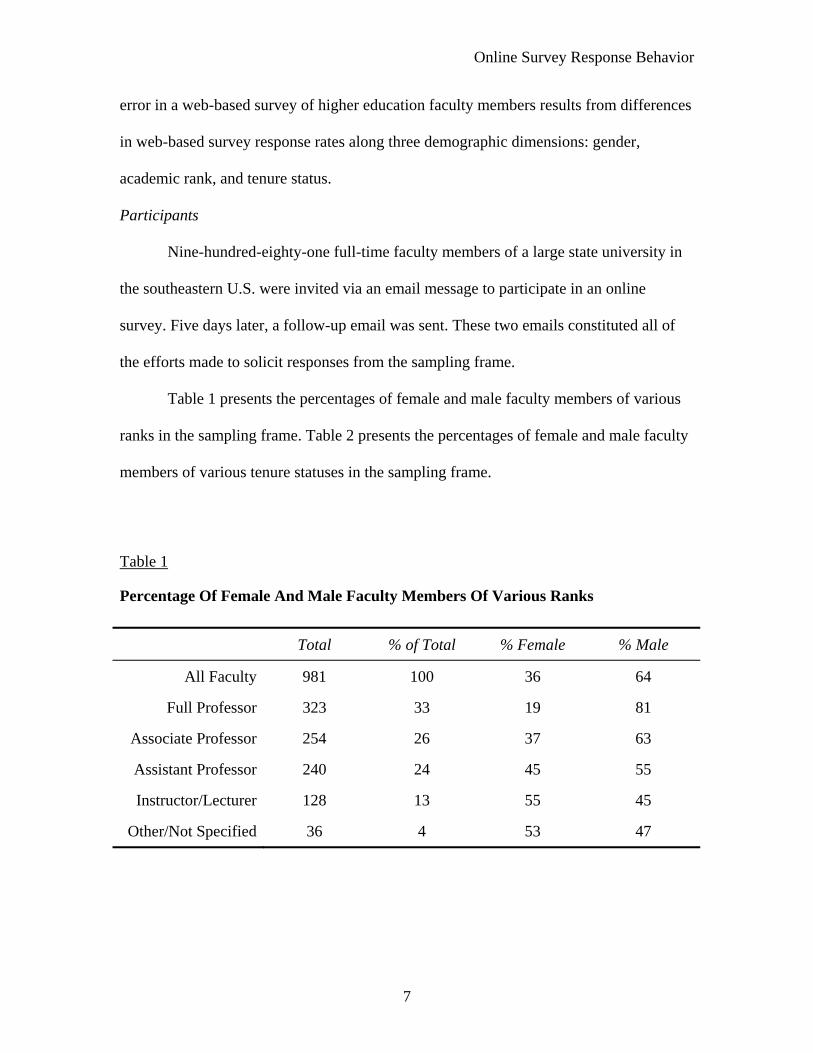
Table 1 presents the percentages of female and male faculty members of various
ranks in the sampling frame. Table 2 presents the percentages of female and male faculty
members of various tenure statuses in the sampling frame.
Table 1
Percentage Of Female And Male Faculty Members Of Various Ranks
Total % of Total % Female % Male
All Faculty 981 100 36 64
Full Professor 323 33 19 81
Associate Professor 254 26 37 63
Assistant Professor 240 24 45 55
Instructor/Lecturer 128 13 55 45
Other/Not Specified 36 4 53 47

Online Survey Response Behavior
8
Table 2
Percentage of Female and Male Faculty Members of Various Tenure Statuses
Total % of Total % Female % Male
Tenured 540 55 27 73
Tenure-Track 248 25 40 60
Non-Tenure-Track 123 13 59 41
Not Specified 70 7 51 49
The survey instrument, adapted from Mitchell (1998) probed issues likely to be
correlated with a decision to participate in a survey and was divided into 3 parts. The first
part was designed to collect socio-demographic information such as gender, college
affiliation, department, academic rank, tenure status, and general field of expertise. It also
asked respondents about the number of invitations to participate in survey research they
receive and how often they decide to participate. The second part contained questions
probing factors that may influence a decision to participate in survey research, such as
salience of the survey topic, response burden on the respondent, general attitudes toward
surveys, past experience with survey research, and survey fatigue. However, because
only response data is needed to calculate cross-tabulations it was not necessary that the
survey instrument reliably measure underlying constructs of salience, response burden, or
survey fatigue in order to test the study’s primary research hypotheses. Therefore, no
assessment of the survey instrument’s degree of internal consistency (reliability) in
gauging these underlying constructs is conducted.

Online Survey Response Behavior
9
Response data is compared with data about all of the members of the sampling
framei and a series of Pearson’s chi-square statistics is calculated to test for significant
relationships between response rates and gender, academic rank, and tenure position.
Bivariate tabulations generating significant relationships are identified. An alpha level
(level of significance) of .05 is used throughout data analysis, unless otherwise noted.
RESULTS
Of the 981 faculty invited to participate, 278 submitted surveys for a response rate
of 28%. Of the 278 respondents, 127 (46%) reported their gender as female and 151
(54%) as male, while the sampling frame consisted of 353 females (36%) and 628 males
(64%). Thus the response rate for female faculty members was 36%, compared to a
response rate for male faculty members of 24%. In other words, female faculty members
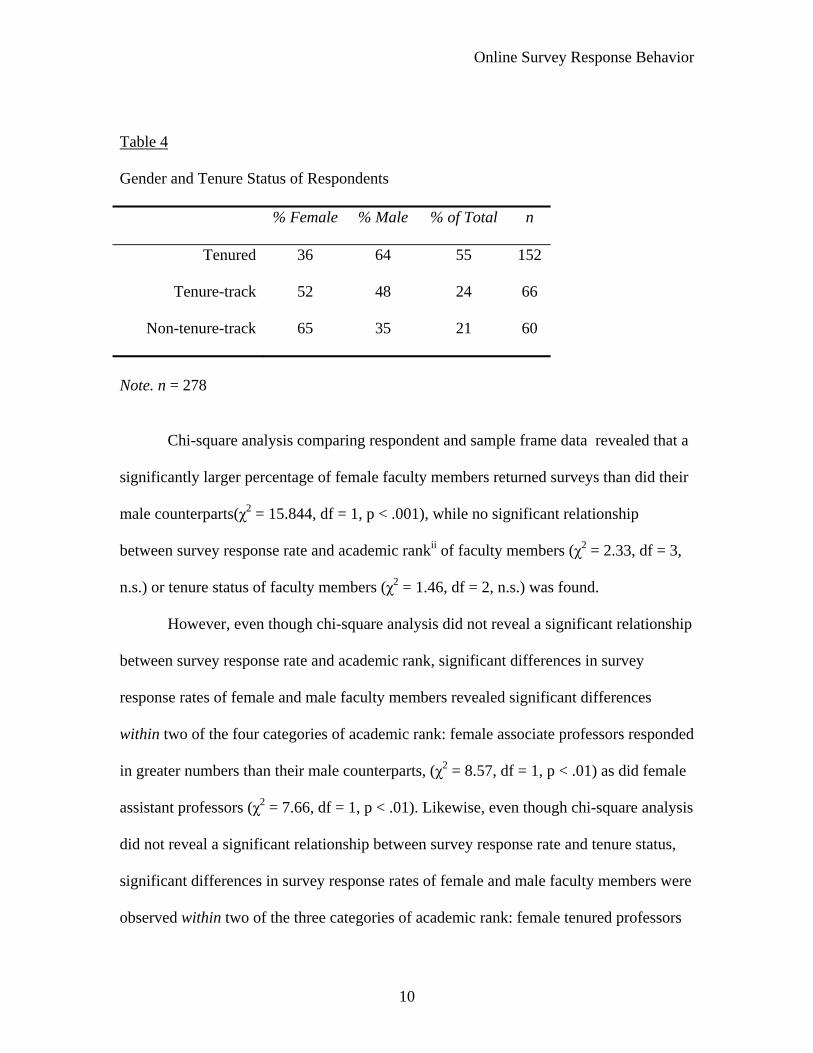
contributed disproportionately to the respondent data set. Tables 3 and 4 present the
percentages of respondents according to academic rank and tenure status, broken down
by gender.
Table 3
Gender and Academic Rank of Respondents
% Female % Male % of Total n
Professor 20 80 31 79
Associate Professor 52 48 25 63
Assistant Professor 59 41 28 71
Instructor/Lecturer 60 40 16 43
Note. n = 256
Online Survey Response Behavior
10
Table 4
Gender and Tenure Status of Respondents
% Female % Male % of Total n
Tenured 36 64 55 152
Tenure-track 52 48 24 66
Non-tenure-track 65 35 21 60
Note. n = 278
Chi-square analysis comparing respondent and sample frame data revealed that a
significantly larger percentage of female faculty members returned surveys than did their
male counterparts(χ2 = 15.844, df = 1, p < .001), while no significant relationship
between survey response rate and academic rankii of faculty members (χ2 = 2.33, df = 3,
n.s.) or tenure status of faculty members (χ2 = 1.46, df = 2, n.s.) was found.
However, even though chi-square analysis did not reveal a significant relationship
between survey response rate and academic rank, significant differences in survey
response rates of female and male faculty members revealed significant differences
within two of the four categories of academic rank: female associate professors responded
in greater numbers than their male counterparts, (χ2 = 8.57, df = 1, p < .01) as did female
assistant professors (χ2 = 7.66, df = 1, p < .01). Likewise, even though chi-square analysis
did not reveal a significant relationship between survey response rate and tenure status,
significant differences in survey response rates of female and male faculty members were
observed within two of the three categories of academic rank: female tenured professors

Online Survey Response Behavior
11
responded in greater numbers than their male counterparts (χ2 = 7.46, df = 1, p < .01) as
did female tenure-track professors (χ2 = 4.26, df = 1, p < .05).
LIMITATIONS
The principle limitations of this study stem from the fact that data from only one
sampling frame, a large public research university, is considered. University faculty
members undoubtedly have significantly different socio-demographic characteristics
from the general population of possible online survey-takers, so conclusions should not
be generalized beyond this limited population. Additionally, because only one institution
was studied using an instrument specifically designed to probe issues related to survey
non-response, observations presented here may not be representative of faculty members
of other colleges or universities, further limiting the generalizability of the conclusions.
Finally, the availability of socio-demographic records of all members of the sampling
frame is limited to aggregate information such as gender, departmental size, tenure,
academic rank, and the like. This, coupled with the necessary anonymity of survey
respondents, prevents detailed analysis of individual behavior patterns or the systematic
characterization of individual non-responders. Although it is hoped that the information
gained in this study will be useful, clearly it will take many more studies designed
specifically to overcome the sorts of methodological and operational limitations of this
study to fully illuminate the nature of online survey response behavior.
Online Survey Response Behavior
12
DISCUSSION
This study probed for the existence of gender bias in online survey response
behavior, and indeed, a difference in the online survey response rates of female and male
members of a selected sampling frame is reported. In fact, the difference is significant at
the 99.9% level of confidence. What is the explanation for the observation that female
and male faculty members did not respond to requests to participate in the online survey
research equally? Is the observed difference in response behavior meaningful in itself, or
is it merely an artifact of some other difference between faculty members that also
correlates to gender? One possible conclusion is that differences in female and male
faculty response rates is meaningful in itself and is a product of differences in female and
male values operating in a gendered online environment. For example, in the context of
social exchange theory, England (1989) argues that a gender bias is inherent in any
communication in which actors are assumed to make exchange decisions from the
concept of separative selves. She and others (see, for example, Chodorow, 1978) contend
that males are more likely to possess or place a high value on separative characteristics
than females, while females, on the other hand, are more likely to possess or value
characteristics more consistent with connective selves, such as empathy or emotional
closeness. If this interpretation is accurate, differences in response rates could be viewed
as coming from differences in the way males and females make decisions and value
actions in the online environment. Specifically, if becoming a survey respondent is more
readily perceived as behavior consistent with connective selves than with separative
selves, or is more highly valued by those with characteristics of connective selves, one
would expect a higher survey response rate for females than males. Such “social

Online Survey Response Behavior
13
distance” models have been offered as possible explanations for some survey response
behavior (see, for example, Tu & Liau, 2007).
In fact, one faculty member characterized her willingness to participate in
research in strikingly connectivist terms in an email she sent to me after she had become
a respondent. In commenting on a survey item that asked respondents to choose a method
of survey administration to which they’d most likely respond, she writes:
Your last question presumes that one form of surveying is more acceptable to me than another. This is not the case. I am philosophically wanting to support other people's research, even as I want them to support mine. I respond to ALL requests for research participation, regardless of how they are communicated to me. At least in this particular case, it certainly seems that response was perceived as
behavior consistent with connective selves.
When one views response behavior in the context of the online environment, the
conclusion that observed differences in response rate are a product of gender differences
becomes more powerful. This is because differences in the way females and males
inhabit cyberspace may exaggerate the effects of differences in how females and males
undergo social exchange, resulting in differences in online survey response rates. As
many studies illustrate, gender can strongly shape behavior in cyberspace and has been
shown to correlate with online activities (Jackson, Ervin, Gardner & Schmidt, 2001;
Kendall, 1999; Lucas & Smith, 2004; Morahan-Martin, 1998; Ogen and Chung, 2003;
O’Brien, 1999; Tannen, 1991; Travers, 2003; Turkle, 1995). Notably, some researchers
maintain that females are more likely to engage in online activity characterized by
communication and exchanging of information whereas males are more likely to engage
in online activity characterized by seeking of information (Jackson et al., 2001).
Responding to an email by accessing an online survey, completing it, and returning it, is

Online Survey Response Behavior
14
certainly more a process of online information-exchange than it is a process of online
information-seeking. From this standpoint, it is reasonable that a higher response rates
among female faculty than male faculty was observed. It is possible that the differences
in the way females and males inhabit cyberspace compound the effects of differences in
the way female and male values operate in social exchange, with the end result being a
disproportionate number of female respondents to the online survey.
Gender-related differences in response rates within the categories of academic
rank and tenure status, where they exist, are also consistent with this conclusion. In each
case, where significant differences were found, return rates of female faculty were higher
than return rates of male faculty. Specifically, observed response rates of female associate
and assistant professor were higher than observed response rates of male associate and
assistant professor, and observed response rates of female tenured and tenure-track
professors were higher than observed response rates of male tenured and tenure-track
professors.
It must be said, however, that this explanation does nothing to explain why female
associate and assistant professors responded in greater numbers than female professors,
instructors, or lecturers, nor why female tenured and tenure-track faculty responded in
greater numbers than female tenure-ineligible faculty. Any number of conjectures could
be put forward as possible explanations for these observations. Perhaps the professor
rank, which is 81% male, is also generally less familiar with Internet technology because
it is a generally more aged rank, and the effect of age masked any gender effect that may
exist. Perhaps because professors made up a larger percentage of the total faculty than
other ranks, the consequent weighting within chi-square analysis prevented a possible
Online Survey Response Behavior
15
gender bias within that rank from becoming apparent. On the other end of the ranking
structure, perhaps a similar weighting effect was at work due to the fact that instructors
and lecturers are the only ranks in which females outnumber males. Or perhaps
instructors, lecturers and tenure-ineligible faculty are not as likely to engage in research
of their own and therefore do not value reciprocal participation within exchange
relationships in the same way faculty of other ranks do, thereby reducing the effect of
gender within exchange and diminishing the overall effect of gender to insignificance.
Unfortunately, given the data at hand, there is no way to gauge the utility of any of these
conjectures.
Of course, the data presented here do not directly support the conclusion that a
causal link between gender and response behavior exists. One test of the conclusion that
observed differences in response behavior are in fact a result of differences in gender and
not some other difference would be to demonstrate that other variables that influence
response behavior are independent of gender. One such potential variable is the area of
expertise of faculty members. The data certainly suggest that faculty in some areas of
expertise are more likely than faculty in other areas of expertise to respond to online
survey requests, particularly online survey requests of the kind this study employed. It is
possible, for example, that social surveys themselves may be viewed as non-salient by
some academics, while academics who use survey research in their own work may be
more likely to view survey research as salient and will, therefore, be more likely to return
surveys. In a study of university faculty in the U.K., Mitchell (1998) reported that
response rates to a postal survey varied significantly between academic departments, with
the physical sciences having the lowest response rates (30%) and the social sciences

Online Survey Response Behavior
16
having the highest (63%). However, as Goyder (1986) concludes from his research about
surveys on surveys, “a survey organized around the topic of “what do people think of
surveys?” seems to appeal to those opposed to surveying, as well as to the “professional
respondents” who thrive on being interviewed on any topic” (p. 39). If the differences in
response rates were in fact related to differences in area of expertise, which in turn were
related to gender, one would expect to observe a gender-response rate relationship, yet be
incorrect in assuming the difference in response rate was evidence of a direct gender
effect.
In this study, because the survey contains an item asking respondents to record
their departmental affiliation, it was possible to make somewhat reasonable assumptions
regarding respondent areas of expertise, and chi-square analysis for a relationship
between response behavior and area of expertise revealed a strong relationship,
significant at the 99.9% level of confidence. Unfortunately, the ambiguous nature of the
concept “area of expertise” and the unavailability of more detailed information regarding
respondent and non-respondent areas of expertise seriously undermined the validity of
using statistical methods for analyzing this variable for possible gender relationships.
Thus, while several aspects of the relationship between response rate and area of
expertise with respect to gender were interesting, they could not be viewed as anything
beyond merely anecdotal observations.
As a final consideration, it is worth noting that the observed difference in
response behavior by gender did not manifest itself in an environment free from gender
inequity. The sampling frame for this study consisted of faculty members at a large
research university, and with respect to gender the distribution of the sampling frame is

Online Survey Response Behavior
17
not equitable: only 36% of the faculty in the sampling frame are female. This gender
imbalance is even more pronounced when one considers academic rank: more than four-
fifths of faculty who hold the rank of full professor are male but less than half of faculty
who hold the rank of instructor or lecturer are male. The same imbalance holds when one
considers tenure status: nearly three quarters of the tenured faculty are male; fully 60% of
those in tenure-track positions are male; but only two fifths of the non-tenure-track
faculty are male. In short, at the institution under study, being female correlates with low
academic rank and low tenure status. It is unclear how gender inequities in the
environment under study relate to observed differences in response rate by gender.
As is often the case, this study offers far more questions than it does unambiguous
answers; however, each such study is important if it adds to what is known. The results
and observations of this study, therefore, are offered as points in the growing collection
of data describing how demographics and online survey response behavior interact.
ENDNOTES
i Because no method for linking item response data gathered by the survey instrument
data to similar data corresponding to all members of the sampling frame, details about
item-response data is not presented. Only bulk data corresponding to response or non-
response is presented.
ii Twenty-two of the 278 survey respondents did not respond to the item about academic
rank and were defined as non-respondents in this chi-square calculation.

Online Survey Response Behavior
18
References
Chodorow, N. (1978). The Reproduction of Mothering. Berkeley: University of California Press.
Couper, M.P. (2001) The promises and perils of Web surveys. In: A. Westlake et al.,
Editors, The Challenge of the Internet, Association for Survey Computing, London (2001), pp. 35–56.
Couper, M.P., Kapteyn, A., Schonlau, M. & Winter, J. (2007). Non coverage and non
response in an Internet survey. Social Science Research, 36(1) 131-148. Curtin, R., Presser, S., & Singer, E. (2000). The effects of response rate changes on the
index of consumer sentiment. Public Opinion Quarterly 64: 413–428. De Leeuw, E. & Heer, W. (2002). Trends in household survey nonresponse: A
longitudinal and international comparison. In: Groves, R. M., Dillman, D. A., Eltinge, J. L., and Little, R. J. A. (eds.), Survey Nonresponse, John Wiley & Sons, New York.
Dillman, D. (2000). Mail and Internet Surveys: The Tailored Design Method. New York:
John Wiley & Sons, Inc. Dillman, D. & Bowker, D. (2001). The Web Questionnaire Challenge to Survey
Methodologists. Retrieved September 20, 2004, from The Washington State University Web site: http://survey.sesrc.wsu.edu/dillman/zuma_paper_dillman_bowker.pdf
Dillman, D. & Frey, J.H. (1974). Contribution of personalization to mail questionnaire
response as an element of a previously tested method. Journal of Applied Psychology, 59(3), 297-301.
Dillman, D., R. Tortora, & Bowker, D. (1999). Principles for Constructing Web Surveys.
Retrieved February 11, 2004, from http://survey.sesrc.wsu.edu/dillman/papers/websurveyppr.pdf
England, P. (1989). A Feminist Critique of Rational Choice Theories: Implications for
Sociology. American Sociologist, 20(1), 14-22. Fleck, R. A. J. & McQueen, T. (1999). Internet Access, Usage and Policies in Colleges
and Universities. First Monday, 4(11).

Online Survey Response Behavior
19
Goyder, J. (1986). Surveys on Surveys: Limitations and Potentials. Public Opinion
Quarterly, 50, 27-41. Goyder, J. (1987). The Silent Minority: Non-respondents on sample surveys. Oxford:
Polity Press. Goyder, J., Warriner, K., & Miller, S. (2002). Evaluating socio-economic status (SES)
bias in survey nonresponse. Journal of Official Statistics 18(1), 1–11. Groves, R. M., Singer, E., & Corning, A. (2000). Leverage-saliency theory of survey
participation. Public Opinion Quarterly 64, 299–308. Hox, J. J. & Deleeuw, E. (1994). A comparison of non-response in mail, telephone and
face-to-face surveys. Quality and Quantity 28, 329-344. Jackson, L. A., Ervin, K. S., Gardner, P. D., & Schmitt, N. (2001). Gender and the
Internet: Women Communicating and Men Searching. Sex Roles, 44(5), 363. Kendall, L. (1999). Recontextualizing Cyberspace: Methodological considerations for
online research. Doing Internet Research. Jones, S. (Ed). Thousand Oaks, CA: Sage.
Kwak, N., & Radler, B. (2002). A comparison between mail and web surveys: response
pattern, respondent profile, and Data quality. Journal of Official Statistics, 18(2), 257-273.
May, V. (2000). Survey 2000. Retrieved February 11, 2006 from the National Geographic
Society Web site: http://survey2000.nationalgeographic.com/iaccess.html Lucas, S. B. & Smith, G. (2004). Exploration of Instructional Technology in Higher
Education: the Role of Gender in IT Teaching Practices and Beliefs among Faculty. Paper Presented at the AERA Annual Conference, San Diego, CA. Retrieved September 1, 2007 from http://susanlucas.com/it/bef507/paper.html
Lund, E. & Gram, I. T. (1998). Response rate according to title and length of
questionnaire. Scandinavian Journal of Public Health, Taylor & Francis Ltd, 26, 154-160.
McMahon, S. R., Iwamoto, M., Massoudi, S.S., Yusuf, H.R., Stevenson, J.M., David F.
et al. (2003). Comparison of E-mail, Fax, and Postal Surveys of Pediatricians. Pediatrics, American Academy of Pediatrics, 111, e299.
Miller, D. C. (1991). Guides to Methods and Techniques of Collecting Data in Library,
Field and Laboratory. Newbury Park, CA: Sage Publications.

Online Survey Response Behavior
20
Mitchell, V.W. (1998). Improving mail survey responses from UK academics: Some
Empirical Findings. Assessment & Evaluation in Higher Education, 23, 59-71. Moore, D. L., & Tarnai, J. (2002). Evaluating nonresponse error in mail surveys. In:
Groves, R. M., Dillman, D. A., Eltinge, J. L., and Little, R. J. A. (eds.), Survey Nonresponse, John Wiley & Sons, New York, pp. 197–211.
Morahan-Martin, J. (1998). Males, females and the internet. In J. Gackenback (Ed.),
Psychology and the internet: imtrapersonal, interpersonal and transpersonal applications (pp. 169-197). San Diego: Academic Press.
O'Brien, J. (1999). Writing in the Body: Gender (Re)production in Online Interaction.
Communities and Cyberspace. Smith, M. A. and Kollock, P. (Eds). London: Routledge.
Ogan, C. & Chung, D. (2003). Stressed Out! A National Study of Women and Men
Journalism and Mass Communication Faculty, Their Uses of Technology, and Levels of Professional and Personal Stress. Journalism and Mass Communication Educator [online], 57(4), 352-368.
Ono, H. & Zavodny, M. (2003). Gender and the Internet. Social Science Quarterly, 84,
111-121. Porter, S., & Whitcomb, M. (2005) Non-response in student surveys: The role of
demographics, engagement and personality. Research in Higher Education, 46(2), 127-152.
Saxon, D., Garratt, D., Gilroy P., & Cairns C. (2003). Collecting data in the Information
Age. Research in Education, 51. Sheehan, K. (2001). E-mail Survey Response Rates: A Review. Journal of Computer
Mediated Communication [online]. 6(2). Retrieved September 20, 2004 from http://www.ascusc.org/jcmc/vol6/issue2/sheehan.html
Singer, E., van Hoewyk, J., & Maher, M. P. (2000). Experiments with incentives in
telephone surveys. Public Opinion Quarterly 64: 171–188. Smith, M. A., and Leigh, B. (1997). Virtual subjects: Using the Internet as an alternative
source of subjects and research environment. Behav. Res. Methods Instrum. Comput. 29: 496–505.
Solomon, D. J. (2001). Conducting Web-Based Surveys. ERIC No: ED458291. Tannen, D. (1991). You Just Don't Understand. Women and Men in Conversation. New
York: Ballentine Books.
Online Survey Response Behavior
21
Tourangeau, R. (2003). Cognitive aspects of survey measurement and mismeasurement.
International Journal of Public Opinion Research, World Association for Public Opinion Research, 15, 3.
Travers, A. (2003). Parallel subaltern feminist counterpublics in cyberspace. Sociological
Perspectives, 46, 223-237. Turkle, S. (1995). Life on the Screen: Identity in the Age of the Internet. New York:
Simon and Schuster. Tu, S-H., & Liao, P-S (2007). Social Distance, Respondent Cooperation and Item
Nonresponse in Sex Survey, Quality and Quantity 41(2), 177-199. Underwood, D., Kim, H., and Matier, M. (2000). To mail or to Web: Comparisons of
survey response rates and respondent characteristics. Paper presented at the 40th Annual Forum of the Association for Institutional Research, Cincinnati, OH, May 21–24, 2000.
Voigt, L. F., Koepsell, T. D., & Daling, J. R. (2003). Characteristics of telephone survey
respondents according to willingness to participate. American Journal of Epidemiology 157: 66–73.