does higher turnout hurt incumbents? an analysis of state ... · sanjay kumar, told the hindu...
TRANSCRIPT

Article
Does Higher Turnout Hurt Incumbents?An Analysis of State Elections in India
Milan Vaishnav1 Johnathan Guy2
Abstract Conventional wisdom holds that an increase in voter turnout hurts incumbents in Indian elections. This belief has become a central feature of how analysts discuss Indian voter behaviour. Yet there are few systematic analyses of the relationship between turnout and incumbent performance. To fill this gap, we analysed a dataset of elections in India’s 18 major states between 1980 and 2012. Our analyses show that an increase in turnout, relative to the prior election, has no statistically meaningful relationship with three measures of an incumbent government’s electoral performance. While the belief about the anti-incumbent nature of rising turnout is widely held, it does not appear to be supported by the data.
Keywords Elections, voter turnout, incumbency, India
There is a longstanding, widely held belief in India that a positive increase in voter turnout is inherently anti-incumbent in nature. While the origins of this folk wisdom are indeterminate, statements in support of this contention are repeated ad nauseam nearly every election cycle. Proponents of this view argue that positive turnout growth—that is, an increase in voter turnout in the current election relative to the previous election—signals that the electorate is in a mood for change and, hence, the electoral fortunes of the incumbent government will be adversely affected.3 For instance, when discussing the growth in voter turnout in India’s May 2014 general election relative to the previous election in 2009, economist Surjit Bhalla claimed that ‘such a phenomena [sic] always goes against the incumbent. It is, if you will, bad news for the incumbent’ (Firstpost, 2014). After the 2016 state elections in Tamil Nadu, one election analyst proclaimed that ‘It is true that a huge voter turnout actually indicates an anti-incumbency wave. People turn up in huge numbers to vote out the government’ (Naig, 2016).
Given the widespread belief in a close connection between increasing voter turnout and anti- incumbency sentiment, it is surprising that there have been few (if any) systematic analyses of this
1 Carnegie Endowment for International Peace, Massachusetts Avenue NW, Washington, DC, USA.2 University of Chicago, Chicago, Illinois, USA. 3 When it comes to the conventional wisdom, it is not clear whether rising turnout is thought to be anti-incumbent or pro-challenger. There is a subtle difference between the two mechanisms.
Studies in Indian Politics6(1) 1–17
© 2018 Lokniti, Centre for the Study of Developing Societies
SAGE Publicationssagepub.in/home.nav
DOI: 10.1177/2321023018762817http://journals.sagepub.com/home/inp
Corresponding author:Milan Vaishnav, Carnegie Endowment for International Peace, 1779 Massachusetts Avenue NW, Washington, DC 20036, USA.E-mail: [email protected]

2 Studies in Indian Politics 6(1)
relationship in the Indian context. Indeed, aside from the occasional newspaper opinion piece, we strug-gled to locate even one empirical analysis of the statistical relationship between turnout and incumbency in a scholarly publication. While in-depth analyses may be lacking, many experts have nevertheless begun to cast doubt on the conventional narrative in recent years. One of India’s leading election experts, Sanjay Kumar, told The Hindu (Shrinivasan, 2014) newspaper ‘I don’t know how this idea that high turnout is associated with anti-incumbency has persisted from generation to generation. The relationship has never existed.’ Some have even argued in favour of the opposite relationship—that is, that a spike in voter turnout is ‘pro-incumbent’. In 2012, the then-Chief Minister of Gujarat, Narendra Modi, attributed an increase in state voter turnout to a surge of support in favour of his incumbent Bharatiya Janata Party (BJP) government. ‘This is the record polling after the formation of the state. We have a popular term in anti-incumbency but after this state election, political pundits will have to adapt and discuss the term pro-incumbency,’ Modi said (Press Trust of India, 2012).
Drawing on recent electoral history, one can find examples linking a sharp rise in voter turnout to incumbent defeats as well as victories. Consider two elections: the 2010 assembly elections in Bihar and the 2011 assembly polls in Tamil Nadu. In Bihar, voter turnout grew by 6.8 per cent points between 2005 and 2010, part of an underlying trend of rising voter participation in the north Indian state. Notwithstanding this increase in turnout, the incumbent National Democratic Alliance (NDA) coalition headed by Nitish Kumar won a rousing re-election. The coalition grew its vote share by 3 per cent and increased its share of seats in the Bihar assembly by nearly 26 per cent. Contrast this with Tamil Nadu’s 2011 polls which saw a 7.2 per cent point increase in voter turnout over 2006. In this case, rising voter turnout coincided with an incumbent loss. In the 2011 election, the ruling Dravida Munnetra Kazhagam (DMK) alliance suffered a sharp defeat at the hands of its arch-rival All India Anna Dravida Munnetra Kazhagam (AIADMK), losing 3 per cent vote share and more than 43 per cent of its seat share. In the prior 2006 poll, which also saw a large increase in turnout, the incumbent AIADMK suffered a similar fate.
The present article scrutinizes the link between turnout and electoral outcomes by drawing on a data-set of 128 elections held across 18 major states of India between 1980 and 2012. For each state election in our dataset, we utilize data on three electoral outcomes: a binary measure of whether the incumbent party or coalition was re-elected, the change in the incumbent’s vote share, and the change in the incum-bent’s seat share. We then explore how well changes in turnout (from one state election to the next) explain variation in these three outcomes. Our unit of analysis is a state election; we choose to concen-trate at this level in order to capture the fortunes of a given incumbent party overall rather than those of individual candidates. This focus on parties more directly tests the conventional wisdom, which refers to aggregate turnout in a state and makes predictions about incumbent electoral performance on this basis.
To preview our results, our analyses find little empirical support for the hypothesized association between increases in turnout and anti-incumbent electoral outcomes. Even after controlling for unob-served time and state-level variation and a host of possible confounding factors, we find that an increase in relative turnout has no statistically significant association with three discrete measures of incumbent performance. We conclude from this exercise that, contrary to claims put forward by analysts, politi-cians, and political pundits, a positive ‘turnout shock’ is not inherently pro- or anti-incumbent.
The remainder of this article is organized as follows. In the next section, we review the extant literature on the subject, including the analyses that employ data from the Indian case. In the third section, we pre-sent our empirical model and briefly describe the data used in our analysis. The fourth section contains our findings, beginning with descriptive statistics and moving onto more systematic, multivariate analyses. We conclude by suggesting several interesting research questions on turnout and incumbent performance that have yet to be thoroughly explored.

Vaishnav and Guy 3
Existing Literature
Much of the political science literature on the relationship between turnout and incumbency focuses on the United States of America (USA). One of the most cited mechanisms linking higher turnout to anti-incumbent outcomes is the so-called ‘competition effect’. Grofman, Owen, and Collet (1999) suggest one is likely to observe higher turnout in elections that are highly competitive. One implication of the competition effect is that increasing turnout will be negatively associated with incumbent electoral per-formance, since increased participation is driven by an increase in voters who are dissatisfied with the ruling coalition. In the USA, for instance, the prevailing wisdom is that higher turnout is beneficial for the Democratic Party; however, the authors posit that this is true only insofar as the Republicans are incumbents.
Building upon this logic, Hansford and Gomez (2010) put forward two justifications for the negative association between turnout and incumbency in the USA. First, there might be some third factor (for instance, economic challenges) that could lead both to higher turnout and a vote against the incumbent government. A second possibility is that core voters and peripheral voters vary substantially. If core voters are supportive of the government, higher turnout could reflect an increased mobilization among peripheral voters who played no role in establishing the status quo and might well vote against it. Indeed, evidence from the American experience demonstrates that high and low turnout elections produce starkly different electorates. When turnout increases, lower probability voters (who tend to be younger, poorer, and less educated) make up a larger share of the electorate (Hajnal, 2010; Trounstine, 2013).
The literature on US politics highlights another potential mechanism linking turnout and incumbency which has to do with voter contact. Trounstine (2013) argues that there are limits to the number of con-stituents that incumbents can actually reach out to during the course of their tenure in office. Where turnout is low, there will likely be a larger proportion of voters with whom elected officials have had direct ‘contact’. In high turnout elections, some scholars have suggested that the electorate will contain a larger share of unreliable or volatile voters.
Empirical evidence regarding the anti-incumbency hypothesis in the USA is broadly favourable, though nuanced. Hajnal and Trounstine (2005) find that low overall turnout in local US elections is better for the incumbent, although whether this advantage is due to satisfaction with incumbent performance or other structural factors is unclear. Trounstine (2013), using data from elections in 4,000 American cities, also finds a negative association between turnout and incumbent electoral performance.
There is the concern, however, that turnout and electoral outcomes are both endogenous, thus limiting the causal assertions that can be made from measurements of one or the other. In their study, Hansford and Gomez use rainfall as an instrument for variation in county-level voter turnout in US presidential elections over a 50-year period. Their results demonstrate that higher turnout is indeed anti-incumbent in nature, although the estimated effect is small and contingent upon other factors such as the ideological characteristics of the electorate and the identity of the incumbent party itself.4
Insofar as India is concerned, there are contextual reasons why the connection between higher turnout and anti-incumbency might not pertain. First, constituent attachments to particular parties in India are much weaker than they are in industrialized democracies like the USA; a considerable share of voters switches partisan affiliations among successive elections (Kashyap, 1970). Therefore, the logic of ‘core’ and ‘peripheral’ voters does not fit so neatly into the Indian context. Unsurprisingly, research finds
4 Rainfall is used as an instrument because the authors argue that it is correlated with levels of turnout but not electoral outcomes and, furthermore, because weather-induced variation in turnout is thought to be a suitable proxy for the general effect of variation in turnout. For more, see Hansford and Gomez (2010).

4 Studies in Indian Politics 6(1)
that electoral volatility is much higher in India (Heath, 2005). Second, records provide mixed evidence regarding the existence of an incumbency advantage in India; especially in recent decades, research has found that incumbents are just as likely to be voted out of office as they are re-elected (Ravishankar, 2009; Uppal, 2009). Third and finally, there is an assumption in the US politics literature that highly motivated voters tend to hail from the upper socio-economic strata. Thus, during low turnout elections, their preferences dominate. In India, quite the opposite is true. The poor are as likely—if not more likely—than their middle-and upper-class peers to vote in elections (Ahuja & Chhibber, 2012). Therefore, the composition of electorates in India and the USA tends to be quite different.
Although the Indian press and the public at large have largely sustained the anti-incumbent turnout hypothesis—especially in the run up to the May 2014 general election—empirical investigations tell a different story. In recent years, several empirical analyses casting doubt upon this hypothesis have made their way into the popular media, if not yet the scholarly literature. In an analysis of 1,174 Lok Sabha constituency elections over the course of three election cycles (1999, 2004 and 2009), Chakravarty (2014) finds no significant correlation between the level of voter turnout and the probability of an incumbent losing his or her seat. Yadav (2009) and Shrinivasan (2014) also confirm the absence of a national trend, with Shrinivasan noting a weak positive relationship between turnout levels and incumbent re-election rates.
While these analyses provide compelling evidence that there is no negative relationship between absolute levels of turnout and the probability of re-election, they do not focus on relative turnout, meas-ured in terms of the change in turnout over the previous election. Studies that have investigated the relationship between relative turnout and incumbency, however, also have generally found a weak or non-existent relationship. One analysis, contained in a Bank of America-Merrill Lynch study as reported by Ghosh (2014), finds no significant association between incumbency and relative turnout in national parlia- mentary elections dating back to 1977. In an opinion piece, Shashidhar (2014) examines national parliamentary elections in 1999 and 2004. He finds a weak relationship between changes in turnout and incumbency, significant only at the 10 per cent level.
Evidence against the anti-incumbency hypothesis can be found in state elections as well. The Bank of America-Merrill Lynch study cited above also investigates the hypothesis using state assembly election data from 2009 to 2014, again finding no clear trend.5 Kumar (2014) studies state assembly election data as far back as 1971 and fails to find signs of a strong connection between relative turnout and incumbency, while Tantri (2014) reports a weak negative correlation between relative turnout and incum-bent vote for state assembly elections between 1980 and 2012. Tantri writes that, on average, a 1 per cent increase in turnout is linked with a 0.3 per cent decline in the incumbent’s vote share. Because we are unable to locate the complete analysis, it is not immediately clear whether this result was statistically significant or if the analysis controlled for other factors.
While there do appear to be several analyses of the relationship between turnout and incumbency (a full list can be found in Table 1), we are not aware of a thorough statistical examination of this rela-tionship apart from newspaper opinion pieces or private sector research reports. This article hopes to fill this gap by looking at several decades of data from state assembly elections. Unlike many of the analyses conducted to date, we use three different measures of incumbency. Each has its own shortcomings, but by analysing all three, we hope to provide a broad picture of the relationship between turnout and incum-bency.6 Second, as discussed in the methodology section that follows, we employ a number of controls
5 Kumar (2014) replicated this analysis and also found no significant relationship.6 This is one significant difference between our analyses and those described in Tantri (2014), which also focuses on state elections during the same period.

Vaishnav and Guy 5
Table 1. Summary of Existing Analyses on Turnout and Incumbency in India
StudyTurnout measure
Outcome measure Dataset
Level of analysis Method Major findings
Chakravarty (2014)
Absolute turnout
Binary re-elect variable
Five national ‘wave’ elections: 1977, 1984, 1989, 1999, and 2004
Constituency-level
Unclear; likely ordinary least squares (OLS) regression
No significant correlation between high turnout and loss for incumbent MP
Yadav (2009) Absolute and relative turnout
Binary re-elect variable
National elections, 1967–2009
National-level Unknown No evidence of a relationship between turnout and incumbency
Shrinivasan (2014)
Absolute and relative turnout
Binary re-elect variable
National elections, 2009 and 2014
Constituency-level
Unclear; likely ordinary least squares (OLS) regression
Weakly positive, statistically significant correlation between absolute turnout and incumbency; no relationship between relative turnout and incumbency
S. Kumar (2014)
Absolute turnout
Binary re-elect variable
State assembly elections, 1989–2014
Assembly-level
Unknown No evidence of a relationship between turnout and incumbency
BOA-Merrill Lynch (2014)
Relative turnout
Binary re-elect variable
National elections, 1977–2009; state assembly elections, 2009–2014
Parliament-level and assembly-level
Unclear; likely simple inference from descriptive statistics
No evidence of a relationship between turnout and incumbency
Shashidhar (2014)
Relative turnout
Binary re-elect variable
National elections, 1999 and 2004
Constituency-level
T-test, comparing turnout changes of re-elected incumbents vs. not re-elected
Difference in means of relative turnout (when comparing incumbent wins and losses) weakly positive and significant
Tantri (2014)
Relative turnout
Change in vote share
State assembly elections, 1980–2012
Assembly-level
Unclear; likely ordinary least squares (OLS) regression
Small, negative correlation between relative turnout and incumbent vote share
D. Kumar (2014)
Relative turnout
Unclear; likely changes in vote share
Select state assembly elections, 1971–2014
Unclear; likely assembly- level
Unknown No evidence of a relationship between turnout and incumbency
Source: Authors’ analyses.

6 Studies in Indian Politics 6(1)
to account for alternative political factors that could affect incumbency. We also use state and time fixed effects to account for unrelated variation that is specific to individual states and time periods.
Data and Model
Our approach in this article is to investigate the relationship between the change in relative turnout and incumbents’ electoral performance for state assembly elections. We concentrate on the state level for a few reasons. First, there is widespread consensus among scholars that states in India are now the ‘primary venues for electoral contestation’, and that Indian citizens increasingly view state government as the most important level of governance in India’s federal system when it comes to addressing issues impacting their daily lives (Yadav & Palshikar, 2009). Second, states in India are governed by identical electoral rules. Each state is divided into single-member assembly constituencies (electoral districts) where elections function according to a ‘first-past-the-post’ system: the candidate with a plurality of the votes wins election. The party or coalition that is able to achieve majority support in the state legislature forms the government and rules the state so long as it retains this support. A full term for a government at either the state or national level is 5 years.7 The homogeneity of electoral rules across states allows researchers to exploit the significant variation that exists at the subnational level while holding institu-tional design constant. Of course, focusing on the state level also increases the number of observations available to analyse, relative to national elections.8
Data for this study were drawn primarily from election statistics compiled by the independent Election Commission of India (ECI). We use the dataset introduced in Vaishnav and Swanson (2015), which focuses on 18 major states that together comprise approximately 93 per cent of the country’s overall population. A full list of state elections contained in the dataset can be found in Table A1. In total, the dataset includes 128 assembly elections, spanning the years 1980–2012. Due to certain data limitations, the sample sizes for various regressions and tests performed later are slightly smaller, as discussed below.
Our unit of analysis is a state election, and we focus on state-wide outcomes, rather than individual assembly seats. This means that each observation in the dataset represents the aggregate outcome of all constituency elections for a given state during one election cycle.
Rather than focus on any one measure of incumbency, we focus on three outcome variables—each of which captures one important aspect of an incumbent’s electoral fortunes. The first outcome is a binary measure of incumbency (reelect), whereby the incumbent party or coalition receives a score of one if it successfully forms a new government following a fresh election, and a zero otherwise. This is a blunt measure of incumbent performance because it does not fully account for the vagaries of first-past-the-post electoral systems, in which small changes in vote shares can have a dramatic impact on the number of seats won. This is especially true in electoral systems, such as India’s, where political competition is highly fragmented. In many instances, a party will experience a declining vote share but still win the election because there are multiple, competitive parties in the fray. It is for this reason that we also capture changes in an incumbent party (or coalition’s) vote share (change_votes_percent) and seat share (change_seats_percent). Each of these indicators captures the percentage change in an incum-bent’s vote share and seat share, respectively, between the current and previous election. These latter
7 The one exception is the state of Jammu and Kashmir, where lawmakers serve 6-year terms.8 See Snyder (2001) for a detailed exploration of the benefits of subnational comparative analysis.
Vaishnav and Guy 7
two measures provide more granular assessments of the electorate’s preferences, since it is often the case that incumbents may win re-election despite losing votes, seats, or both.
Out of 128 total elections, Vaishnav and Swanson (2015) were unable to code incumbency in five cases. Of the 123 remaining elections, incumbents are victorious in 36.6 per cent of cases (or 45 elections in absolute terms). There is interesting variation over time: while incumbents emerged victorious in 44.7 per cent of elections held in the 1980s, this number plummeted to just 21.1 per cent in the 1990s—a period of significant political tumult and fragmentation in India. The ‘win rate’ of incumbents rebounded in the 2000s to 42.6 per cent, slightly below where it stood in the 1980s.
The mean change in an incumbent’s vote share is a decrease of 7.3 per cent while the average change in seat share is a decline of 24.5 per cent. Incumbents who win re-election obviously fare better: on aver-age, they experience a modest increase in vote share (0.3%) and seat share (0.4%). These latter numbers suggest that incumbents sometimes win re-election despite seeing their overall vote and seat tallies decline from the previous election.
Our key explanatory variable is the percentage change in the rate of voter turnout (change_turnout) between the current and previous state assembly elections (summary statistics for the data used in this article can be found in Table A2). We examine relative turnout rather than absolute turnout because claims about high turnout being linked with anti-incumbency outcomes are generally understood to be referring to high turnout relative to the previous election in a given state. Furthermore, different states have very different levels of voter participation. For instance, based on the elections in our dataset, the average level of voter turnout for state elections in Uttar Pradesh is 51.1 per cent, nearly 30 per cent points lower than the average voter turnout in West Bengal (79.5%). We could not identify turnout data for at least two state elections, reducing our total sample size to 126 elections. As Vaishnav and Swanson note, in some cases, it is impossible to identify the status of the incumbent or accurately measure the change in either votes or seats. As a result, the effective sample size—due to missing data in the outcome variable—is slightly smaller.9
The mean level of change_turnout is 1 per cent point, but there is marked variation across states and over time. For the elections in our dataset, the state of Jammu and Kashmir—which has been wracked by militant violence—experienced negative turnout growth (–3 %) on average. On the other hand, West Bengal averaged turnout growth over several election cycles on the order of 4 per cent points. Across all states, voter turnout has generally increased. If we divide our sample into election cycles, average state turnout was 60.6 per cent in the first period (1980–1982) rising to 68.7 per cent in the most recent period (2008–2012). One striking aspect of the turnout data is the presence of a few extreme outliers. There are six elections for which the change in voter turnout was greater than 20 per cent points in both negative and positive directions.10 For instance, turnout in Punjab’s 1992 election was 44.6 per cent points lower than for the state’s 1985 election. On the opposite end of the spectrum, turnout increased by 46.5 per cent points between Assam’s 1983 and 1985 elections. In most instances, these extreme swings in turnout were the result of armed conflict or civil unrest. These are clearly extreme cases that could potentially bias our results. In our analyses, we drop these six outliers to ensure our findings do not depend on their inclusion.11
9 The effective sample size is 122 when using the binary reelect dependent variable, 119 for change in seat share, and 118 for change in vote share. These numbers are 118, 115, and 114, respectively, when outliers are removed.10 The six outliers we identified are the 1982 state election in West Bengal, the 1983 and 1985 state elections in Assam, the 1992 and 1997 state elections in Punjab, and the 1996 state election in Jammu and Kashmir.11 All of our findings are robust to including, rather than dropping, outliers. These results are available on request. The choice of the twenty per cent change in relative turnout as the threshold for coding outliers is an arbitrary one. To check the robustness of our

8 Studies in Indian Politics 6(1)
In terms of model specification, we estimate a series of ordinary least square (OLS) regressions wherein the dependent variable is one of our three electoral outcome variables.12 We include a fixed effects term for each state in our dataset (18 in all) as well as a fixed effect term for each electoral cycle (with the exception of the first period, these are five years each) to account for time shocks felt by all states in the sample. We also include a time trend variable to account for the general increase in turnout between the beginning and end of our sample period. Finally, we cluster our standard errors at the state level.
In the baseline regressions presented below, we simply regress the change_turnout variable on our three measures of incumbent electoral performance, along with the two fixed effect parameters and time trend variable. In the multivariate extensions, we include several controls for political factors that could impact incumbent performance. First, we control for the type of alliance in the state to address differences in partisan preferences; that is, we include dummy variables for whether the incumbent party or coalition is associated with the Congress Party (INC_alliance), the Bharatiya Janata Party (BJP_ alliance), or Left parties (Left_alliance). Regional party incumbents are the reference category. Next, we control for whether the incumbent is part of a multi-party coalition (incum_coalition), since there is a literature suggesting voters might respond differently to incumbents where power is dispersed as opposed to held by a single political party (Powell & Whitten, 1993).
We also control for whether President’s Rule (pr_precedes) immediately precedes the election. President’s Rule, or an invocation of Article 356, occurs when a state comes under the direct administra-tion of the Union government and is typically utilized when a government fails, a coalition suddenly dissolves, or there is a significant domestic crisis in the state. Because these spells coincide with consid-erable political tumult, they could independently affect both incumbents’ electoral fortunes and turnout rates. Next, we control for whether a state election takes place the same year as a national election (national_election) and whether the state ruling party/coalition is aligned with the central government in Delhi (aligned_hard). Including these latter two variables allow us to account for the effect national political trends may have on state outcomes. Finally, we also control for whether a given election occurs on schedule or not (scheduled_election). A decision to hold early (unscheduled) elections taking place before a government’s 5-year term concludes could be linked to incumbent performance (whether good or bad) and thus needs to be taken into account. Appendix Table 3 contains coding details for all variables used in our analysis.
Analysis
Before getting into the results of the regression analysis, we examine some basic descriptive statistics, using scatterplots, to determine whether any pattern between changes in voter turnout and incumbent performance is immediately discernable. Figure 1 contains three scatterplots of the change in turnout (on the x-axis) against each of our three dependent variables (on the y-axis). In each plot, the overall pattern is similar: an increase in turnout seems to be associated with a loss of incumbent support. However, as alluded to earlier, there are several clear outliers (most notably, in the lower right quadrant) that
analysis to the choice of threshold, we also perform all of our analyses using thresholds of twelve and fifteen per cent for determining outliers. Our results, available on request, are consistent across all three definitions.12 One of our outcome variables, reelect, is dichotomous. We use OLS here to estimate a linear probability model. However, since there is a debate about whether one should use a logit/probit model in this circumstance, we run additional robustness tests using logistic regression. Our results do not change. The results are available on request.

Vaishnav and Guy 9
Figure 1. Relative Voter Turnout and Incumbent Electoral Performance
Source: Authors’ analyses based on ECI data compiled by Vaishnav and Swanson (2015).Notes: These plots represent the bivariate relationship between the change in turnout from the previous election (x-axis)
and three measures of incumbent performance (y-axis). The latter is measured in terms of a binary indicator of re-election, the change in vote share and the change in seat share, respectively. These plots include six outlier observations.
Figure 2. Relative Voter Turnout and Incumbent Electoral Performance, Dropping Outliers
Source: Authors’ analyses based on ECI data compiled by Vaishnav and Swanson (2015).Notes: These plots represent the bivariate relationship between the change in turnout from the previous election (x-axis)
and three measures of incumbent performance (y-axis). The latter is measured in terms of a binary indicator of re-election, the change in vote share, and the change in seat share, respectively. These plots do not include six outlier observations.

10 Studies in Indian Politics 6(1)
may skew the line of best fit downward. To investigate further, we generate another set of scatterplots (Figure 2), where we drop the six outlier observations as previously mentioned. In these plots, the picture is substantially different. Once the outliers are dropped, there does not appear to be any clear association between turnout and incumbent performance for any of the three dependent variables. In all subsequent analyses, we drop these six extreme outliers.
Another way of examining this bivariate relationship is to divide the change_turnout variable into quintiles and examine the average level of incumbent performance for each quintile. Figure 3 displays the results, where no obvious correlation between the two is visible. For instance, elections in the two highest quintiles of change_turnout saw re-election rates lower than elections in the second quintile, while the third turnout quintile exhibited by far the highest re-election rate at 61 per cent.
To summarize, based on our descriptive analyses, there appears to be a weak (but statistically insigni- ficant) bivariate relationship between the change in voter turnout and all three measures of incumbent performance. When outlier observations are removed, even this weak negative relationship seems to disappear. Of course, these basic descriptive statistics neither control for a host of possible confounding variables nor do they account for unobserved variation across states and over time.
To address both of these concerns, we now turn to more systematic regression analysis. We begin by exploring the bivariate relationship between the change in turnout and our three measures of electoral performance, including only the various fixed effects parameters and a time trend. As demonstrated by the results in Columns 1–3 of Table 2, there is no significant relationship between the change in turnout and all three electoral measures. In fact, the signs on the coefficients are inconsistent; while insignificant across the board, the coefficient on the change_turnout variable is positive in Columns 1 and 2 while negative in Column 3.
Figure 3. Quintiles of Relative Voter Turnout and Incumbent Electoral Performance
Source: Authors’ analyses based on ECI data compiled by Vaishnav and Swanson (2015).Note: This chart does not include six outlier observations.

Vaishnav and Guy 11
Table 2. Bivariate Regression Results of Relative Turnout on Incumbent Electoral Performance
Dependent variable(1) (2) (3)
re-elect change_seats_percent change_votes_percent
change_turnout 0.01 0.07 –0.08(0.01) (0.31) (0.15)
Constant 0.14 –49.38** –25.01***(0.34) (18.06) (7.38)
Observations 118 115 114Number of states 18 18 18Adjusted R-squared 0.17 0.33 0.42
Source: Authors’ analyses based on ECI data compiled by Vaishnav and Swanson (2015).Notes: (i) Robust standard errors clustered at the state-level in parentheses. All models include state and election cycle fixed
effects and a time trend. (ii) *** p < 0.01, ** p < 0.05, * p < 0.1.
Table 3. Multivariate Regression Results of Relative Turnout on Incumbent Electoral Performance
Dependent variable(1) (2) (3)
reelect change_seats_percent change_votes_percent
change_turnout 0.00 0.29 0.02(0.01) (0.30) (0.12)
INC_alliance –0.05 –5.56 0.55(0.13) (7.33) (3.32)
BJP_alliance –0.11 –7.40 –3.69(0.21) (9.46) (5.53)
Left_alliance –0.39* –19.70*** –7.95**(0.20) (6.27) (2.96)
incum_coalition –0.03 –2.87 –4.21(0.23) (8.03) (3.71)
pr_precedes –0.22 –1.20 0.02(0.15) (6.05) (3.21)
national_election 0.12 3.45 –0.49(0.10) (4.33) (2.51)
aligned_hard –0.10 –2.01 –0.63(0.10) (5.45) (2.62)
scheduled_election –0.25* –18.16*** –10.11***(0.13) (4.96) (2.73)
Constant 0.49 –35.88 –17.49(0.46) (27.32) (12.60)
Observations 118 115 114Number of states 18 18 18Adjusted R-squared 0.20 0.40 0.49
Source: Authors’ analyses based on ECI data compiled by Vaishnav and Swanson (2015).Notes: (i) Robust standard errors clustered at the state-level in parentheses. All models include state and election cycle fixed
effects and a time trend. (ii) *** p < 0.01, ** p < 0.05, * p < 0.1.

12 Studies in Indian Politics 6(1)
Our multivariate analyses, in which we control for a range of possible confounding political factors, provide more evidence of a null relationship. These results, contained in Table 3, are in line with the baseline results discussed above. Columns 4–6 demonstrate no correspondence between change in turn-out and incumbent performance. Insofar as the controls are concerned, only two are significant across most models: a dummy variable indicating that the incumbent is a Left party (or coalition) and a dummy variable indicating scheduled elections. There are very few (only 10) observations in the dataset when a state has a Left incumbent, and the effect could be the result of just one state—Kerala—where there has been a steady pattern of alternation between the Congress-led United Democratic Front (UDF) and the Communist-led Leftist Democratic Front (LDF). The scheduled rather elections indicator variable is more interesting. Incumbents’ prospects at the ballot box are generally less favourable when they com-plete a full term and hold elections as originally scheduled than when early elections are called. This is somewhat surprising, given the expectation that early elections typically take place when there is some kind of crisis within a state, which would likely reflect poorly upon the incumbent. Of course, there are cases where an incumbent decides to call an early election because it wants to consolidate its political advantage.
The impact of scheduled versus unscheduled elections deserves closer scrutiny. To the degree one is concerned about the endogeneity of voter turnout, election timing can provide additional analytic lever-age. Insofar as incumbent performance has an impact on turnout, we would expect to see this to be more apparent for unscheduled elections for the reasons mentioned above. This supposition, of course, does not mean that reverse causality is not an issue for scheduled elections taking place at the end of a govern-ment’s 5-year term. Indeed, we are necessarily cautious about making causal claims in our analysis. Nevertheless, there are good reasons to expect endogeneity to be a more significant issue for elections held off-schedule.
To explore whether the relationship between turnout and incumbents’ electoral fortunes is fundamen-tally different during scheduled versus unscheduled elections, we rerun the model by dividing the sample into those elections that occurred on schedule and those that did not. The results, displayed in Table 4, again indicate no clear association between turnout change and incumbent performance, irrespective of election type. In unscheduled elections, the sign on the change_turnout coefficient is negative (but only
Table 4. Assessing Differences in Scheduled Versus Unscheduled Elections
Dependent variable
(1) (2) (3) (4) (5) (6)
re-elect reelectchange_seats_
percentchange_seats_
percentchange_votes_
percentchange_votes_
percent
change_turnout –0.02 0.00 –0.59 0.50 –2.55*** 0.11(0.05) (0.01) (3.21) (0.35) (0.40) (0.17)
INC_alliance –0.30 0.00 –40.95** 1.60 1.32 –0.08(0.25) (0.14) (16.24) (6.72) (11.52) (2.72)
BJP_alliance –0.25 0.02 –68.34*** 6.28 –29.19*** –0.78(0.33) (0.24) (17.32) (8.93) (7.18) (4.14)
Left_alliance –0.51 –0.12 –25.24** –11.61 –2.75 –6.32(0.55) (0.20) (11.91) (9.56) (19.29) (3.69)
incum_coalition 0.24 –0.02 49.72*** –0.81 31.22* –5.09(0.59) (0.21) (13.55) (7.77) (16.36) (3.43)
(Table 4 continued)
Vaishnav and Guy 13
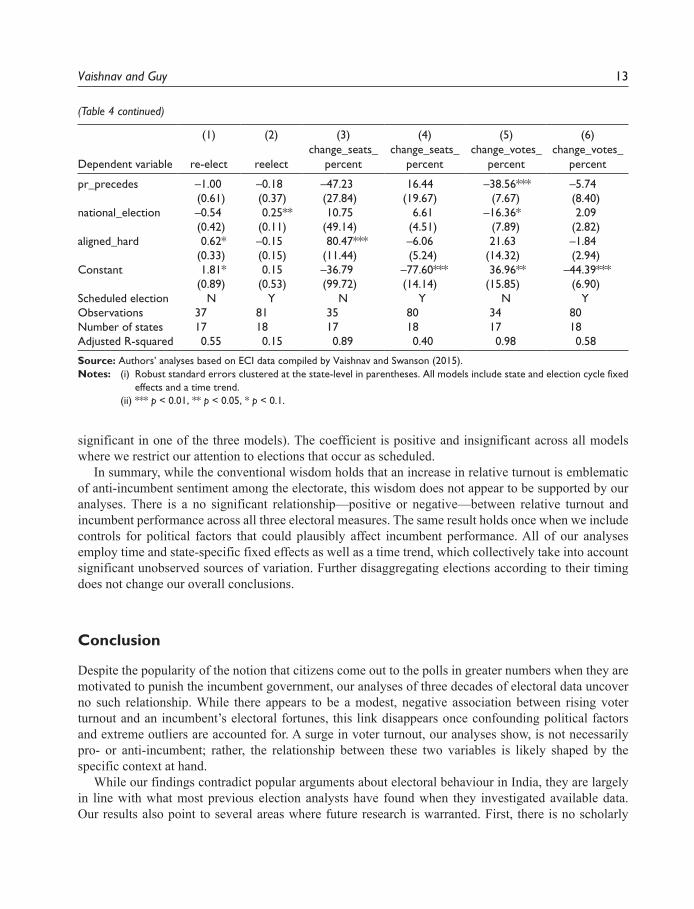
significant in one of the three models). The coefficient is positive and insignificant across all models where we restrict our attention to elections that occur as scheduled.
In summary, while the conventional wisdom holds that an increase in relative turnout is emblematic of anti-incumbent sentiment among the electorate, this wisdom does not appear to be supported by our analyses. There is a no significant relationship—positive or negative—between relative turnout and incumbent performance across all three electoral measures. The same result holds once when we include controls for political factors that could plausibly affect incumbent performance. All of our analyses employ time and state-specific fixed effects as well as a time trend, which collectively take into account significant unobserved sources of variation. Further disaggregating elections according to their timing does not change our overall conclusions.
Conclusion
Despite the popularity of the notion that citizens come out to the polls in greater numbers when they are motivated to punish the incumbent government, our analyses of three decades of electoral data uncover no such relationship. While there appears to be a modest, negative association between rising voter turnout and an incumbent’s electoral fortunes, this link disappears once confounding political factors and extreme outliers are accounted for. A surge in voter turnout, our analyses show, is not necessarily pro- or anti-incumbent; rather, the relationship between these two variables is likely shaped by the specific context at hand.
While our findings contradict popular arguments about electoral behaviour in India, they are largely in line with what most previous election analysts have found when they investigated available data. Our results also point to several areas where future research is warranted. First, there is no scholarly
Dependent variable
(1) (2) (3) (4) (5) (6)
re-elect reelectchange_seats_
percentchange_seats_
percentchange_votes_
percentchange_votes_
percent
pr_precedes –1.00 –0.18 –47.23 16.44 –38.56*** –5.74(0.61) (0.37) (27.84) (19.67) (7.67) (8.40)
national_election –0.54 0.25** 10.75 6.61 –16.36* 2.09(0.42) (0.11) (49.14) (4.51) (7.89) (2.82)
aligned_hard 0.62* –0.15 80.47*** –6.06 21.63 –1.84(0.33) (0.15) (11.44) (5.24) (14.32) (2.94)
Constant 1.81* 0.15 –36.79 –77.60*** 36.96** –44.39***(0.89) (0.53) (99.72) (14.14) (15.85) (6.90)
Scheduled election N Y N Y N YObservations 37 81 35 80 34 80Number of states 17 18 17 18 17 18Adjusted R-squared 0.55 0.15 0.89 0.40 0.98 0.58
Source: Authors’ analyses based on ECI data compiled by Vaishnav and Swanson (2015).Notes: (i) Robust standard errors clustered at the state-level in parentheses. All models include state and election cycle fixed
effects and a time trend. (ii) *** p < 0.01, ** p < 0.05, * p < 0.1.
(Table 4 continued)

14 Studies in Indian Politics 6(1)
consensus as to why rates of incumbency in India are so low (Ravishankar, 2009; Uppal, 2009). Across 123 elections for which we have data, incumbents are re-elected roughly one-third of the time (36.6%), which is in stark contrast to the high incumbency rates in advanced democracies such as the USA (Klašnja, 2015, 2016). Similarly, there has been little theorizing regarding the great variance in incum-bent electoral performance over time. While the baseline level of incumbency was around 50 per cent in the 1980s, that number was cut in half in the 1990s before rebounding to pre-existing levels in the 2000s. Data from a much wider set of elections going back further in time confirm this pattern, but also report re-election rates averaging 85 per cent between 1951 and 1966 (Kumar, Sardesai & Gupta, 2013). Such long-term and dramatic fluctuations in incumbency rates extend far beyond the duration of any particular ruling government, raising questions about possible structural changes in voter behaviour that might help explain these overarching trends.
Second, a promising new line of research examines the role of performance shaping the decisions made by voters on Election Day. While numerous studies have pointed to issues such as caste, ethnicity or parochialism, more recent work suggests that Indian voters are now more inclined to vote based on the performance of a given incumbent. For instance, recent evidence from Gupta and Panagariya (2014) as well as Vaishnav and Swanson (2015) suggest that voters are increasingly rewarding incumbent governments on the basis of macroeconomic growth during their time in office. If this is the case, could the improved fortunes of incumbent governments be linked to the deepening of economic voting?
Finally, higher levels of voter turnout are also worthy of deeper analysis. Some scholars have sug-gested that rising turnout is at least, in part, driven by the fact that states have superseded the central government as the primary venue of political contestation (Yadav & Palshikar, 2009). As more power is devolved from New Delhi to the states, the argument goes, voters will increasingly focus their attention on state-level contests, where the outcome of the election can have a more direct impact on their daily lives. Other scholars such as Kapoor and Ravi (2014) have highlighted the role of female empowerment in increasing overall levels of turnout. In fact, in a majority of states, women now turn out to vote in greater proportions than men—a stark reversal of prior trends. Finally, some observers such as Quraishi (2014) argue that rising turnout is a reflection of reforms instituted by the Election Commission of India (ECI), which have improved electoral registries, poll safety, and ease of voting. Locating answers to these lingering questions can help researchers unpack the determinants of electoral performance, the potentially changing nature of incumbency, and the extent to which changing voter participation patterns explain variation in both.
AcknowledgementsThe authors are grateful to Reedy Swanson, who contributed to the dataset upon which this study is built and to an anonymous reviewer for excellent comments on a previous draft. They also acknowledge helpful research assistance from Rebecca Brown, William Hayes, and Matthew Lillehaugen. Milan Vaishnav would like to acknowledge ¿QDQFLDO�VXSSRUW�IURP�WKH�+XUIRUG�)RXQGDWLRQ�

Vaishnav and Guy 15
Appendix
Table A1. State Elections in the Dataset
State name Election years
Andhra Pradesh 1983, 1985, 1989, 1994, 1999, 2004, 2009Assam 1983*, 1985, 1991, 1996, 2001, 2006, 2011Bihar 1980, 1985, 1990, 1995, 2000, 2005 (Feb), 2005 (Oct), 2010Delhi 1993*, 1998, 2003, 2008Gujarat 1980, 1985, 1990, 1995, 1998, 2002, 2007, 2012Haryana 1982, 1987, 1991, 1996, 2000, 2005, 2009Himachal Pradesh 1982, 1985, 1990, 1993, 1998, 2003, 2007, 2012Jammu and Kashmir 1983, 1987, 1996, 2002, 2008Karnataka 1983, 1985, 1989, 1994, 1999, 2004, 2008Kerala 1980, 1982, 1987, 1991, 1996, 2001, 2006, 2011Madhya Pradesh 1980, 1985, 1990, 1993, 1998, 2003, 2008Maharashtra 1980, 1985, 1990, 1995, 1999, 2004, 2009Odisha 1980, 1985, 1990, 1995, 2000, 2004, 2009Punjab 1980, 1985, 1992*, 1997, 2002, 2007, 2012Rajasthan 1980, 1985, 1990, 1993, 2003, 2008Tamil Nadu 1980, 1984, 1989, 1991, 1996, 2001, 2006, 2011Uttar Pradesh 1980, 1985, 1989, 1991, 1993, 1996*, 2002, 2007, 2012West Bengal 1982, 1987, 1991, 1996, 2001, 2006, 2011
Source: Vaishnav and Swanson (2015).Note: * Identity of incumbent indeterminate.
Table A2. Summary Statistics
Variable n Mean Std. Dev. Min Max
change_turnout 126 1.02 9.88 –44.60 46.50Reelect 123 0.37 0.48 0 1change_seats_percent 120 –24.55 26.49 –94.02 39.71change_votes_percent 119 –7.35 12.28 –44.90 14.40INC_alliance 128 0.41 0.49 0 1BJP_alliance 128 0.24 0.43 0 1Left_alliance 128 0.08 0.27 0 1incum_coalition 125 0.23 0.42 0 1pr_precedes 127 0.24 0.43 0 1national_election 128 0.45 0.50 0 1aligned_hard 125 0.42 0.49 0 1scheduled_election 128 0.69 0.47 0 1
Source: Authors’ analyses based on ECI data compiled by Vaishnav and Swanson (2015).

16 Studies in Indian Politics 6(1)
Table A3. Coding Details
change_seats_percent: Percentage change in share of seats won by incumbent.change_votes_percent: Percentage change in share of votes won by incumbent.reelect: Binary indicator of incumbent re-election.change_turnout: Difference in voter turnout between the current election and the previous election.INC_alliance: Binary indicator of incumbent government headed by Indian National Congress.BJP_alliance: Binary indicator of incumbent government headed by BJP.Left_alliance: Binary indicator of incumbent government headed by Communist Party of India or Communist
Party of India (Marxist).Regional_alliance: Binary indicator of incumbent government headed by a regional party.incum_coalition: Binary indicator of incumbent government ruling as a coalition of parties.national_election: Binary indicator of national election year.pr_precedes: Binary indicator of whether President’s Rule (Article 356) is operative going into elections.aligned_hard: Binary indicator of whether incumbent is also a part of the national ruling alliance.scheduled_election: Binary indicator of election held as per pre-ordained schedule.
Source: Vaishnav and Swanson (2015).
ReferencesAhuja, A., & Chhibber, P. (2012). Why the poor vote in India: “If I don’t vote, I am dead to the state.” Studies in
Comparative International Development, 47(4), 389–410.Chakravarty, P. (2014, May 3). High turnout doesn’t signal a wave. Times of India. Retrieved 2 August 2016, from
KWWS���WLPHVR¿QGLD�LQGLDWLPHV�FRP�QHZV�+LJK�WXUQRXW�GRHVQW�VLJQDO�D�ZDYH�DUWLFOHVKRZ����������FPVFirstpost. (2014, April 18). Election 2014: Does a high voter turnout mean good news for BJP?. Retrieved 4 August
�������IURP��KWWS���ZZZ�¿UVWSRVW�FRP�SROLWLFV�HOHFWLRQ������GRHV�D�KLJK�YRWHU�WXUQRXW�PHDQ�JRRG�QHZV�IRU�EMS� 1485317.html
Ghosh, J. (2014, May 3). Higher voter turnout = anti-incumbency? Business Standard. Retrieved 2 August 2016, from http://www.business-standard.com/article/opinion/high-voter-turnout-anti-incumbency-114050300583_1.html
Grofman, B., Owen, G., & Collet, C. (1999). Rethinking the partisan effects of higher turnout: So what’s the ques-tion? Public Choice, 99(3), 357–376.
Gupta, P., & Panagariya, A. (2014). Growth and election outcomes in a developing country. Economics and Politics, 26(2), 332–354.
Hajnal, Z. (2010). America’s uneven democracy: Race, turnout, and representation. New York: Cambridge University Press.
Hajnal, Z., & Trounstine, J. (2005). Where turnout matters: The consequences of uneven turnout in city politics. Journal of Politics, 67(2), 515–535.
Hansford, T., & Gomez, B. T. (2010). Estimating the electoral effects of voter turnout. American Political Science Review, 104(2), 268–288.
Heath, O. (2005). Party systems, political cleavages and electoral volatility in India: A state-wise analysis, 1998–1999. Electoral Studies, 24(2), 177–199.
Kapoor, M., & Ravi, S. (2014). Women voters in Indian democracy: A silent revolution. Economic and Political Weekly, 49(12), 63–67.
Kashyap, S. (1970). The politics of defection: The changing contours of the political power structure in state politics in India. Asian Survey, 10(3), 195–208.
Klašnja, M. (2015). Corruption and the incumbency disadvantage: Theory and evidence. Journal of Politics, 77(4), 928–942.
———. (2016). Increasing rents and incumbency disadvantage. Journal of Theoretical Politics, 28(2), 225–265.

Vaishnav and Guy 17
Kumar, D. (2014, May 1). Multiple factors behind increased voter turnout. Mint. Retrieved 10 August 2016, from http://www.livemint.com/Opinion/Te9fcM0nRGu9bOAceOVkkI/Multiple-factors-behind-increased-voter-turnout.html
Kumar, S., Sardesai, S., & Gupta, P. (2013). The weakening of electoral anti-incumbency. Economic and Political Weekly, 48(13), 128–131.
Naig, U. (2016, May 22). For AIADMK, high jinks over high turnout. Hindu. Retrieved 12 September 2017, from http://www.thehindu.com/news/national/tamil-nadu/for-aiadmk-high-jinks-over-high-turnout/article8631146.ece
Powell, G. B., & Whitten, G. (1993). A cross-national analysis of economic voting: Taking account of the political context. American Journal of Political Science, 37(2), 391–414.
Press Trust of India. (2012, December 17). Voter turnout in Gujarat gives rise to pro-incumbency factor: Narendra Modi. Retrieved 20 August 2016, from http://archive.indianexpress.com/news/voter-turnout-in-gujarat-gives-rise- to-proincumbency-factor-narendra-modi/1046603/
Quraishi, S. Y. (2014). An undocumented wonder: The making of the great Indian election. Kolkata: Rupa Publications.
Ravishankar, N. (2009). The cost of ruling: Anti-incumbency in elections. Economic and Political Weekly, 44(10), 92–98.
Shashidhar, K. (2014, April 28). What high voter turnouts mean. Mint. Retrieved 8 August 2016, from http://www.livemint.com/Opinion/XILImEBUbiIt4MsDmBDbPN/What-high-voter-turnouts-mean.html
Shrinivasan, R. (2014, May 19). Not how many, but who voted made the difference. Hindu. Retrieved 1 August 2016, from http://www.thehindu.com/opinion/op-ed/not-how-many-but-who-voted-made-the-difference/arti-cle6022959.ece
Snyder, Richard. (2001). Scaling down: The subnational comparative method. Studies in Comparative International Development, 36(1), 93–110.
Tantri, P. (2014, April 21). Column: Is high voter turnout anti-incumbent? Indian Express. Retrieved 6 August 2016, from http://archive.indianexpress.com/news/column-is-high-voter-turnout-antiincumbent-/1242326/
Trounstine, J. (2013). Turnout and incumbency in local elections. Urban Affairs Review, 49(2), 167–189.Uppal, Y. (2009). The disadvantaged incumbents: Estimating incumbency effects in Indian state legislatures. Public
Choice, 138(1/2), 9–27.Vaishnav, M., & Swanson, R. (2015). Does good economics make for good politics? Evidence from Indian states.
India Review, 14(3), 279–311.Yadav, Y. (2009, April 13). The truth about theories on turnout. Hindu. Retrieved 30 July 2016, from http://www.
thehindu.com/todays-paper/the-truth-about-theories-on-turnout/article305804.eceYadav, Y., & Palshikar, S. (2009). Between Fortuna and Virtu: Explaining the Congress’ ambiguous victory in 2009.
Economic and Political Weekly, 44(39), 33–46.
Author’s Biography
Milan Vaishnav is a Senior Fellow and Director of the South Asia Program at the Carnegie Endowment for International Peace in Washington, D.C.
Johnathan Guy is a Research Assistant at the University of Chicago and was previously an intern at the Carnegie Endowment for International Peace.