does integrating strategic risk information in the balanced scorecard
TRANSCRIPT
Does integrating strategic risk information in the balanced scorecard affect managers’
strategy evaluations and recommendations?
Mandy M. Cheng
The University of New South Wales
Kerry A. Humphreys
The University of New South Wales
Yichelle Zhang
The University of New South Wales
Preliminary Draft
May 2014
Please do not quote
Does integrating strategic risk information in the balanced scorecard
affect managers’ strategy evaluations and recommendations?
Abstract
Managers are increasingly aware that strategic decisions need to be made in the context of
strategic risk assessments. It has been proposed that performance management systems, such as
the balanced scorecard (BSC), are useful frameworks for integrating strategic risks with
performance information, to allow managers a more comprehensive overview of their strategy.
In this study, we conduct an experiment to investigate whether integrating strategic risk
information in a BSC and the risk profile of a strategy affect managers’ strategy evaluation and
recommendation decisions. Specifically, we provide participants with strategic risk information
either as a stand-alone list, or incorporated in the BSC (an integrated approach). We also
manipulate whether the strategy has relatively higher risks associated with performance drivers
(performance driver risks) or relatively higher risks associated with performance outcomes
(performance outcome risks). Our results show that participants make less favorable decisions
when performance driver risks are higher than performance outcome risks. Further, this
difference is greater for strategy recommendation decisions when the strategic risks are
integrated in the BSC. Our results contribute to our understanding of the decisional impacts of
integrating strategic risks with performance information in a BSC.
1
Does integrating strategic risk information in the balanced scorecard
affect managers’ strategy evaluations and recommendations?
INTRODUCTION
An important challenge faced by organizations is to connect strategic risk management
with performance management. As strategy execution inevitably involves risks, analyzing
strategic risks allow managers to get a better understanding of the performance and viability of
their strategies (PricewaterhouseCoopers 2009). Consequently, organizations internationally are
focusing attention on simultaneously improving their measurement, management and reporting
of risks and strategic performance (Kaplan 2009, Ernst & Young 2012; Hall, Mikes and Millo
2013). A strategic risk is an “unintended event or set of conditions which reduce the ability of
managers to implement their intended business strategies” (Simons 2000: 255). Examples of
strategic risks include changes in competitors’ behavior, critical errors in internal processes, and
loss of technological capabilities. Unless these risks are effectively managed, they have
potentially significant negative impacts on organizational performance1. Hence, strategic risks
have relevance to both the evaluation of a strategy’s performance and the prediction of the
continued success of a strategy. In particular, an understanding of strategic risks allows managers
to evaluate the performance of the existing strategy in light of its effect on the organization’s
overall risk exposure, as well as to appraise potential impediments when deciding on whether to
continue a strategy in the future (Ittner and Larcker 2009; Kaplan 2009).
1 It is sometimes argued that strategic risks also include ‘upside risks’ – that is, opportunities for upside gains, as well as threats that have potentials adverse consequences. Upside risk identification is particularly important for developing new strategic plans or new product markets. As the focus of the current study is on evaluating an existing strategy, we limit our discussion only to the more common definition of strategic risks – risks that represent threats to the successful implementation of business strategies. We also restrict our focus on strategic risks that are “known unknowns” rather than “unknown unknowns” (Kaplan and Mikes 2011).
2
To facilitate management of strategic risks, consultants and risk management
practitioners have advocated the integration of formal risk assessment with strategic planning
and performance management (e.g., Ernst & Young 2012; Frigo and Anderson 2009). Although
risk management tends to remain a distinctive function within many organizations, the strategic
risk information generated from the risk management process is often discussed and examined
by managers together with strategic performance information (e.g., Hall et al. 2013). However, it
is unclear how strategic risk information is best presented to managers to help them integrate risk
and performance information in their decisions. Given that strategic performance management
systems (SPMS) such as the balanced scorecard (BSC) are designed to help managers monitor
and evaluate business strategies (Cheng and Humphreys 2012; Tayler 2010; Kaplan and Norton
2004), they are logical conduits to also incorporate strategic risks information to aid managerial
decision making (HBR Roundtable 2009; Frigo and Anderson 2009). Yet, there has been very
limited empirical research on whether the integration of strategic risk information with a BSC
has any decision impacts. To address this research gap, this study investigates whether the
integration of strategic risk information in the BSC affect managers’ evaluation of a strategy’s
performance and their strategy recommendation decisions. As different business strategies have
different risk profiles (i.e., the nature, likelihood and magnitude of different risks associated with
a strategy), this study specifically examines whether integrating strategic risk information in the
BSC influence managers’ differential response to strategies with different risk profiles.
We are particularly interested in two strategy-related decisions where an understanding of
strategic risks is relevant, namely, strategy evaluation and strategy recommendation. Strategy
evaluation is a backward looking, retrospective decision which involves managers assessing the
performance of an implemented strategy. In contrast, strategy recommendation is a forward
3
looking, prospective decision which involves managers making a recommendation on whether to
continue/expand the strategy in the future. Examining both types of decision is important
because prior literature has suggested that individuals distinguish between forward looking and
backward looking decisions (e.g., Barone and DeCarlo 2012). Strategic risks are relevant when
managers evaluate the performance of a strategy because improved performance can come at the
expense of increased strategic risks, which can adversely affect overall organizational
sustainability. Strategic risks are also clearly relevant to strategy recommendation decisions
because they represent factors that may impede the strategy’s successes in the future.
In this study, we conduct an experiment to investigate the effect of integrating strategic
risks in the BSC and a strategy’s risk profile on both decisions. We draw on prior literature on
information organization (e.g., Manies and McDaniel 2000; Lipe and Salterio 2002) and causal
status theory (e.g., Rehder and Kim 2006; Yopchick and Kim 2009) to argue that managers are
more concerned with strategic risks associated with performance drivers, than strategic risks
associated with performance outcomes. Further, managers’ differential reactions to these two
types of risks are greater when the strategic risk information is integrated in the BSC. In our
experiment, participants received information about a strategy’s strategic risk information either
as on a separate, stand-alone report, or as part of a risk-integrated BSC (“strategic risk
integration” manipulation). In addition, we also manipulate the strategic risk profiles associated
with the strategy under consideration. We provide participants with strategic risk information
indicating that the strategy has either relatively higher risks associated with its performance
outcomes (high performance outcome risks), or relatively higher risks associated with its
4
performance drivers (high performance driver risks)2. We focus on these two types of strategic
risk profiles because the existing literature has emphasized the importance of understanding both
performance drivers and performance outcomes when evaluating strategies (e.g., Kaplan and
Norton 2004; Tayler 2010).
Our results show that participants evaluate the strategy less favorably, and are less likely
to recommend expanding the strategy to other business units, when the strategy has relatively
higher performance driver risks than performance outcome risks. Consistent with our
expectation, we also find that the difference in both strategy-related decisions between the two
types of strategic risk profiles is greater when the strategic risks are integrated in the BSC than
when the strategic risks are presented as a separate list. Further analysis shows that while
participants perceive strategic risk information as more important under a stand-alone approach,
an integrated approach cause participants to place greater importance on performance driver risks
when the strategy is associated with high performance driver risks. This suggests that an
integrated approach enables managers to integrate both strategic risk and performance
information.
Our study contributes to the literature in a number of ways. First, our study is one of the
first to examine the decision impacts of integrating strategic risks in the BSC. Despite the various
calls from practitioners for greater integration of strategic risk assessment and performance
management (e.g., PricewaterhouseCoopers 2009), there has been limited empirical research on
how such integration can be achieved, and the effect of such an approach. A number of
accounting studies have examined the process of managing strategic risks in organizations, and
2 Consistent with prior literature (e.g., Ittner, Larcker and Myer 2003), we consider performance measures relating to financial and customer-related performance as performance outcome measures, and performance measures relating to processes, capabilities, learning and innovation as performance drivers.
5
how strategic risks are determined (e.g., Mikes 2009). However, to our best know, none has
directly investigated whether strategic decisions are influenced by how strategic risk information
is presented in conjunction with other strategic performance information. In this study, we argue
that one approach is to connect relevant strategic risks to strategic performance measures by
presenting both together in the BSC. We provide empirical evidence that integrating strategic
risks in the BSC this way increases the relative influence of performance driver risks compared
to performance outcome risks, when managers are making strategy recommendations. Our result
therefore suggests that integrating strategic risks on the BSC encourages managers to consider
the risks associated with longer term prospects of their strategy.
Second, our results show that managers’ strategy-related decisions are influenced by the
strategy’s risk profile. Although tools such as the heat maps and risk event cards have been
proposed to profile and to manage risks, these tools tend to focus on the magnitude and/or
likelihood of risks, but not the qualitative nature of strategic risks how these attributes affect
strategy-related decisions. Here, we categorize strategic risks into performance driver risks and
performance outcome risks, and show that individuals are more concerned with the former when
evaluating a strategy’s performance and when making strategy recommendations. In practice,
companies often attempt to commensurate qualitatively different types of risks in their risk maps
in order to prioritize them (Jordan, Jørgensen and Mitterhofer 2013); our findings suggest that
companies also need to consider the nature of the risks – whether they are performance driver
risks or performance outcome risks – when combining them on their risk maps.
Third, our finding also contributes to our understanding of the differential roles
performance drivers and performance outcomes play in managerial decision-making. While prior
research has shown that individuals pay more attention to performance outcomes than
6
performance drivers when evaluating managerial performance (e.g., Ittner, Larcker and Meyer
2003), our study suggests that individuals are more concerned with strategic risks that affect
performance drivers than those which affect performance outcomes.
Fourth, our study contributes to the limited but expanding literature on how the BSC can
aid strategic decision-making (e.g., Cheng and Humphreys 2012; Tayler 2010). Prior literature
on the BSC predominately focused on using the BSC to evaluate managers’ performance, and in
particular, on addressing the cognitive biases associated with using the BSC in performance
evaluation (e.g., Lipe and Salterio 2000; Banker, Chang and Pizzini 2004; Humphreys and
Trotman 2011; see also Salterio 2012). Our study extends the literature on the BSC by examining
the role of the BSC in enabling managers to interpret strategic risk factors when making strategy-
related decisions.
The rest of the paper is structured as follows. First, we discuss the differences between a
stand-alone approach and an integrated approach of strategic risk presentation. Next, we develop
hypotheses on the effect of strategic risk integration and the strategy’s strategic risk profile on
managers’ performance evaluation decision and strategy recommendation decision. We then
outline our research method, result analysis, and finally, our summary and conclusion.
THEORY AND HYPOTHESES DEVELOPMENT
Integrating risks on the BSC: a stand-alone approach versus a risk integration approach
A distinguishing feature of SPMS, such as the BSC, is the presentation of a set of
financial and non-financial performance objectives, measures and targets across multiple
scorecard perspectives that together provide a coherent view of an organization’s strategy
(Kaplan and Norton 2004; Chenhall 2005). These performance objectives, measures and their
7
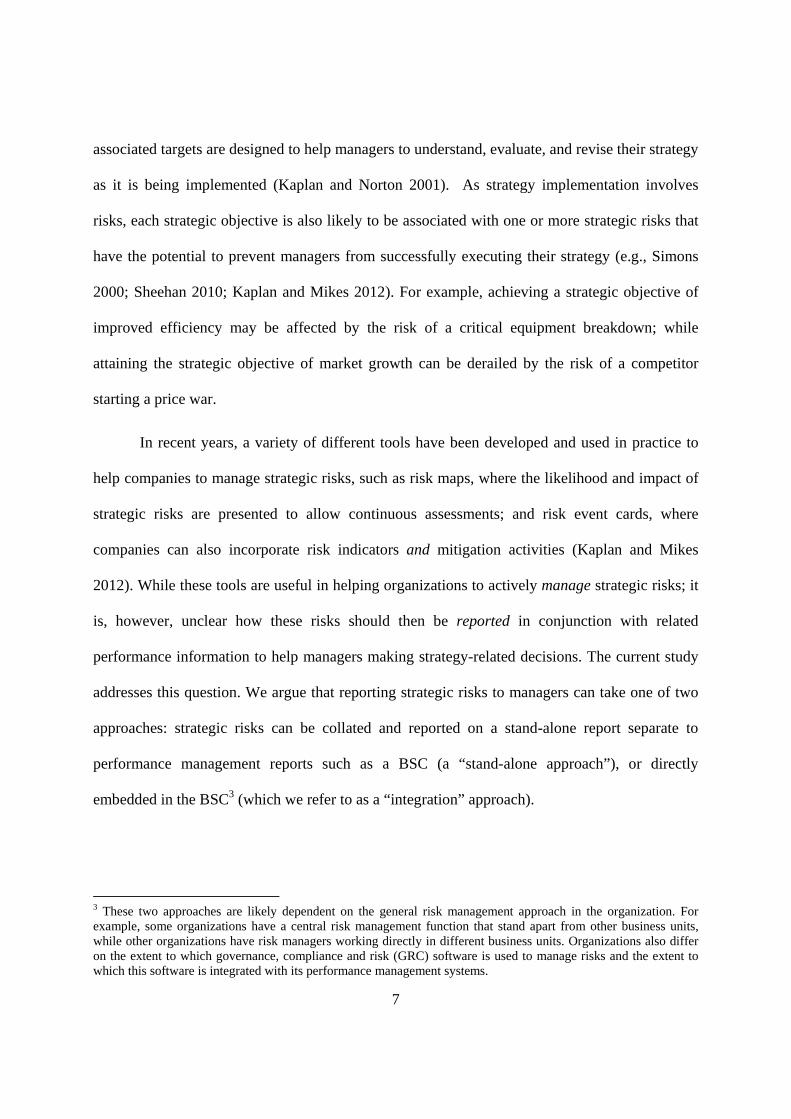
associated targets are designed to help managers to understand, evaluate, and revise their strategy
as it is being implemented (Kaplan and Norton 2001). As strategy implementation involves
risks, each strategic objective is also likely to be associated with one or more strategic risks that
have the potential to prevent managers from successfully executing their strategy (e.g., Simons
2000; Sheehan 2010; Kaplan and Mikes 2012). For example, achieving a strategic objective of
improved efficiency may be affected by the risk of a critical equipment breakdown; while
attaining the strategic objective of market growth can be derailed by the risk of a competitor
starting a price war.
In recent years, a variety of different tools have been developed and used in practice to
help companies to manage strategic risks, such as risk maps, where the likelihood and impact of
strategic risks are presented to allow continuous assessments; and risk event cards, where
companies can also incorporate risk indicators and mitigation activities (Kaplan and Mikes
2012). While these tools are useful in helping organizations to actively manage strategic risks; it
is, however, unclear how these risks should then be reported in conjunction with related
performance information to help managers making strategy-related decisions. The current study
addresses this question. We argue that reporting strategic risks to managers can take one of two
approaches: strategic risks can be collated and reported on a stand-alone report separate to
performance management reports such as a BSC (a “stand-alone approach”), or directly
embedded in the BSC3 (which we refer to as a “integration” approach).
3 These two approaches are likely dependent on the general risk management approach in the organization. For example, some organizations have a central risk management function that stand apart from other business units, while other organizations have risk managers working directly in different business units. Organizations also differ on the extent to which governance, compliance and risk (GRC) software is used to manage risks and the extent to which this software is integrated with its performance management systems.
8
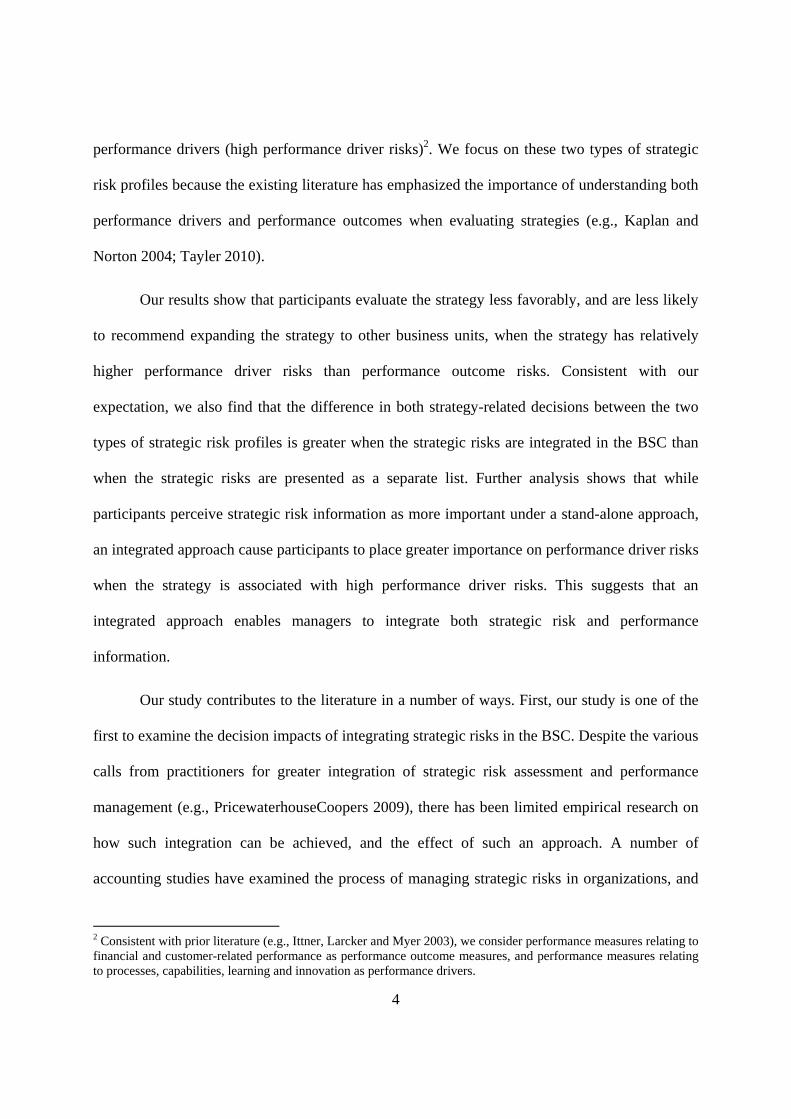
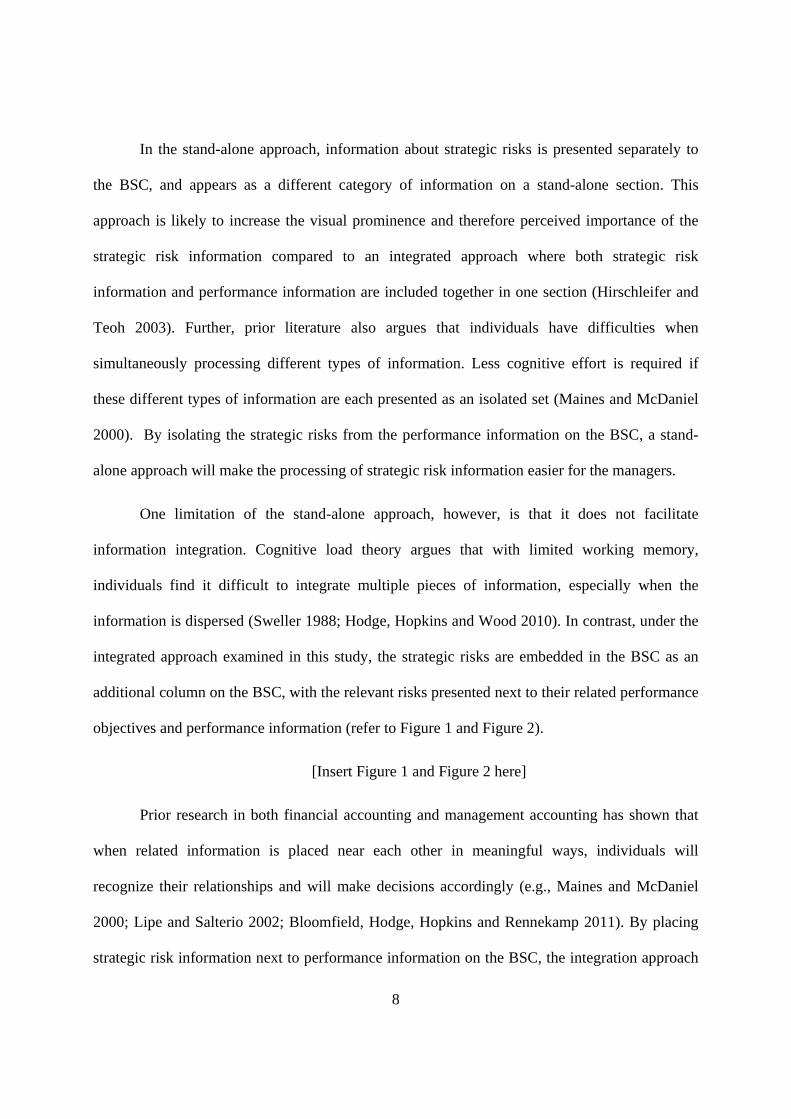
In the stand-alone approach, information about strategic risks is presented separately to
the BSC, and appears as a different category of information on a stand-alone section. This
approach is likely to increase the visual prominence and therefore perceived importance of the
strategic risk information compared to an integrated approach where both strategic risk
information and performance information are included together in one section (Hirschleifer and
Teoh 2003). Further, prior literature also argues that individuals have difficulties when
simultaneously processing different types of information. Less cognitive effort is required if
these different types of information are each presented as an isolated set (Maines and McDaniel
2000). By isolating the strategic risks from the performance information on the BSC, a stand-
alone approach will make the processing of strategic risk information easier for the managers.
One limitation of the stand-alone approach, however, is that it does not facilitate
information integration. Cognitive load theory argues that with limited working memory,
individuals find it difficult to integrate multiple pieces of information, especially when the
information is dispersed (Sweller 1988; Hodge, Hopkins and Wood 2010). In contrast, under the
integrated approach examined in this study, the strategic risks are embedded in the BSC as an
additional column on the BSC, with the relevant risks presented next to their related performance
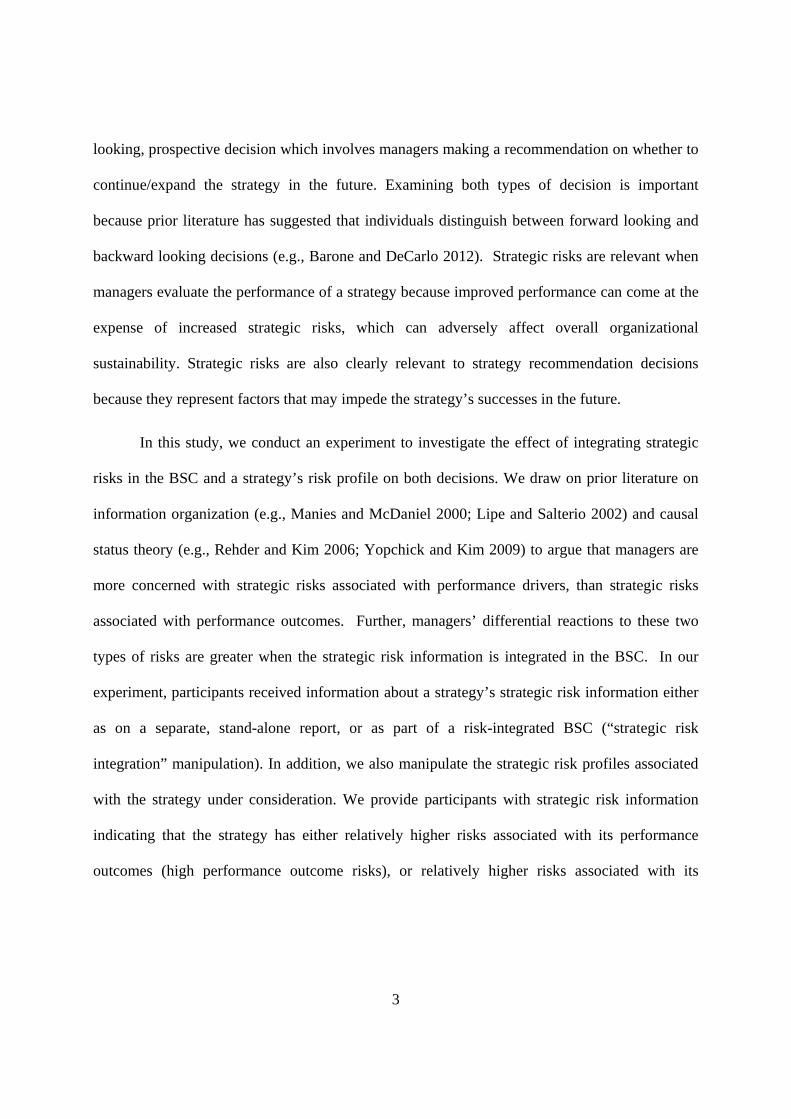
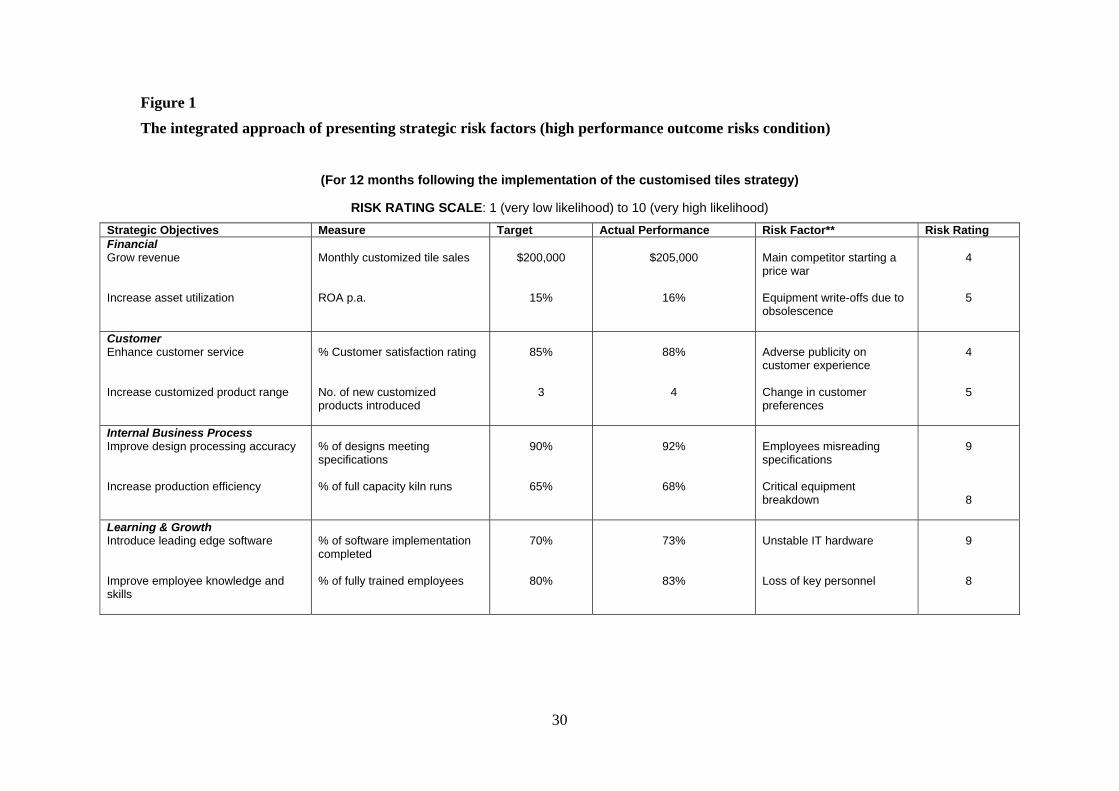
objectives and performance information (refer to Figure 1 and Figure 2).
[Insert Figure 1 and Figure 2 here]
Prior research in both financial accounting and management accounting has shown that
when related information is placed near each other in meaningful ways, individuals will
recognize their relationships and will make decisions accordingly (e.g., Maines and McDaniel
2000; Lipe and Salterio 2002; Bloomfield, Hodge, Hopkins and Rennekamp 2011). By placing
strategic risk information next to performance information on the BSC, the integration approach
9
increases the perceived linkage between the strategic risks and the strategy’s performance in the
four BSC categories. Further, the integration approach also increases the physical proximity of
the strategic risk information relative to the strategy’s performance information. The proximity
compatibility principle suggests that displaying related information close together in a common
location lead to greater integration of information (Carswell and Wickens 1996; Hodge et al.,
2010). Hence, we expect the integrated approach to better enable managers to interpret the
strategic risk information in the context of the strategy’s strategy and strategic performance.
In summary, a stand-alone approach makes strategic risk information more prominent
and reduces the cognitive effort associated with processing this information. However, an
integration approach allows managers to relate the strategic risk information to the strategy’s
performance. In the following section, we propose that by enhancing the perceived connectivity
between strategic risk information to performance information via a BSC, the integrated
approach will sensitize managers to the nature of the strategic risks and therefore the overall risk
profile of a strategy.
Strategic risk profiles, strategic risk presentation and strategy evaluation decisions
A strategic risk profile contains strategic risk information including the nature, magnitude
and likelihood assessments of an organization’s strategic risks (Frigo and Anderson 2009). When
evaluating the performance of a strategy, managers tend to also consider the current risks
associated with the strategy (Ittner and Larcker 2009). Hall et al. (2013) explore how risk
managers exert their influence in organizations and document that risk reports appear to help
managers better understand their strategy, and that risk profile information forms part of the
10
discussions when managers are evaluating their current strategy. In this study, we focus on two
types of strategic risks, performance driver risks and performance outcome risks.
Specifically, a SPMS incorporates strategic objectives and measures for both the drivers
and the outcomes of a strategy’s performance (Kaplan and Norton 1996; Ittner et al. 2003).
Performance measures relating to financial and customer-related performance are generally
considered as outcome measures, while those relating to business processes, capabilities,
learning and innovation are referred to as leading indicators or driver measures (Ittner et al.
2003; Atkinson, Kaplan, Matsumura and Young 2007; Guo, Libby, Wong-on-Wing and Yang
2011). As strategic risks are derived directly from an organization’s strategic objectives and
measures, they are associated with either performance outcomes or performance drivers4.
Following from the performance measurement literature, we label strategic risks associated with
performance outcomes as performance outcome risks, and strategic risks associated with
performance drivers as performance driver risks.
The risk profiles of strategies can vary depending on the relative importance of either
type of strategic risks5. For example, consider a company pursuing a growth strategy that
focuses on the introduction of new products to an emerging customer segment. A decision to
expand operation quickly by acquiring small suppliers or using inexperienced contract staff may
increase the risks of a breakdown of critical processes or equipment (a performance driver risk).
On the other hand, selling to a new customer segment via a social media marketing initiative
may increase the risks of adverse reactions by the customers (a performance outcome risk).
4 This view is supported by Robert Kaplan (HBR Roundtable 2009), who has suggested that managers can compute risk scores for each of the perspective of a BSC, by assessing the magnitude and impact of events that can put each strategic objective in jeopardy. 5 A risk profile describes an organization or a strategy’s risk exposure; it commonly describes both magnitude and the likelihood of potential impact of the identified risk factors. As will be discussed later, our experiment hold constant the potential impact but vary the likelihood of occurrence of performance outcome risks versus performance driver risks.
11
During the strategy implementation process, these strategic risks may be mitigated or
exacerbated depending how they are managed. We propose that even when the strategy’s
performance is held constant and positive, managers will be more concerned with performance
driver risks than performance outcome risks.
Specifically, a high level of performance driver risks means that an organization’s
business processes and capability development are threatened. Processes and capabilities are
central to a strategy, and to the whole organization, because they allow financial and customer
outcomes to be attained (Kaplan and Norton 2004). Therefore, any threats that potentially affect
processes and capability development will also threaten financial and customer outcomes. In
other words, because performance drivers drive desirable financial and customer outcomes, a
heightened risk to performance drivers will have both a direct effect (on related performance
drivers) and an indirect effect (on customer and financial performance outcomes). In contrast,
any strategic risks to financial and customer outcomes are not likely to affect performance
drivers6.
Prior cognitive psychology literature studying individuals’ causal thinking has argued
that a cause is perceived to be more important if it has multiple effects (Rehder and Kim 2006),
or if it is a root cause (the ultimate cause) of a chain of causal relationship (Yopchick and Kim
2009). Known as the causal status, the literature argues that causes have “generative power”, a
capacity to influence subsequent outcomes, and individuals tend to place more weight on causes
that have higher generative power (Rehder and Kim 2006). In the current context, we argue that
6 It may be argued that over multiple periods, financial and customer performance outcomes may affect the ability of an organization to continue to provide resources to improve business processes and capabilities. Hence, financial and customer performance outcomes may have some flow-on impacts on performance drivers. However, such effects are likely to be ambiguous and weak, and an organization may not allocate all of its new financial resources to improve the processes and capabilities relevant to the strategy.
12
because performance driver risks have wider potential negative implications than performance
outcome risks, they will have a stronger influence on managers’ strategy evaluation decisions.
Hence, holding the level of performance constant, we expect managers to evaluate a strategy that
has higher performance driver risks (relative to performance outcome risks) less favorably than a
strategy with higher performance outcome risks (relative to performance driver risks).
However, managers’ responses to performance outcome risks and performance driver
risks are likely to differ depending on whether the strategic risk information is integrated in a
BSC. As discussed earlier, an integration approach facilitates information integration by
explicitly and visually linking the strategic risk factors with their associated strategic objectives,
measures and targets. In doing so, the integration approach is likely to highlight the distinction
between performance driver risks and performance outcome risks. In contrast, although a stand-
alone approach may increase the prominence of the strategic risk information, it does not
encourage information integration. Thus, managers given a stand-alone approach may be less
able to distinguish between performance driver risks and performance outcome risks. Based on
the above discussion, we propose the following interaction hypothesis:
H1: The tendency of managers to evaluate strategy with high performance driver risks
less favorably than a strategy with high performance outcome risks is greater under an
integrated approach compared with a stand-alone approach.
Strategic risk profiles, strategic risk presentation and strategy recommendation decisions
Next, we consider managers’ strategy recommendation decisions. Unlike a strategy
evaluation decision, which requires managers to evaluate the performance of a strategy, a
13
strategy recommendation decision is forward looking and demands managers to predict the
performance of the strategy in the future. We draw on the Construal Level Theory (CLT) to
argue that the effect outlined in H1 is likely to be even more significant when managers are
making strategy recommendation decisions.
CLT proposes that when an individual is considering an object or event that is
psychologically distant (i.e., removed from the self), they tend to emphasize features or aspects
of the event that are at a higher construal level; whereas when the event or objective is
psychologically close, the focus will be on features/aspects of a lower construal level (Troupe
and Liberman 2003; Troupe, Liberman and Wakslak 2007). Psychological distance has many
dimensions, including spatial distance (e.g., geographic proximity), social distance (e.g., self
versus others), and of particular relevance here, the temporal distance: psychological distance is
greater when an individual is considering an event in the distant future than rather than in the
present. In the current context, the requirement to make a strategy recommendation means that
managers need to think about the strategy in the more distant future. This will in turn cause
managers to focus their attention to higher construal aspects of the strategy. According to CLT,
causes and effects are high and low construal aspects, respectively, because effects are
subordinate to causes (Rim, Hansen and Trope 2013). That is, effects depend on causes, but not
vice versa. As performance drivers cause performance outcomes to change, we argue that they
are related to a higher construal aspect of a strategy than performance outcomes. Therefore,
when managers make a strategy recommendation decision, they will be more concerned with
strategic risks which affect performance drivers than those that affect performance outcomes.
Further, consistent with our argument for H1, we expect the differential effect of performance
driver risks and performance outcome risks on strategy recommendation decisions will be
14
strengthened by explicitly strategic risks to their related performance objectives, measures and
targets. This leads to our second interaction hypothesis:
H2: The increased likelihood of managers recommending a strategy with high
performance driver risks than one with high performance outcome risks is greater under
an integrated approach compared with a stand-alone approach.
RESEARCH METHOD
Research design overview
We examine our research question and hypotheses using a 2x2 between-subjects
experiment. The two independent variables are strategic risk integration (a stand-alone approach
or an integrated approach) and strategic risk profile (a risk profile characterized by either high
performance driver risks or high performance outcome risks). In addition, we also include a
control group where participants do not receive any risk information.
Participants assume the role of a newly appointed national manager who is examining the
performance a strategy implemented 12 months ago in one of the company’s three business
locations7. Participants are provided with the strategy’s performance information in the format of
a BSC (including objectives, measures, targets and actual performance arranged in the four BSC
perspectives). The actual performance of the strategy is positive – all targets have been met or
exceeded. Importantly, the business unit’s performance is held constant across all treatments and
the control group.
7 To avoid the influence of motivated reasoning, participants are told that the strategy was recommended by a business consultant.
15
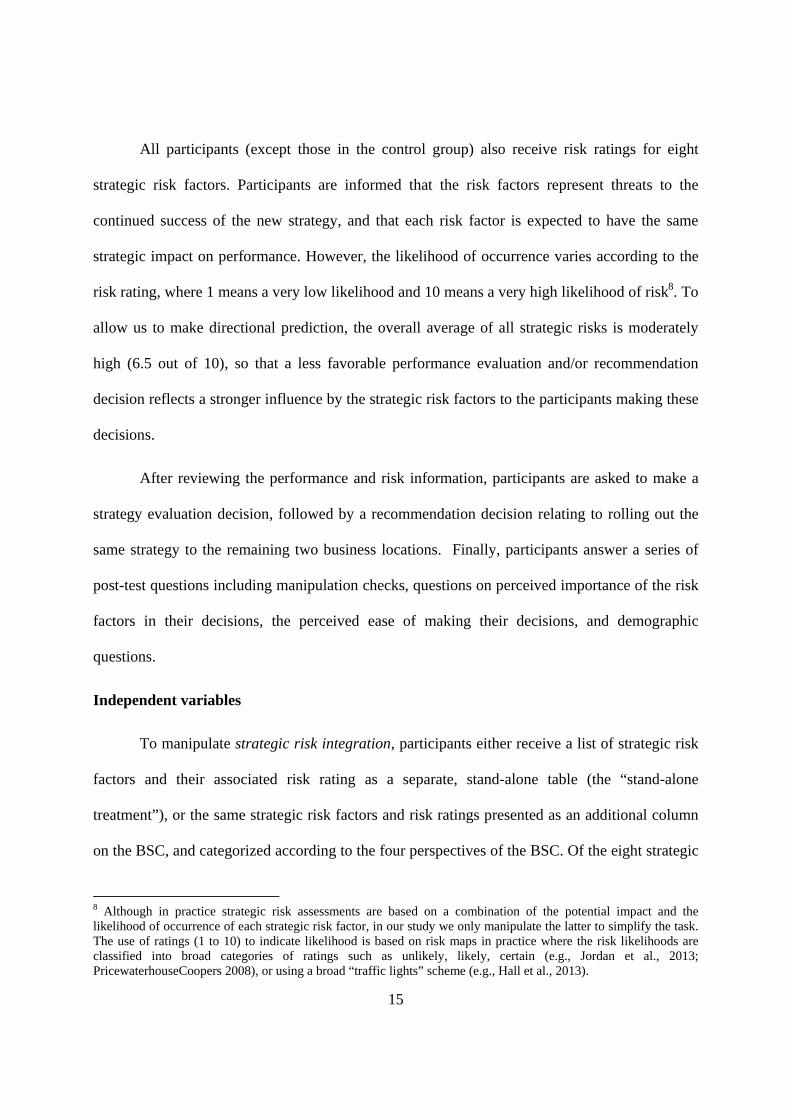
All participants (except those in the control group) also receive risk ratings for eight
strategic risk factors. Participants are informed that the risk factors represent threats to the
continued success of the new strategy, and that each risk factor is expected to have the same
strategic impact on performance. However, the likelihood of occurrence varies according to the
risk rating, where 1 means a very low likelihood and 10 means a very high likelihood of risk8. To
allow us to make directional prediction, the overall average of all strategic risks is moderately
high (6.5 out of 10), so that a less favorable performance evaluation and/or recommendation
decision reflects a stronger influence by the strategic risk factors to the participants making these
decisions.
After reviewing the performance and risk information, participants are asked to make a
strategy evaluation decision, followed by a recommendation decision relating to rolling out the
same strategy to the remaining two business locations. Finally, participants answer a series of
post-test questions including manipulation checks, questions on perceived importance of the risk
factors in their decisions, the perceived ease of making their decisions, and demographic
questions.
Independent variables
To manipulate strategic risk integration, participants either receive a list of strategic risk
factors and their associated risk rating as a separate, stand-alone table (the “stand-alone
treatment”), or the same strategic risk factors and risk ratings presented as an additional column
on the BSC, and categorized according to the four perspectives of the BSC. Of the eight strategic
8 Although in practice strategic risk assessments are based on a combination of the potential impact and the likelihood of occurrence of each strategic risk factor, in our study we only manipulate the latter to simplify the task. The use of ratings (1 to 10) to indicate likelihood is based on risk maps in practice where the risk likelihoods are classified into broad categories of ratings such as unlikely, likely, certain (e.g., Jordan et al., 2013; PricewaterhouseCoopers 2008), or using a broad “traffic lights” scheme (e.g., Hall et al., 2013).
16
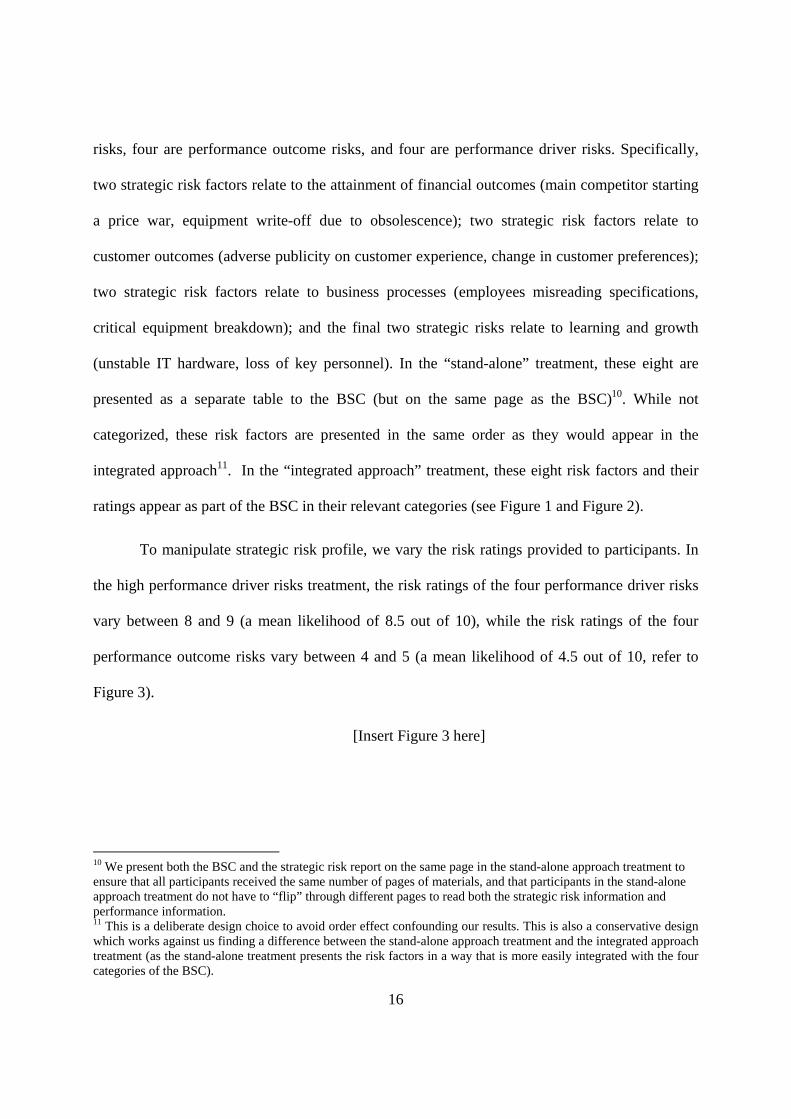
risks, four are performance outcome risks, and four are performance driver risks. Specifically,
two strategic risk factors relate to the attainment of financial outcomes (main competitor starting
a price war, equipment write-off due to obsolescence); two strategic risk factors relate to
customer outcomes (adverse publicity on customer experience, change in customer preferences);
two strategic risk factors relate to business processes (employees misreading specifications,
critical equipment breakdown); and the final two strategic risks relate to learning and growth
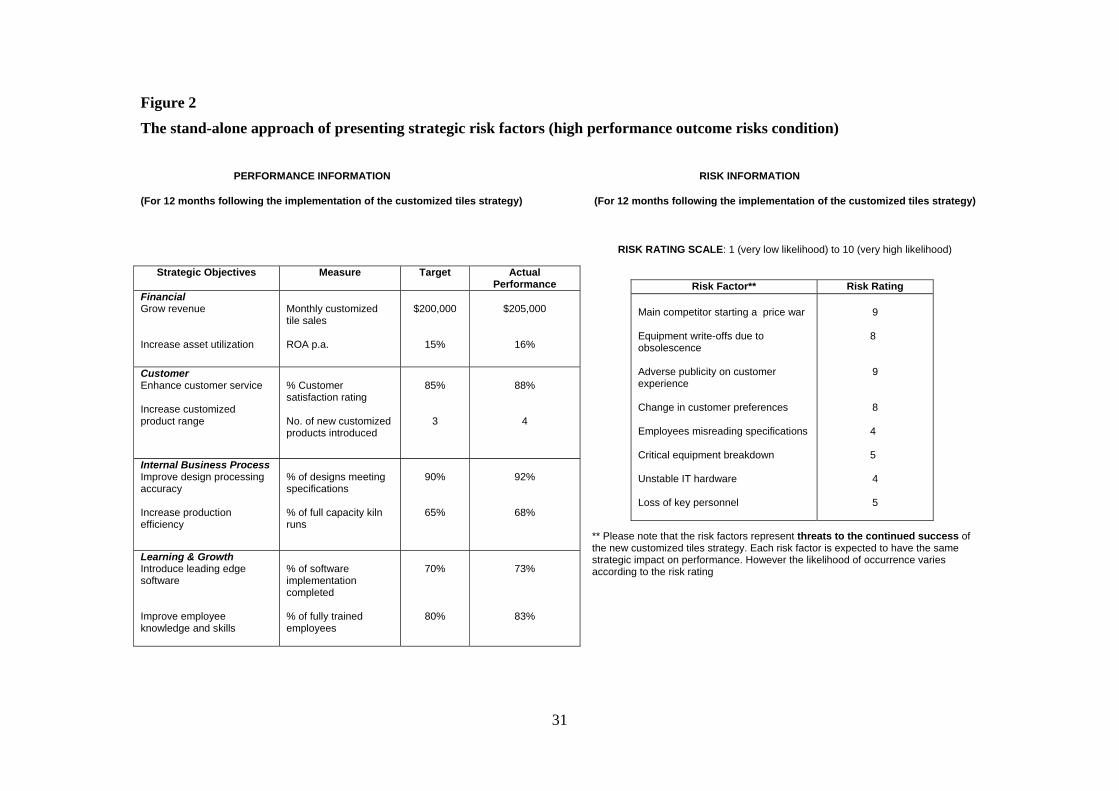
(unstable IT hardware, loss of key personnel). In the “stand-alone” treatment, these eight are
presented as a separate table to the BSC (but on the same page as the BSC)10. While not
categorized, these risk factors are presented in the same order as they would appear in the
integrated approach11. In the “integrated approach” treatment, these eight risk factors and their
ratings appear as part of the BSC in their relevant categories (see Figure 1 and Figure 2).
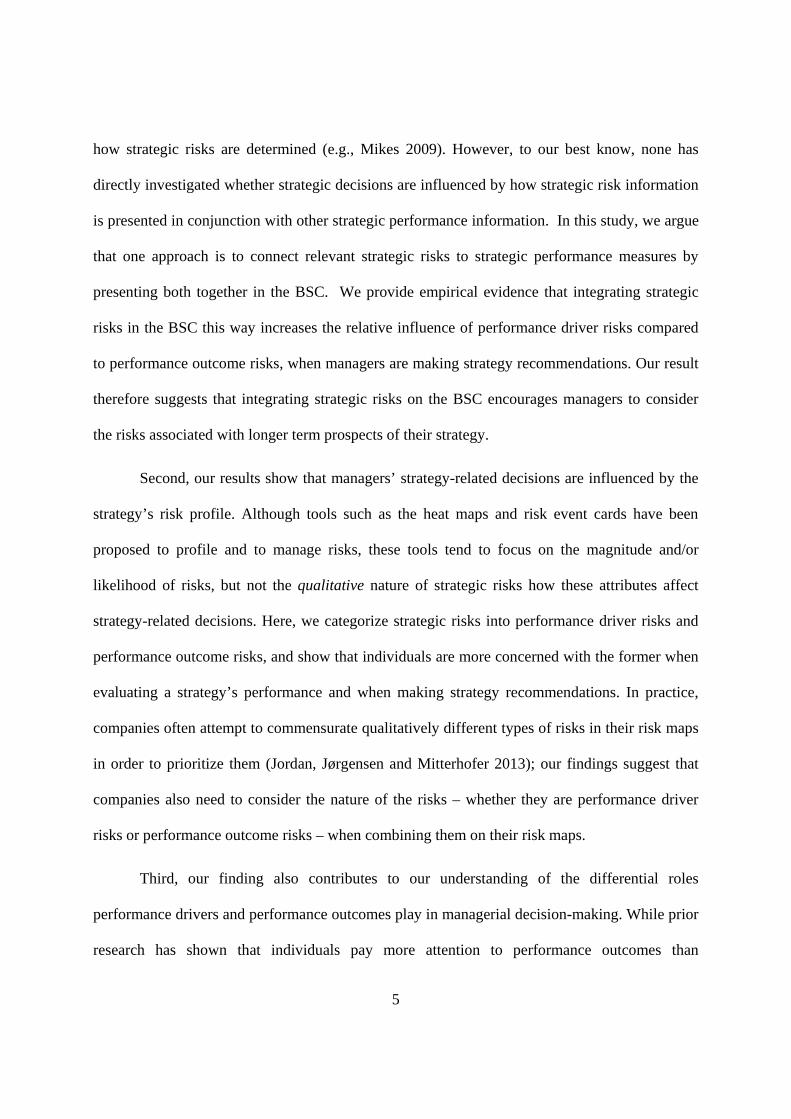
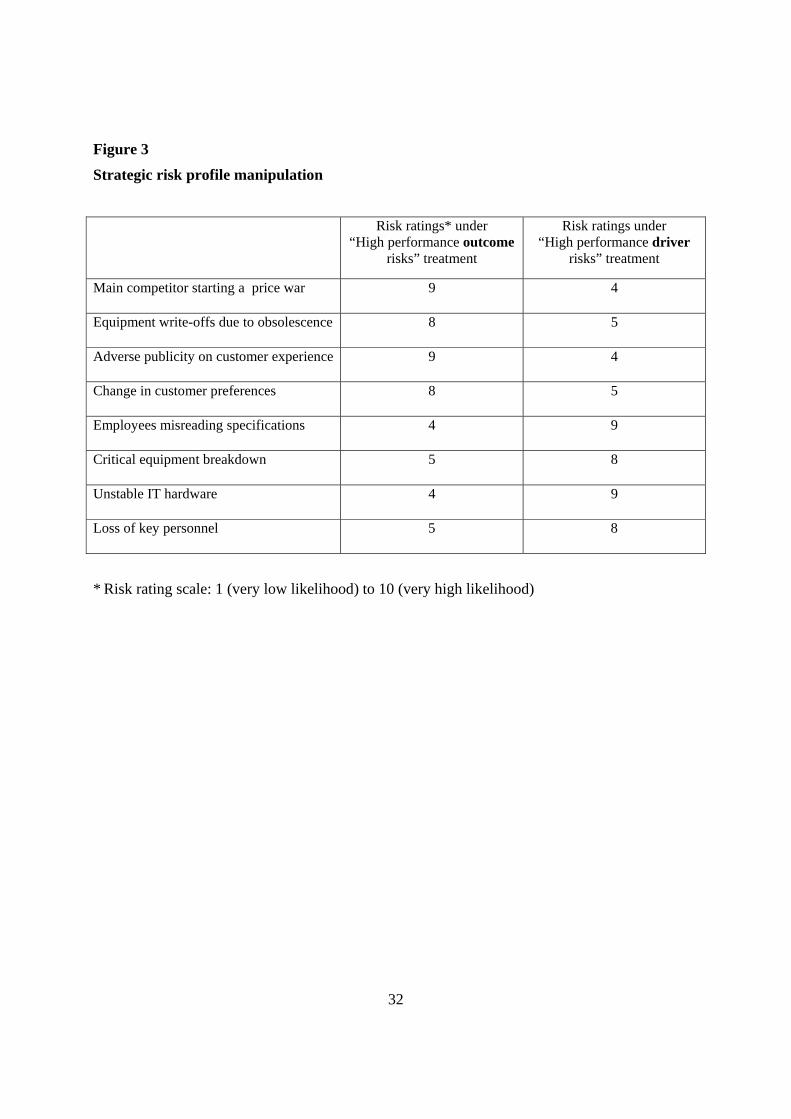
To manipulate strategic risk profile, we vary the risk ratings provided to participants. In
the high performance driver risks treatment, the risk ratings of the four performance driver risks
vary between 8 and 9 (a mean likelihood of 8.5 out of 10), while the risk ratings of the four
performance outcome risks vary between 4 and 5 (a mean likelihood of 4.5 out of 10, refer to
Figure 3).
[Insert Figure 3 here]
10 We present both the BSC and the strategic risk report on the same page in the stand-alone approach treatment to ensure that all participants received the same number of pages of materials, and that participants in the stand-alone approach treatment do not have to “flip” through different pages to read both the strategic risk information and performance information. 11 This is a deliberate design choice to avoid order effect confounding our results. This is also a conservative design which works against us finding a difference between the stand-alone approach treatment and the integrated approach treatment (as the stand-alone treatment presents the risk factors in a way that is more easily integrated with the four categories of the BSC).
17
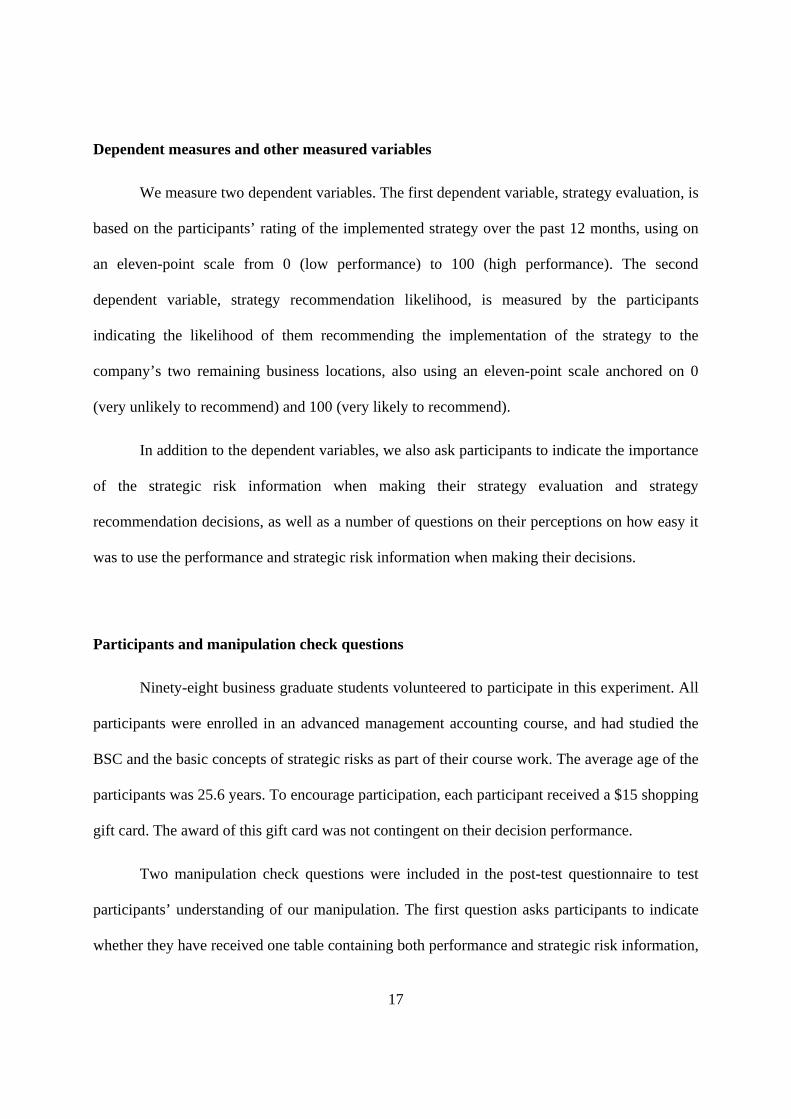
Dependent measures and other measured variables
We measure two dependent variables. The first dependent variable, strategy evaluation, is
based on the participants’ rating of the implemented strategy over the past 12 months, using on
an eleven-point scale from 0 (low performance) to 100 (high performance). The second
dependent variable, strategy recommendation likelihood, is measured by the participants
indicating the likelihood of them recommending the implementation of the strategy to the
company’s two remaining business locations, also using an eleven-point scale anchored on 0
(very unlikely to recommend) and 100 (very likely to recommend).
In addition to the dependent variables, we also ask participants to indicate the importance
of the strategic risk information when making their strategy evaluation and strategy
recommendation decisions, as well as a number of questions on their perceptions on how easy it
was to use the performance and strategic risk information when making their decisions.
Participants and manipulation check questions
Ninety-eight business graduate students volunteered to participate in this experiment. All
participants were enrolled in an advanced management accounting course, and had studied the
BSC and the basic concepts of strategic risks as part of their course work. The average age of the
participants was 25.6 years. To encourage participation, each participant received a $15 shopping
gift card. The award of this gift card was not contingent on their decision performance.
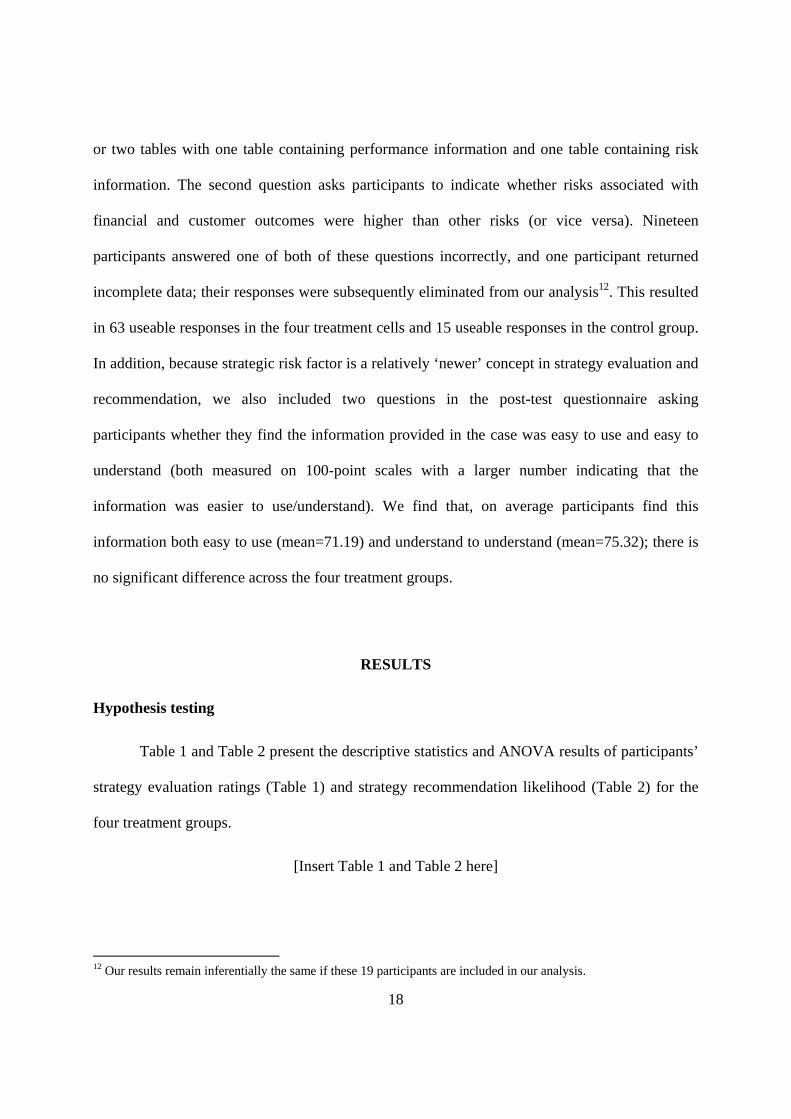
Two manipulation check questions were included in the post-test questionnaire to test
participants’ understanding of our manipulation. The first question asks participants to indicate
whether they have received one table containing both performance and strategic risk information,
18
or two tables with one table containing performance information and one table containing risk
information. The second question asks participants to indicate whether risks associated with
financial and customer outcomes were higher than other risks (or vice versa). Nineteen
participants answered one of both of these questions incorrectly, and one participant returned
incomplete data; their responses were subsequently eliminated from our analysis12. This resulted
in 63 useable responses in the four treatment cells and 15 useable responses in the control group.
In addition, because strategic risk factor is a relatively ‘newer’ concept in strategy evaluation and
recommendation, we also included two questions in the post-test questionnaire asking
participants whether they find the information provided in the case was easy to use and easy to
understand (both measured on 100-point scales with a larger number indicating that the
information was easier to use/understand). We find that, on average participants find this
information both easy to use (mean=71.19) and understand to understand (mean=75.32); there is
no significant difference across the four treatment groups.
RESULTS
Hypothesis testing
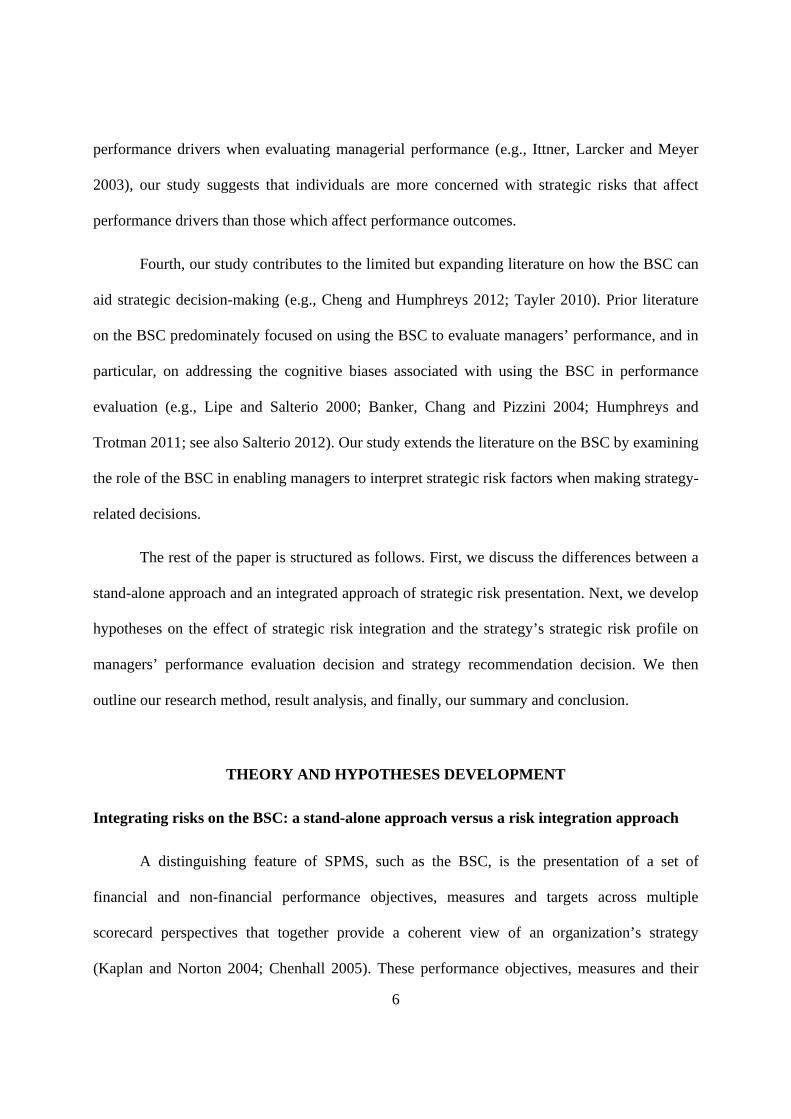
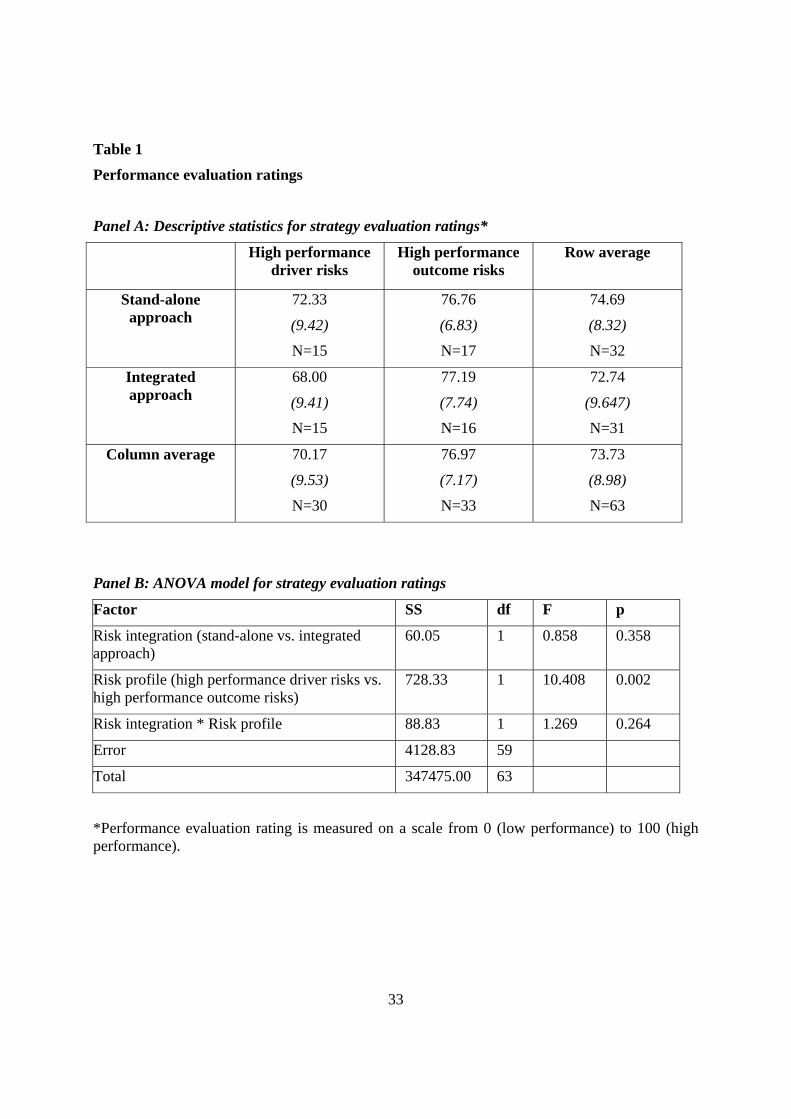
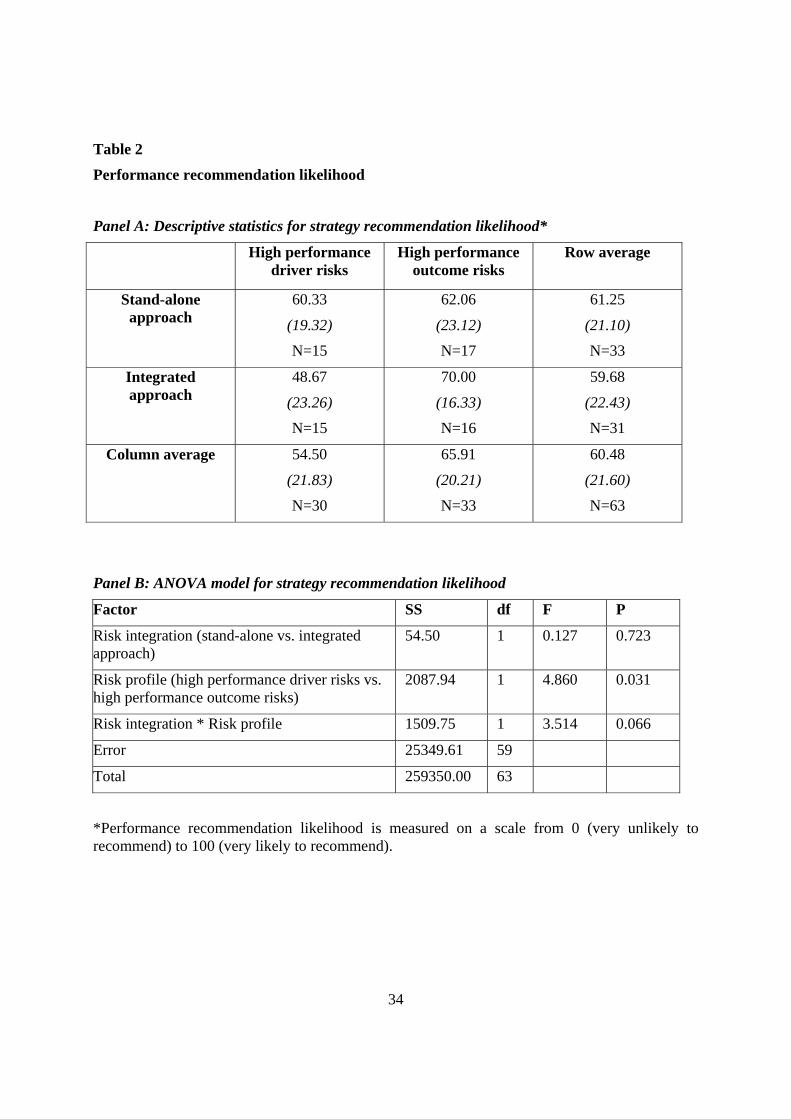
Table 1 and Table 2 present the descriptive statistics and ANOVA results of participants’
strategy evaluation ratings (Table 1) and strategy recommendation likelihood (Table 2) for the
four treatment groups.
[Insert Table 1 and Table 2 here]
12 Our results remain inferentially the same if these 19 participants are included in our analysis.
19
As shown in Table 1 Panel A, participants in the integrated approach treatment have a
slightly lower average performance evaluation rating than those in the stand-alone approach
treatment (72.74 vs. 74.69); however, the ANOVA results reported in Table 1 Panel B shows an
insignificant main effect for risk integration (F=0.858, p=0.358), indicating that this difference is
not significant. Similarly, while the average strategy recommendation likelihood is also lower in
the integrated approach treatment than the stand-alone approach treatment (59.68 vs. 61.25,
Table 2 Panel A), the ANOVA results in Table 2 Panel B again shows an insignificant main
effect for risk integration (F=0.127, p=0.723). Thus, we find no significant overall effect of
presenting strategic risks using an integrated approach compared with a stand-alone approach.
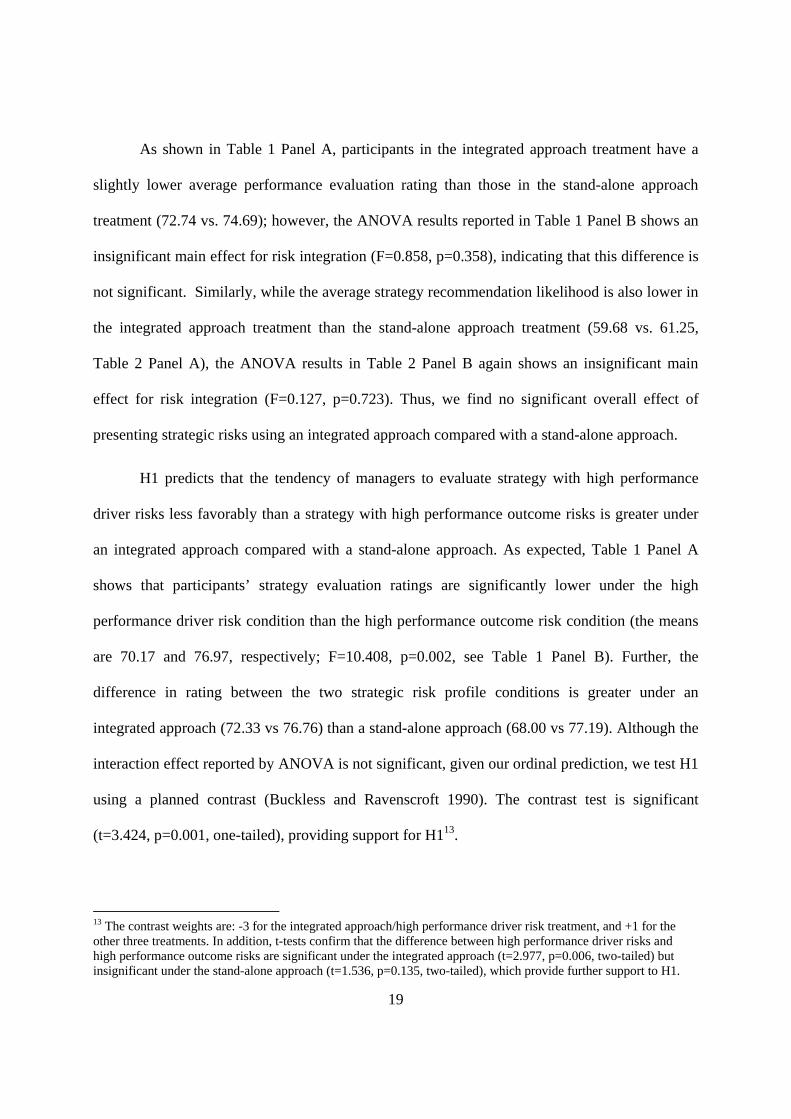
H1 predicts that the tendency of managers to evaluate strategy with high performance
driver risks less favorably than a strategy with high performance outcome risks is greater under
an integrated approach compared with a stand-alone approach. As expected, Table 1 Panel A
shows that participants’ strategy evaluation ratings are significantly lower under the high
performance driver risk condition than the high performance outcome risk condition (the means
are 70.17 and 76.97, respectively; F=10.408, p=0.002, see Table 1 Panel B). Further, the
difference in rating between the two strategic risk profile conditions is greater under an
integrated approach (72.33 vs 76.76) than a stand-alone approach (68.00 vs 77.19). Although the
interaction effect reported by ANOVA is not significant, given our ordinal prediction, we test H1
using a planned contrast (Buckless and Ravenscroft 1990). The contrast test is significant
(t=3.424, p=0.001, one-tailed), providing support for H113.
13 The contrast weights are: -3 for the integrated approach/high performance driver risk treatment, and +1 for the other three treatments. In addition, t-tests confirm that the difference between high performance driver risks and high performance outcome risks are significant under the integrated approach (t=2.977, p=0.006, two-tailed) but insignificant under the stand-alone approach (t=1.536, p=0.135, two-tailed), which provide further support to H1.
20
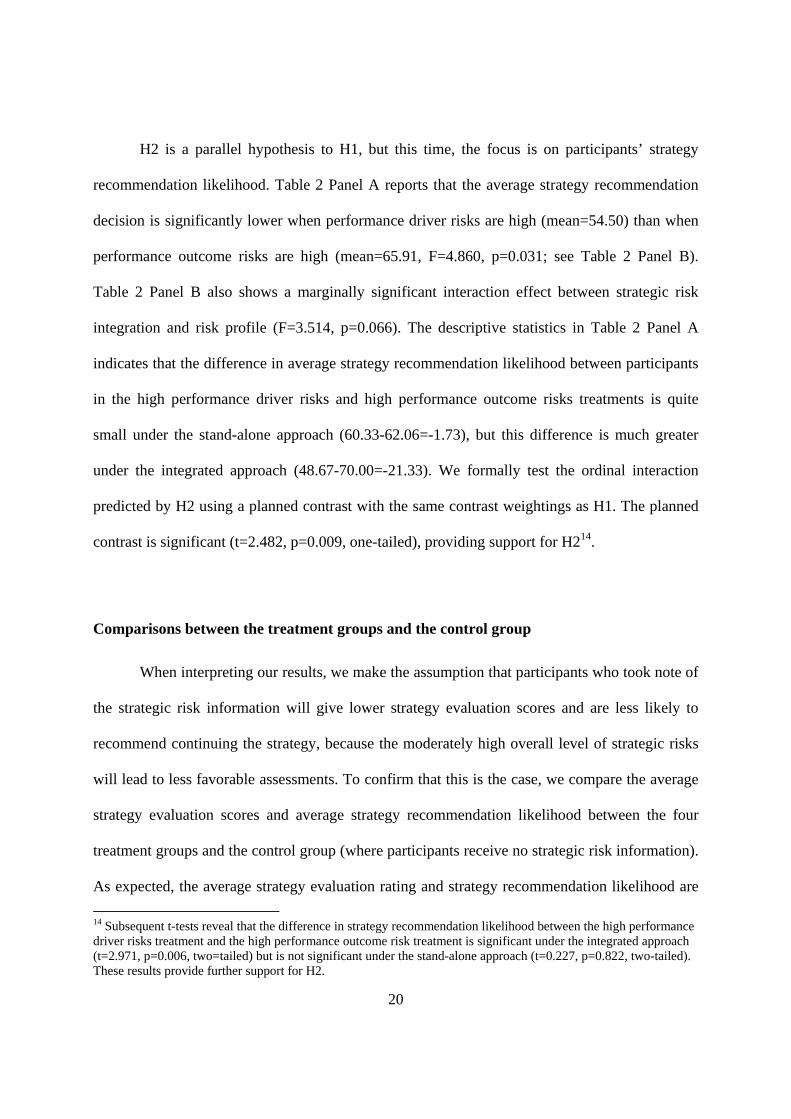
H2 is a parallel hypothesis to H1, but this time, the focus is on participants’ strategy
recommendation likelihood. Table 2 Panel A reports that the average strategy recommendation
decision is significantly lower when performance driver risks are high (mean=54.50) than when
performance outcome risks are high (mean=65.91, F=4.860, p=0.031; see Table 2 Panel B).
Table 2 Panel B also shows a marginally significant interaction effect between strategic risk
integration and risk profile (F=3.514, p=0.066). The descriptive statistics in Table 2 Panel A
indicates that the difference in average strategy recommendation likelihood between participants
in the high performance driver risks and high performance outcome risks treatments is quite
small under the stand-alone approach (60.33-62.06=-1.73), but this difference is much greater
under the integrated approach (48.67-70.00=-21.33). We formally test the ordinal interaction
predicted by H2 using a planned contrast with the same contrast weightings as H1. The planned
contrast is significant (t=2.482, p=0.009, one-tailed), providing support for H214.
Comparisons between the treatment groups and the control group
When interpreting our results, we make the assumption that participants who took note of
the strategic risk information will give lower strategy evaluation scores and are less likely to
recommend continuing the strategy, because the moderately high overall level of strategic risks
will lead to less favorable assessments. To confirm that this is the case, we compare the average
strategy evaluation scores and average strategy recommendation likelihood between the four
treatment groups and the control group (where participants receive no strategic risk information).
As expected, the average strategy evaluation rating and strategy recommendation likelihood are
14 Subsequent t-tests reveal that the difference in strategy recommendation likelihood between the high performance driver risks treatment and the high performance outcome risk treatment is significant under the integrated approach (t=2.971, p=0.006, two=tailed) but is not significant under the stand-alone approach (t=0.227, p=0.822, two-tailed). These results provide further support for H2.
21
higher for the control group than for the average of the four treatment groups (strategy evaluation
rating: 80.67 vs. 73.73 for the control group and the treatment groups, respectively; strategy
recommendation likelihood: 74.67 vs. 60.48 for the control group and the treatment groups,
respectively). The less favorable rating and recommendation by participants who have received
information about strategic risk factors support our contention that lower strategy evaluation
rating and strategy recommendation likelihood indicate a stronger influence of the strategic risks
on participants’ decisions.
We performed post-hoc comparisons between the control group and each of the four
treatment groups. Untabulated results show that the only treatment group that has significantly
lower strategy evaluation and strategic recommendation likelihood than those in the control
group is the integrated approach/performance driver risks treatment (p=0.002 and p=0.006, two-
tailed, for the two decisions, respectively). This indicates that of the four treatment groups,
strategic risk factors only make a significant difference to both decisions when performance
driver risks are high and when the strategic risk factors are integrated in the BSC.
Additional analysis: perceived importance and perceived ease of making decisions
In addition to the two strategy-related decisions, we also measure participants’ perceived
importance of risk information when they are making their decisions. Specifically, we ask
participants to indicate the extent to which risk information was important to their: (1) strategy
evaluation and (2) strategy recommendation, measured on a scale from 0 (not important) to 100
(very important).
22
Independent t-tests show that participants in the integrated approach treatment find the
risk information significantly less important in their strategy evaluation decisions than
participants in the stand-alone treatment (67.26 vs. 76.25, t=2.078, p=0.042, two-tailed). This
finding is interesting, and is consistent with our expectation that a stand-alone approach increases
the salience of the strategic risk information. However, despite the higher perceived importance,
our results show that the strategic risk factors did not have stronger influence on participants’
strategy evaluation decisions under the stand-alone approach. We speculate that this is because
participants were less able to integrate these strategic risk factors with the performance
information under a stand-alone approach. Instead, they might have considered the strategic risk
factors as an independent category of related information, and lower the overall decision weights
assigned to the strategic risk factors in their decisions (for example, see Lipe and Salterio 2002).
To examine this result further, we compare the proportion of participants who listed
performance driver risks among the top two most important strategic risks to their decisions.
Specifically, the participants are asked to rank the eight risk factors in terms of their relative
importance to their strategy evaluation decision and their strategy recommendation. Based on
their responses, we counted the number of times each strategic risk was rated as first or second
most important, combined the counts across the four performance driver risks, and expressed this
number as a proportion of all responses. We find a significantly higher proportion of participants
included performance driver risks among the top two most important risks in the “high
performance driver risks/integrated approach” treatment, compared to those in the “high
performance driver risks/stand-alone approach” treatment (41.7% vs 21.9%, z=2.372, p=0.018).
This provides support to our expectation that participants under an integrated approach are more
likely to consider strategic driver risks important to their strategy evaluation decisions than those
23
in a stand-alone treatment. However, there is no significant difference in the proportion of
participants listing performance driver risks among the top two strategic risks when in the “high
performance outcome risks” treatment, nor were there any differences in the proportions of
participants listing performance output risks among the top two strategic risks15.
For strategy recommendation decisions, there is no significant difference in perceived
importance of the strategic risk factors between the two treatment groups (78.28 for the stand-
alone treatment, and 72.90 for the integrated approach treatment, t=1.415, p=0.162, two-tailed).
We also find that, on average, the strategic risk factors are perceived by participants to have
greater importance in strategy recommendation decisions than strategy evaluation decisions
(75.63 vs. 71.83). These findings indicate that participants are more concerned about the level of
strategic risks associated with the strategy when they are considering expanding the strategy to
other parts of the organization, than when they are evaluating the strategy’s performance in the
past. It might be that because the level of importance being placed on these strategic risk factors
is already very high, the presentation format of the strategic risk factors did not make any further
difference to the level of perceived importance when participants are making their strategy
recommendation decisions.
As discussed earlier, the prior literature suggests that a stand-alone approach can reduce
the cognitive effort required to process this information. Consequently, in addition to perceived
importance, we also ask participants to indicate the extent to which they find it easy to make the
performance evaluation and recommendation decisions (on a scale from 0 to 100). Independent t-
tests show that there are no significant differences between the stand-alone treatment and the
integrated approach treatment with respect to the ease of making either decision. This suggests
15 The results of this additional analysis remain inferentially the same if we examine participants’ top three risks rather than top two risks.
24
that integrating strategic risk information in a BSC did not increase the perceived difficulties in
processing this information.
CONCLUSION AND DISCUSSION
In this study, we examine the effect of integrating strategic risks in the BSC and a
strategy’s risk profile on managers’ strategy evaluation and recommendation decisions. Using
an experimental approach, we find that participants evaluate the strategy less favorably, and are
less willing to recommend the expansion of the strategy, if its strategic risk profile is dominated
by strategic risks associated with performance drivers rather than performance outcomes. This
effect on strategy recommendation decisions is stronger when the strategic risk factors are
integrated on the BSC (an integrated approach) compared with when the strategic risk factors are
presented separately (a stand-alone approach).
Our study contributes to the literature by being the first to examine the decisional effects
of incorporating strategic risk factors in the BSC. Business consultants have strongly advocated
the need to integrate strategic risk assessments with performance information when making
strategic decisions (Ernst & Young 2012; Frigo and Anderson 2009). The accounting literature
to-date has focused on understanding the risk management process and the role of risk managers
(e.g., Mikes 2009). In practice, the risk management process and the performance measurement
process tend to remain distinctive, even though the strategic risk information generated from the
risk management process and the performance information generated from an organization’s
SPMS are both important inputs into managers’ overall strategic decision-making process. It is
unclear from the current literature how these two types of information can be presented to
managers to facilitate integrative decision-making. Although we did not find an overall
25
difference between a stand-alone approach and an integrated approach to presenting strategic risk
factors, our results suggest that incorporating strategic risks on the BSC increases participants’
tendency to distinguish between performance driver risks and performance outcome risks, and to
place greater emphases on the former.
Our study also contributes to the literature by providing evidence that managers’
decisions are more strongly influenced by performance driver risks than performance outcome
risks. Risk management tools, such as heat maps and risk event cards, are designed mostly to
represent strategic risk profile in terms of the likelihood and magnitude of each risk factor. Less
attention is paid to the fact that the nature of the strategic risk factors may also significantly
impact on managers’ decisions. In particular, drawing on prior psychology research, we show
that managers respond more strongly to strategic risks associated with performance drivers than
strategic risks associated with performance outcomes. This finding is significant, because it
suggests that prior research on outcome effect in relation to performance information may not
directly apply to a setting where strategic risks are involved.
We do, however, acknowledge a number of limitations in our study. First, while our
study shows that participants react differently to performance driver risks compared with
performance outcome risks, particularly when strategic risks are integrated in the BSC, we are
not able to draw conclusion on the quality of their strategy evaluation and recommendation
decisions. There is no ‘normatively superior’ decision against which we can compare the
participants’ responses. Second, strategic risks vary not only on their likelihood but also their
impact magnitudes. In the current study, we have held constant the impact magnitude by
informing participants that all the strategic risks have the same strategic impact. We made this
design choice to simplify the task, and we vary the likelihood rather than the impact of strategic
26
risks because participants are likely to find it easier to compare likelihoods between different
strategic risks than impacts, as the measurement of the latter is likely to be more ambiguous. For
the same reason, we also did not inform participants whether the impacts of the strategic risks are
high, medium or low. A potentially fruitful future research avenue is to explore the effect of
varying both the likelihood and magnitude of impacts in relation to both performance driver risks
and performance outcome risks.
Our findings suggest a number of additional future research directions. For example, in
our study the performance of the strategy is positive, meeting all performance targets. Future
research can examine the decisional impact of integrating strategic risk information in the BSC,
when performance objectives are not meeting pre-set targets. Another interesting future research
area is to investigate the effect of linking managers’ compensation to both performance and
risks, and specifically, whether (and what types of) compensation plans are more effective to
ensuring that managers integrate both performance information and strategic risk assessments
when making strategy evaluation and recommendation decisions. Finally, the focus of our study
is on the presentation of strategic risks, which are essentially the outcomes of an organization’s
strategic risk management process. Future research can examine the specific processes that have
resulted in varying levels of performance driver and performance outcome risks, and whether
these processes would influence managers’ strategy-related decisions.
27
References
Atkinson, A. A., R. S. Kaplan, E. M. Matsumura, and S. M. Young. 2007. Chapter 9: The Balanced Scorecard, in Management Accounting. Pearson Prentice Hall, Upper Saddle River, New Jersey. 5th Edition.
Banker, R. D., H. Chang, and M. J. Pizzini. 2004. The balanced scorecard: judgmental effects of performance measures linked to strategy. The Accounting Review 79 (1): 1-12.
Barone, M. J., and T. E. DeCarlo. 2012. Performance trends and salesperson evaluations: the moderating roles of evaluation task, managerial risk propensity, and firm strategic orientation. Journal of Personal Selling & Sales Management. XXXII (2): 207-233
Bloomfield, R., F. Hodge, P. Hopkins, and K. Rennekamp. 2011. Does the location and organization of disaggregated information improve financial statement transparency? Working paper, presented at Contemporary Accounting Research Conference, https://www.caaa.ca/_files/file.php?fileid=fileEpdarktmit&filename=file_5_2011_CAR_Conference.pdf .
Buckless, F.A., Ravenscroft, S.P., 1990. Contrast coding: a refinement of ANOVA in behavioral analysis. The Accounting Review 65 (4), 933-945.
Carswell, C. M., and C. D. Wickens 1996. Mixing and matching lower-level codes for object displays: evidence for two sources of proximity compatibility. Human Factors. 38(1): 1-22.
Cheng, M. M. and K. A. Humphreys. 2012. The differential improvement effects of the strategy map and the scorecard perspectives on managers’ strategic judgments. The Accounting Review. 87(3): 899‐924
Chenhall, R. 2005. Integrative strategic performance measurement systems, strategic alignment of manufacturing, learning and strategic outcomes: an exploratory study. Accounting, Organizations and Society. 30: 395-422.
Ernst & Young. 2012. Turning risk into results: how leading companies use risk management to fuel better performance. http://www.ey.com/Publication/vwLUAssets/Turning_risk_into_results/$FILE/Turning%20risk%20into%20results_AU1082_1%20Feb%202012.pdf)
Frigo, M. L., and R. J. Anderson. 2009. Strategic risk assessment: a first step for improving risk management and governance. Strategic Finance. 25-33.
Guo, L., T. Libby, B. Wing-on-Wong, and D. Yang. 2011. Limiting the effect of attribution and construal errors on strategy evaluation using a strategic performance measurement system. Working Paper presented at AAA Management Accounting Mid-Year Meeting.
Hall, M., A. Mikes, and Y. Millo. 2013. How do risk managers become influential? A field study in two financial institutions. Harvard Business School Working Paper 11-068. http://www.hbs.edu/faculty/Publication%20Files/11-068_f1d5bd99-e47e-41a2-84ea-c4fd055e261d.pdf
HBR (Harvard Business Review) Roundtable. 2009. Managing risks in the new world, with Robert S Kaplan, Anette Mikes, Robert Simons, Peter Tufano, and Michael Hofmann, moderated by David Champion. Harvard Business Review. 2009 October:1-7.
Hirschleifer, D., and S. H. Teoh. 2003. Limited attention information disclosure, and financial reporting. Journal of Accounting and Economics. 36(1-3): 337-386.
28
Hodge, F. D., P. E. Hopkins, and D. A. Wood. 2010. The effect of financial statement information proximity and feedback on cash flow forecasts. Contemporary Accounting Research. 27(1): 101-133.
Humphreys, K. A., and K. T. Trotman. 2011. The balanced scorecard: The effect of strategy information on performance evaluation judgments. Journal of Management Accounting Research 23: 81-98.
Ittner, L., D. Larcker and M. Meyer. 2003. Subjectivity and the weighting of performance measures: evidence from a Balanced Scorecard. The Accounting Review. 78(3): 725-758
Jordan, S., L. Jørgensen, and H. Mitterhofer. 2013. Performing risk and the project: risk maps as mediating instruments. Management Accounting Research. 24: 156-174.
Kaplan, R. S. 2009. Conceptual foundations of the balanced scorecard. In Handbook of Management Accounting Research. Editors Chapman, C. S., Hopwood, A. G., and Shields, M. D. Elsevier Press.
Kaplan, R. S., and D. P. Norton. 1996. The Balanced Scorecard: Translating Strategy into Action. Boston, MA: Harvard Business School Press.
Kaplan, R. S., and D. P. Norton. 2001. The Strategy-Focused Organization: How Balanced Scorecard Companies Thrive in the New Business Environment. Boston, MA: Harvard Business School Press.
Kaplan, R. S., and D. P. Norton. 2004. Strategy Maps: Converting Intangible Assets into Tangible Outcomes. Boston, MA: Harvard Business School Press.
Kaplan, R. S., and A. Mikes. 2012. Managing risks: a new framework. Harvard Business Review. 49-60
Lipe, M. G., and S. E. Salterio. 2000. The balanced scorecard: judgmental effects of common and unique performance measures. The Accounting Review 75 (3): 283-298.
Lipe, M. G., and S. E. Salterio. 2002. A note on the judgmental effects of the balanced scorecard’s information organization. Accounting, Organizations and Society 27 (6): 531-540.
Maines, L. A., and L. S. McDaniel. 2000. Effects of comprehensive-income characteristics on nonprofessional investors’ judgments: the role of financial-statement presentation format. The Accounting Review. 75(2): 179-207.
PricewaterhouseCoopers. 2008. A Practical Guide to Risk Assessment. http://www.pwc.com/en_us/us/issues/enterprise-risk-management/assets/risk_assessment_guide.pdf
PricewaterhouseCoopers. 2009. Seizing opportunity: linking risk and performance.
Rehder, B., and S. W. Kim. 2006. How causal knowledge affects classification: a generative theory of categorization. Journal of Experimental Psychology: Learning, Memory and Cognition. 32(4): 659-683
Rim, S. Y., J. Hansen, and Y. Trope. 2013. What happens why? Psychological distance and focusing on causes versus consequences of events. Journal of Personality and Social Psychology. 104(3): 457-472
Salteiro, S. 2012. Balancing the scorecard through academic accounting research: opportunity lost? Journal of Accounting and Organizational Change. 8(4): 458-474.
29
Scheehan, M. T. 2010. A risk-based approach to strategy execution. Journal of Business Strategy. 31(5): 25-37.
Simons, R. 2000. Performance Measurement and Control Systems for Implementing Strategy. Englewood Cliffs NJ: Prentice Hall.
Sweller, J. 1988. Cognitive load during problem solving: effects on learning. Cognitive Science. 12(2): 185-233.
Tayler, W. B. 2010. The balanced scorecard as a strategy-evaluation tool: The effects of implementation involvement and a causal-chain focus. The Accounting Review 85 (3): 1095-1117.
Trope, Y., and N. Liberman. 2003. Temporal construal. Psychological Review. 110(3): 403-421.
Trope, Y., N. Liberman, and C. Wakslak. 2007. Construal levels and psychological distance: effects on representation, prediction, evaluation and behaviour. Journal of Consumer Psychology. 17(2): 83-95.
Yopchick, J. E. and A. S. Kim. 2009. The influence of causal information on judgments of treatment efficacy. Memory and Cognition. 37(1): 29-41.
30
Figure 1
The integrated approach of presenting strategic risk factors (high performance outcome risks condition)
(For 12 months following the implementation of the customised tiles strategy)
RISK RATING SCALE: 1 (very low likelihood) to 10 (very high likelihood)
Strategic Objectives Measure Target Actual Performance Risk Factor** Risk Rating Financial Grow revenue Increase asset utilization
Monthly customized tile sales ROA p.a.
$200,000
15%
$205,000
16%
Main competitor starting a price war Equipment write-offs due to obsolescence
4
5
Customer Enhance customer service Increase customized product range
% Customer satisfaction rating No. of new customized products introduced
85% 3
88%
4
Adverse publicity on customer experience Change in customer preferences
4
5
Internal Business Process Improve design processing accuracy Increase production efficiency
% of designs meeting specifications % of full capacity kiln runs
90%
65%
92%
68%
Employees misreading specifications Critical equipment breakdown
9
8
Learning & Growth Introduce leading edge software Improve employee knowledge and skills
% of software implementation completed % of fully trained employees
70%
80%
73%
83%
Unstable IT hardware Loss of key personnel
9
8
31
Figure 2
The stand-alone approach of presenting strategic risk factors (high performance outcome risks condition)
PERFORMANCE INFORMATION RISK INFORMATION
(For 12 months following the implementation of the customized tiles strategy) (For 12 months following the implementation of the customized tiles strategy)
RISK RATING SCALE: 1 (very low likelihood) to 10 (very high likelihood)
** Please note that the risk factors represent threats to the continued success of the new customized tiles strategy. Each risk factor is expected to have the same strategic impact on performance. However the likelihood of occurrence varies according to the risk rating
Strategic Objectives Measure Target Actual Performance
Financial Grow revenue Increase asset utilization
Monthly customized tile sales ROA p.a.
$200,000
15%
$205,000
16%
Customer Enhance customer service Increase customized product range
% Customer satisfaction rating No. of new customized products introduced
85%
3
88%
4
Internal Business Process Improve design processing accuracy Increase production efficiency
% of designs meeting specifications % of full capacity kiln runs
90%
65%
92%
68%
Learning & Growth Introduce leading edge software Improve employee knowledge and skills
% of software implementation completed % of fully trained employees
70%
80%
73%
83%
Risk Factor** Risk Rating Main competitor starting a price war Equipment write-offs due to obsolescence Adverse publicity on customer experience Change in customer preferences Employees misreading specifications Critical equipment breakdown Unstable IT hardware Loss of key personnel
9
8
9
8 4 5
4
5
32
Figure 3
Strategic risk profile manipulation
Risk ratings* under “High performance outcome
risks” treatment
Risk ratings under “High performance driver
risks” treatment
Main competitor starting a price war 9 4
Equipment write-offs due to obsolescence 8 5
Adverse publicity on customer experience 9 4
Change in customer preferences 8 5
Employees misreading specifications 4 9
Critical equipment breakdown 5 8
Unstable IT hardware 4 9
Loss of key personnel 5 8
* Risk rating scale: 1 (very low likelihood) to 10 (very high likelihood)
33
Table 1
Performance evaluation ratings
Panel A: Descriptive statistics for strategy evaluation ratings*
High performance driver risks
High performance outcome risks
Row average
Stand-alone approach
72.33
(9.42)
N=15
76.76
(6.83)
N=17
74.69
(8.32)
N=32
Integrated approach
68.00
(9.41)
N=15
77.19
(7.74)
N=16
72.74
(9.647)
N=31
Column average
70.17
(9.53)
N=30
76.97
(7.17)
N=33
73.73
(8.98)
N=63
Panel B: ANOVA model for strategy evaluation ratings
Factor SS df F p
Risk integration (stand-alone vs. integrated approach)
60.05 1 0.858 0.358
Risk profile (high performance driver risks vs. high performance outcome risks)
728.33 1 10.408 0.002
Risk integration * Risk profile 88.83 1 1.269 0.264
Error 4128.83 59
Total 347475.00 63
*Performance evaluation rating is measured on a scale from 0 (low performance) to 100 (high performance).
34
Table 2
Performance recommendation likelihood
Panel A: Descriptive statistics for strategy recommendation likelihood*
High performance driver risks
High performance outcome risks
Row average
Stand-alone approach
60.33
(19.32)
N=15
62.06
(23.12)
N=17
61.25
(21.10)
N=33
Integrated approach
48.67
(23.26)
N=15
70.00
(16.33)
N=16
59.68
(22.43)
N=31
Column average
54.50
(21.83)
N=30
65.91
(20.21)
N=33
60.48
(21.60)
N=63
Panel B: ANOVA model for strategy recommendation likelihood
Factor SS df F P
Risk integration (stand-alone vs. integrated approach)
54.50 1 0.127 0.723
Risk profile (high performance driver risks vs. high performance outcome risks)
2087.94 1 4.860 0.031
Risk integration * Risk profile 1509.75 1 3.514 0.066
Error 25349.61 59
Total 259350.00 63
*Performance recommendation likelihood is measured on a scale from 0 (very unlikely to recommend) to 100 (very likely to recommend).