does your sem really tell the truth? - how would you know
TRANSCRIPT
Does Your SEM Really Tell the Truth?- How would you know?
Part 3: Vibration and Drift
Michael T. Postek#, András E. Vladár#, and Petr Cizmar*#National Institute of Standards and Technology1,2
Gaithersburg, MD 20899 USA*Physikalisch-Technische Bundesanstalt
Braunschweig, Germany
ABSTRACT
This is the third of a series of papers discussing various causes of measurement uncertainty in scanned particle beam in-struments, and some of the solutions researched and developed at NIST. Scanned particle beam instruments especially the scanning electron microscope (SEM) have gone through tremendous evolution to become indispensable tools for many and diverse scientifi c and industrial applications. These improvements have signifi cantly enhanced their performance and made them far easier to operate. But, ease of operation has also fostered operator complacency. In addition, the user-friendliness has reduced the need for extensive operator training. Unfortunately, this has led to the concept that the SEM is just another expensive digital camera or another peripheral device connected to a computer and that all of the issues related to obtaining quality data have been solved. Hence, a person (or company) using these instruments may be lulled into thinking that all of the potential pitfalls have been fully eliminated and they believe everything they see on the micrograph is always correct. But, as described in this and the earlier presentations this may not be the case. The fi rst paper in this series discussed some of the issues related to signal generation in the SEM, including instrument calibration, electron beam-sample interactions and the need for physics-based modelling to understand the actual image formation mechanisms to properly interpret SEM images. The second paper, discussed another major issue confronting the microscopist: specimen contamination and meth-ods of contamination elimination. This third paper, discusses vibration and drift and some useful solutions.
Keywords: calibration, measurements, metrology, modelling, vibration, drift, scanning electron microscope, SEM, stand-ards, reference material
1.0 INTRODUCTION
Scanning electron microscopes are used extensively in nanomanufacturing characterization, metrology and process con-trol. Two earlier papers (1, 2), discussed some of the potential issues related to signal generation in the SEM, instrument calibration, electron beam interactions, and the need for modelling to understand the actual image generation. All these were summed together in a discussion of how these issues effect measurements made with the instrument. The second paper, discussed another major issue confronting the microscopist: which is specimen contamination and methods of con-tamination reduction and elimination. This third paper, discusses the additional components of measurement uncertainty induced by vibration and drift and some possible solutions to these issues. Over the years, several workers at NIST have done a great deal of research into these issues in order to improve the fundamental metrology with particle beam instru-ments and some of this work is reviewed and discussed here.
1 Contribution of the National Institute of Standards and Technology, not subject to copyright.
2 Certain commercial equipment is identifi ed in this report to adequately describe the experimental procedure. Such identifi cation does not imply recommendation or endorsement by the National Institute of Standards and Technology, nor does it imply that the equipment identifi ed is necessarily the best available for the purpose.
Scanning Microscopies 2014, edited by Michael T. Postek, Dale E. Newbury, S. Frank Platek, Tim K. Maugel,Proc. of SPIE Vol. 9236, 923605 · © 2014 SPIE · CCC code: 0277-786X/14/$18 · doi: 10.1117/12.2065235
Proc. of SPIE Vol. 9236 923605-1
Downloaded From: http://spiedigitallibrary.org/ on 12/08/2014 Terms of Use: http://spiedl.org/terms

2.0 DISCUSSION
During the acquisition of an SEM image, the instrument may be adversely affected by its surroundings. Mechanical and acoustic impacts of the environment can affect the performance of the microscope in many undesired ways. The column of the SEM is directly coupled to the sample stage and hence, any external vibrations transmitted through the frame and isolation system to the column can be ultimately transferred to the sample. Transmitted vibration results in detrimental artifacts in the recorded image. Additionally, sample stage movements and friction in its components can cause drift, and uncontrolled motion or creeping. Temperature expansion and electron beam interaction with impinging electro-magnetic fi elds are other contributors to the drift. All of these together may ruin SEM image quality since drift can appear as a more or less severe image distortion, elongation and vibration is often shown as jaggedness of the edges imaged objects.
2.1 Vibration. Scanning electron microscopes typically utilize a single-channel electron detector. This detector requires scanning the electron beam across the entire area of interest in a point-by-point fashion. So, if the electron beam is dithering during the scan or if the sample/stage is moving relative to the primary electron beam, either because of vibration or drift, the data being recorded can be compromised. Vibration induces both obvious and more subtle detrimental effects on imag-ing and measurements made with the SEM. When gross vibration is present, it is relatively easy to see on the microscope viewing screen. In this case, quite often, some environmental parameter has changed (such as a vacuum pump motor has been turned on, or the sample is loose). Such gross vibration is often readily observed and diagnosed by the instrument operator or service engineer. Adjustment of the vibration isolation system or tightening the sample may be all that is needed to remedy those situations. In an unattended, totally automated instrument, this problem may not be as readily observed and diagnosed, ultimately resulting in erroneous data or product loss.
The more subtle nano-scale vibration is much more diffi cult to see in an image and hence is often left undiagnosed. In an early paper (3), the effect of vibration induced in the SEM image (and hence the measurement) by just a small fan motor cooling the turbomolecular pump was shown to contribute to a signifi cant component of the error in measurements made with that instrument while the fan was operational (Figure 1). The 25 nanometer error broadening the semiconductor line shown (Figure 1b and c) was directly contributed by the cooling fan. This was easily demonstrated by turning the fan on and off during the slow-scan image acquisition. This amount of error, although disconcerting, was less of an issue when semiconductor microprocessor structures were around 500 - 750 nm in width, but today, the amount of error, just contrib-uted by the fan motor, is much greater than many contemporary semiconductor microprocessor gates or many nanoparti-cles. Imaging such a structure with that much vibration present would likely be impossible.
Also shown in Figure 1, vibration can lead to a loss of edge sharpness and detail while contributing to the edge broadening and measurement error of nanometer and sub-nanometer structures and particles. Figure 2 shows the effect of just a slight tap on the SEM column and the disruption to the image the vibration causes and Figure 3 shows the effect of local acoustic noise. Figure 4 shows the effect of vibration induced by the pumping action of the cooling water through the fi nal lens of the instrument. All of these are common issues encountered in a typical metrology laboratory scenario. With the advent of nanotechnology and the necessary sub-100 nm imaging and measurements, it is imperative that all types of vibration in-duced in the image or measurement be diagnosed and eliminated. This may not always be possible, so new methodologies such as those described in Section 3.1 should be adopted.
2.2 Mechanical Drift. In addition to vibration, mechanical drift results from instrument stage instabilities. This is often due to residual hysteresis in the motion control of the stage. Stage elasticity and friction in the components can also cause the sample to appear to drift, resulting in an uncontrolled motion or stage creeping. This can often be especially trouble-some when long image acquisition times are used. Creep causes the stage to continue moving in one or more directions after the intended motion is stopped and the area of interest is found. This generally results in elongation of the structures in the direction of the creep where slow scan applications are concerned and a general loss of sharpness where digital frame storage acquisition is concerned (see: Section 2.3). Mechanical drift is usually addressable by modern instrument and stage design. Drift can also result from changes in atmospheric pressure, small temperature changes in the fi nal lens cooling sys-tem or any other instability such as electromagnetic interference. Therefore, this can be a very complex problem to solve. Again, new methodologies, described below, can be employed to compensate and diagnose these issues (see: Section 3.1).
Proc. of SPIE Vol. 9236 923605-2
Downloaded From: http://spiedigitallibrary.org/ on 12/08/2014 Terms of Use: http://spiedl.org/terms

b.
C.
0.573um ti
I I 1 I
I0.5
0.598um
1.0 um
I
0 0.5
Mode: Linewidth40% Pos. Auto. ThresholdMagnification: 100,000X
1.0 um
30 keVSEC
2.2.1 Motion Assessment. The amplitude of unintended motion may be very similar for a wide range of fi elds of view (magnifi cations), but their contribution to the image grows more and more apparent at smaller and smaller fi elds of view. It is the operator’s task to fi nd the best, optimized imaging conditions for the SEM. Imaging parameters, such as horizontal fi eld of view,3 acquisition speed, frame time, the number of image pixels and dwell time, etc. may also infl uence the effect of these distortions. There are qualitative and quantitative assessments available for the evaluation of unintended motion. Qualitative assessment is recommended to justify that the unintended motion does not cause note-
Figure 2. Effect of a short, mechanical impulse (gentle tap) to the SEM electron optical column (HFV= 25 nm).
Figure 1. The effect of deliberately induced vibration on the imaging and measurement of the width of a struc-ture. (a) Scanning electron micrograph showing the effcet induced by a small cooling fan on the image, source off (top) and on (bottom), (b) Typical linewidth measurement taken with an arbitrary 40% positive threshold crossing al-gorithm under ambient vibration levels typical for proper SEM operation. (c) Similar measurement, using the same measurement conditions of the same sample position af-ter the vibration is induced. (HFW = 1050 nm, 30 keV).
Figure 3. Computer speakers at moderate loudness Sound on (top) and off (from middle down) (HFW = 75 nm).
3 Although, horizontal fi eld width and fi eld of view are often used interchangeably (see ref 1: Postek and Vladar, 2013), HFW has been adopted in this publication since fi eld of view implies a two - dimensional array which is only valid when the beam is normal to the sample (zero degrees of tilt).
Proc. of SPIE Vol. 9236 923605-3
Downloaded From: http://spiedigitallibrary.org/ on 12/08/2014 Terms of Use: http://spiedl.org/terms

. to # .Tatil :Siiirg. leiri. VI 4 "4 417 leg"lot .41 . it. Si0 0 e 0 ) t i PO:: i I. e al ' WAW WO Sv %**WU' 0 gi ** °I. 444 1 44 614.4"P 4, 1...alp .4 0 % 114 --, s*A 41* "404 ogril d'ig.tigo 0°Pdt.. 40, ske,_40' 41 111 a 6 4 P Vbiligo eelill 04411 e 41 e % qb woo _. 044 a 4
VOW 41 6 is ' IS* 45 00 10 1 6st If IMP PAWOZ diejititto 3 401, le oprv. fa:* Per joie rib VIP. 4ft elf. il *le 061r* alb p ;A- , sec s4 Iry be irel
worthy quality problems in imaging or signifi cant errors in measurements. If errors are unacceptably high, then quantita-tive assessment is necessary and compensatory measures are necessary to achieve the required imaging and measurement quality.
Figure 5 shows an example of one approach to qualitative assessment for drift-related distortions using a standard sample of evaporated gold particles on a polished carbon substrate. The 256 nm horizontal fi eld of view (HFV) images show both low-frequency (drift-) and high-frequency (vibration-) related problems.
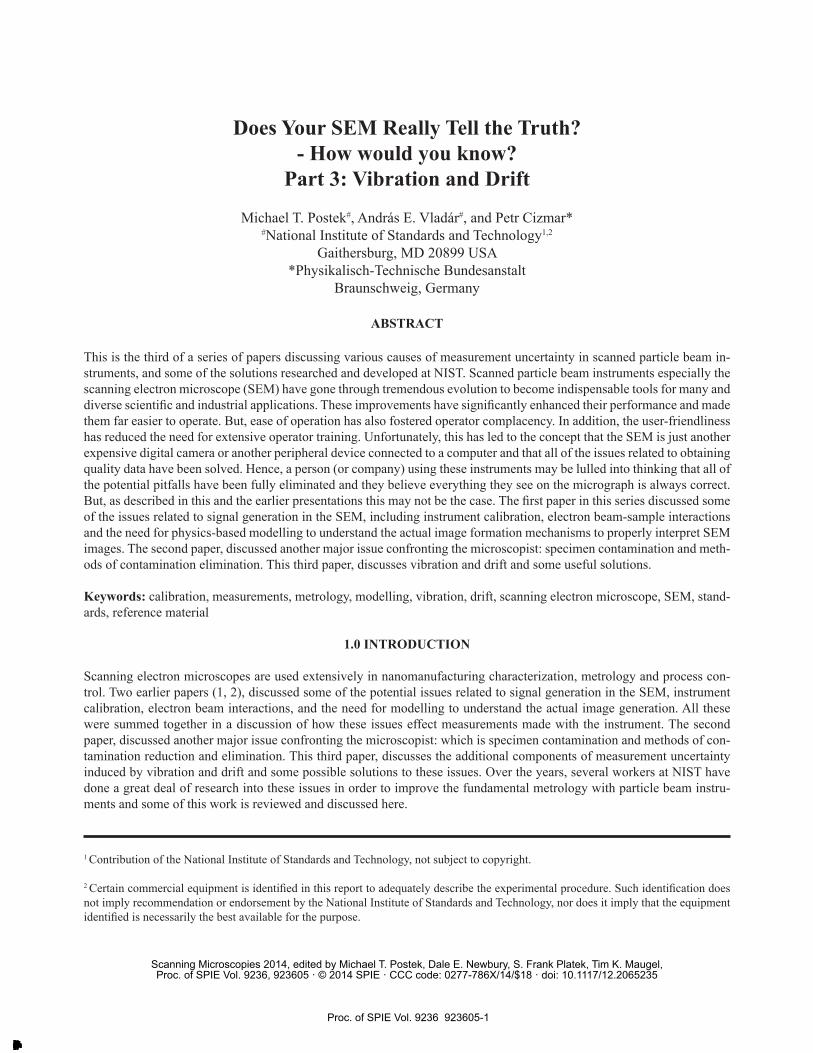
The drift present in Figure 5 may not be initially obvious but, more thorough observation reveals the lack of good position repeatability between the images. The drift can be observed especially well, if one overlays the four images, using a stand-ard image editing program. If the SEM worked perfectly, all four of these images would show exactly the same sample details, the four image frames would line up completely, and there would be no blurred, distorted or missing regions. Figure 6a shows a simple frame-to-frame overlay that exposes that there is, indeed, a drift-related problem. Whether the extent of this is negligible or not, depends on the intended use of the image. Data integrity should be foremost and no distortons should be tolerated. For example, for a biological cell sample, the actual shape of the various organelles may not be very important, as they naturally vary a great deal. On the other hand, for nanometer-scale particle measurements this amount of distortion might be completely unacceptable. Overall, any error is carried along with the micrograph. Something that might seem unimportant today, may become a critical issue in the future. Figure 6b illustrates that by lining the images up to common structures, the actual repeatability problem is somewhat less severe, as many of the shared regions of the four repeated images overlay and are less distorted. But, layering the images in this manner to achieve structure repeatability is achieved at the expense of losing potentially valuable regions containing data at the periphery of the images. Clearly, it is better to opt for better imaging methods (as discussed below) with less distortion, if possible.
The presence of either or both of the two perturbations discussed above should be understood before any critical quantita-tive work is attempted with the SEM. Workers at NIST have studied this and have developed a succession of computer models coupled to experimental verifi cation which incorporate testing for and diagnosing both vibration and drift (4, 5). In addition, computer-based approaches to SEM measurement issues have been developed, all which build to the realization of higher performance instruments and more accurate 3-D SEM metrology. This includes accurate Monte Carlo electron beam interaction modelling programs in order to understand signal generation and image formation (reviewed in ref 6: Postek and Vladar, 2011).
In addition, using the Monte Carlo modeling approach, workers at NIST developed procedures for manufacturing 2-D arti-fi cial images to test the instrument and the measurement algorithms (7). Additionally, more recent work, geared to speeding up the modeling process, dealt with a much faster approach to image modeling which could generate credible images for
Figure 4. Cooling water for the objective lens and diffusion pump Reticulated water, old pump, new pump (left, middle) and city water (right) (HFW = 75 nm).
Proc. of SPIE Vol. 9236 923605-4
Downloaded From: http://spiedigitallibrary.org/ on 12/08/2014 Terms of Use: http://spiedl.org/terms

testing the distortions described above (4, 5, 8, 9). Therefore, over the years, NIST has carried out a great deal of research into instrument improvements that would negate sources of measurement uncertainty in the particle beam instrumentation.
2.3 The Value and Folly of Digital Frame Storage. It should be noted that a commonly used component of modern SEMs can exacerbate both of the two perturbations discussed in this paper; that is digital frame storage. SEMs are very effi cient instruments. Depending upon the mode of signal collection, the amount of “signal electrons” composing an image can be very small. In addition, whenever a signal is acquired, electronic noise is always superimposed onto it. The noise in the SEM image is then a mixture of the desired signal and different noise contributions. Among other noise contributors are electron source, signal processing electronics, amplifi ers, etc. This overall problem has been improved greatly by employ-ing digital frame storage (DFS) technology. DFS has been employed in SEMs since the late 1980s. The incorporation of DFS required that computers become small and fast enough to be fi t into the console of the particle beam instrument. In ad-dition, the cost of computer memory (both disk storage memory and RAM) had to drop to a point where many megabytes of storage capacity could economically be incorporated into the instrument. DFS has been a great boon to SEM technology
Figure 5. Four consecutive, slow-scan images taken to demonstrate one approach to qualitative assessment for drift-related distortions. (HFW = 256 nm). A more elaborate description is found in Cizmar et al., 2011).
Proc. of SPIE Vol. 9236 923605-5
Downloaded From: http://spiedigitallibrary.org/ on 12/08/2014 Terms of Use: http://spiedl.org/terms
because of its ability to improve the signal-to-noise ratio (S/N) in ultra-low or poor S/N signal situations. This improve-ment has helped in all modes of SEM, but was especially valuable to low landing energy applications.4 DFS technology, as a package, also facilitated the development and implementation of real-time TV scan rates, reliable automatic brightness and contrast, and automatic focus and astigmatism control. So, a number of very positive outcomes resulted from the ap-plication of DFS technology.
However, like most anything associated with SEM there is an “optimization of compromises” because not all the outcomes of DFS technology were necessarily good. A frame averaged image is not always identical to an equally integrated slow scan image. The slow scan image is built up line-by-line. Any vibration or drift present is recorded as the line is generated and shows up as disruptions to the edge of the structure on that line. Multiple lines then show a serrated edge when viewed critically (Figures 1-3). A frame averaged image, on the other hand, aligns frame-by-frame the 512 x 512, 1024 x 1024, etc. pixels of the system directly upon each other not unlike what is shown in Figure 6a. The intensities of the image pixels acquired are not affected, but results in their positions to be incorrectly assigned. Any misalignment due to vibration or drift will then be averaged and hence smoothed out of the image. Gross vibration can still show up as a serration, but generally, this leads to a more subtle and less sharp image broadened structures and potentially compromised data. It should be ad-ditionally noted, however that because of DFS and the associated computer hardware and software now standard in most particle beam instruments, the correction methods initially described in Section 3.1 are able to be implemented.
2.3.1 Other Correction Methods. Several correction methods have been developed that compensate for some of the ef-fects described above. Work on correcting the time-dependent drift distortions has been performed in fi elds similar to scan-ning particle beam microscopy such as atomic force microscopy (10, 11, 12, 13). In addition, research into drift-distortion evaluation and correction in SEMs has been published by Sutton et al. (14, 15, 16). The technique described in these articles covers correction in images with a slow drift and generally at wide horizontal fi elds of view. The overall imaging times are high, reaching tens of minutes and the magnifi cation does not exceed 10,000 x. Techniques for highly reduced horizontal fi eld of view, very fast SEM image scanning or other particle beam instruments (scanning helium-ion beam
Figure 6. (left) Simple frame-to-frame overlay of the four images of Figure 5. (right) Image overlay based upon shifting the images to common structures of the four images of Figure 5. (HFW = 256 nm).
4 Low landing energy has replaced the term low accelerating voltage because in newer instruments the electron source can emit electrons at high accelerating voltage, but they are decelerated to a lower landing energy in the column and/or at the sample stage. This technique allows the electron source to constantly operate optimally (see ref 2: Postek et al., 2014).
Proc. of SPIE Vol. 9236 923605-6
Downloaded From: http://spiedigitallibrary.org/ on 12/08/2014 Terms of Use: http://spiedl.org/terms

First Iteration
(o)
ó
(m)g
U
Image A
(c) R.
Every Iteration
(b)
É
Image B
(d)
(k)
Q
Shifted Image B
L1\
Cross -CorrelationImage In Fr. Domain
CO
Cross - Correlationimage
Shift Vectors
(g)
Polynomial Fitting
(h)
6.PolynomialCoefficients
microscope or focused ion beam microscopes), where signal-to-noise ratio (SNR) may drop below 5 x 10⁻¹ are still needed. One solution is described below.
3.0 MATERIALS and METHODS
3.1 Drift-Corrected Image Composition. The need for a solution to the problems of vibration and drift, as stat-ed above, evolved into the correction method referred to as drift-corrected image composition (DCIC). This is implemented in a public-domain software program referred to as ACCORD. This computer program is ca-pable of removing vibration and drift-distortions from SEM images. The technique uses cross correlation for 2-D displacement detection. It not only provides more accurate imaging, but also provides sample drift posi-tion information. The sample position information can be successfully employed in diagnostic applications to chart the drift in the instrument and its stage. With this approach, the solution is fast, multi-platform, multi-processor capable, and moreover can be easily integrat-ed into the majority of the SEM instruments and their software.
The fundamental methodology and mathematical rigor involved in ACCORD has been described in the litera-ture (17, 18). ACCORD is a program that leverages the advantages afforded by DFS and couples it with cross correlation methods to output signifi cantly more accu-rate images than other traditional microscope imaging techniques. ACCORD is necessary for sub-nanometer-scale metrology, since the conventional “slow-scan” and “fast-scan” techniques provide images that are often dis-torted or blurry for the reasons stated above. The ACCORD program works with individual captured frames that are taken as rapidly as the capabilities of the instrument permit. Each of these images then provides a narrow, temporal, snapshot where the amount of motion is minimal (similar to high speed frame capture). Since physical drift causes displacement between each couple of frames depending upon the time-constant of the drift, this displacement is then searched with cross-correlation software to align the proper pixels to each other. The quickly acquired frames are usually extremely noisy (but, are well aligned spatially). Averaging of several aligned frames removes much of the noise, but a noise reduction algorithm is also incorporated as a part of the ACCORD technique to reduce any additional noise.
The ACCORD procedure is illustrated in Figure 7. The process starts with acquisition of two frames: A and B (Fig. 7 a, b). To minimize the infl uence of drift distortion on the frames, the shortest pixel-dwell time possible must be used. This dwell-time is usually limited by the instrument electronics. Both frames are then converted in the computer into the frequency domain (Fig. 7 c, d). These frequency-domain images are then conjugated, multiplied, and then combined with frequency fi ltering (Fig. 7 e). This results in a cross-correlation image in the frequency domain. Then, a cross-correlated image in the spatial domain is obtained (Fig. 7 f). This cross-correlated image is then interpolated by a third-order 2-D polynomial func-tion. This enables fi nding the displacement vectors with sub-pixel accuracy (Fig. 7 g). The coordinates of the maximum denote the found displacement vector (Fig. 7 h). This displacement vector is used to shift the image B in its frequency-domain representation; this enables the subpixel accuracy alignment (Fig. 7i). The shifted image B is converted into the spatial domain (Fig. 7 j) and averaged with image A (Fig. 7 k). Image A has (except in the fi rst iteration) higher information
Figure 7. Illustration of the image composition procedure. Boxes denote entities like images or numbers, arrows indicate processes. (a) – (m) represent individual steps in the procedure
described in the text.
Proc. of SPIE Vol. 9236 923605-7
Downloaded From: http://spiedigitallibrary.org/ on 12/08/2014 Terms of Use: http://spiedl.org/terms

R'
weight, as it already represents a sum of multiple image frames. If the SNR is not suffi cient (Fig. 7 l), the composed image is copied into the frame A (Fig. 7 m) and a new frame B is acquired. The process then repeats until the SNR is suffi cient, or the software runs out of frames.
3.2 Hardware. A Mac Pro computer with two dual-core Intel Xeon central processor units and 4 GB of random access memory was employed for the calculations. The 64-bit edition of Gentoo Linux operating system was installed on the computer. Most modern particle beam instruments have suffi cient computing power to incorporate these algorithms with a minimum amount of additional programming.
3.3 Software. The ACCORD software is in the Public Domain and can be downloaded from http://wiki.accord.cizmar.org/doku.php
4.0 RESULTS
4.1 Imaging. The ACCORD method was experimentally tested on standard gold-on-carbon resolution images as shown in Figure 8. The pixel dwell time was set to 100 ns. (The frame rate was 1 frame per second, which for the instrument used, was also the fastest setting. A single acquired frame (Figure. 8a) was very noisy; only the most prominent features (about 200 nm in diameter) were visible. An integration of 10 frames (Figure 8b) already begins to develop additional visible fea-tures in the background (about 20 nm in diameter); some inner structure of the grains (sized about 5–10 nm) also become observable. Compositions of 38 frames (Fig. 8c) demonstrates the results of the traditional overlay of frame upon frame. Figure 8 d shows the ACCORD-corrected composition of the same 38 images. revealing additional detail. The inner struc-tures of the grains, as well as, all the background features are now clearly visible. The traditionally averaged image was
Figure 8. Demonstration of ACCORD on real SEM images of a gold-on-carbon resolution sample. Horizontal fi eld-of-view is 298 nm for all images: a and b are typical single-frame images taken with 100 ns pixel dwell time; c is the result of traditional overlay composition of 38 images (d) and ACCORD-corrected composition of the same 38 images.
Proc. of SPIE Vol. 9236 923605-8
Downloaded From: http://spiedigitallibrary.org/ on 12/08/2014 Terms of Use: http://spiedl.org/terms

signifi cantly less sharp (more blurred) and distorted due to residual vibration or drift than the image composed using the ACCORD method. Both images have similar SNR. The fi nal image exhibits lower noise and high detail while preserving the shapes and dimensions.
4.2 Drift Tracking. A positive consequence of using the ACCORD technique is the facility to identify and record the amount of displacement between frames and its vector. The obtained sequences of displacement vectors used to track the sample position with respect to the beam (Figure 9). This information is very usable for the investigation of the causes and cures for the drift. In the case of the sample shown in Figure 8, there was a roughly 27-nm-long straight startup drift followed by a periodic circular drift. This was likely caused by temperature changes inside the electron-optical column. Typically the displacement vector sequence associated with a typical drift of a well controlled instrument is less than 0.5 nm, which corresponds to about 0.5 pixel.
5.0 CONCLUSION
The ACCORD technique can successfully compensate for drift and vibration in the particle beam instrument. ACCORD is in the public domain and implemented as a computer program written in C language. The C language affords the ad-vantage of rapid incorporation into current SEM instrument management software since; the hardware of most modern particle beam instruments is adequate to support ACCORD with a minimum amount of additional work. Using reasonably fast computers, this program is capable of real-time processing. The algorithm is readily distributable; thus, it is suitable for running on computer clusters or multicore or multiprocessor environments, including graphics processing units. The method has been verifi ed on real and artifi cial SEM images demonstrating its usability for true-shape imaging and for drift investigation applications. Calculation of accuracy and confi dence intervals, infl uence of sample charging and contamina-tion are still under investigation. These issues will be addressed in future work on this project.
6.0 REFERENCES
[1] Postek, M. T., and Vladar, A. E., “Does Your SEM Really Tell the Truth? How would you know? Part 1.” SCANNINGJournal 35:355-361 (2013).
[2] Postek, M. T., Vladár, A. E., and Kavuri, P. P., “Does Your SEM Really Tell the Truth? How would you know? Part 2.Specimen Contamination,” SCANNING Journal, (2014).
[3] Postek, M. T. and Joy, D. C., “Submicrometer Microelectronics Dimensional Metrology: Scanning Electron Micros-copy,” NBS Journal of Research 92 (3): 205 228 (1987).
Figure 9. Example of drift tracking. The graph depicts the motion of the center locations of the series of the 38 images used in generating Figure 8 (previous fi gure) showing an X-Y plot of the stage drift. Data on the X-axis plots motion in the X-direction and the Y-axis plots the motion in the Y-direction.
Proc. of SPIE Vol. 9236 923605-9
Downloaded From: http://spiedigitallibrary.org/ on 12/08/2014 Terms of Use: http://spiedl.org/terms

[4] Cizmar, P, Vladár, A. V., Ming, B. and Postek, M. T. “Simulated SEM Images for Resolution Measurement,” SCAN-NING 30:381-391, (2008).
[5] Cizmar, P., Vladar, A. E., and Postek, M. T. “Optimization of Accurate SEM imaging by use of artifi cial images,”SCANNING/SPIE Proceedings 7378:737815-1 – 737815-6, (2009).
[6] Postek, M. T., and Vladar, A., “Modeling for Accurate Dimensional Scanning Electron Microscope Metrology: Thenand Now,” SCANNING 33: 111-125 (2011).
[7] Postek, M. T., Vladar, A. E. Lowney, J., Larrabee, R. D. and Keery, W. J., “Two-Dimensional Simulation and Modelingin Scanning Electron Microscope Imaging and Metrology Research,” SCANNING 24:179-185, (2002).
[8] Postek, M. T., “Critical Issues in Scanning Electron Microscope Metrology,” NIST J. Res. 99(5): 641-671, (1994).
[9] Cizmar, P., Vladar, A. E. and Postek, M. T. “Advances in modeling of scanning charged particle microscopy images,”SPIE Proceedings 7729 77290Z -1 – 9, (2010).
[10] Kawasaki, T., Utsuro, H., Takai, Y., and Shimizu, R. “Evaluation of image drift correction by three-dimensional Fou-rier analysis.” Journal of Electron Microscopy, 48(1):35–37 (1999).
[11] Mantooth, B. A., Donhauser, Z. J., Kelly, K. F., and Weiss, P. S., “Cross-correlation image tracking for drift correctionand adsorbate analysis,” Review of Scientifi c Instruments, 73(2, Part 1):313–317 (2002).
[12] Chang S., Wang, C. S., Xiong, C. Y. and Fang, J. “Nanoscale in-plane displacement evaluation by AFM scanning anddigital image correlation processing” Nanotechnology, 16(4):344–349, (2005).
[13] Xu, Z.-H., Li, X.-D., Sutton, M. A. and Li, N., “Drift and spatial distortion elimination in atomic force microscopyimages by the digital image correlation technique,” J. Strain Analysis for Eng Design, 43(8, Sp.Iss. SI):729–743, (2008).
[14] Sutton, M. A., Li, N., Garcia, D., Cornille, N., Orteu, J.J., McNeill, S. R., Schreier, H. W., and Li, X., Metrology ina scanning electron microscope: theoretical developments and experimental validation. MEASUREMENT SCIENCE &TECHNOLOGY, 17(10):2613–2622 (2006).
[15] Sutton, M. A., Li, N., Garcia, D., Cornille, N., Orteu, J.J., McNeill, S. R., Schreier, H. W., Li, X. and Reynolds, A. P.,“Scanning electron microscopy for quantitative small and large deformation measurements – Part II: Experimental valida-tion for magnifi cations from 200 to 10,000,” Exp. Mech. 47(6):789– 804, (2007).
[16] Sutton, M.A., Li, N., Joy, D. C., Reynolds, A. P. and Li, X., “Scanning electron microscopy for quantitative small andlarge deformation measurements Part I: SEM imaging at magnifi cations from 200 to 10,000,” Exp. Mech. 47(6):775–787(2007).
[17] Cizmar, P., Vladar, A., and Postek, M. T. “Real-time scanning charged particle microscope image composition withcorrection of drift,” Microsc. Microanal. 17:302-308, (2011).
[18] Cizmar, P., Vladar, A., and Postek, M. T. “Advanced Image composition intra-frame drift correction” Proc. SPIE 8036:803680360D-1–80360D-5 (2011).
Proc. of SPIE Vol. 9236 923605-10
Downloaded From: http://spiedigitallibrary.org/ on 12/08/2014 Terms of Use: http://spiedl.org/terms