dof asa q2 2016 presentation
TRANSCRIPT

Q2 Financial Presentation 2016
DOF ASA

Highlights

- Q2 Presentation 2016DOF ASA
Main Highlights
General good operational performance in the period Increased activity from subsea projects Average utilisation total fleet of 88% Backlog 79% for the remainder of 2016 Refinancing completed in August Skandi Acu (PLSV) delivered and on-hire in August
3
All numbers based on management reporting
EBITDA Q2 MNOK 760 (EBITDA excl hedge MNOK 814)

- Q2 Presentation 2016DOF ASA
Highlights
Subsea
• Average utilisation project fleet 92% and TC (time charter) fleet 82%Project fleet:• Increased utilisation in Atlantic (North Sea) and US-gulf regions• Asia Pacific – Good utilisation and performance• Brazil – Low utilisationTC fleet:• Reduced utilisation – class dockings, vessels idle between contracts
AHTS/PSV
• North Sea & Med – Good utilisation, reduced earnings, one vessel in lay-up
• Brazil – Good utilisation and performance Brazil flagged fleet
• Asia Pacific – Variable utilisation and earnings
Operational
4

- Q2 Presentation 2016DOF ASA
Highlights
5
Skandi Gamma awarded extension with Maersk UK until end of 2016 Skandi Caledonia awarded extension with Apache until mid-January 2017 DOF Subsea awarded 5+2+2 year IMR contract to the Shell Prelude FLNG
facility Skandi Niteroi awarded 8 months firm and 8 months options with Petrobras Skandi Achiever secured ROV and diving contracts until end-October 2016 Skandi Vitoria awarded a new contract with Petrobras for the remainder of 2016 Skandi Emerald and Skandi Giant awarded 120 days + 1 x 5 weeks option each
with Schlumberger Asia Services, India Geograph awarded an 18 months extension with Petrobras Various subsea project contracts securing back log in Q2 Skandi Marstein awarded an 18 months contract with Nexen Petroleum UK, start
up May
Contracts

- Q2 Presentation 2016DOF ASA
Highlights
Fleet
6
Financing
Skandi Acu (PLSV) delivered in April and on-hire on 8 yrs contract with Petrobras
Skandi Paraty (AHTS) delivered in April and on-hire on a 4 yrs contract with Petrobras
Normand Reach redelivered
DOFSUB05 repaid in April
New Subordinated Convertible bond and a right issue in placed in August
A new facility of NOK 3 800 mill agreed

Overview Group

- Q2 Presentation 2016DOF ASA
DOF ASA in brief
Vessels
Fleet 67 vessels (wholly and partly owned) (19 PSV, 20 AHTS, 28 Subsea)
• 62 owned vessels in operation• 2 owned less than 50% • 3 Subsea newbuilds
1 subsea vessel chartered in from external owner
63 ROVs, 4 ROVs on order
NOK 31.9 billion in fair market value owned vessel in operation* (100% basis)
Average age 9.3 years, value adjusted fleet age of 6.7 years
Back log* Total NOK 63.5 bn
• Firm contracts : NOK 29.8 bn• Options: NOK 33.3 bn
Global organisation Head office in Norway Regional offices in Australia,
Singapore, UK, USA, Canada, Angola, Argentina and Brazil
Total of 4 601 employees* Subsea employees: 1 590 Marine personnel: 2 715
(*As per 30.06.2016)
8
28
20
19
1
Subsea
AHTS
PSV
Chartered SubseaVessels

- Q2 Presentation 2016DOF ASA
Fleet overview and contract coverage
* Including Newbuilds** Excl. vessels with minority share
9
No. of vessels
PSV AHTS Subsea Total fleet
DOF ASA/DOF REDERI AS 17 4 2 23
NORSKAN OFFSHORE 1 10 2 13
DOF SUBSEA AS 0 0 22* 22
DOF INSTALLER ASA 0 0 2 2
DOF DEEPWATER AS 0 5 0 5
Total fleet 18 19 28 65**
Contract coverage
Remaining 2016 Firm 87 % 71 % 78 % 79 %
Remaining 2016 Including options 94 % 71 % 82 % 82 %
2017 Firm 53 % 52 % 48 % 50 %
2017 Including options 79 % 56 % 58 % 63 %
Expectations for 2016:
• Our global footprint, track record and project capacity will be vital to secure utilisation
• Blocking rights in Brazil vital to secure contracts in this region

- Q2 Presentation 2016DOF ASA
DOF backlog overview 2016 -2020
• Total value backlog from 2020 and onwards is MNOK 34,927
26,813
2016 2017 2018 2019 2020 ThereafterOption 180 857 1 380 1 721 1 899 27 499Firm 3 646 5 588 4 813 4 190 3 172 8 577
8 577
27 499
0
1 000
2 000
3 000
4 000
5 000
6 000
7 000
8 000
9 000
10 000
NO
K m
illio
n
Contract coverage at 30.06.2016
- Q2 Presentation 2016DOF ASA 11
RegionPerth
Rio de Janeiro
Buenos Aires
Singapore
Houston
St. Johns
Aberdeen
Cairo
Brunei
Macaé
Jakarta
Manila
Luanda
Austevoll
Malaysia
30
5
23
6
1
Melbourne
Darwin
781
493
374
North America
Asia PacificBrazil
Atlantic
238
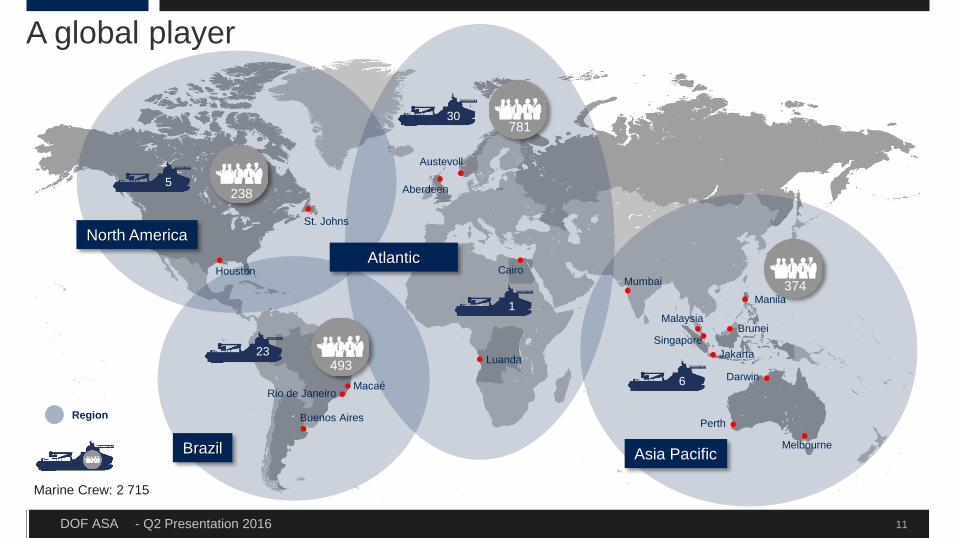
Marine Crew: 2 715
Mumbai
A global player

- Q2 Presentation 2016DOF ASA
374
Region
Perth
Rio de Janeiro
Buenos Aires
Singapore
Houston
St. Johns
Aberdeen
Cairo
Brunei
Macaé
Jakarta
Manila
Luanda
Austevoll
Malaysia
30
5
23
61
Melbourne
Darwin
781
493
238
Mumbai
Access to market - selected awards ytd 2016North Sea:Aug 2016: Skandi Gamma extension until end of 2016 with MaerskAug 2016: Skandi Caledonia extension until mid-January 2017 with Apache Apr 2016: Subsea frame agreement – 5 years with Maersk Apr 2016: Large PSV Skandi Gamma 3 months to MaerskApr 2016: PSV Skandi Marstein 18 months to NexenFeb 2016: Large AHTS Skandi Vega 1 year to Statoil
SE Asia / Australia:Jul 2016: MPSV and fulltime underwater services (IMR) to Shell Australia,
Prelude FLNG facility for 5 years + 2 x 2 year optionsMay 2016: 2x AHTS for 120 days with Schlumberger in IndiaApr 2016: LOI for EPCI project in 2017
12
Canada:Apr 2016: Subsea IMR / construction contracts
Brazil:Aug 2016: Skandi Acu on-hire 8 yrs to PetrobrasJun 2016: 7 months on PLSV Skandi Vitória to PetrobrasJun 2016: 8+8 months on PLSV Skandi Niterói to PetrobrasMay 2016: Subsea RSV Geograph 18 months to PetrobrasMay 2016: Skandi Paraty on-hire 4 yrs to Petrobras
West Africa:Apr 2016: FPSO installation YinsonJan 2016: PLSV 4 months
Argentina:Mar 2016: 2x AHTS 8-month extension contracts
US GoM:Jun 2016: ROV and dive contracts for Skandi Achiever

- Q2 Presentation 2016DOF ASA
Vessel Yard Delivery Type Contract Financing
Skandi Buzios 50% owned Vard Norway 2016 PLSV 8 yrs Petrobras
Skandi Recife 50% owned Vard Brazil 2017 PLSV 8 yrs Petrobras Loan agreement signed with BNDES
Skandi Olinda 50% owned Vard Brazil 2017 PLSV 8 yrs Petrobras Loan agreement signed with BNDES
Remaining newbuilding program
13
- Q2 Presentation 2016DOF ASA
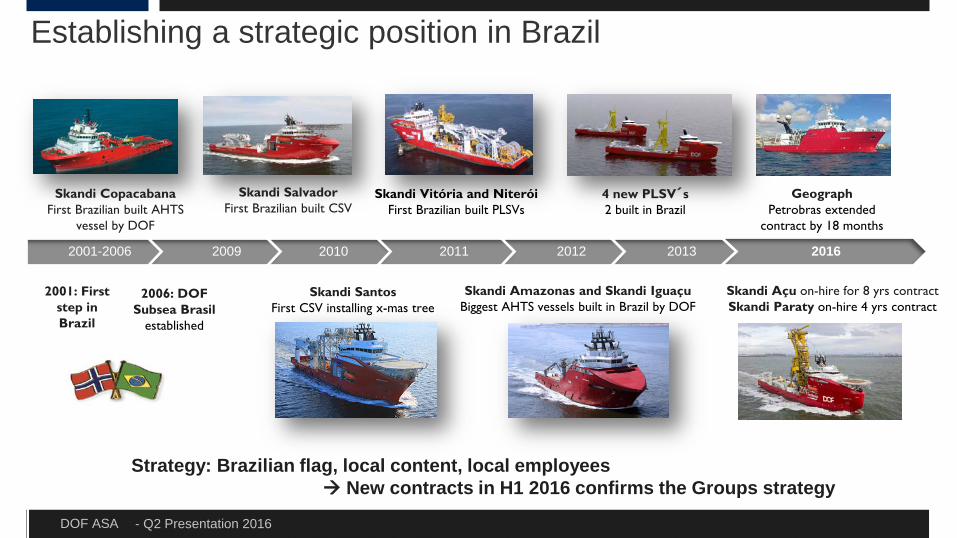
2001-2006 2009 2010 2011 2012 2013 2016
Establishing a strategic position in Brazil
Skandi Copacabana First Brazilian built AHTS
vessel by DOF
Skandi Vitória and NiteróiFirst Brazilian built PLSVs
Skandi Amazonas and Skandi IguaçuBiggest AHTS vessels built in Brazil by DOF
4 new PLSV´s 2 built in Brazil
2006: DOF Subsea Brasil
established
Skandi Salvador First Brazilian built CSV
Skandi SantosFirst CSV installing x-mas tree
2001: First step in Brazil
Strategy: Brazilian flag, local content, local employees New contracts in H1 2016 confirms the Groups strategy
Skandi Açu on-hire for 8 yrs contractSkandi Paraty on-hire 4 yrs contract
GeographPetrobras extended
contract by 18 months

- Q2 Presentation 2016DOF ASA
10
12
72
0
20
40
60
80
100
# vesselsBrazil AHTS fleet per April 2016
Brazil flag - DOFBrazil flag - OtherForeign
In DOF’s main segments, PLSV and AHTS, DOF vessels are protected by the CAA certificate system favoring local flagged & built vessels – no DOF vessels have been cancelled in Brazil
Petrobras has reduced the number of non-Brazilian vessels through two waves of vessel reduction, and the current fleet of AHTS vessels is estimated to be equal to the long-term demand for such vessels
Based on the percentage of foreign flagged vessels, and assuming continuation of the policy preferring Brazilian flagged vessels, DOF’s Brazilian AHTS vessels should be employed as long as total demand does not drop by more than 50-70%
The Brazilian legislation with CAA certificate is instrumental in keeping Brazilian flagged vessels on contract
Through the subsidiary DOF Subsea, the DOF Group is similarly well positioned in the PLSV segment:
DOF Group has 6 PLSVs including newbuilds, of which 4 are Brazilian built and 2 can be imported with Brazilian rights. There are no other known Brazilian built PLSVs
DOF Group has high local content in Brazil protected by flag regulations
Source: Managers based on data from IHS Petrodata
15

Refinancing DOF ASA

- Q2 Presentation 2016DOF ASA
Transaction summary
DOF ASA (excl 100% owned Norskan and 51% owned DOF Subsea) has restructured its capital structure through the following transactions:
A right issue of NOK 1 060 million completed in August A new Subordinated Convertible Bond established and replaced DOF 09,10 and 11, at 50% par value, NOK 1 032,5
million. Repurchase of NOK 209 million in the Subordinated Convertible Bond A new facility of NOK 3 800 million has been agreed with 13 banks to refinance 27 vessels with softer terms ( 75%
reduction in installments and and new financial covenants Net debt reduced by NOK 2 900 million Liquidity position improved by NOK 4 500 million over the next four years
Conclusion: DOF is in positioned to withstand a prolonged downturn
17

- Q2 Presentation 2016DOF ASA
DOF ASA position after refinancing
DOF have sufficient liquidity to sustain a downturn until 2020DOF is well positioned for healthy earnings when the market recovers
Positioned for market recovery
Access to market
through global presence
Strong back-log/long-term
contracts
Major oil & gas
customers
Offering vessel + subsea services
Leading subsea IMR
provider Modern, high-end fleet
Unique position in
Brazil
Improved financial position
18

- Q2 Presentation 2016DOF ASA
DOF Group has 3 business areas
DOF ASA
Norskan “DOF Rederi” DOF Subsea
Wholly-owned Brazilian entity
Fleet of 13 vessels whereof 10 Brazilian built or flagged, with local flag privileges
1 PSV, 10 AHTS vessels and 2 subsea vessels
Specialised in Brazil built tonnage to take advantage of local-flag benefits, effectively giving “local vessels” first-right-of-refusal over non-local vessels, including the possibility to “block” international vessels while on contracts
The non-Brazilian offshore vessel activities
18 PSVs, 9 AHTS* vessels, and 2 subsea vessels
• Including 5 owned 50% via DOF Deepwater
Subsea contractor owning 24 subsea vessels and 2 chartered-in
Owned 51/49% with First Reserve Corporation
Has built a global presence over the last 10 years
Developed the project business gradually; increasing complexity step-by-step and building a larger project back-log
Mix between owned and chartered in vessels
19
Installment in the restructured DOF Rederi
to be reduced by 75 % over the next 3 years

- Q2 Presentation 2016DOF ASA
DOF Group actual 2015 EBITDA was NOK 3.3 billion, excluding sales gains
Newbuilds for delivery after 2015* will generate NOK ~1.0 billion annual EBITDA on already firm contracts
DOF should generate in excess of NOK 4 billion in EBITDA in a normal market
Compared to an estimated 2020 net debt of NOK ~18 billion
Above implies NOK ~8-900 million net profit to DOF ASA shareholders
*Adding EBITDA of NOK ~1.2 billion gross on consolidated level: 4 PLSVs co-owned with Technip on 8-year contracts to Petrobras from delivery 2016/17 + Skandi Africa delivered 2015 with 5-year contract to Technip (9 months EBITDA included in figure as 3 months were reflected in 2015 EBITDA) + AHTS Paraty delivered mid-2016. Net of sold vessels: 5 vessels sold in Brazil in April 2015, Skandi Arctic sold June 2015, 3 PSVs sold 2H 2015, and Skandi Protector in 1Q16
Improving DOF’s financial position
-
1 000
2 000
3 000
4 000
5 000
NOK million
20

- Q2 Presentation 2016DOF ASA
DOF Group has 3 business areas
DOF ASA
Norskan “DOF Rederi” DOF Subsea
- 500
1 000 1 500 2 000 2 500 3 000 3 500 4 000
2012 2013 2014 2015 2016E
EBITDA
DOF Subsea Norskan "DOF Rederi"
21
Break-even EBITDA post-restructureAdjusted instalment NOK 1 600 million
Interest NOK 900 million
Maintenance CAPEX (est) NOK 250 - 400 million
Break-even EBITDA* NOK 2 750 – 2 900 million
* Compared to 2016, additional EBITDA of NOK 800 million from newbuilds
NIBD* NOK 20 400 millionper August
According to management reporting

- Q2 Presentation 2016DOF ASA
Adjust the Group’s capacity to the challenging market
Several cost cutting measures have been implemented during the last 12 months
The organisation has been reduced (onshore and offshore) with above10%
Salary cuts of 5-15% for the onshore employees in most of the regions has been implemented
Vessels have been re-allocated among regions in order to secure utilisation
Chartered-in vessels reduced from 5 vessels to 1 vessel
10 vessels sold
Re-negotiated terms with all major suppliers
Cost focus going forward Continuously focus on adjusting the Group’s capacity, cost level and risk exposure to the market
going forward
22
FinancialsManagement Reporting
- Q2 Presentation 2016DOF ASA
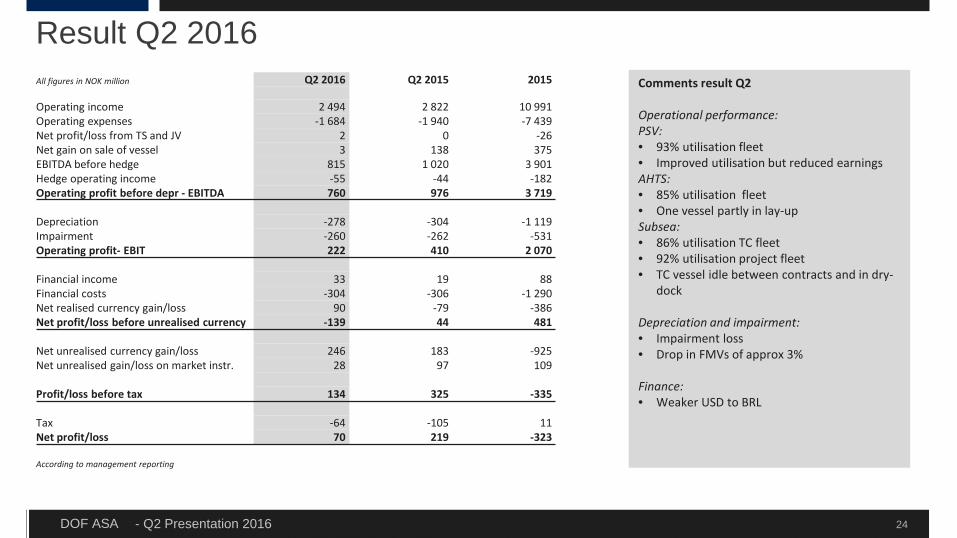
Result Q2 2016Comments result Q2
Operational performance:PSV:• 93% utilisation fleet• Improved utilisation but reduced earningsAHTS:• 85% utilisation fleet• One vessel partly in lay-upSubsea:• 86% utilisation TC fleet• 92% utilisation project fleet • TC vessel idle between contracts and in dry-
dock
Depreciation and impairment:• Impairment loss • Drop in FMVs of approx 3%
Finance:• Weaker USD to BRL
24
All figures in NOK million Q2 2016 Q2 2015 2015
Operating income 2 494 2 822 10 991 Operating expenses -1 684 -1 940 -7 439 Net profit/loss from TS and JV 2 0 -26 Net gain on sale of vessel 3 138 375 EBITDA before hedge 815 1 020 3 901 Hedge operating income -55 -44 -182 Operating profit before depr - EBITDA 760 976 3 719
Depreciation -278 -304 -1 119 Impairment -260 -262 -531 Operating profit- EBIT 222 410 2 070
Financial income 33 19 88 Financial costs -304 -306 -1 290 Net realised currency gain/loss 90 -79 -386 Net profit/loss before unrealised currency -139 44 481
Net unrealised currency gain/loss 246 183 -925 Net unrealised gain/loss on market instr. 28 97 109
Profit/loss before tax 134 325 -335
Tax -64 -105 11 Net profit/loss 70 219 -323
According to management reporting

- Q2 Presentation 2016DOF ASA
11 %20 %
69 %
EBITDA Q2 2016
PSV AHTS CSV
10 %
30 %60 %
EBITDA Q2 2015
PSV AHTS CSV
25
Segment reporting Q2 2016PSV AHTS CSV Total
Amounts in NOK mill Q2 2016 Q2 2015 Q2 2016 Q2 2015 Q2 2016 Q2 2015 Q2 2016 Q2 2015Operating income 247 301 416 400 1 777 2 076 2 439 2 778 Gain on sale of tangible assets - - - 96 3 42 3 138 Operating result before depreciation and impairment (EBITDA) 84 102 155 288 522 587 760 976 Depreciation 59 49 66 75 153 180 278 304 Impairment 55 12 78 140 127 110 260 262 Operating result (EBIT) -31 40 11 72 242 297 222 410
EBITDA margin 34 % 34 % 37 % 72 % 29 % 28 % 31 % 35 %EBIT margin -12 % 13 % 3 % 18 % 14 % 14 % 9 % 15 %
According to management reporting

- Q2 Presentation 2016DOF ASA
Historical Performance Group (excl gain from sale of assets)
26
According to management reporting
Q2 2013 Q2 2014 Q2 2015 Q2 2016Operating revenue 2 493 2 791 2 778 2 439EBITDA 770 866 838 757EBITDA margin 31 % 31 % 30 % 31 %
Non-current assets 28 347 28 757 28 610 30 682Current assets 4 727 4 861 4 976 4 495Total Assets 33 074 33 617 33 586 35 177
Equity 6 408 7 365 6 592 6 380Non-current debt 22 228 19 812 19 491 23 080Current debt 4 438 6 441 7 503 5 717Total Equity and Debts 33 074 33 617 33 586 35 177
0%
5%
10%
15%
20%
25%
30%
35%
40%
-
500
1 000
1 500
2 000
2 500
3 000
3 500
Q2 2013 Q3 2013 Q4 2013 Q1 2014 Q2 2014 Q3 2014 Q4 2014 Q1 2015 Q2 2015 Q3 2015 Q4 2015 Q1 2016 Q2 2016
EBIT
DA M
argi
n %
MN
OK
Operating revenue EBITDA EBITDA margin

- Q2 Presentation 2016DOF ASA
Balance Q2 2016Comments to balance
Assets:• One vessel sold and two vessels delivered
since year end• Intangible assets include deferred tax assets
MNOK 1 003 and goodwill MNOK 409
Financial assets:• Financial assets include minority share and
long term funding of JVs (ship owning companies)
Equity:• Positive (unrealised) currency impact since
year end
Non Current Liabilities:• Secured debt MNOK 20 348• Unsecured debt (bonds) MNOK 2 652
Current liabilities:• Current part interest term debt includes
bond, MNOK 700, balloons MNOK 280, normal amortisation , interest & credit facilities
27
Amounts in NOK million 30.06.2016 30.06.2015 31.12.2015
ASSETSIntangible assets 1 413 1 404 1 941Vessel and other tangible assets 26 305 24 006 24 967Newbuilds 2 315 2 834 943Financial assets 649 366 530Non-current assets 30 682 28 610 28 381
Receivables 2 828 3 026 2 772Cash and cash equivalents 1 667 1 951 2 220Asset held for sale 0 0 477Current assets incl asset held for sale 4 495 4 976 5 469Total assets 35 177 33 586 33 850
EQUITY AND LIABILITIESSubscribed equity 1 452 1 452 1 452Retained equity 1 339 1 542 439Non-controlling equity 3 590 3 599 3 281Equity 6 380 6 592 5 172
Provisions for commitments 79 130 121Other non-current liabilities 23 000 19 361 22 946Non-current liabilities 23 080 19 491 23 067
Current part of interest bearing debt 3 806 5 604 3 198Other current liabilities 1 911 1 899 2 152Liabilities held for sale 0 0 260Current liabilities 5 717 7 503 5 611Total equity and liabilities 35 177 33 586 33 850
According to management reporting

- Q2 Presentation 2016DOF ASA
Key Figures
28
-
1,00
2,00
3,00
4,00
5,00
6,00
7,00
8,00
9,00
-
5 000
10 000
15 000
20 000
25 000
2011 2012 2013 2014 2015 H2 2016*
Mill
ion
NO
K
NIBD historical development
Net interest bearing debt ex unemployed capital
EBITDA ex gain on sale of assets and hedge accounting
NIBD/EBITDA
* EBITDA for current quarter plus 3 previous quarters.
Q2 2016 Q2 2015 2015
FINANCIAL RESULTEBITDA margin (ex. net gain on sale of vessel and hedge accounting) 1 33 % 31 % 32 %EBIT margin (ex. net gain on sale of vessels and hedge accounting) 2 11 % 11 % 17 %
Profit per share ex. non-controlling interest -0,07 0,60 0,73
Profit per share ex. unrealised loss/gain and taxes -0,12 -0,96 5,00
BALANCEReturn on net capital 5 % 3 % -6 %Equity ratio 18 % 20 % 15 %Value adjusted equity 30 % 32 % 33 %Net interest bearing debt 24 723 22 560 23 731 Net interest bearing debt ex. unemployed capital 22 408 19 727 22 788 NIBD/EBITDA 3 14,51 10,67 6,46 NIBD/EBIT 4 47,02 22,12 12,14
1 EBITDA excluded net gain on sale of assets and hedge accounting / Operating Income
2 EBIT excluded net gain on sale of assets and hedge accounting / Operating Income3 Net interest bearing debt excluded unemployed capital / 4 quarters rolling EBITDA excluded net gain on sale of assets and hedge accounting4 Net interest bearing debt excluded unemployed capital / 4 quarters rolling EBIT excluded net gain on sale of assets and hedge accounting
According to management reporting

- Q2 Presentation 2016DOF ASA
Net interest bearing debt 30.06.2016
29
Comments current interest bearing debt:
Non-current debt:• DOF9, DOF10 and DOF11 MNOK 1 365
deleted in August and replaced with a Subordinated Convertible Bond
Current debt:• DOF09 MNOK 700 (deleted in August)• Debt to credit institutions:
• Two balloons MNOK 280• Amortisation MNOK 2 253
Cash and derivatives:• MNOK 457 represent cash deposit
Amounts in NOK million 30.06.2016 30.06.2015 31.12.2015
Bond loan 2 652 3 378 3 347 Debt to credit institutions 20 115 15 725 19 328 Total non-current interest bearing liabilities 22 766 19 102 22 674
Bond loan 700 700 422 Debt to credit institutions 2 533 4 218 2 422 Utilised credit facilities 391 491 172 Liabilities held for sale - - 260 Total current interest bearing liabilities 3 624 5 409 3 276
Total interest bearing liabilities 26 390 24 511 25 951
Cash and cash equivalents 1 667 1 951 2 220 Total net interest bearing liabilities 24 723 22 560 23 731
Newbuilds 2 315 2 834 943
Net interest bearing liabilities, excluding unemployed capital 22 408 19 727 22 788
According to management reporting

- Q2 Presentation 2016DOF ASA
Cash Flow Statement
30
Comments Cash flow Statement
Operating activities• High volatility in working capital in Q2 2016
Investing activities• Delivery of two new-builds
Financing activitites:Proceeds: Funding new builds
Refinancing one facilityPrepayments: Balloons and amortisation
Amounts in NOK million Q2 2016 Q2 2015 YTD Q2 2016 YTD Q2 2015
Cash from operating activities 781 1 236 1 432 1 797 Net interest paid -277 -276 -551 -635 Taxes paid -14 -46 -39 -137 Net cash from operating activities 490 913 842 1 026
Sale of tangible assets 3 659 551 1 919 Purchase of tangible assets -1 611 -1 183 -2 838 -3 244 Sale of shares -0 417 3 417 Purchase of shares - - - -Other changes in investing activities -17 -167 -149 -190 Net cash from investing activities -1 625 -274 -2 433 -1 097
Proceeds from borrowings 1 629 1 757 3 292 3 510 Prepayment of borrowings -609 -1 954 -2 203 -4 272 Payment from/to non-controlling interests -26 -18 -26 -18 Net cash from financing activities 993 -216 1 063 -780
Net changes in cash and cash equivalents -142 423 -528 -851
Cash and cash equivalents at the start of the period 1 799 1 522 2 220 2 695 Exchange gain/loss on cash and cash equivalents 10 5 -25 107 Cash and cash equivalents at the end of the period 1 667 1 951 1 667 1 951
According to management reporting

- Q2 Presentation 2016DOF ASA 31
Management reporting vs Financial reportingRESULT Q2 2016 Q2 2015
Amounts in NOK mill
Management reporting
Reconciliation to equity method
Financial reporting
Management reporting
Reconciliation to equity method
Financial reporting
Operating income 2 439 -75 2 364 2 778 -129 2 648 Operating expenses -1 684 29 -1 655 -1 940 20 -1 920 Net profit from associated and joint ventures 2 -29 -28 0 104 104 Net gain on sale of tangible assets 3 - 3 138 -43 95
Operating profit before depreciation EBITDA 760 -75 685 976 -48 928 Depreciation -278 12 -266 -304 23 -282 Impairment -260 28 -232 -262 - -262 Operating profit - EBIT 222 -35 187 410 -25 384
Financial income 33 6 39 19 4 23 Financial costs -304 10 -294 -306 13 -293 Net realised gain/loss on currencies -90 15 -74 -79 13 -67 Net unrealised gain/loss on currencies 246 -1 244 183 -27 156 Net changes in fair value of financial instruments 28 -0 27 97 -2 96 Net financial costs -88 30 -58 -85 - -85 Profit (loss) before taxes 134 -5 129 325 -25 300 Taxes -64 5 -59 -105 25 -81 Profit (loss) 70 -0 70 219 0 219

- Q2 Presentation 2016DOF ASA 32
Management reporting vs Financial reportingBALANCE 30.06.2016 30.06.2015
Amounts in NOK mill
Management reporting
Reconciliation to equity method
Financial reporting
Management reporting
Reconciliation to equity method
Financial reporting
ASSETSIntangible assets 1 413 -68 1 345 1 404 -91 1 313 Tangible assets 28 620 -4 294 24 327 26 840 -2 796 24 044 Non-current financial assets 649 1 290 1 939 366 1 011 1 377
Total non-current assets 30 682 -3 071 27 611 28 610 -1 877 26 733
Receivables 2 828 -124 2 703 3 026 -73 2 953 Cash and cash equivalents 1 667 -225 1 442 1 951 -76 1 874
Total current assets 4 495 -349 4 145 4 976 -149 4 827 Asset held for sale - - - - - -
Total current assets incl. Asset held for sale 4 495 -349 4 145 4 976 -149 4 827 Total assets 35 177 -3 421 31 756 33 586 -2 026 31 560
EQUITY AND LIABILITIESEquity 6 380 - 6 380 6 592 - 6 592 Non-current provisions and commitments 79 -35 45 130 -30 101 Non-current liabilities 23 000 -3 047 19 953 19 361 -1 767 17 594 Current liabilities 5 717 -339 5 378 7 503 -229 7 274
Total liabilities 28 797 -3 421 25 376 26 994 -2 026 24 968 Liabilities held for sale - - - - - -Total liabilities incl. Liabilities held for sale 28 797 -3 421 25 376 26 994 -2 026 24 968 Total equity and liabilities 35 177 -3 421 31 756 33 586 -2 026 31 560
Net interest bearing liabilities 24 723 -3 034 21 689 22 560 -1 856 20 705

- Q2 Presentation 2016DOF ASA
DO
F ex
Sub
sea
DO
F S
ubse
a
Bonds:• DOF09, 10 and 11 deleted and replaced by a Subordinated
Convertible bond
Bank Balloons:• Reduced amortisation DOF after refinancing
DOF GROUP COUNTERPARTY EXPOSURE Q2 2016
33
ECA mainly represent exposure with Norwegian and Brazilian ECAs
Debt maturity profile after restructuring debt
-
1 000
2 000
3 000
4 000
5 000
6 000
7 000
8 000
2016 2017 2018 2019 2020 After
Bank Debt
Balloons
Bond
-
500
1 000
1 500
2 000
2 500
3 000
3 500
4 000
4 500
2016 2017 2018 2019 2020 After
Bank Debt
Balloons
Bond
44 % 50 %
6 %
ECA
Banks
Bonds

DOF Subsea
- Q2 Presentation 2016DOF ASA
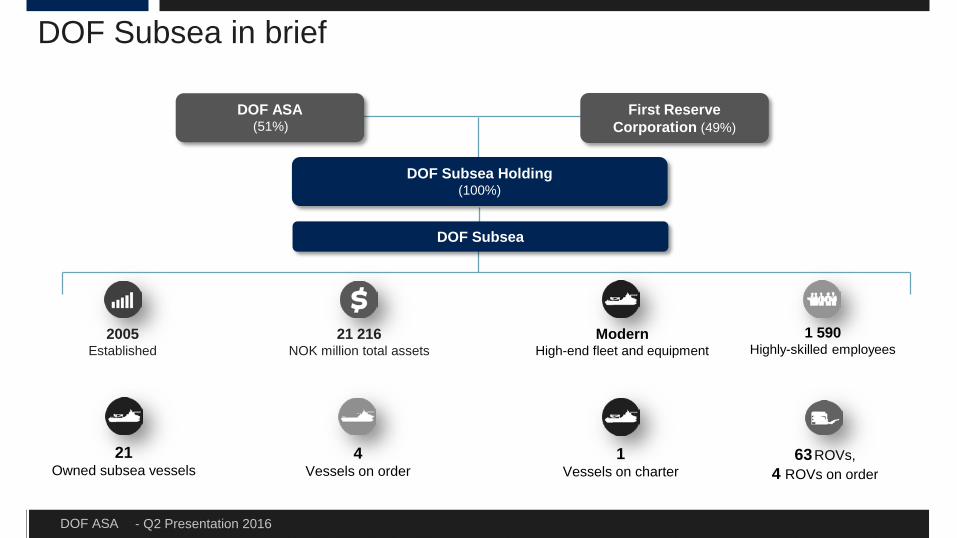
2005Established
21 216 NOK million total assets
ModernHigh-end fleet and equipment
21Owned subsea vessels
4Vessels on order
1Vessels on charter
63ROVs,4 ROVs on order
First Reserve Corporation (49%)
1 590Highly-skilled employees
DOF Subsea Holding(100%)
DOF ASA(51%)
DOF Subsea in brief
DOF Subsea
- Q2 Presentation 2016DOF ASA
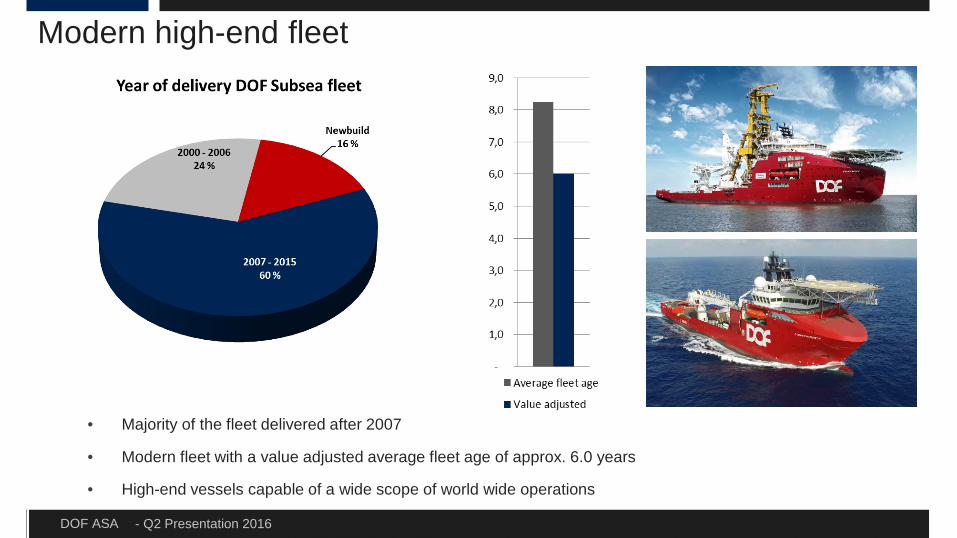
• Majority of the fleet delivered after 2007
• Modern fleet with a value adjusted average fleet age of approx. 6.0 years
• High-end vessels capable of a wide scope of world wide operations
Modern high-end fleet

- Q2 Presentation 2016DOF ASA
DOF Subsea ranked as IMCA International Contractor
Tier 1
Tier 2
Tier 3
IMCA Membership
Surf / IMR / Construction
Heavy lift / trunkline / FPSO / Intervention
Vessel operators
GlobalContractor (6)
Saipem, Technip,Subsea 7
Allseas, Hereema, McDermott
International Contractor(6)
DOF, EMAS,Fugro
Helix, BW, SBM
Contractor Ocean Installer, Bibby, several others
Several Farstad, Eidesvik, Havila, Island Offshore, Olympic, Solstad
Typically lump sum projects driven by E&P spending
Typically day rate projects, OPEX driven within IMR/Light construction
37

- Q2 Presentation 2016DOF ASA
DOF Subsea - a leading subsea IMR provider
38
Awarded IMR contracts with total value of NOK 6.5 billion in 2015
Continues with Shell IMR contract award July 2016 – 5+2+2 year contract
Combination of vessel expertise, subsea operations and low overhead makes DOF competitive
Historical margins approx. 10-15 %, and typically 3-10 year contracts + vessel EBITDA
Highly competitive today, but still positive margins 2-7 % + vessel EBITDA
Several opportunities with key clients (APAC, Atlantic, Brazil and North America)
Stable/improving IMR market going forward
Increased demand for one supplier of vessel andIMR services, with ability to deliver light construction
DOF is well positioned to capture more contracts in this market

- Q2 Presentation 2016DOF ASA
DOF Subsea - a leading subsea IMR provider
Shell Australia awarded DOF Subsea a 5 year + 2 x 2 year options for fulltime Underwater Services and Multi-Purpose Supply Vessel (MPSV) Services to the Prelude FLNG facility, offshore Australia
Combination of vessel expertise, subsea operations track-record and shared safety, environmental and local-content objectives made DOF Subsea competitive
Established local presence and organisational expertise - combination of Australian and Norwegian teams
Client opted for an integrated solution with one supplier
Differentiated offering from DOF resulted in contract award
Integrated work scope:• Provision of MPSV and substitute
MPSV with associated marine crew; • Project Management and Engineering• IMR program services • Subsea inspection/intervention services• Survey Services• Data Management / Reporting services • ROV and tooling services • Asset management• Platform Supply services • Non-planned maintenance • Emergency response
Client and location:Shell Australia is part of The Shell Group, a global group of energy and petrochemical companies. Shell’s world-leading FLNG technology is to be deployed at the Prelude FLNG facility – it is the largest floating facility ever built, it will produce, liquefy, store and transfer LNG at sea. The facility will be located 475 kilometres north-north east of Broome, in Western Australia.
39

- Q2 Presentation 2016DOF ASA 40
According to management reporting
DOF Subsea quarterly performance (excl. asset sales)
NOK Million Q2 2013 Q2 2014 Q2 2015 Q2 2016Operating revenue 1 679 1 963 1 962 1 660 EBITDA 471 543 515 510 EBITDA margin 28% 28% 26% 31%
Non-current assets 16 344 16 151 16 578 18 206 Current assets 3 319 3 252 3 414 3 010 Total assets 19 663 19 403 19 992 21 216
Equity 4 996 5 962 6 405 6 330 Non-current debt 11 862 9 701 9 009 11 864 Current debt 2 805 3 741 4 577 3 022 Total Equity and Debts 19 663 19 404 19 991 21 216
0%
5%
10%
15%
20%
25%
30%
35%
40%
-
500
1 000
1 500
2 000
2 500
Q2 2013 Q3 2013 Q4 2013 Q1 2014 Q2 2014 Q3 2014 Q4 2014 Q1 2015 Q2 2015 Q3 2015 Q4 2015 Q1 2016 Q2 2016
EBIT
DA m
argi
n
NO
K m
illio
n
Operating income EBITDA EBITDA margin

- Q2 Presentation 2016DOF ASA
In general, weak global markets within supply and subsea, however still differences in regional opportunitiesSubsea: APAC market
Reduced spending from operators leading to low activity Competition scene changing with the bigger contractors now interested in IMR as
construction work dries up
DOF SUB: Still long and short term opportunities, but downward pressure on rates and slower tender activities
Brazil market We expect a slow market, with few new tenders, strong pressure on rates and “blocking activity” leading to termination and renegotiation of contracts (DOF is benefiting from blockings).
DOF SUB: Challenging and time-consuming for vessels that are up for renewal
Important with Brazilian flag
Market and outlook
41

- Q2 Presentation 2016DOF ASA
Market and outlook
42
Subsea: North America market We still see a reasonable level of activities in the IMR and Tie-back, however prices
are lower due to cost saving approach by the Operators Added opportunities following fewer competitors in market Better opportunity in Canada, where local presence is minimum
DOF SUB: Maintaining our position. We expect to see a gradual increase in market share in the medium
term, as target clients provide access to opportunities. Flexible business model with chartered-in vessels.
Atlantic market We expect Norway to be weak in 2016 We expect UK to be weak in 2016
DOF SUB: Normand Reach redelivered

- Q2 Presentation 2016DOF ASA
Market and outlook
43
Supply: Brazil: Slow market continues, with few new tenders, increased competition and lower rates. Petrobras redelivering vessels in order to reduce current fleet size, but at slower pace. DOF: Few vessels up for renewal. There are some opportunities for Brazilian flagged and international
vessels using “REB flag import capacity”, through blocking. Slow progress on negotiations and risk of idle time.
North Sea: We expect the North Sea market for both AHTS and PSV to be weak.DOF: Low market exposure in Q3, but gradually higher exposure going forward.Asia Pacific: We see low tender activity in the region within supply. Downward pressure on rates and over-supply of tonnage.DOF: 3 vessels in the region, two on term contracts and one in the spot market.

- Q2 Presentation 2016DOF ASA
Operational EBITDA for Q3 2016 to be weaker than Q2 2016, however no change in full year guidance
Refinancing plan completed and DOF has secured sufficient liquidity to sustain a downturn until 2020 and is well positioned for healthy earnings when the marketrecovers
Challenging markets expected to continue
Outlook
44

Thank youPresented by Mons Aase - CEOHilde Drønen - CFO

- Q2 Presentation 2016DOF ASA
DISCLAIMER
This presentation by DOF ASA designed to provide a high level overview of aspects of the operations of the DOF ASA Group.The material set out in the presentation is current as at 17 August 2016.This presentation contains forward-looking statements relating to operations of the DOF ASA Group that are based onmanagement’s own current expectations, estimates and projections about matters relevant to DOF ASA‘s future financialperformance. Words such as “likely”, “aims”, “looking forward”, “potential”, “anticipates”, “expects”, “predicts”, “plans”, “targets”,“believes” and “estimates” and similar expressions are intended to identify forward-looking statements.References in the presentation to assumptions, estimates and outcomes and forward-looking statements about assumptions,estimates and outcomes, which are based on internal business data and external sources, are uncertain given the nature of theindustry, business risks, and other factors. Also, they may be affected by internal and external factors that may have a materialeffect on future business performance and results.No assurance or guarantee is, or should be taken to be, given in relation to the future business performance or results of theDOF ASA Group or the likelihood that the assumptions, estimates or outcomes will be achieved.While management has taken every effort to ensure the accuracy of the material in the presentation, the presentation is providedfor information only. DOF ASA , its officers and management exclude and disclaim any liability in respect of anything done inreliance on the presentation.All forward-looking statements made in this presentation are based on information presently available to management and DOFASA assumes no obligation to update any forward looking- statements. Nothing in this presentation constitutes investmentadvice and this presentation shall not constitute an offer to sell or the solicitation of any offer to buy any securities or otherwiseengage in any investment activity.You should make your own enquiries and take your own advice (including financial and legal advice) before making aninvestment in the company's shares or in making a decision to hold or sell your shares.
46