doherty et al. 2011 greater sage-grouse sab 21
DESCRIPTION
Abstract. We developed a framework for conservationplanning to evaluate options for reducingdevelopment impacts on Greater Sage-Grouse(Centrocercus urophasianus) in Wyoming, Montana,Colorado, Utah, North Dakota, and South Dakotathat contained some of the largest populations andhighest risk of energy development. We used lekcountdata (N 2,336 leks) to delineate highabundancepopulation centers, which we termedcore regions, that contained 25%, 50%, 75%, and100% of the known breeding population. Weassessed vulnerability of these areas by examiningrisk of future land transforming uses from energydevelopment. Sage-grouse abundance varied bystate. Core regions contain a disproportionatelylarge segment of the breeding population, andcore regions vary dramatically by risk of futureenergy development. Wyoming contains 64% ofthe known sage-grouse population and moreactive leks than all the other states combinedwithin our study area. Conservation success inWyoming will depend on leasing and permittingpolicy decisions because this state has the highestrisk of development. Montana contains fewersage-grouse (24%) than Wyoming, but actions thatreduce sagebrush (Artemisia spp.) tillage by providingprivate landowners incentives to maintain sagebrush-dominated landscapes would providelasting benefits because core regions in Montanaare at comparatively low development risk. Habitatrestoration in areas with low risk of developmentbut containing fewer sage-grouse fit into theoverall conservation strategy by targeting populationsthat promote connectivity of core regions.This vulnerability assessment illustrates the tradeoffsbetween conservation and energy development,and provides a framework for maintainingpopulations across the species’ eastern range.TRANSCRIPT

CHAPTER TWENTY-ONE
Energy Development and Conservation Tradeoffs
SYSTEMATIC PLANNING FOR GREATER SAGE-GROUSE IN THEIR EASTERN RANGE
Kevin E. Doherty, David E. Naugle, Holly E. Copeland, Amy Pocewicz, and Joseph M. Kiesecker
Abstract. We developed a framework for conserva-tion planning to evaluate options for reducing development impacts on Greater Sage-Grouse (Centrocercus urophasianus) in Wyoming, Montana, Colorado, Utah, North Dakota, and South Dakota that contained some of the largest populations and highest risk of energy development. We used lek-count data (N � 2,336 leks) to delineate high-abundance population centers, which we termed core regions, that contained 25%, 50%, 75%, and 100% of the known breeding population. We assessed vulnerability of these areas by examining risk of future land transforming uses from energy development. Sage-grouse abundance varied by state. Core regions contain a disproportionately large segment of the breeding population, and core regions vary dramatically by risk of future energy development. Wyoming contains 64% of the known sage-grouse population and more active leks than all the other states combined within our study area. Conservation success in Wyoming will depend on leasing and permitting policy decisions because this state has the highest risk of development. Montana contains fewer sage-grouse (24%) than Wyoming, but actions that reduce sagebrush (Artemisia spp.) tillage by pro-viding private landowners incentives to maintain
sagebrush-dominated landscapes would provide lasting benefits because core regions in Montana are at comparatively low development risk. Habi-tat restoration in areas with low risk of develop-ment but containing fewer sage-grouse fit into the overall conservation strategy by targeting popula-tions that promote connectivity of core regions. This vulnerability assessment illustrates the trade-offs between conservation and energy develop-ment, and provides a framework for maintaining populations across the species’ eastern range. Key Words: Centrocercus urophasianus, conserva-tion planning, core regions, energy development, lek counts, prioritization, risk assessment, sage-grouse, Wyoming.
El Equilibrio Entre el Desarrollo de Energía y la Conservación: Planeamiento Sistemático para el Greater Sage-Grouse en la Extensión Oriental de Su Territorio
Resumen. Desarrollamos un marco para el pla-neamiento de la conservación para evaluar opciones que ayuden a reducir los impactos del desarrollo sobre el Greater Sage-Grouse (Centrocercus uropha-sianus) en Wyoming, Montana, Colorado, Utah,
Doherty, K. E., D. E. Naugle, H. E. Copeland, A. Pocewicz, and J. M. Kiesecker. 2011. Energy development and conservation tradeoffs: systematic planning for Greater Sage-Grouse in their eastern range. Pp. 505–516 in S. T. Knick and J. W. Connelly (editors). Greater Sage-Grouse: ecology and conservation of a landscape species and its habitats. Studies in Avian Biology (vol. 38), University of California Press, Berkeley, CA.
505
Knick_ch21.indd 505Knick_ch21.indd 505 3/1/11 11:42:31 AM3/1/11 11:42:31 AM
STUDIES IN AVIAN BIOLOGY NO. 38 Knick and Connelly506
y Dakota del Norte y del Sur, siendo que estos esta-dos contuvieron algunas de las poblaciones más grandes y de riesgo más alto de desarrollo de energía. Utilizamos datos de conteo de los leks (asambleas de cortejo)(N � 2,336 leks) para delin-ear centros de población de gran abundancia a las que denominamos regiones núcleo, que con-tuvieran 25%, 50%, 75%, y 100% de la población de cría conocida. Determinamos la vulnerabili-dad de estas áreas examinando el riesgo de futuros cambios en el uso de la tierra para el desarrollo de energía. La abundancia del sage-grouse varía según el estado, las regiones núcleo contienen un segmento desproporcionadamente grande de la población de cría, y las regiones núcleo varían dramáticamente por el riesgo de desarrollo de energía futuro. Wyoming contiene el 64% de la población conocida del sage-grouse, y la mayor cantidad de leks activos que el resto de los estados combinados dentro de nuestra área de estudio. El éxito de conservación en Wyoming dependerá del leasing (alquiler con opción a com-pra) y de permitir decisiones políticas ya que este estado tiene el riesgo más alto de desarrollo.
Montana contiene menos sage-grouse (24%) que Wyoming, pero las acciones que reduzcan la labranza del sagebrush (Artemisia spp.) ofre-ciendo incentivos a los terratenientes privados para mantener los paisajes dominados por artemisa, proporcionarían ventajas duraderas porque las regiones núcleo en Montana están en riesgo de desarrollo comparativamente bajo. La restauración del hábitat en áreas con poco riesgo de desarrollo pero que contengan menos sage-grouse cabe dentro de la estrategia general de conservación al fijar como objetivo poblaciones que promuevan la conectividad de las regiones núcleo. Esta evaluación de la vulnerabilidad ilus-tra el equilibrio (o tradeoffs) entre la conservación y el desarrollo de energía, y proporciona un marco para proteger a las poblaciones en la exten-sión oriental del territorio de esta especie. Palabras Clave: Centrocercus urophasianus, con-teos de lek, desarrollo de la energía, evaluación de riesgos, planificación de la conservación, priorización, regiones centrales, sage-grouse, Wyoming.
World demand for energy is predicted to increase by �50% in the next 20 years (International Energy Agency 2007,
National Petroleum Council 2007). The Rocky Mountain West will be one of the most heavily affected landscapes in the continental United States, as it has 7% of proven onshore oil reserves and 26% of natural gas reserves (United States Departments of the Interior, Agriculture, and Energy 2006). Meeting 20% of United States energy demand with wind power could impact 50,000 km2, a significant portion of which would be in the Rocky Mountain West (United States Department of Energy 2008). The increasing energy demand of an expanding human popu-lation poses a challenge to conservation of wild-life populations in North America (Sawyer et al. 2006, Walker et al. 2007a). Energy development is known to impact wildlife directly by altering habitat use (Doherty et al. 2008) and population dynamics (Sorensen et al. 2008), and indirectly by facilitating spread of nonnative invasive plants (Bergquist et al. 2007) and new diseases such as West Nile virus in North America (Naugle et al. 2004, Zou et al. 2006b). The ability to identify areas
of high biological value and assess the potential for adverse habitat alteration is a component of a proactive rather than a reactive approach to con-servation (Groves et al. 2002). Not all wildlife areas are of equal value, and mapping high-abundance population centers for a priority species can help frame regional plans. Realization of conservation goals requires plans be constructed at broad spa-tial scales to provide for effective management (Soulé and Terborgh 1999, Margules and Pressey 2000). Plans that explicitly examine tradeoffs between wildlife conservation and energy develop-ment will need to be broad in scale to be effective, given the scale of anticipated energy development in the western United States. Loss and degradation of native vegetation has impacted much of the sagebrush (Artemisia spp.) ecosystem and associated wildlife (Knick et al. 2003, Connelly et al. 2004). Greater Sage-Grouse (Centrocercus urophasianus; hereafter, sage-grouse) is a gallinaceous species native only to western semiarid sagebrush landscapes (Schroeder et al. 1999). Previously widespread, sage-grouse have been extirpated from nearly half of their original range in western North America (Schroeder et al.
Knick_ch21.indd 506Knick_ch21.indd 506 3/1/11 11:42:32 AM3/1/11 11:42:32 AM

ENERGY DEVELOPMENT AND CONSERVATION TRADEOFFS 507
2004), with a range-wide population decline of 45–80% and local declines of 17–92% (Connelly and Braun 1997, Braun 1998, Connelly et al. 2004). Energy development has emerged as a key issue in sage-grouse conservation for three reasons: (1) sage-grouse populations decline with oil and gas development (Holloran 2005, Aldridge and Boyce 2007, Walker et al. 2007a); (2) land-scapes being developed contain some of the high-est abundance estimates for sage-grouse in North America; and (3) 44% of the lands that the federal government has authority to control for oil and gas development in the eastern range of sage-grouse (7,000,000 of 16,000,000 ha) have already been authorized for exploration and development (Naugle et al., this volume, chapter 20). It is urgent that we identify areas of high bio-logical value and areas of potential future develop-ment to evaluate options for reducing impacts (Abbitt et al. 2000, Balmford et al. 2001, Wilson et al. 2005), given sage-grouse sensitivity to oil and gas development and the projected rate of in- creased development. We focused on identifying core regions of sage-grouse abundance to illustrate the process of risk assessment and to contrast opposing conservation strategies. Lek-count data provided an opportunity to spatially identify the distribution and abundance of core regions of hab-itat that support breeding populations. Our goal was to develop a conservation planning framework (Pressey and Bottrill 2008) to address the follow-ing questions using readily available spatial data: (1) Where are landscapes with the highest biologi-cal value for sage-grouse? (2) How do these land-scapes differ with respect to risk from future energy development? and (3) How does variation and juxtaposition in risk and biological values of areas affect the potential to develop a successful conservation strategy for sage-grouse?
STUDY AREA
Our study area included landscapes within the eastern distribution of sage-grouse including por-tions of Colorado, Montana, North Dakota, South Dakota, Utah, and Wyoming (Fig. 21.1; Schroeder et al. 2004). Schroeder et al. (2004) used a combi-nation of lek-survey data; geographic information system (GIS) habitat layers to exclude barren areas, alpine areas, and forest habitats; and loca-tions of radio-marked sage-grouse to delineate the current occupied distribution for sage-grouse
in all of North America. We modified this bound-ary to include 27 additional known lek locations in Montana, South Dakota, Wyoming, and Colorado outside the boundaries suggested by Schroeder et al. (2004). We adopted a spatial organizational framework based on the Western Association of Fish and Wildlife Agencies Sage-Grouse Management Zones (SMZs; Stiver et al. 2006), which are delineated by floristic prov-inces and used to group sage-grouse populations for management actions. We restricted analyses to areas within the eastern distribution that were within the Great Plains SMZ (portions of Mon-tana, Wyoming, North Dakota, South Dakota, Saskatchewan, and Alberta) and the Wyoming Basin SMZ (portions of Idaho, Wyoming, Utah, Montana, and Colorado) (Fig. 21.1; Stiver et al. 2006) because these populations are experienc-ing the highest risk of energy development. All analyses presented evaluate the relative impor-tance of an individual breeding area to all other breeding areas within these management zones (Fig. 21.1).
METHODS
Sage-Grouse Abundance Data
Knowledge of high-abundance population centers for priority species represents a starting point to frame regional conservation initiatives and can direct management actions to landscapes where they will have the largest benefit to regional popu-lations (Groves et al. 2002, Sanderson et al. 2002b). Techniques such as resource selection functions have been widely used in the absence of large-scale survey data to identify critical habitat needs and to map those habitats at appropriate scales for a wide range of species ( McLoughlin et al. 2002, Boyce et al. 2003, Johnson et al. 2006) including sage-grouse (Aldridge and Boyce 2007, Doherty et al. 2008). No seamless habitat coverage is available for sage-grouse to build seasonal mod-els that could form the comparison of the relative biological value of different landscapes. Fortu-nately, sage-grouse are one of the few species in which extensive data sets exist on distribution and relative abundance across their entire breeding distribution, making an analysis of this scale pos-sible (Connelly et al. 2004, Schroeder et al. 2004). The concept of using high-abundance population centers to define the size, shape, connectivity,
Knick_ch21.indd 507Knick_ch21.indd 507 3/1/11 11:42:32 AM3/1/11 11:42:32 AM

STUDIES IN AVIAN BIOLOGY NO. 38 Knick and Connelly508
replication, and spacing of conservation areas is well documented in other systems (Myers et al. 2000, Groves et al. 2002, Sanderson et al. 2002b). Breeding ground (lek) data have been widely used by agencies to monitor sage-grouse popula-tion trends and are considered a reasonable index to relative abundance (Walsh et al. 2004, Reese and Bowyer 2007). Each spring, displaying males are counted within each state on sage-grouse leks in a large, coordinated effort by state, federal, and con-tract employees across the entire distribution of the species. Typically, leks are visually surveyed at least three times each spring from the air or ground, and displaying males are counted during the early morning. Protocols for counting males at leks were almost identical among states following the
recommendations of Connelly et al. (2003b), which allowed for comparisons between state populations. We used the maximum count of male sage-grouse to identify high-abundance areas. Each state wild-life agency assembled and provided us a maximum lek count for each year the lek was surveyed over the past 11 years, along with spatial coordinates of lek locations. This maximum count database pro-vided us the ability to map relative abundance of sage-grouse breeding areas. We analyzed 2,336 active leks to delineate breeding core regions. We defined active leks as those on which �2 males were counted in the last year the lek was surveyed. We used the highest count during 2005–2007 because not all leks are counted each year, but most are counted within a three-year interval. However,
Figure 21.1. Core regions that contain 25%, 50%, 75%, and 100% of the known breeding population of Greater Sage-Grouse in their eastern range. Distribution boundaries are the combined areas of the Great Plains and Wyoming Basin Greater Sage-Grouse Sage-Grouse Management Zones (Stiver et al. 2006). Inset depicts locations of producing oil and gas wells (black triangles) as of September 2007.
Knick_ch21.indd 508Knick_ch21.indd 508 3/1/11 11:42:32 AM3/1/11 11:42:32 AM

ENERGY DEVELOPMENT AND CONSERVATION TRADEOFFS 509
249 leks in Montana, primarily in Rosebud, Custer, and Garfield Counties, were not counted during this interval, and we used the most recent survey within the 11-year interval to assign abundance val-ues to these leks. We also included the last count of five leks in Colorado after consultation with regional biologists indicated that counts of 0 males recorded in 2007 were likely a result of no survey effort.
Mapping Core Sage-Grouse Breeding Areas
Kernel density functions have been commonly used in ecology to delineate home ranges of indi-vidual animals and to map concentrated areas of use by populations (Silverman 1986, Worton 1989). A kernel is a mathematical density function that groups cells of concentrated use by attributing a grid placed over top of a study site with animal use or count data (Silverman 1986, Worton 1989). We populated a 1-km2 grid of cells with counts of sage-grouse males at leks across the eastern range of the species. We used this grid to select individual leks for conservation priority groupings. We modified the kernel function because choice of smoothing bandwidth is known to drastically affect area esti-mates and outer boundaries of home ranges and concentrated areas of use by populations (Seaman
et al. 1999, Kernohan et al. 2001, Horne and Garton 2006). We circumvented the bandwidth choice problem and used known distributions of nesting females around leks to delineate the outer bounda-ries of core regions (Holloran and Anderson 2005, table B-1 of Colorado Division of Wildlife 2008). The value of each grid cell is a function of the number and proximity of leks in the surrounding landscape. We attributed each cell with counts of males at leks within a radius of 6.4 km (4.0 mi). We chose this distance because nesting females distribute their nests spatially in relation to lek location, with 79% of nests located within a 6.4-km radius from lek-of-capture (table B-1 of Colorado Division of Wildlife 2008). We ranked leks by abundance values and placed each into four groups that contained 25%, 50%, 75%, or 100% of the known breeding population, and buff-ered these leks by 6.4 km to delineate nesting areas. We extended the radius from 6.4 to 8.5 km for leks in 75% and 100% core regions (Holloran and Anderson 2005), because a post-hoc analysis indicated that 6.4 km was too small an area to con-tain simulated nest densities in lower population density areas and fragmented habitats where a few leks were far apart (e.g., North and South Dakota; Table 21.1). Increasing the radius in
TABLE 21.1Characteristics of Greater Sage-Grouse leks used to delineate core regions.
State
No. of leks with �2 males
2005–2007
Average (�SD) maximum male count 2005–2007
Relative abundance
(%)
Average (�SD) distance (km) to nearest lek
Median distance (km) to nearest lek
Current distribution
Coloradoa 200 33.4 � 32.4 8 4.6 � 4.2 3.5 17,061b
Montana 869 23.6 � 20.5 24 4.6 � 4.2 3.5 127,242
North Dakota 14 15.4 � 14.5 �1 8.6 � 2.6 8.3 2,829
South Dakota 21 28.2 � 13.0 1 10.4 � 5.2 9.8 10,074
Utahc 71 37.3 � 34.6 3 4.4 � 4.6 2.7 7,046
Wyoming 1,190 47.3 � 45.2 64 5.0 � 3.6 4.3 176,424
Great Plains and Wyoming Basin SMZsd
2,336 37.2 � 40.0 100 4.8 � 3.7 4.1 338,789e
a Total included 29 leks in the Colorado Plateau Sage-Grouse Management Zone (SMZ).b Area estimate included portions of the Colorado Plateau SMZ. c Included leks in the Colorado Plateau SMZ. d Leks do not sum because Colorado includes 29 leks from the Colorado Plateau SMZ.e Area estimate excludes Idaho, Canada, and the Colorado Plateau SMZ.
Knick_ch21.indd 509Knick_ch21.indd 509 3/1/11 11:42:33 AM3/1/11 11:42:33 AM
STUDIES IN AVIAN BIOLOGY NO. 38 Knick and Connelly510
75% and 100% core regions provided more realis-tic estimates of the area needed to support breed-ing populations in low-abundance or fragmented landscapes. Our model output is a grouping of leks in four shades that represent the smallest area necessary to contain 25%, 50%, 75%, and 100% of the nesting sage-grouse population. Area esti-mates are inclusive; 25% core regions are included within the boundaries of 50% core regions.
Mapping Energy Potential
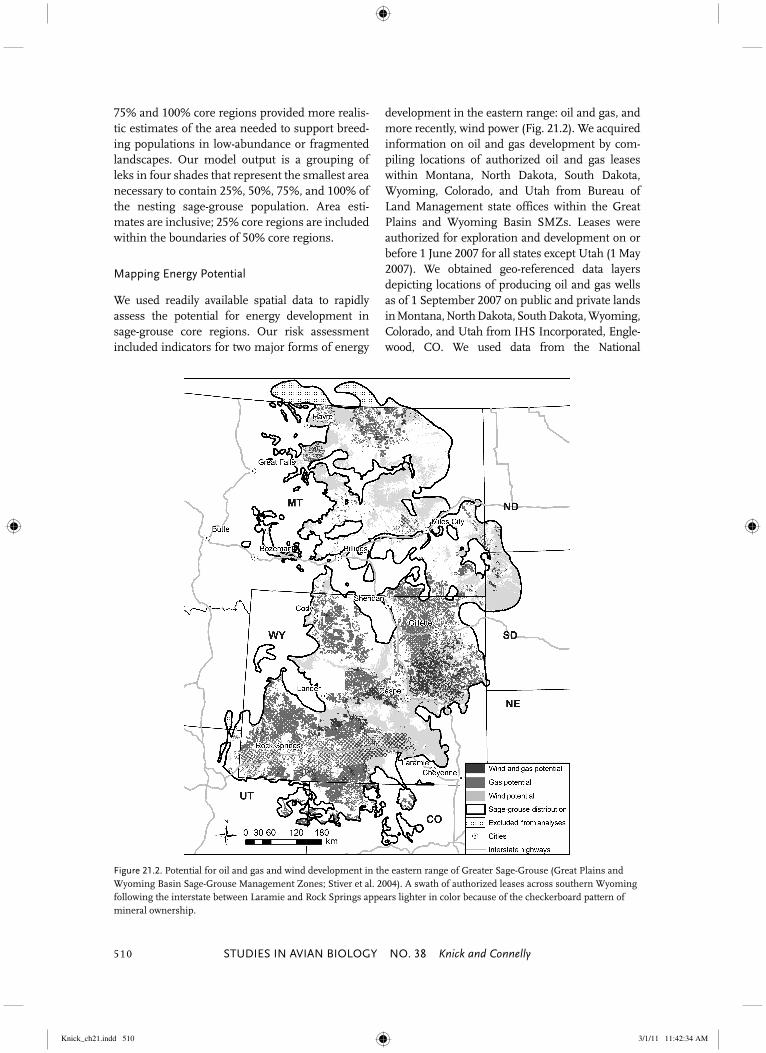
We used readily available spatial data to rapidly assess the potential for energy development in sage-grouse core regions. Our risk assessment included indicators for two major forms of energy
development in the eastern range: oil and gas, and more recently, wind power (Fig. 21.2). We acquired information on oil and gas development by com-piling locations of authorized oil and gas leases within Montana, North Dakota, South Dakota, Wyoming, Colorado, and Utah from Bureau of Land Management state offices within the Great Plains and Wyoming Basin SMZs. Leases were authorized for exploration and development on or before 1 June 2007 for all states except Utah (1 May 2007). We obtained geo-referenced data layers depicting locations of producing oil and gas wells as of 1 September 2007 on public and private lands in Montana, North Dakota, South Dakota, Wyoming, Colorado, and Utah from IHS Incorporated, Engle-wood, CO. We used data from the National
Figure 21.2. Potential for oil and gas and wind development in the eastern range of Greater Sage-Grouse (Great Plains and Wyoming Basin Sage-Grouse Management Zones; Stiver et al. 2004). A swath of authorized leases across southern Wyoming following the interstate between Laramie and Rock Springs appears lighter in color because of the checkerboard pattern of mineral ownership.
Knick_ch21.indd 510Knick_ch21.indd 510 3/1/11 11:42:34 AM3/1/11 11:42:34 AM

ENERGY DEVELOPMENT AND CONSERVATION TRADEOFFS 511
Renewable Energy Laboratory to represent the potential for commercial wind potential (National Renewable Energy Laboratory 2008). Wind classes are grouped from 1–7 with all wind classes �4 hav-ing potential for commercial energy production.
Conservation Planning Analyses
Systematic conservation planning requires identifi-cation of areas to achieve specific goals (Pressey et al. 2007). Our core-areas analyses delineate spe-cific landscapes that differ markedly in biological value and offer a means to rank their relative impor-tance. Conservation planning also requires that areas identified with high value have the ability to persist over time (Groves et al. 2002). We conducted a series of GIS overlays of biological values of sage-grouse with the potential for energy development to frame the opportunities and challenges facing sage-grouse in relation to energy development. The intersection of high biological value with high energy potential frames the risk of development to sage-grouse populations. We first quantified the proportion of 25%, 50%, 75%, and 100% core regions at risk from oil and gas development, wind power development, or both. We quantified the risk of development of oil and gas and of wind power to 75% core regions by state and quantified the pro-portion of land with federal management to document how risk varies by state. We mapped the location of current oil and gas wells in relation to core regions to highlight the importance of core regions next to development to promote resilience of areas disturbed by energy development (Groves et al. 2002, Lindenmeyer et al. 2008). We used a fac-torial analysis to categorically define biological value and energy potential into four categories that show opportunities for both conservation and energy development across the landscape based on all pos-sible combinations of biological value (low or high) and energy potential (low or high). We defined an area as having high biological value if it was in the top three groupings of breeding densities (25%, 50%, and 75% core regions), as these groups con-tained 75% of the regional breeding population in only 30% of the total eastern sage-grouse distribu-tion. We included 100% core regions as high bio-logical value in North Dakota and South Dakota because these fringe populations experience the highest risk of extirpation (Aldridge et al. 2008). We defined our 100% core area group as low biological value elsewhere. If an area did not have a lek within
8.5 km (Holloran and Andersen 2005), it was not assigned a biological value because we did not have information on other seasonal habitats. We consid-ered an area to have high potential for energy devel-opment if it had either an authorized oil or gas lease from the federal government or showed potential for commercial wind production (Fig. 21.2). Areas excluded from the high potential category were clas-sified as having low potential for energy develop-ment. The result was four categorical and spatially explicit groups mapped in a GIS (Fig. 21.3).
RESULTS
Sage-grouse abundance regionally exhibited a clumped distribution, making it possible to identify core regions that contained a large proportion of the breeding population within a relatively small pro-portion of the species’ eastern range (Fig. 21.1). Core regions contained 25%, 50%, 75%, and 100% of the breeding population within 5%, 12%, 30%, and 60% of the eastern sage-grouse range. Bird abundance varied within core regions. Wyoming contained the highest proportion of high-density areas (Fig. 21.1), largest number of leks, highest male sage-grouse abundance at leks, and the broadest species distri-bution among the six states within our study area (Table 21.1). Wyoming provides habitat for nearly two-thirds of all known sage-grouse within our study area, while Montana, having the second-largest and most expansive population, provides habitat for an additional quarter of the sage-grouse in our study area (Table 21.1). A small area of northwest Colo-rado also supports an especially high abundance of breeding birds per unit area, relative to the entire eastern range of sage-grouse (Fig. 21.1). Risk of energy development to sage-grouse core regions increased as the relative biological value increased across the entire eastern range (Table 21.2). Half (51%) of 25% core regions are at risk from either wind or oil and gas development, whereas 39% of the 100% core regions are at risk. This is a function of the locations of oil and gas leases. Over one-third of the 25% core regions have been leased for oil and gas development, whereas one-fifth of the eastern distribution is leased (Table 21.2). Potential for wind energy develop-ment is also widespread across the eastern range; however, core regions did not exhibit increasing risks as biological value increased (19–21% risk; Table 21.2). Development risk is highly noncom-plementary with �5% spatial overlap of potential
Knick_ch21.indd 511Knick_ch21.indd 511 3/1/11 11:42:35 AM3/1/11 11:42:35 AM

oil/gas and wind development, which increased the total land area at risk (Table 21.2, Fig. 21.2). Energy development risks differed by state (Table 21.3, Fig. 21.2) and are highest in Wyoming, intermediate in Colorado, and lowest in Montana, the three states with 95% of the sage-grouse (Table 21.3). Wyoming has the high-est proportion of 75% core regions at risk from both oil and gas and wind development (Table 21.3). Oil and gas development is the primary threat in Colorado and Utah, while wind development poses a greater risk to sage-grouse core regions in Montana, North Dakota, and South Dakota (Table 21.3). Overall, threats from energy development to 75% core regions ranged from 9% to 73% of breeding areas (Table 21.3). Factorial analysis documented large landscapes within each category (Fig. 21.3). Analyses classi-fied 84,896 km2 of land as low biological value with high potential for energy development
(25% of range; Fig. 21.3) and 64,641 km2 as low potential for energy development (19% of range; Fig. 21.3). The inclusion of 100% core regions in North Dakota and South Dakota brought the total area classified as high biological value to 31%. Analyses classified 46,419 km2 of land as high bio-logical value for sage-grouse with high potential for energy development (14% of range; Fig. 21.3) and 59,237 km2 as low energy potential (17%; Fig. 21.3). The proportion of areas with high biological value and low energy potential varied greatly by state, as did federal surface and mineral owner-ship (Table 21.3). Montana had 72% of its high value core regions with low potential for develop-ment and had 31% federal surface ownership and 45% federal subsurface ownership (Fig. 21.3; Table 21.3). Wyoming had 49% of areas with high biological value and low energy potential but was 57% federally owned on the surface and 69% con-trolled by federal subsurface ownership. Large-scale
Figure 21.3. Overlay of biological value (25–75% core regions � high value) with energy potential for oil and gas or wind development to assess risk of development to Greater Sage-Grouse core regions.
Knick_ch21.indd 512Knick_ch21.indd 512 3/1/11 11:42:35 AM3/1/11 11:42:35 AM

ENERGY DEVELOPMENT AND CONSERVATION TRADEOFFS 513
development has already occurred next to core regions, especially in Wyoming (Fig. 21.1).
DISCUSSION
Landscape planning to balance wildlife conserva-tion with resource development must be analo-gous in scale to be effective given the spatial extent of anticipated impacts. Successful planning must embrace the social and political realities of the region (Lindenmeyer et al. 2008). Our analysisis sufficiently broad in scale to allow a relevant
examination of the necessary tradeoffs, and by assessing the potential impacts of energy develop-ment, we bring recognition of the political reality of energy development in the West. The frame-work presented provides the necessary structure to illustrate the tradeoffs between sage-grouse conservation and energy development. The next generation of analyses to direct conservation action should be twofold. First, there is a need to support implementation of core regions with studies that document seasonal habitat use and migration patterns of radio-marked sage-grouse
TABLE 21.2Percent of Greater Sage-Grouse core regions at risk of wind and/or oil and gas development
in Wyoming, Montana, Colorado, Utah, South Dakota, and North Dakota (through September 2007).
High wind potentiala
Authorized oil and gas leasesb Both Either
25% core regions 20.2 34.3 3.7 50.8
50% core regions 19.4 31.5 4.1 46.9
75% core regions 19.0 28.0 3.9 43.1
100% core regions 18.7 23.4 3.2 38.8
Eastern distribution 21.4 20.8 3.3 38.8
a We defi ned high wind potential as a wind class rating �4 (National Renewable Energy Laboratory 2008).b Authorized leases include federal oil and gas leases authorized for exploration and development on or before 1 June 2007 for each state except Utah (1 May 2007).
TABLE 21.3Greater Sage-Grouse 75% core regions at risk of wind and/or oil and gas development by state
(through September 2007).
StateHigh wind potentiala
ownershipAuthorized oil and
gas leasesb Both EitherFederal surface
Wyoming 21.2 35.7 5.7 51.2 57.1
Montana 19.8 8.5 0.6 27.7 31.4
Colorado 0.3 33.7 0.1 33.8 43.3
Utah 0.4 8.6 0.0 9.1 46.5
South Dakota 72.3 3.7 3.2 72.9 11.5
North Dakota 28.9 10.0 2.2 36.6 56.8
a We defi ned high wind potential as a wind class rating �4 (National Renewable Energy Laboratory 2008).b Authorized leases include federal oil and gas leases authorized for exploration and development on or before 1 June 2007 for each state except Utah (1 May 2007).
Knick_ch21.indd 513Knick_ch21.indd 513 3/1/11 11:42:38 AM3/1/11 11:42:38 AM

STUDIES IN AVIAN BIOLOGY NO. 38 Knick and Connelly514
(Aldridge and Boyce 2007, Doherty et al. 2008) to ensure identified priority landscapes meet all sea-sonal habitat needs. Second, incorporation of future modeling of other relevant risks, such as cheatgrass (Bromus tectorum) invasion, to core regions will ensure gains in conservation will not be offset by unevaluated risks. Resources available to implement landscape conservation invariably are in short supply rela-tive to need. Setting priorities for conservation action is a necessary and major task for agencies and organizations concerned with conservation of species and ecosystems (Groves et al. 2002, Newburn et al. 2005). Core regions enable deci-sion makers to spatially prioritize their targets for sage-grouse conservation. Our results suggest that, given the nature of sage-grouse distribution, a large portion of the breeding population can be conserved within core regions. For example, 75% of the breeding population can be captured within only 30% of the area. However, distribution of core regions and their value vary. Wyoming con-tains 64% of the known breeding population in this region and more active leks than all other states combined. Risks to core regions vary dra-matically in concordance with variation in value of these regions. Wyoming has the greatest com-bined risk from both wind energy and oil and gas development, but also has the greatest potential for conservation in terms of the value of core regions. The intersection of the value of the core regions and the risks to which they are exposed (Figs. 21.2, 21.3) suggests a series of strategies needed to ensure long-term persistence of sage-grouse: (1) policy changes are needed in areas of high biological value and high risk of energy development to manage leasing and permitting of oil and gas development on federal lands and to proactively site future wind developments; (2) rapid implementation of conservation is needed to enhance populations in high value biological areas without energy potential; and (3) restoration of fringe habitats and low-density areas with lim-ited risk is needed to promote connectivity. We explore each of these strategies in detail. Landscapes with high biological value for sage-grouse and high risk for development represent the greatest challenge facing land use managers. This is a concern because 44% of areas with high biological value are at risk for energy development (darkest gray areas, Fig. 21.3). The rapid pace and scale of oil and gas drilling has emerged as a
major issue because areas being developed (i.e., southwest Wyoming and northwest Colorado) include some of the largest remaining sage-brush landscapes with the highest densities of sage-grouse in North America (Fig. 21.1; Connelly et al. 2004). The future of sage-grouse conserva-tion is in question in the eastern range in part because 44% of the lands that the federal govern-ment has authority to control for oil and gas devel-opment (7,000,000 of 16,000,000 ha) have been authorized for exploration and development (Naugle et al., this volume, chapter 20). Lease sales continue, despite concerns, because no pol-icy is in place that would permit an environmen-tal assessment of risk at the scale at which im-pacts occur. Severity of impacts (Holloran 2005, Aldridge and Boyce 2007, Walker et al. 2007a) and the unprecedented leasing of the public mineral estate dictate the need for a shift from piecemeal to landscape-scale conservation. Our analyses will enable policymakers to consider a portfolio of set-aside areas, priority conservation areas, lease consolidations, and more stringent, spatially based, best-management practices as creative solutions to balance energy development with sage-grouse conservation. Wind power is an emerging issue contributing to the overall risk of energy development to sage-grouse populations (Figs. 21.2, 21.3). There is an urgent need for policies that promote land-scape-scale considerations when siting wind facil-ities, as well as for replicated research to quantify potential impacts (Stewart et al. 2007). The low overlap between wind potential and oil and gas leasing highlights the need to incorporate multi-ple stressors in planning efforts, because uncon-sidered stressors could negate conservation actions. Lands with federal surface ownership are being leased at increasing rates for wind develop-ment, and a similar portfolio of tools could be considered to reduce impacts on these lands. However, much of the future wind energy devel-opment is anticipated to occur on private lands with little or no regulatory oversight. The lack of a landscape-planning paradigm is especially of con-cern for populations in Montana, North Dakota, and South Dakota, where the primary risk is unplanned large-scale wind development on pri-vate lands. Private lands with high value sage-grouse habitat might be considered for purchased conservation easement agreements with land-owners that limit surface development. Yet the
Knick_ch21.indd 514Knick_ch21.indd 514 3/1/11 11:42:39 AM3/1/11 11:42:39 AM

ENERGY DEVELOPMENT AND CONSERVATION TRADEOFFS 515
high purchase cost of easements and even higher profitability of wind development for private land-owners require broader strategies to minimize wind development footprints. Ultimately, policy decisions on placement of new energy transmis-sion corridors built to carry electricity from new wind developments will be a major factor in wind development and may be used to further refine risk assessment. High biological value and low energy potential identify low-conflict areas to immediately focus conservation actions. Currently, 17% of the east-ern sage-grouse range has high biological value and low risk from energy development (Fig. 21.3). Maintaining these quality sage-grouse habitats, especially in areas adjacent to development (Fig. 21.1) or where development is anticipated (Figs. 21.2, 21.3), will be critical to ensure genetic connectivity (Oyler-McCance et al. 2005a,b) and natural recolonization after oil and gas develop-ment activities have ceased (Gonzalez et al. 1998). Strategies in these high value and low energy potential areas should further focus on reducing risks from other stressors to sagebrush habitats (Klebenow 1970; Connelly et al. 2000b,c; Leonard et al. 2000; Smith et al. 2005; Walker et al. 2007a) such as tillage (Farrell et al. 2006, United States Government Accounting Office 2007), residential development (Theobald 2003, 2005), and invasive plants such as cheatgrass (Bergquist et al. 2007). Rural areas with desirable natural amenities and recreational opportunities throughout the United States have experienced a surge in rural develop-ment since the 1970s (Brown et al. 2005), with growth in the Intermountain West during the 1990s occurring faster than in any other region of the country (Hansen et al. 2002). Conservation easements are one tool to reduce residential devel-opment and agricultural conversion on private lands (Kiesecker et al. 2007). Opportunities also exist to target existing federal and state incentive programs in these areas, focusing on compatible grazing practices and habitat enhancement activi-ties. A preponderance of private surface owner-ship in Montana and Utah coupled with low risk of development make core regions in many parts of these states ideal places to develop incentives for ranching and rural lifestyles through long-term easement programs such as the Conservation Reserve Program, which reduces habitat loss by conversion to agriculture. Opportunities for ease-ments and management programs are available
in Wyoming because of the sheer size of this pop-ulation, but long-term viability is more of a public policy decision. Areas of low biological value and low energy potential (19% of eastern range; Fig. 21.3) repre-sent low-conflict opportunities for sage-grouse. Our analyses document the importance of these areas in maintaining connectivity to high value core regions in Montana (Fig. 21.3). Core regions with low biological value and low energy potential will be important in this regard, with restoration being one of the key strategies. Recent experience has shown the difficulty of maintaining numbers of Gunnison Sage-Grouse (Centrocercus minimus; Oyler-McCance et al. 2005a) and Lesser Prairie-Chicken (Tympanuchus pallidicinctus; Hagen et al. 2004) when only small and fragmented popula-tions remain. Sage-grouse have already been lost from half of their former range (Schroeder et al. 2004), and many of the low value and low poten-tial areas identified in this analysis are the same areas where continued range contraction is expected to be most severe (Aldridge et al. 2008). Fringe populations in North Dakota, South Dakota, Montana, and Canada need to pursue aggressive habitat restoration programs if they hope to maintain their biological value. Programs should focus on restoring adjacent lands pres-ently in tillage agriculture to sagebrush-domi-nated grasslands in addition to enhancing exist-ing native habitats.
CONSERVATION IMPLICATIONS
Explicitly combining information about the vul-nerability of landscapes to anthropogenic risk enables conservation planners to consider aspects of urgency as well the probability for success of a given conservation strategy (Wilson et al. 2005, Copeland et al. 2007, Pressey and Bottrill 2008). Core regions and assessment of the potential future impacts they may experience represents a starting point to initiate conservation of land-scapes where results will have the largest benefit to populations. Prioritization of landscapes is an admission that threats are large, resources are limited, and conservation action targeting every remaining population is improbable. Core regions represent a proactive attempt to identify a set of conservation targets to maintain a viable and con-nected set of populations before the opportunity to do so is lost.
Knick_ch21.indd 515Knick_ch21.indd 515 3/1/11 11:42:39 AM3/1/11 11:42:39 AM
STUDIES IN AVIAN BIOLOGY NO. 38 Knick and Connelly516
Strategies must be integrated among all states and provinces involved for landscape-scale con-servation to be successful. Each state and province will need to do its part to maintain sage-grouse distribution and abundance. Successful imple-mentation in one state, such as Montana, will not be sufficient to compensate for losses in impor-tant places like Wyoming. Conservation concerns related to sage-grouse will remain at the forefront until collaborative landscape planning and con-servation are demonstrated. Analyses reported here provide a framework for planning across political boundaries and a currency for measuring the success of implementation.
ACKNOWLEDGMENTS
We thank state and federal wildlife managers throughout the Great Plains and Wyoming Basin Sage-Grouse Management Zones for helping us envision this project and its end products. We
thank the agencies for providing lek-count data, and the following people that helped make it hap-pen: A. D. Apa and T. E. Remington (Colorado), R. D. Northrup (Montana), D. W. Olsen (Utah), T. J. Christiansen (Wyoming), T. R. Kirschen-mann (South Dakota), and A. C. Robinson (North Dakota). A. A. Messer (Montana), K. J. Eichhoff (Colorado), and N. I. Whitford (Wyoming) pro-vided GIS support and helped answer questions about lek databases. We replicated core area anal-yses at the level of individual states; the resulting areas and statistics are available upon request from K. E. Doherty. Funding for this work was provided by the state offices of the Bureau of Land Management in Montana and Wyoming, Wolf Creek Charitable Foundation, the Hewlett Foundation, the Liz Claiborne and Art Ortenberg Foundation, Google Earth, and the University of Montana. Comments by S. T. Knick and three anonymous reviewers greatly improved this manuscript.
Knick_ch21.indd 516Knick_ch21.indd 516 3/1/11 11:42:39 AM3/1/11 11:42:39 AM