domestic economic conditions
DESCRIPTION
Domestic Economic Conditions. Jeff Fuhrer Director of Research Federal Reserve Bank of Boston Presented to the 495/MetroWest Corridor Partnership’s Economic Forum September 4, 2008 Chart assistance provided by Denny Lie. Overview. Update on the housing crisis: Still going - PowerPoint PPT PresentationTRANSCRIPT
Domestic Economic Domestic Economic Conditions Conditions
Jeff FuhrerJeff FuhrerDirector of ResearchDirector of Research
Federal Reserve Bank of BostonFederal Reserve Bank of Boston
Presented to the Presented to the 495/MetroWest Corridor Partnership’s 495/MetroWest Corridor Partnership’s
Economic ForumEconomic ForumSeptember 4, 2008September 4, 2008
Chart assistance provided by Denny LieChart assistance provided by Denny Lie
OverviewOverview
Update on the housing crisis: Still goingUpdate on the housing crisis: Still going
Update on financial market stresses: Update on financial market stresses: Still goingStill going
Outlook and risks for the real economy: Outlook and risks for the real economy: Weak second halfWeak second half
Outlook and risks for inflationOutlook and risks for inflation
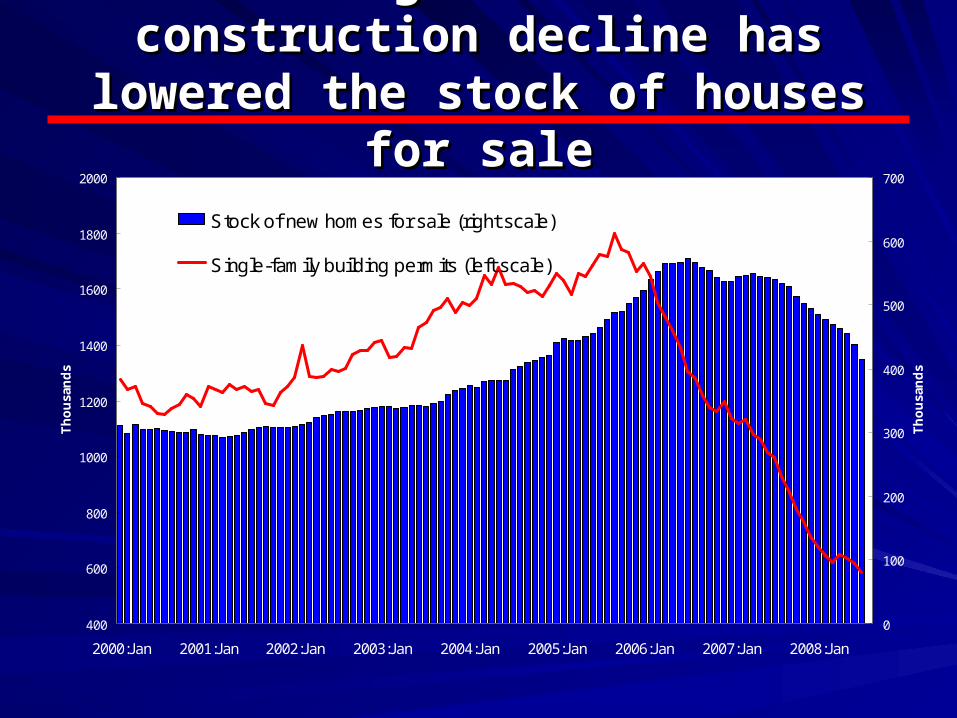
Housing: A massive Housing: A massive construction decline has construction decline has
lowered the stock of houses for lowered the stock of houses for salesale
400
600
800
1000
1200
1400
1600
1800
2000
2000:Jan 2001:Jan 2002:Jan 2003:Jan 2004:Jan 2005:Jan 2006:Jan 2007:Jan 2008:Jan
Th
ou
san
ds
0
100
200
300
400
500
600
700
Th
ou
san
ds
Stock of new homes for sale (right scale)
Single-family building permits (left scale)
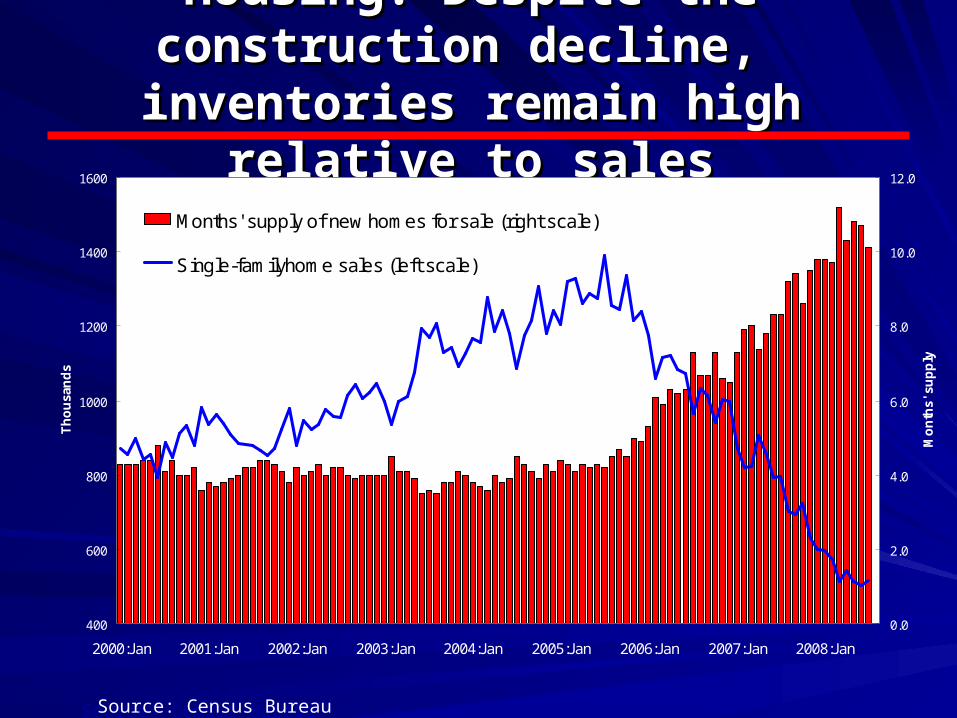
Housing: Despite the Housing: Despite the construction decline, construction decline,
inventories remain high relative inventories remain high relative to salesto sales
400
600
800
1000
1200
1400
1600
2000:Jan 2001:Jan 2002:Jan 2003:Jan 2004:Jan 2005:Jan 2006:Jan 2007:Jan 2008:Jan
Th
ou
san
ds
0.0
2.0
4.0
6.0
8.0
10.0
12.0
Mo
nth
s' s
up
ply
Months' supply of new homes for sale (right scale)
Single-familyhome sales (left scale)
Source: Census BureauSource: Census Bureau
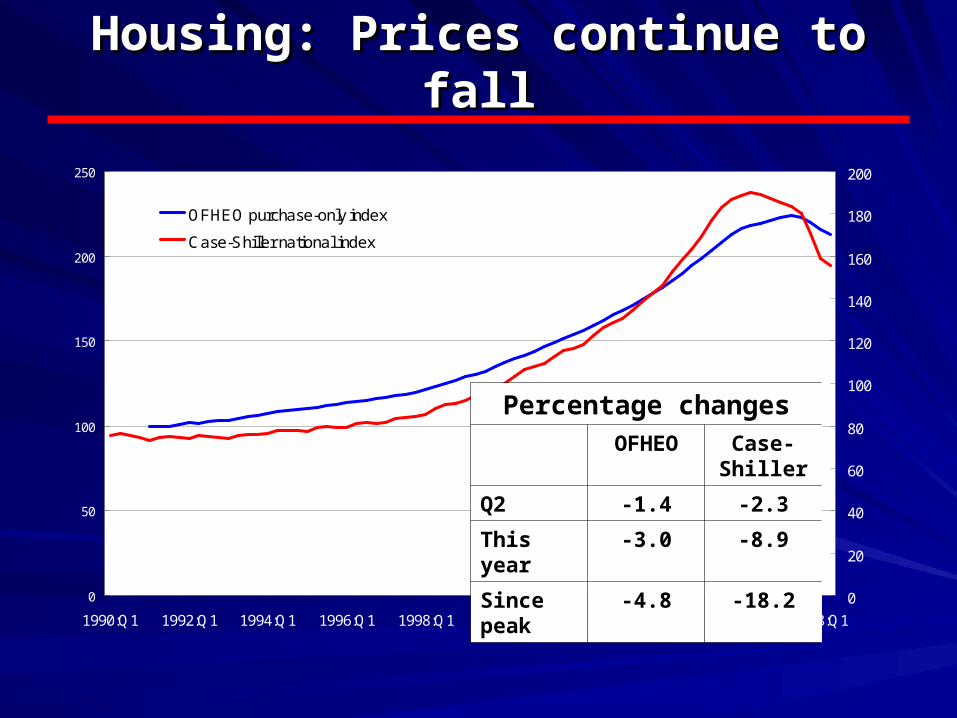
Housing: Prices continue to Housing: Prices continue to fallfall
0
50
100
150
200
250
1990:Q1 1992:Q1 1994:Q1 1996:Q1 1998:Q1 2000:Q1 2002:Q1 2004:Q1 2006:Q1 2008:Q1
0
20
40
60
80
100
120
140
160
180
200
OFHEO purchase-only index
Case-Shiller national index
Percentage changesOFHEO Case-
Shiller
Q2 -1.4 -2.3
This year
-3.0 -8.9
Since peak
-4.8 -18.2
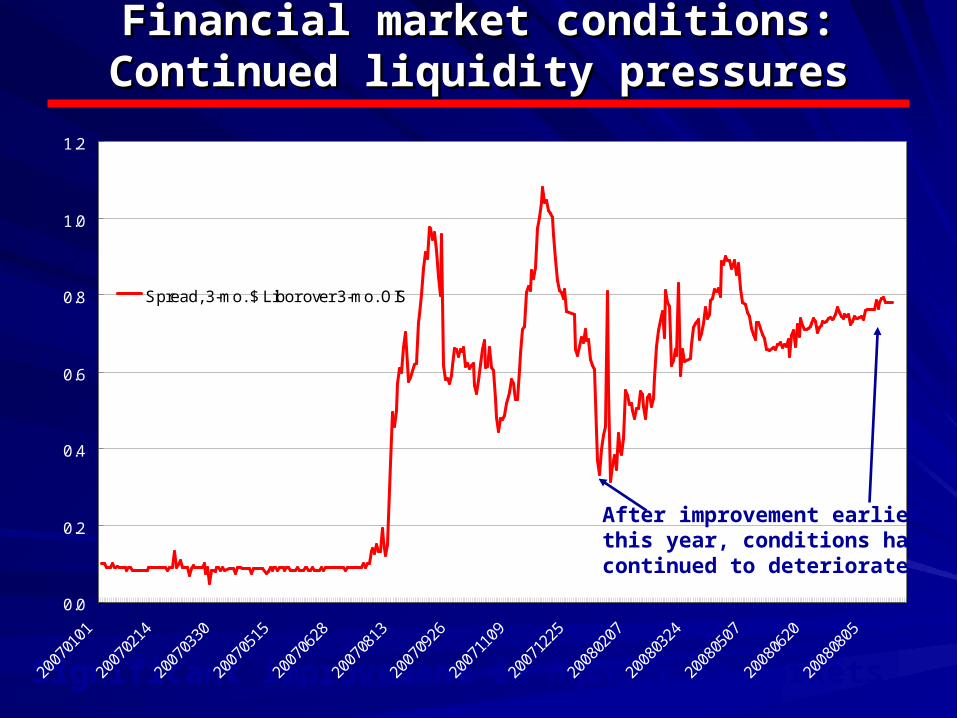
Financial market conditions:Financial market conditions:Continued liquidity pressuresContinued liquidity pressures
Significant improvement in liquidity in markets
0.0
0.2
0.4
0.6
0.8
1.0
1.2
2007
0101
2007
0214
2007
0330
2007
0515
2007
0628
2007
0813
2007
0926
2007
1109
2007
1225
2008
0207
2008
0324
2008
0507
2008
0620
2008
0805
Spread, 3-mo. $ Libor over 3-mo. OIS
After improvement earlierthis year, conditions havecontinued to deteriorate
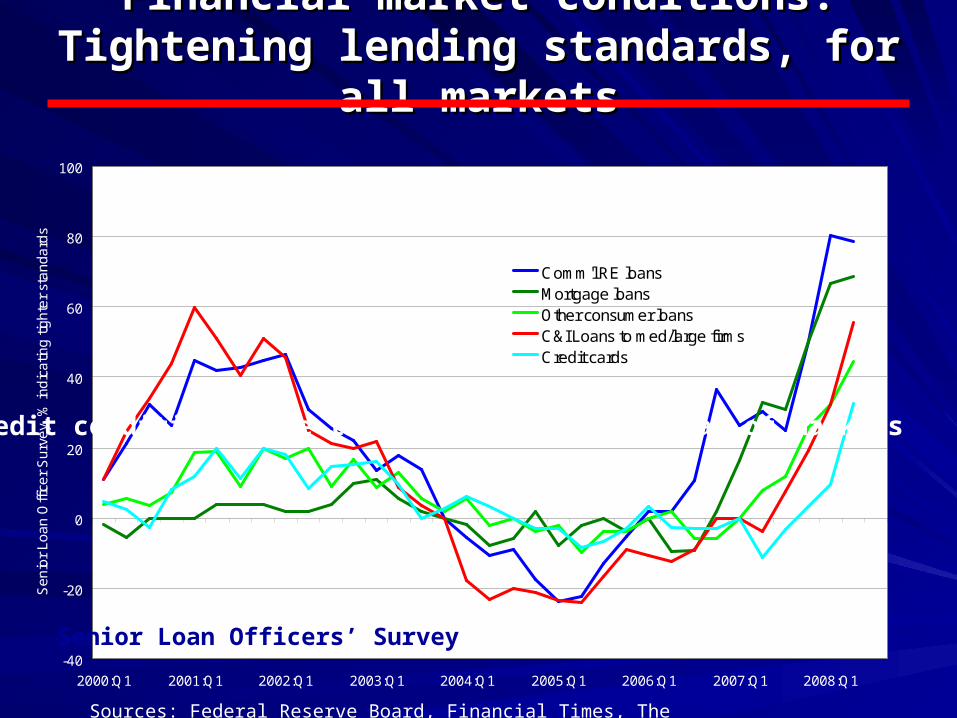
-40
-20
0
20
40
60
80
100
2000:Q1 2001:Q1 2002:Q1 2003:Q1 2004:Q1 2005:Q1 2006:Q1 2007:Q1 2008:Q1
Se
nio
r L
oa
n O
ffic
er
Su
rve
y, %
ind
ica
ting
tig
hte
r st
an
da
rds
Comm'l RE loansMortgage loansOther consumer loansC&I Loans to med/large firmsCredit cards
Credit conditions have tightened in a wide array of markets
Sources: Federal Reserve Board, Financial Times, The Wall Street Journal
Senior Loan Officers’ Survey
Financial market conditions:Financial market conditions:Tightening lending standards, for Tightening lending standards, for
all marketsall markets
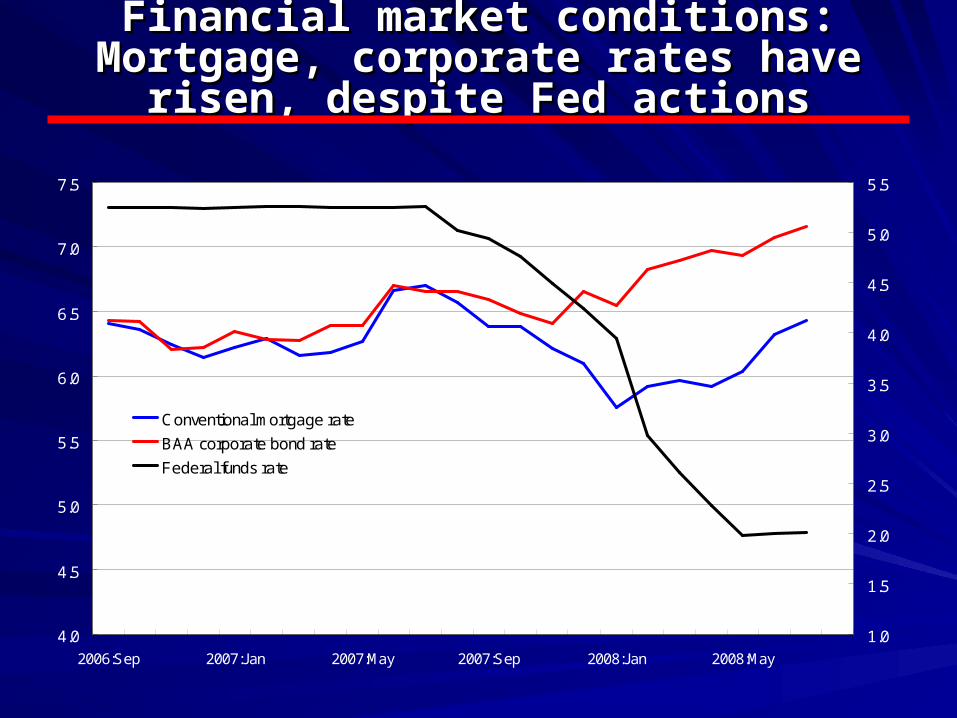
Financial market conditions:Financial market conditions:Mortgage, corporate rates have Mortgage, corporate rates have
risen, despite Fed actionsrisen, despite Fed actions
4.0
4.5
5.0
5.5
6.0
6.5
7.0
7.5
2006:Sep 2007:Jan 2007:May 2007:Sep 2008:Jan 2008:May
1.0
1.5
2.0
2.5
3.0
3.5
4.0
4.5
5.0
5.5
Conventional mortgage rate
BAA corporate bond rate
Federal funds rate
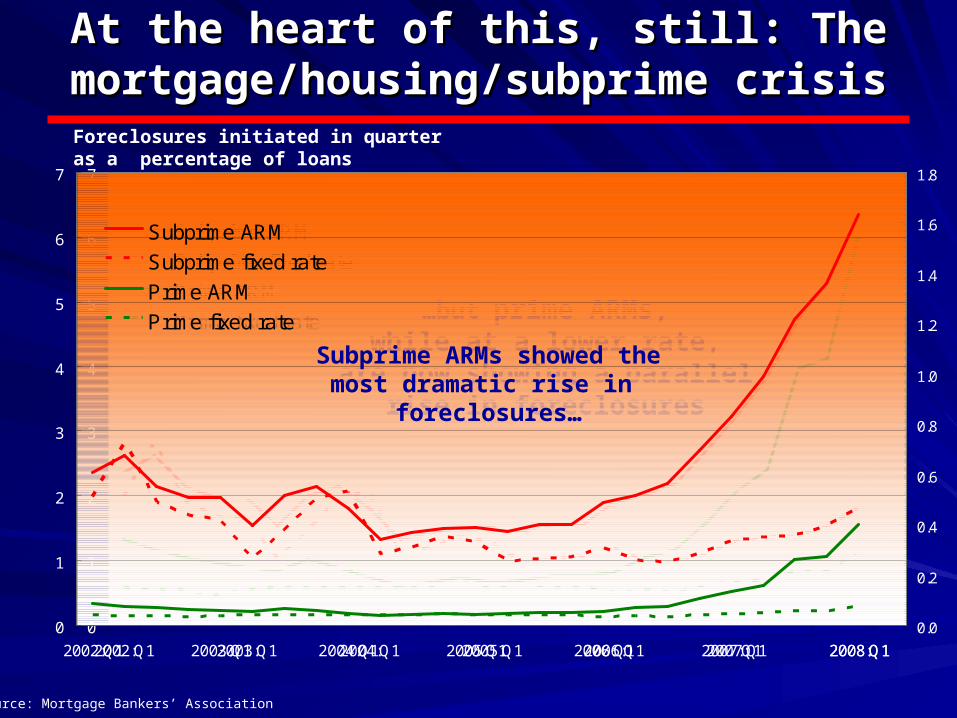
At the heart of this, still: The At the heart of this, still: The mortgage/housing/subprime crisismortgage/housing/subprime crisisForeclosures initiated in quarter as a percentage of loans
0
1
2
3
4
5
6
7
2002:Q1 2003:Q1 2004:Q1 2005:Q1 2006:Q1 2007:Q1 2008:Q1
0.0
0.2
0.4
0.6
0.8
1.0
1.2
1.4
1.6
1.8
Subprime ARM
Subprime fixed rate
Prime ARM
Prime fixed rate …but prime ARMs,while at a lower rate,
are now showing a parallel rise in foreclosures
Source: Mortgage Bankers’ Association
0
1
2
3
4
5
6
7
2002:Q1 2003:Q1 2004:Q1 2005:Q1 2006:Q1 2007:Q1 2008:Q1
Subprime ARM
Subprime fixed rate
Prime ARM
Prime fixed rate
Subprime ARMs showed themost dramatic rise in
foreclosures…
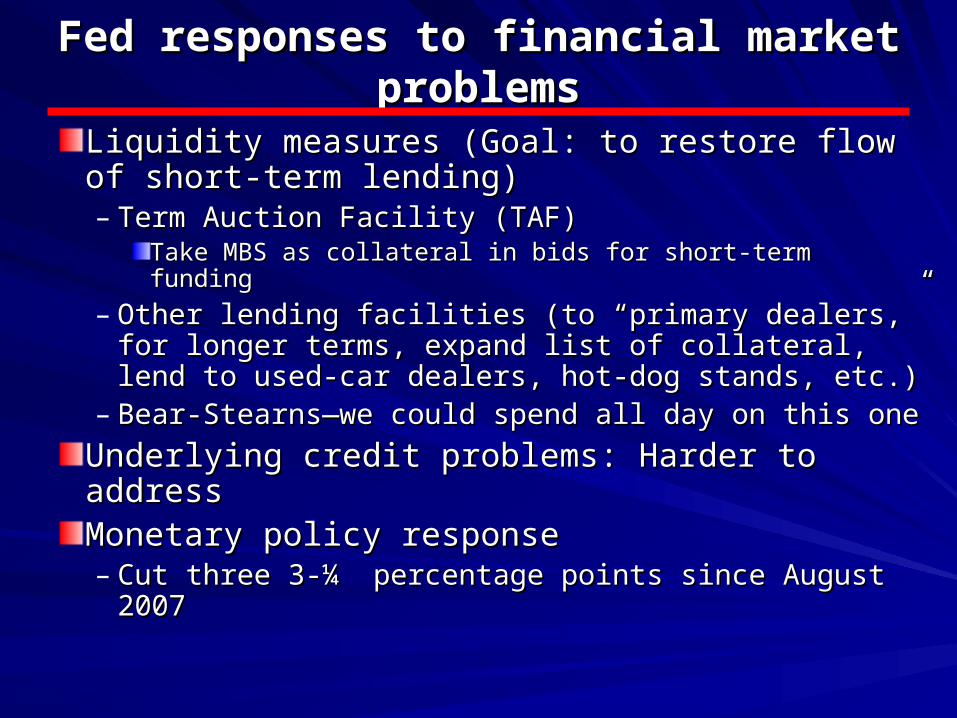
Fed responses to financial market Fed responses to financial market problemsproblems
Liquidity measures (Goal: to restore flow of Liquidity measures (Goal: to restore flow of short-term lending)short-term lending)– Term Auction Facility (TAF)Term Auction Facility (TAF)
Take MBS as collateral in bids for short-term fundingTake MBS as collateral in bids for short-term funding
– Other lending facilities (to “primary dealers,” for Other lending facilities (to “primary dealers,” for longer terms, expand list of collateral, lend to longer terms, expand list of collateral, lend to used-car dealers, hot-dog stands, etc.)used-car dealers, hot-dog stands, etc.)
– Bear-Stearns—we could spend all day on this oneBear-Stearns—we could spend all day on this one
Underlying credit problems: Harder to Underlying credit problems: Harder to addressaddressMonetary policy responseMonetary policy response– Cut three 3-¼ percentage points since August Cut three 3-¼ percentage points since August
20072007
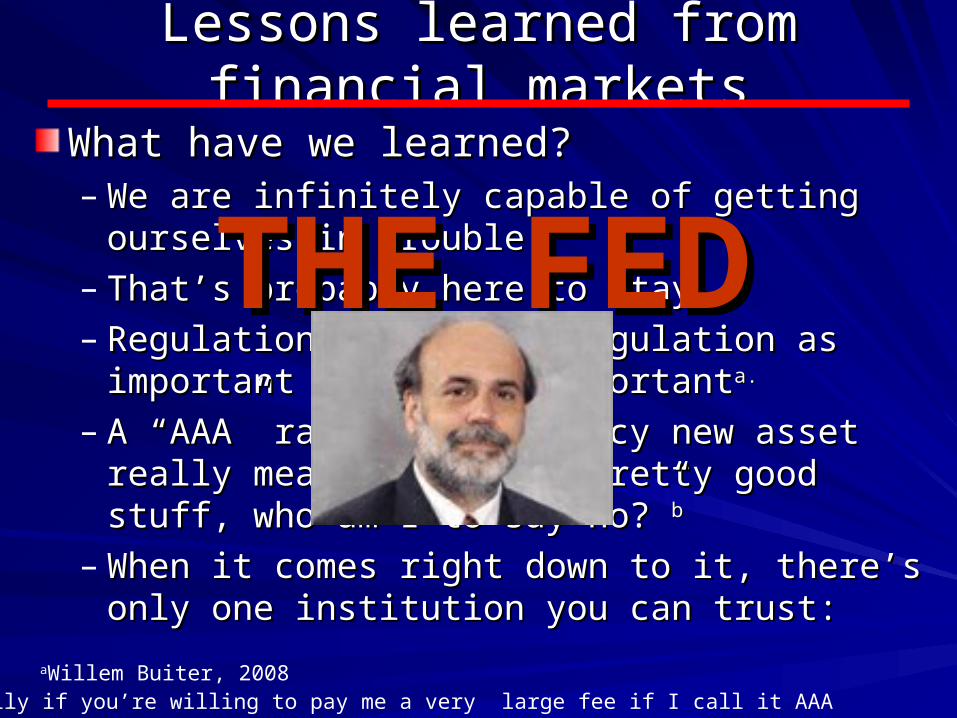
Lessons learned from financial Lessons learned from financial marketsmarkets
What have we learned?What have we learned?– We are infinitely capable of getting We are infinitely capable of getting
ourselves in trouble.ourselves in trouble.– That’s probably here to stay.That’s probably here to stay.– Regulation is to self-regulation as Regulation is to self-regulation as
important is to self-importantimportant is to self-importanta.a.
– A “AAA” rating for a fancy new asset A “AAA” rating for a fancy new asset really means “Could be pretty good stuff, really means “Could be pretty good stuff, who am I to say no?”who am I to say no?”bb
– When it comes right down to it, there’s When it comes right down to it, there’s only one institution you can trust:only one institution you can trust:
aWillem Buiter, 2008
THE FEDTHE FED
bEspecially if you’re willing to pay me a very large fee if I call it AAA
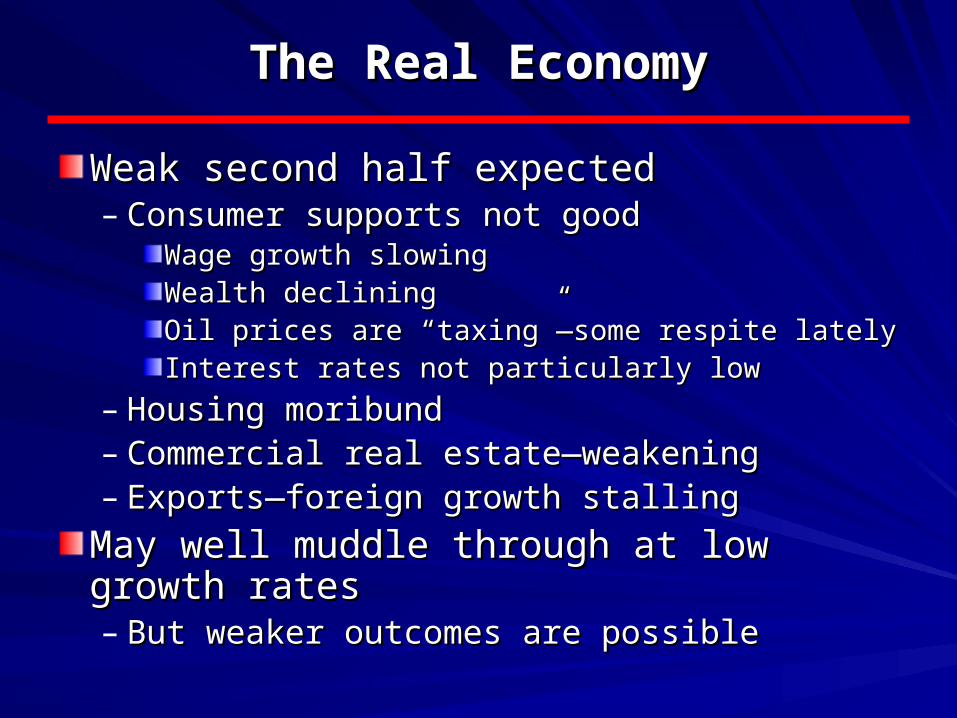
The Real EconomyThe Real Economy
Weak second half expectedWeak second half expected– Consumer supports not goodConsumer supports not good
Wage growth slowingWage growth slowingWealth decliningWealth decliningOil prices are “taxing”—some respite latelyOil prices are “taxing”—some respite latelyInterest rates not particularly lowInterest rates not particularly low
– Housing moribundHousing moribund– Commercial real estate—weakeningCommercial real estate—weakening– Exports—foreign growth stallingExports—foreign growth stalling
May well muddle through at low May well muddle through at low growth ratesgrowth rates– But weaker outcomes are possibleBut weaker outcomes are possible
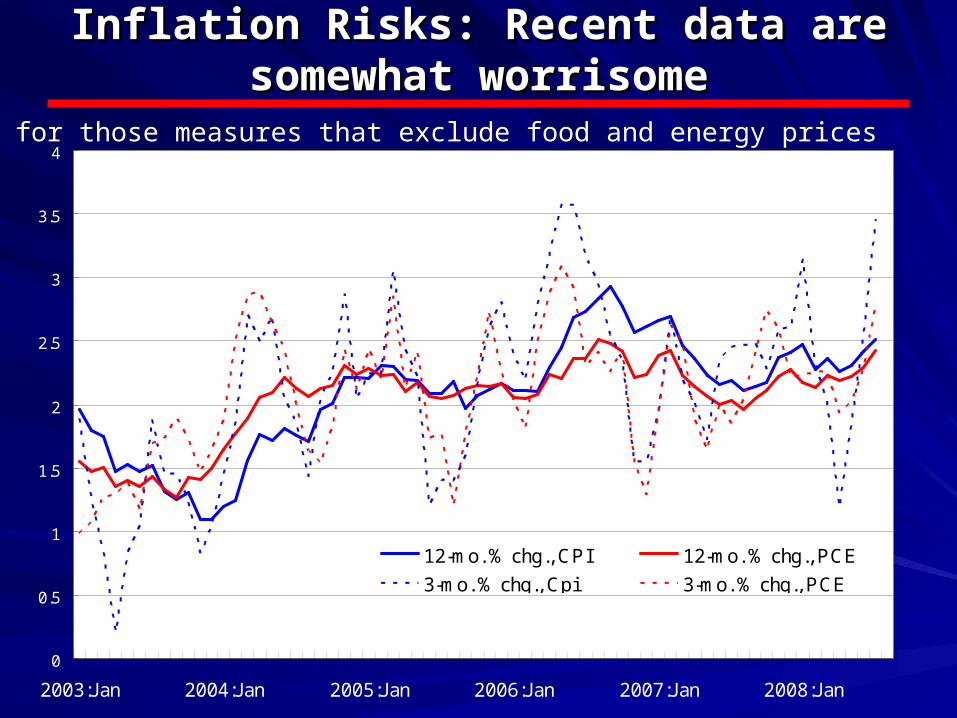
Inflation Risks: Recent data are Inflation Risks: Recent data are somewhat worrisomesomewhat worrisome
0
0.5
1
1.5
2
2.5
3
3.5
4
2003:Jan 2004:Jan 2005:Jan 2006:Jan 2007:Jan 2008:Jan
12-mo. % chg., CPI 12-mo. % chg., PCE
3-mo. % chg., Cpi 3-mo. % chg., PCE
Even for those measures that exclude food and energy prices

Inflation risks:Inflation risks: Some comfort— Some comfort— A slowing economy will helpA slowing economy will help
Sources: Bureau of Labor Statistics
CPI inflation (4-qtr. % chg.)
0
2
4
6
8
10
12
14
16
1955:Q1 1961:Q1 1967:Q1 1973:Q1 1979:Q1 1985:Q1 1991:Q1 1997:Q1 2003:Q1
Contrary to some analysts’ assertions, inflation always
falls during slowdowns
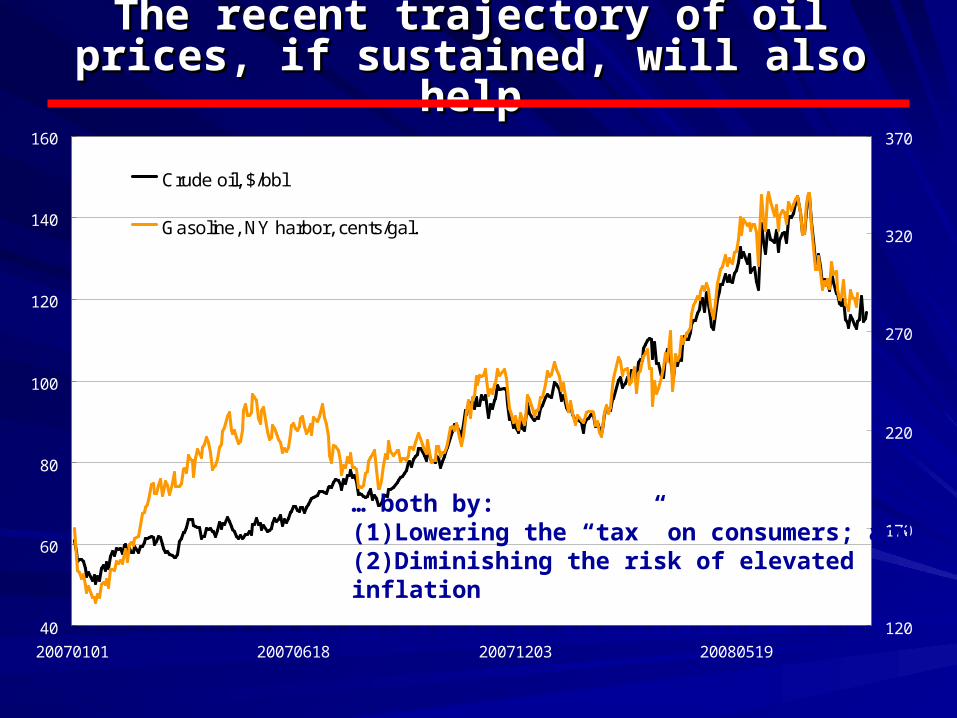
The recent trajectory of oil prices, The recent trajectory of oil prices, if sustained, will also helpif sustained, will also help
40
60
80
100
120
140
160
20070101 20070618 20071203 20080519
120
170
220
270
320
370
Crude oil, $/bbl
Gasoline, NY harbor, cents/gal.
… both by:(1)Lowering the “tax” on consumers; and(2)Diminishing the risk of elevatedinflation
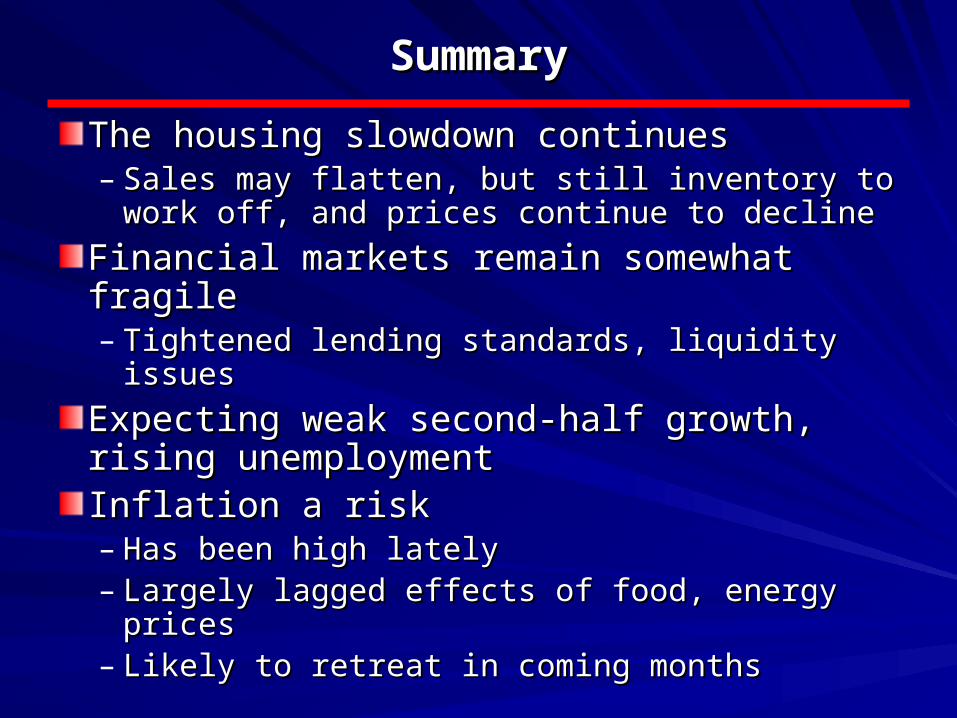
SummarySummary
The housing slowdown continuesThe housing slowdown continues– Sales may flatten, but still inventory to work Sales may flatten, but still inventory to work
off, and prices continue to declineoff, and prices continue to decline
Financial markets remain somewhat Financial markets remain somewhat fragilefragile– Tightened lending standards, liquidity issuesTightened lending standards, liquidity issues
Expecting weak second-half growth, Expecting weak second-half growth, rising unemploymentrising unemploymentInflation a riskInflation a risk– Has been high latelyHas been high lately– Largely lagged effects of food, energy pricesLargely lagged effects of food, energy prices– Likely to retreat in coming monthsLikely to retreat in coming months