don groom’s course evaluation course evaluation question: “is the instructor aware of the...
Post on 21-Dec-2015
216 views
TRANSCRIPT
Don Groom’s Course Evaluation
• Course evaluation question: “Is the instructor aware of the students’ limitations?”
• Student response: “Yes, and vice versa.”

Experiment• You want to measure the aluminum-to-
oxygen ratio in sapphire– Why?– “Flat, smooth and polished”
• Sapphire is known to be a poor conductor• Options
– Coat– Run in low vac (incompatible with current
detectors on Nova NanoSEM)
• What is the effect of coating on the x-ray intensities?
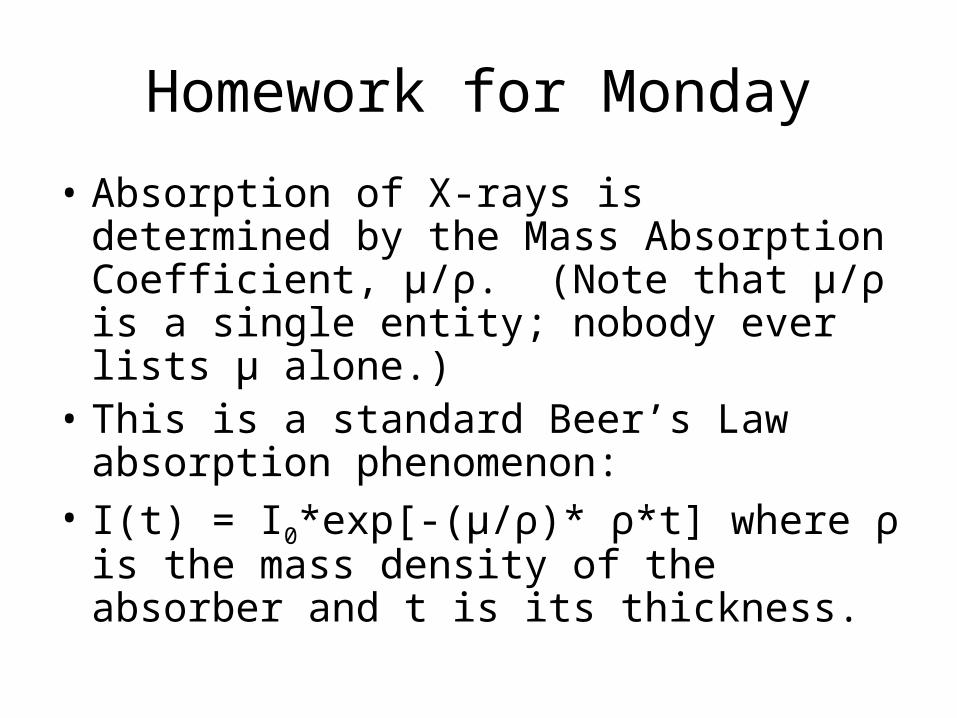
Homework for Monday
• Absorption of X-rays is determined by the Mass Absorption Coefficient, μ/ρ. (Note that μ/ρ is a single entity; nobody ever lists μ alone.)
• This is a standard Beer’s Law absorption phenomenon:
• I(t) = I0*exp[-(μ/ρ)* ρ*t] where ρ is the mass density of the absorber and t is its thickness.
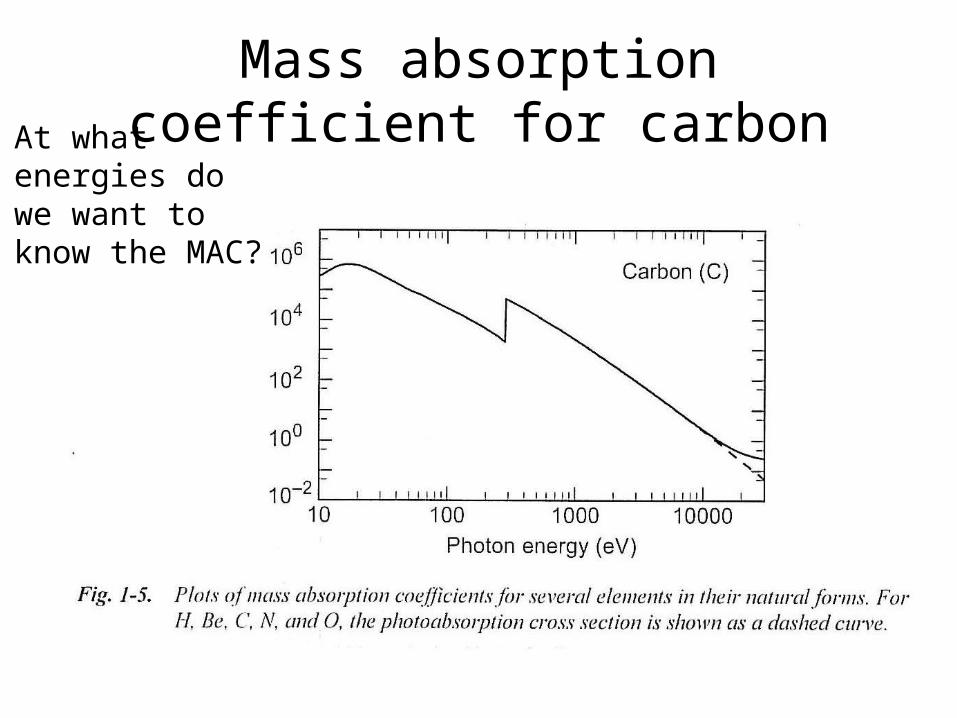
Mass absorption coefficient for carbonAt what
energies dowe want to know the MAC?

How were samples coated?
• Recipe that came with the Denton Desk II sputter coater– 45 mA ion current– 30 seconds deposition time– 50 mTorr Ar pressure– 10 nm Gold coating
• For what purpose!!!• What is the impact of this coating on
Quantitative EDS Analysis???

Coatings used in your experiment
• Gold sputtered for 30 seconds
• Gold sputtered for 10 seconds
• Gold sputtered for 3 seconds (not used)
• Carbon evaporated thermally– Evaporated onto flat, smooth, polished
sapphire– Evaporated onto rough alumina crucible
Lab reports• Address the definition of “flat, smooth and
polished”– Make a crude estimate of how rough the
crucible bottom really is.
• Project what will happen to measured ratios of constituents whose Z varies by amounts much larger than aluminum and oxygen…like tungsten and oxygen.
• Tiwari is oxidizing niobium. – Can you help him determine the stoichiometry
of his product?

Next Aphorism
• We never have time to do things right the first time.
• We always have time to do them again.
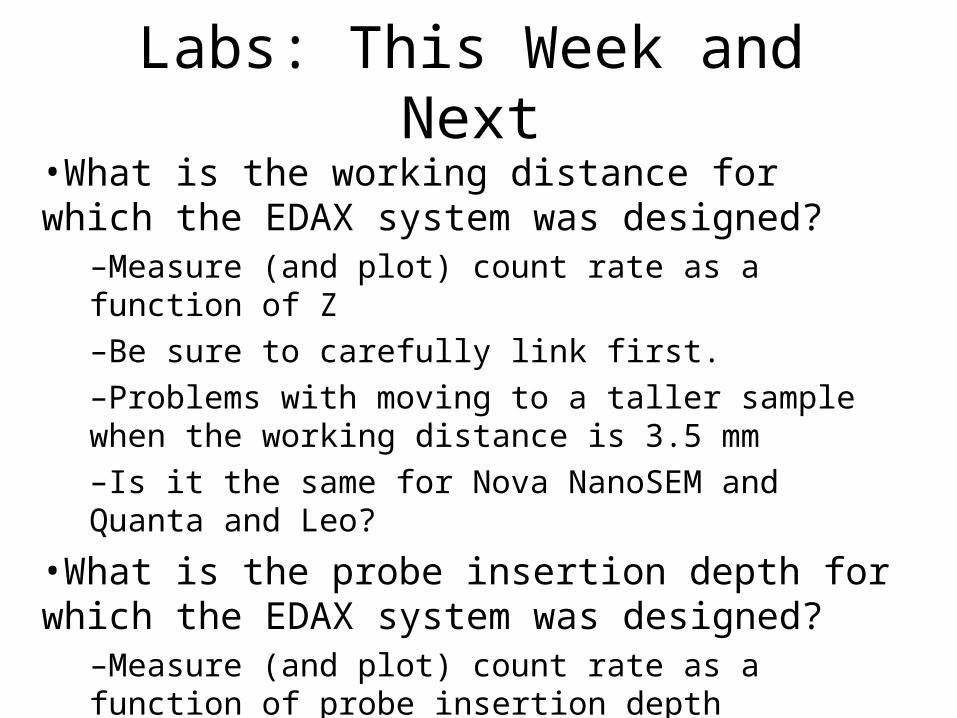
Labs: This Week and Next•What is the working distance for which the EDAX system was designed?
–Measure (and plot) count rate as a function of Z–Be sure to carefully link first.–Problems with moving to a taller sample when the working distance is 3.5 mm–Is it the same for Nova NanoSEM and Quanta and Leo?
•What is the probe insertion depth for which the EDAX system was designed?
–Measure (and plot) count rate as a function of probe insertion depth

“Trust but verify.”Ronald Reagan
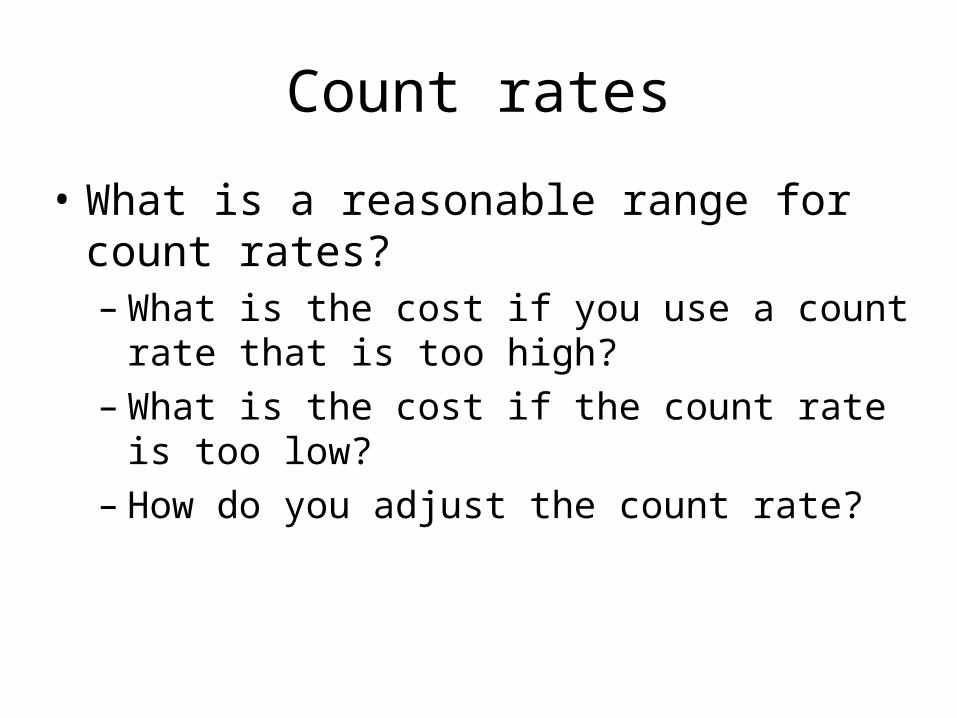
Count rates
• What is a reasonable range for count rates?– What is the cost if you use a count rate that is
too high?– What is the cost if the count rate is too low?– How do you adjust the count rate?
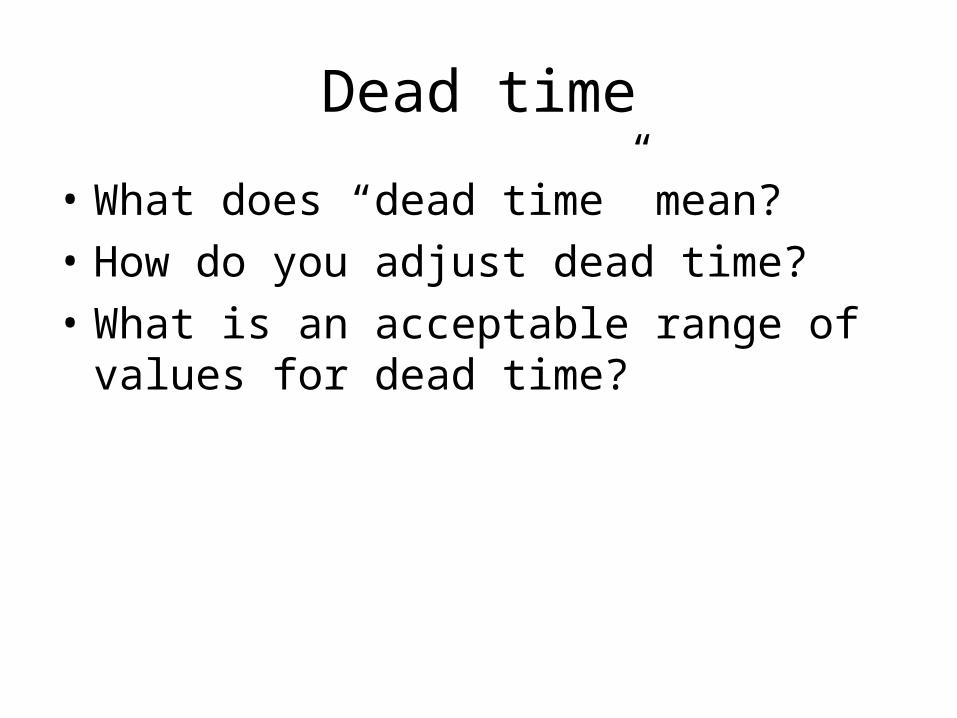
Dead time
• What does “dead time” mean?
• How do you adjust dead time?
• What is an acceptable range of values for dead time?

Amp Time
• Integration time over which signal is averaged to establish a baseline from which the height of the “voltage step” is measured

Stolen from Nicholas Richie
PoorerQuantitativeresults
Shorterdead time
(Amp time)

Plagiarism
• If you steal from one, it’s plagiarism
• If you steal from many, it’s research– R. Polson

Increases dead time
Stolen from Nicholas Richie

Genesis icons continued
EDS really has onlythree adjustable parameters:Collection timeAmp timeCount rate
How do you adjust the count rate?

Preset options
Determines “Live Time” during which data are collected
What kind of time? Live?Clock?RoI?
“None” is also an optionWhat happens when you select it?

Dead time
• Kinds of time– Live time: time during which detector takes
data– Dead time: time during which current
accumulation window is closed– Clock time
• Sum of live and dead time• Actual time we all know and love

Amp time: adjust for dead time of 20 - 40%
1.6 μsec – 102.4 μsec

Microscope control panel and return!
Return to normal operating screen

Peak ID Labels from spectrum
Halographic PeakDetermination: fitsspectrum withtheoretical sum
Possible matchesfor energy wherecursor is located
Move to listof labeledpeaks

Lower tray information
Red while taking dataBlack when finished

Image Tab
Image Tab
Your image here!

Top Center Icons
Return controlto microscope!
RasterFull Reduced Spot User drawn

Collect Image

Brightness and contrastadjust in counterintuitivedirection Use low resolutionand few strips for fasterfeedback.

Random Notes
• Qualitative analysis– All peaks in the spectrum must be present– Will appear as colored lines when you click on
an element in the list of options

Detectors• Si(Li)
– Very common– Less expensive– Require LN2
• SDD– The next big thing– Handle higher count rates for mapping– Do not require LN2– Currently more expensive– Slightly poorer resolution (operate at room
temperature!
• Microcalorimeter– Not a tool; a career!

Si(Li) Detector

Silicon Drift Detector
Microcalorimeter
