don’t get burned: managing salts in greenhouse production neil mattson assistant professor and...
TRANSCRIPT

Don’t Get Burned:Managing salts in greenhouse production
Neil Mattson
Assistant Professor and
Floriculture Extension Specialist
Presented at:
New England Greenhouse Conference
Worcester, MA
November 6, 2008

Outline• Where do salts come from?
• General salt stress– Symptoms– Cultural Practices that cause High Salts– Sensitive Crops– Guidelines and Management Options
• Managing specific salt ions– Na, Cl, B, (H)CO3, NH4, F
• Nutrient Antagonisms

What are salts?
• Compounds that dissolve in water
ANIONS (-) CATIONS (+)
Chloride (Cl) Ammonium (NH4)
Nitrate (NO3-) Calcium (Ca)
Sulfate (SO4-) Iron (Fe)
Magnesium (Mg)
Sodium (Na)
Potassium (K)

How are salts measured?
• Electrical conductivity (EC)– units: 1 dS/m = 1 mS/cm = 1 mhos/cm = 1000 µS/cm– old units: 1 mhos
• luckily, 1 mhos = 1 Siemen (S)
• PPM – conversion depends on the specific salts you are using– average of all salts: 670 ppm ≈ 1 dS/m
• moles/milliequivalents (SI units)– ion specific conversion
• (40 ppm Ca = 1 mM = 2 meq)

Where do salts come from?
• Container media, example ECs (these vary by source)
Substrate EC (dS/m)
Compost (Dairy) 7-20
Peat 1.1
Sand 0.2
Soil (Mardin) 1.3
Vermicompost 1.3
Vermiculite 0.1

Where do salts come from?• Water source
– salt deposits , limestone, sea-water incursion, road salt
Target: 0.2-0.75 dS/m
Acceptable: 0-1.5 dS/m
Massachusetts study of several greenhoues water sources (Cox, Lopes, Smith)
Municipal Well (dS/m)
Min 0.05 0.10
Avg 0.39 0.52
Max 3.14 7.15

Where do salts come from?• Added fertilizer
• Example from 15-5-15 Cal Mag fertilizer:– when applied at 200 ppm N, the water will
contain an additional 1.32 dS/m of salinity

Salt Stress• Osmotic effects
– loss of osmotic gradient for water absorption wilting (even though substrate is moist)– If stress is prolonged may see reduced growth, smaller
leaf area, shorter plants (may or may not see wilting)• Toxic concentrations of ions
– excess absorption of Na, Cl– excess absorption of micronutrients (B, Mn, Fe, F)
• (Bi)carbonate– high pH– precipitation of Ca/Mg increasing sodicity
• Nutrient antagonisms– an excess of one nutrient limits absorption of another

Outline• Where do salts come from?
• General salt stress– Symptoms– Cultural Practices that cause High Salts– Sensitive Crops– Guidelines and Management Options
• Managing specific salt ions– Na, Cl, B, (H)CO3, NH4, F
• Nutrient Antagonisms
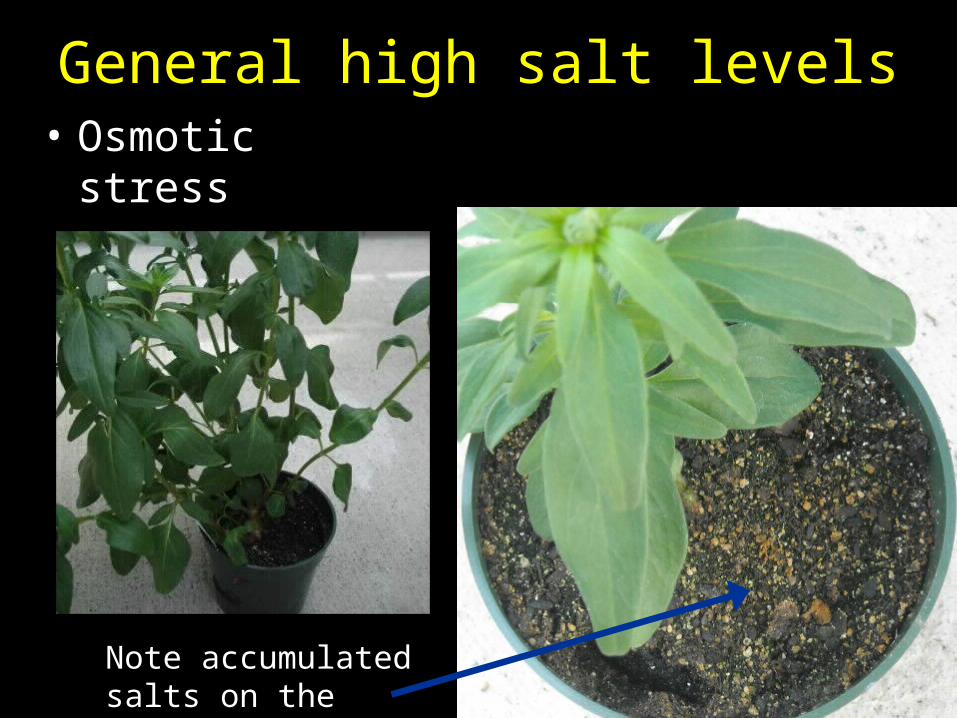
General high salt levels• Osmotic stress
– Wilting
Note accumulated salts on the surface

General high salt levels• Osmotic stress
– Smaller leaf and flower size
Control +3500 ppm Cl+2300 ppm Na

Osmotic Stress - Shorter Stems
50 100 200 350 500 ppm N0.9 1.2 2.1 3.9 6.2 dS/m
Source: Neil Mattson
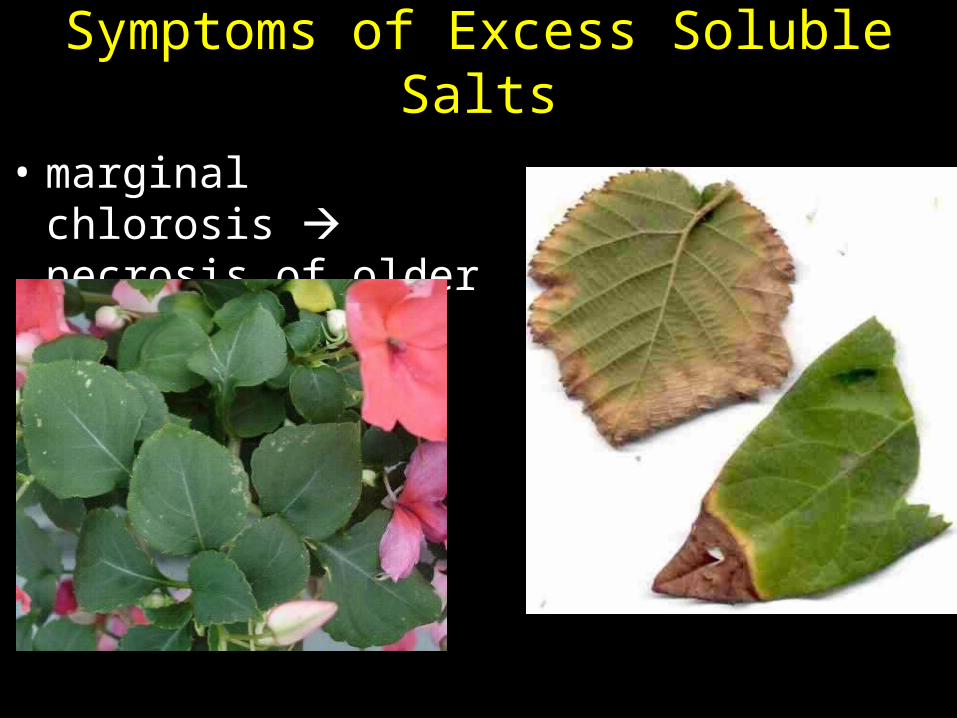
Symptoms of Excess Soluble Salts
• marginal chlorosis necrosis of older leaves

Symptoms of Excess Soluble Salts
• Death of root tips
• Increased Pythium susceptibility

Cultural Practices that Cause High Salts
50 ppm 200 ppm 500 ppm N
Snapdragon subirrigated with a complete fertilizerNote poor root growth in 500 ppm treatment
Source: Neil Mattson
0
1
2
3
4
5
6
0 10 20 30 40 50Days After Transplanting
Po
ur
Th
rou
gh
EC
(d
S/m
)
50 ppm 200 ppm 350 ppm 500 ppm
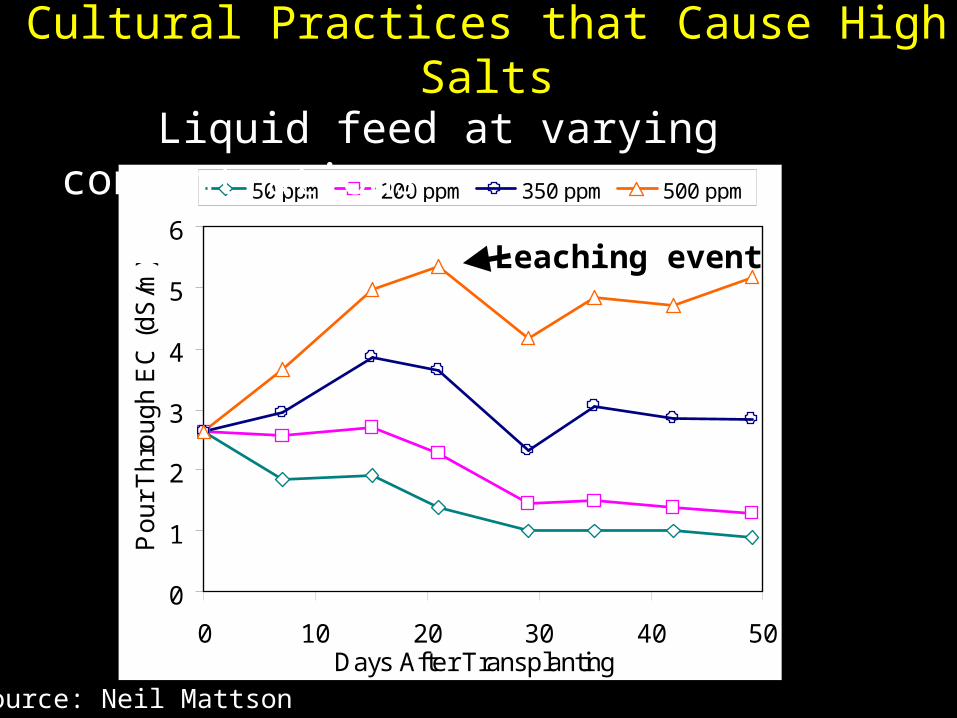
Liquid feed at varying concentrations
Leaching event
Cultural Practices that Cause High Salts
Source: Neil Mattson

Cultural Practices that Cause High SaltsEffect of irrigation method and fertilizer concentration
Impatiens ‘Super Elfin Mix’
0
2
4
6
8
10
12
14
0 100 200 300 400 500
Fertilizer N concentration (ppm)
Sho
ot d
ry m
ass
(g)
Overhead
Subirrigation
Source: Neil Mattson

Cultural Practices that Cause High Salts
0
2
4
6
8
10
12
14
0 1 2 3 4 5 6PourThru EC (dS/m)
Sh
oo
t dry
ma
ss (
g)
Subirrigation OverheadSeries3
Fertility and Substrate EC Affects GrowthImpatiens ‘Super Elfin Mix’
Source: Neil Mattson

50 100 200 350 500 ppm N
0.9 1.2 2.1 3.9 6.2 dS/m
Cultural Practices that Cause High Salts
Fertility and Substrate EC Affects Growth
Impatiens ‘Super Elfin Mix’
Subirrigation
Source: Neil Mattson

Tomato
0
2
4
6
8
10
12
14
0 100 200 300 400 500
Fertilizer N concentration (ppm)
Sh
oo
t dry
we
igh
t (g
)
Overhead
Subirrigation
• Tomato ‘Sweet 100’ grown for 4 weeks at different fertility levels, was tolerant of salts to 500 ppm N
Cultural Practices that Cause High Salts
Source: Neil Mattson
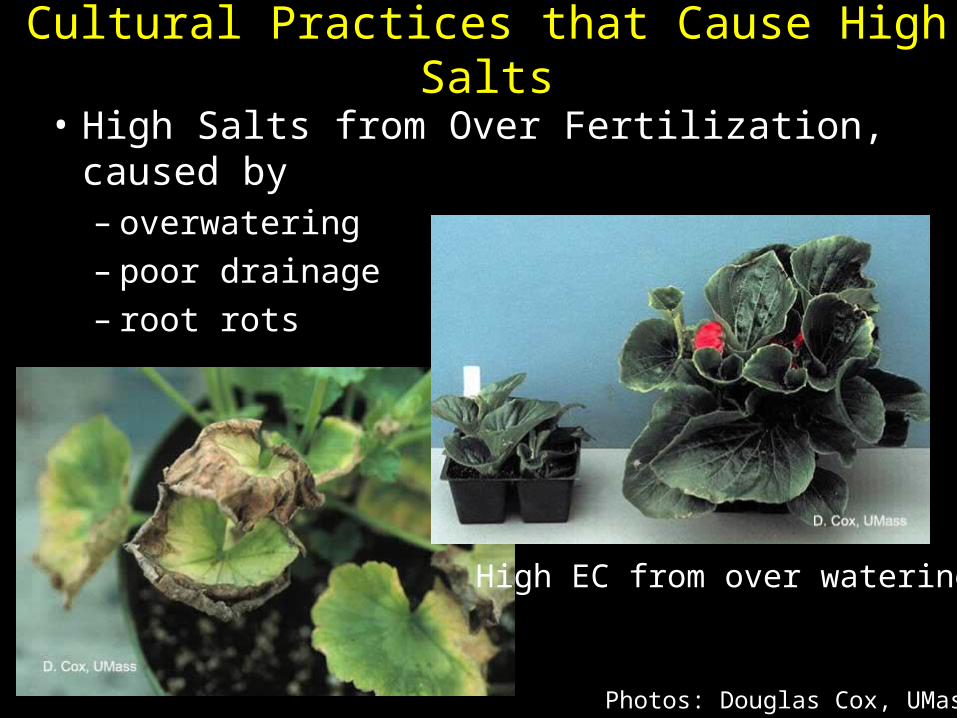
• High Salts from Over Fertilization, caused by– overwatering– poor drainage– root rots
Cultural Practices that Cause High Salts
Photos: Douglas Cox, UMass
High EC from over watering

High Salts from CRF• Use media within 1
week after incorporating CRFs
• Carefully measure rate during mixing – difficult to correct high salts
Photo: Peter Davies, Cornell University
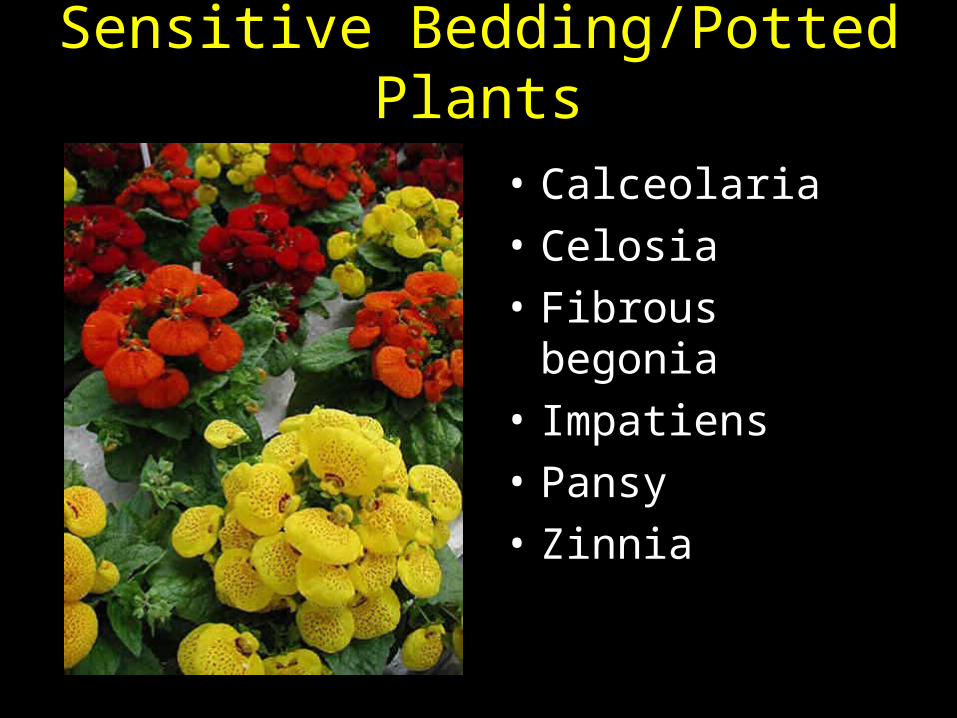
Sensitive Bedding/Potted Plants
• Calceolaria
• Celosia
• Fibrous begonia
• Impatiens
• Pansy
• Zinnia

Herbaceous Annuals
• Agastache cana
• Echinacea purpurea
• Leucanthemum x superbum ‘Alaska’
• Sedum Acre

EC Guidelines
Source: Todd Cavins et al., NCSU, http://www.pourthruinfo.com/

EC Guidelines
Source: Todd Cavins et al., NCSU, http://www.pourthruinfo.com/

Monitoring EC – Pour Thru• Example for Poinsettia
– Establishing 1.9 – 2.6 dS/m– Active Growth 2.8 – 4.1 dS/m– Finishing 1.9 – 2.7 dS/m
Source: Todd Cavins et al., NCSU, http://www.pourthruinfo.com/

Short Term Management Options• Leaching
Example: Clear water application 1x / week vs. Control (constant liquid feed)
0.0
0.5
1.0
1.5
2.0
2.5
3.0
0 10 20 30 40Days after transplanting
Po
ur
Th
rou
gh
EC
(d
S/m
)
Control
Clear water 1X weekly

Long Term Management Options
• Decrease fertility
• Periodic Leach
• A look at fertilizer sources and salt levels compare labels
• Switch water source?
• (Ebb and flow difficult using poor quality water for sensitive crops)
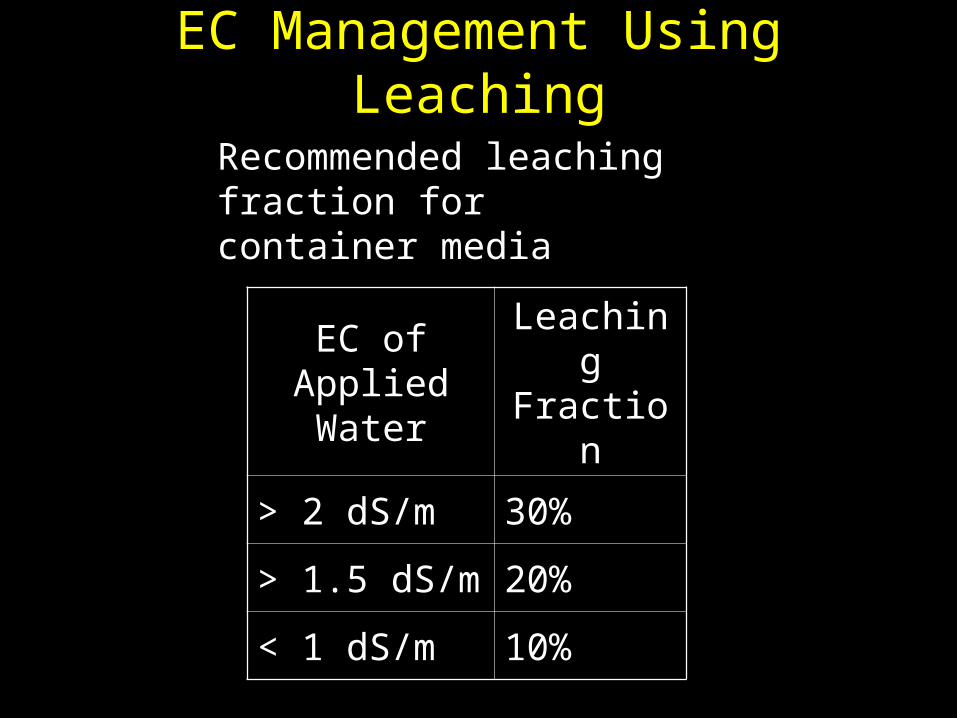
EC Management Using Leaching
EC of Applied Water
Leaching Fraction
> 2 dS/m 30%
> 1.5 dS/m 20%
< 1 dS/m 10%
Recommended leaching fraction for container media

Fertilizer levels by plugs stage
Stage 2 50-75 ppm N 1-2X/weekStage 3 100-150 ppm N 1-2X/weekStage 4 100-150 ppm N 1-2X/week
– mostly Nitrate based N
Pour Thru EC: 1.0-2.6
Young Plants are More Sensitive to Salts
Souce: Styer and Koranski, Plug and Transplant Production, 1997

Low Fertility Plugs
Stage 2 < 1.5 dS/m (PourThru)
Stage 3 1.5-2.5 dS/m (PourThru)
Young Plants are More Sensitive to Salts
Celosia Eggplant
F. Kale/Cabbage Lettuce
Pansy Pepper
Snapdragon TomatoSouce: Styer and Koranski, Plug and Transplant Production, 1997

Medium Fertility Plugs
Stage 2 2-2.5 dS/m (PourThru)
Stage 3 2.5-3 dS/m (PourThru)
Young Plants are More Sensitive to Salts
Ageratum Browallia Cyclamen
Dianthus Dusty miller Impatiens
Lisianthus Marigold Primula
Salvia Verbena VincaSouce: Styer and Koranski, Plug and Transplant Production, 1997

Water Quality Guidelines for Plug Production
pH 5.5-6.5
Alkalinity 60-80 ppm CaCO3
EC < 0.75 dS/m
Sodium < 40 ppm
Chloride < 70 ppm
Sulfates 24-240 ppm OK
Boron < 0.5 ppm
Fluoride < 1.0 ppm
Iron < 5.0 ppm
Adapted from: Styer and Koranski, Plug and Transplant Production, 1997

Outline• Where do salts come from?
• General salt stress– Symptoms– Cultural Practices that cause High Salts– Sensitive Crops– Guidelines and Management Options
• Managing specific salt ions– Na, Cl, B, (H)CO3, NH4, F
• Nutrient Antagonisms

Sodium / Chloride Toxicity• Symptoms
– Leaf margin/tip chlorosis necrosis– Old leaves affected first– Cl typically more toxic– Foliar applied Cl > 100 ppm can also cause burn
Photo: Paul Lopes, UMass
Chloride Sensitive Plants
• Roses
• Camellias
• Azaleas
• Rhododendrons

Management Options Chronic Salt Problems
• The case of high NaCl in water supply
– Be careful of plants drying out– Blended water, reverse osmosis– Adding enough Ca, K– Avoid wetting foliage during irrigation

Boron ToxicitySymptoms
• Yellowing of leaf tips/margins brown
• Old leaves affected first

Boron Sensitivity
SENSITIVE SPECIES
Threshold of source water 0.5-1.0 ppm B
Geranium Larkspur
Pansy Rosemary
Zinnia
MODERATELY SENSITIVE
Threshold of source water 1.0-2.0 ppm B
Calendula Gardenia
Marigold Poinsettia
Source: Maas, 1986
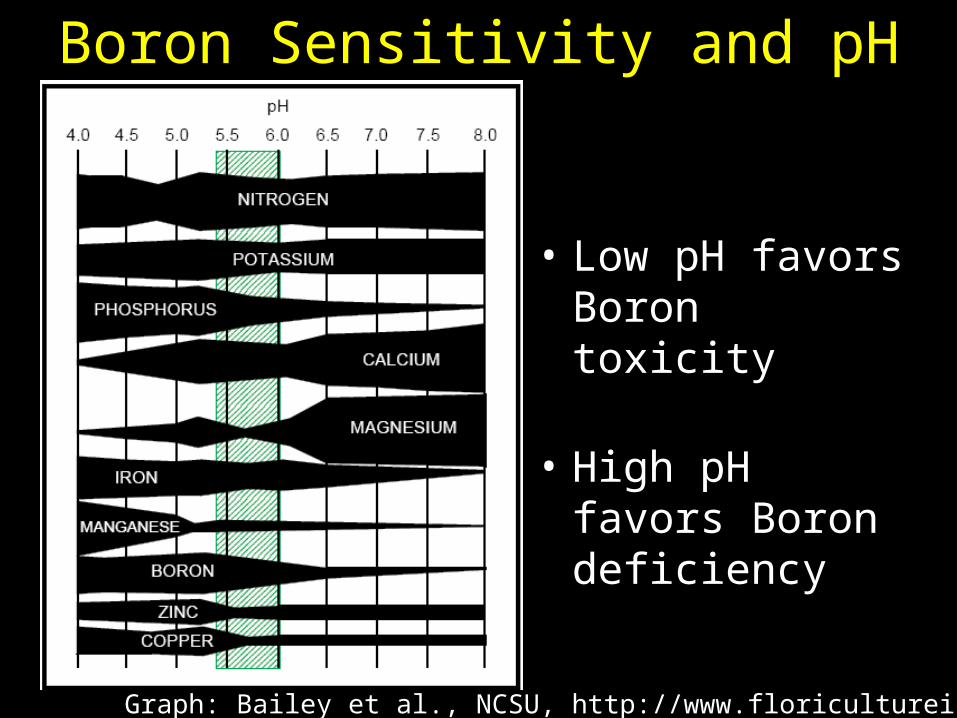
Boron Sensitivity and pH
• Low pH favors Boron toxicity
• High pH favors Boron deficiency
Graph: Bailey et al., NCSU, http://www.floricultureinfo.com/
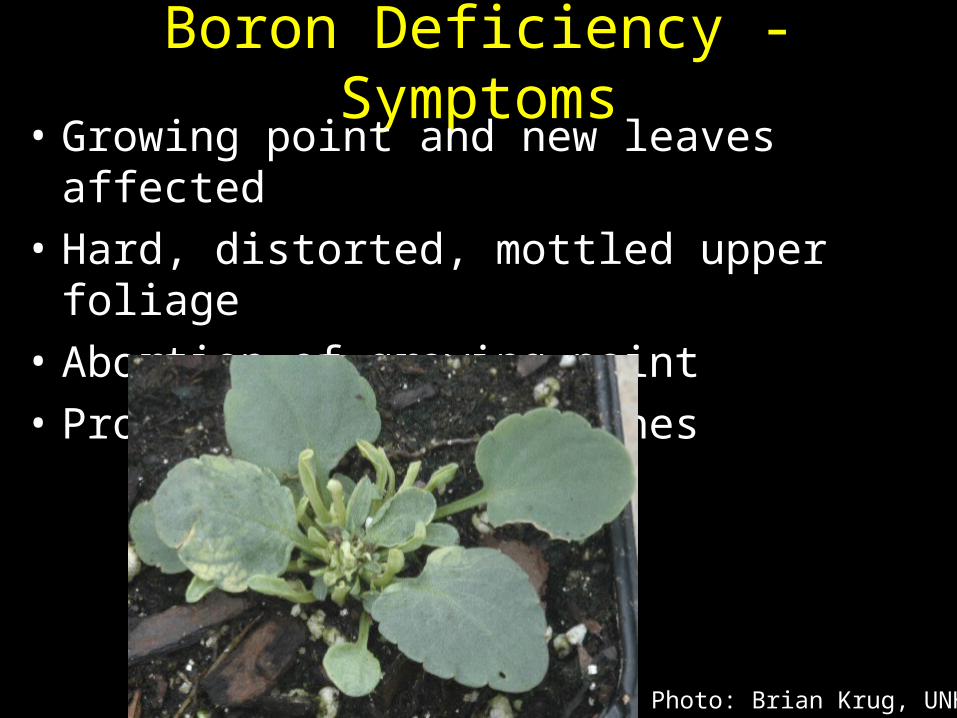
Boron Deficiency - Symptoms• Growing point and new leaves affected
• Hard, distorted, mottled upper foliage
• Abortion of growing point
• Proliferation of branches
Photo: Brian Krug, UNH

Boron Deficiency - Causes• Petunia/Pansy
plugs and flats often affected
• Low B in tap water
• High pH• High Calcium• Inactive roots
– waterlogged– cold– high humidity
Photo: Brian Krug, UNH
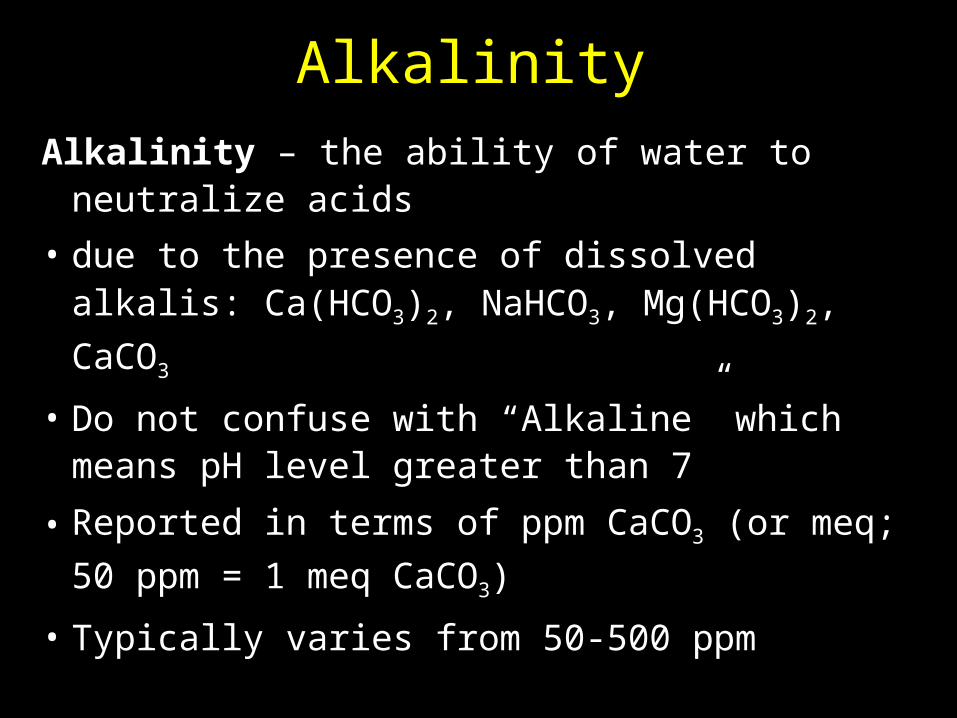
Alkalinity
Alkalinity – the ability of water to neutralize acids
• due to the presence of dissolved alkalis: Ca(HCO3)2, NaHCO3, Mg(HCO3)2, CaCO3
• Do not confuse with “Alkaline” which means pH level greater than 7
• Reported in terms of ppm CaCO3 (or meq; 50
ppm = 1 meq CaCO3)
• Typically varies from 50-500 ppm

What is Optimal Alkalinity?
Optimal Concern
Plugs 60-100 <40, >120
Flats/Small Pots 80-120 <40, >140
Large containers 120-180 <60, >200
(> 6 inches)

Problems with High Alkalinity• Rapid media pH rise
• Iron/Manganese deficiency
• Ca/Mg can precipate and excacerbate high Na
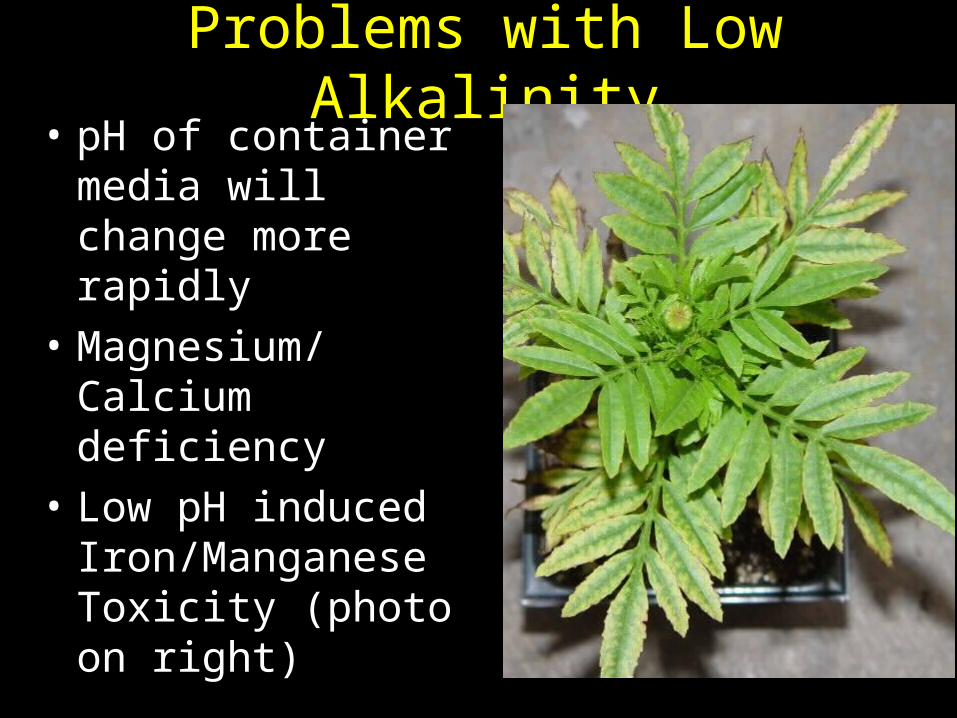
Problems with Low Alkalinity• pH of container
media will change more rapidly
• Magnesium/Calcium deficiency
• Low pH induced Iron/Manganese Toxicity (photo on right)

Crops Sensitive to High Alkalinity
Iron-inefficient group (Petunia group)
• require a lower pH (5.4-6.0)– Bacopa– Calibrachoa– Diascia– Nemesia– Pansy– Petunia– Snapdragon– Vinca

Crops Sensitive to Low Alkalinity
Iron-efficient group (Geranium group)
• Require a higher pH 6.0-6.6– Marigold– Seed/Zonal Geraniums– New Guinea Impatiens– Lisianthus

Iron toxicity
• Typically from low pH in container media
• For water sources with high Iron (>3 ppm)– removal through
flocculation / aeration
Graph: Bailey et al., NCSU, http://www.floricultureinfo.com/

Correcting High Alkalinity
1) Change or blend the water sourcerainwater, pond water
2) Use an acidic fertilizer
3) Inject acid into irrigation water
4) Ensure Iron is available in the root-zone

Factors using fertilizer to adjust pH
• Fertilizer approach does not work well in dark/cool weather– In dark/cool weather plants accumulate
ammonium (toxicity)– ammonium in the medium does not convert to
nitrate (so there is less pH effect)
• Sometimes ammonium will not drop pH due to high lime in container media, or high water alkalinity (>300 ppm)

Acid Injection
Acidification reduces the amount of carbonates and bicarbonates
H+ (from acid) + HCO3- (in
water) CO2 + H2O

Which Acid to Use?• Safety
– Nitric acid is very caustic and has harmful fumes
– Sulfuric, Phosphoric, Citric relatively safe
• Cost– Sulfuric is cheapest, others are 2-4 times more
expensive
• Nutrients from Acid– Sulfuric provides S– Nitric provides N– Phosphoric provides P (but can be too much if
equilibrating >100 ppm alkalinity

Solubility of Various Iron
Forms
Source: Reed, Water, Media, and Nutrition, 1996

Iron Chelate ProductsIron Form % Iron Product
Iron EDTA 13%Sequestrene Fe
Dissolzine EFe13
Iron DTPA 10-11%
Sequestrene 330
Sprint 330
Dissolzine DFe11
Iron EDDHA 6%
Sequesterene 138
Sprint 138
Dissolzine QFe6
• Apply drenches at 5 oz/100 gal
• Foliar sprays at 60 ppm Fe (6-8 oz/100 gal)

Phytotoxicity and Foliar Iron Sprays
Wash foliage with clear water soon after applying iron chelate

Ammonium Toxicity
Symptoms: Chlorosis/necrosis of leaf margins and between veins
Thick/leathery leavesDeath of root tips
Photos: Cari Peters

Causes of Ammonium Toxicity
• High amount in fertilizer
• Use of immature manure/compost
• Cool/wet soils inhibits conversion of Ammonium Nitrate
• Low pH (<5.5) inhibits conversion
• and ammonium does not readily leach from most substrates

Crops Sensitive to Ammonium Toxicity
• Coleus
• Cosmos
• Geranium (Pelargonium)
• Salvia
• Zinnia
• Tomato
• Eggplant
• Pepper
Photo: Margery Daughtrey

Ammonium accumulates when nitrification is inhibited

Solving Ammonium Toxicity
• Maintain Root temps ≥ 60 F• Use ≤ 40% of Nitrogen ammonium• Discontinue current fertilizer switch to nitrate
until conditions improve
Ammonium does not readily leach, but in a pinch…– Top-dress gypsum - 1 tablespoon per 6” pot– water in with clear water– drench with 50 ppm calcium nitrate after 2 hrs

Fluoride Toxicity• Symptoms
– chlorosis of leaf tips/margins, followed by necrosis – lower leaves affected first
• Sources– municipal waters (>1 ppm F)– superphosphate (1600 – 2600 ppm)
• Susceptible plants: – Easter Lily, Gladiolus– Many foliage plants that are monocots
• Solutions– substitute monocalcium-phosphate– maintain higher pH

Outline• Where do salts come from?
• General salt stress– Symptoms– Cultural Practices that cause High Salts– Sensitive Crops– Guidelines and Management Options
• Managing specific salt ions– Na, Cl, B, (H)CO3, NH4, F
• Nutrient Antagonisms

Nutrient Antagonisms
Excessive in Media Low Tissue Level
NH4, Na, K, Ca, Mg Na, K, Ca, or Mg
PO4 Zn or Fe
Ca B
Cl NO3
Source: Paul Nelson
• Occurs when one nutrient is present in excess, and limits root absorption of another nutrient
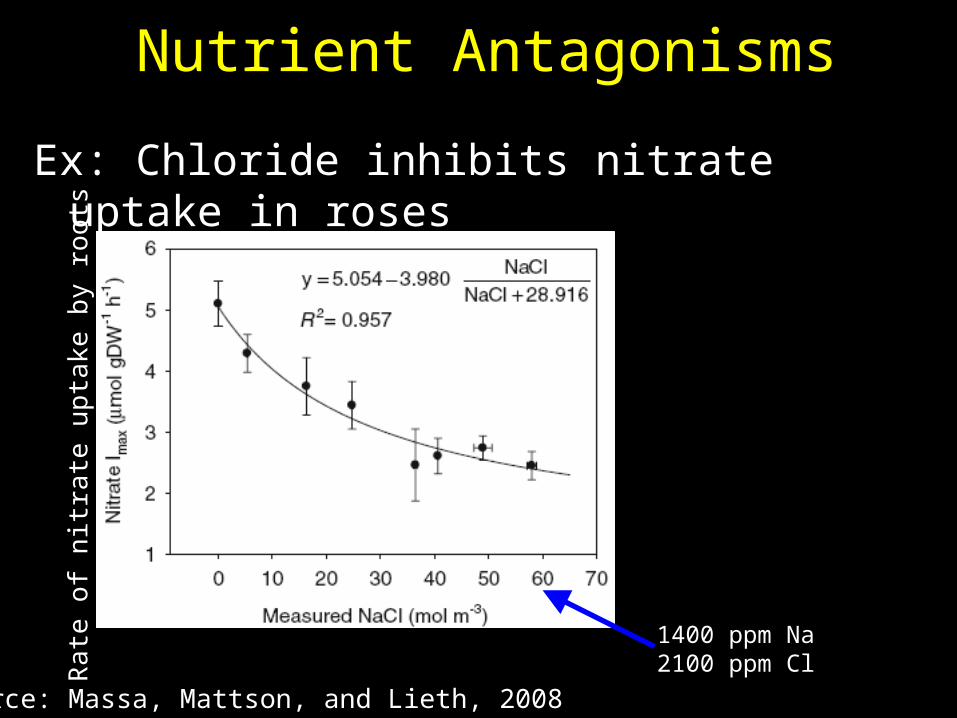
Nutrient Antagonisms
Ex: Chloride inhibits nitrate uptake in roses
1400 ppm Na2100 ppm Cl
Ra
te o
f nitr
ate
up
take
by
roo
ts
Source: Massa, Mattson, and Lieth, 2008

Questions? Neil Mattson [email protected]
Online: http://www.greenhouse.cornell.edu
Please Note – Trade names used in the presentation are for convenience only. No endorsement of products is intended, nor is criticism of unnamed products implied.