dose response for listeria monocytogenes response for listeria monocytogenes what did we learn from...
TRANSCRIPT
Dose response for Listeria monocytogenes IAFP Webinar
Organized by:
Microbial Modeling and Risk Analysis PDG
All opinions and statements are those of the individual making the presentation and not necessarily the opinion or view of IAFP

Marcel Zwietering
Wageningen University
Audio is via your computer speakers
Questions should be submitted via the Text Chat section at the bottom of the screen (can be done during the presentations, handled at the end).
Moderator
Dose response for Listeria monocytogenes IAFP Webinar
Organized by:
Microbial Modeling and Risk Analysis PDG
All opinions and statements are those of the individual making the presentation and not necessarily the opinion or view of IAFP

Contact information for presenters Dr. Régis Pouillot
formerly Center for Food Safety and Applied Nutrition, Food and Drug Administration (USA)
Prof. Dr. Fernando Pérez Rodríguez
Department of Food Science and Technology, University of Córdoba (Spain)
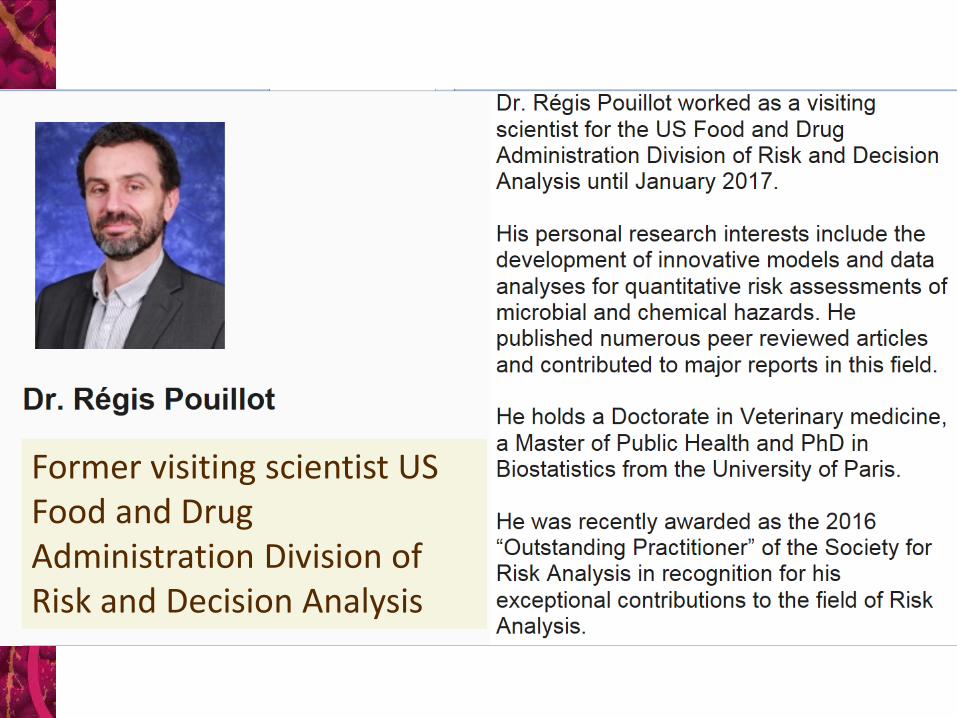
Former visiting scientist US Food and Drug Administration Division of Risk and Decision Analysis

Dose response for Listeria monocytogenes
What did we learn from recent
outbreaks?
Régis Pouillot, DVM, PhD
IAFP MMRA PDG Webinar, June 1st 2017
foodrisk
modeldata
L.
monocyto
genes
growthinfection
study
using
distribution
hcvtime
analysis
listeria
assessment
resultsmean
listeriosis
table
population
animalsdisease
infe
cte
d cameroon
estimated
testvirus
consum
ption
parameters
models
pre
va
len
ce
methodtemperature
observed
uncertainty
variability
positive
samples
france
ava
ila
ble
age
health
microbiology
bacterial
dis
trib
utions
exposure
patients
based
rate
journal
contamination
ci
associated values
children
level
log
strains
studies
report
ed
mice
estimates
herd
transmission
control
strain
human
parameter
hiv
international
factors
hepatitis
reference
found
low
tests
considered
storage
genotype
meth
ods
animal
medinfect
value
obta
ined
probability
detection
fig
africa
clinical
standard
dis
period
isolates
pro
duce
microbiol
women
deli
infectionsfoodborne
css
bacteria
products
accord
ing
foods
performed
product
water
incidence
total
type
cam
pylo
bacte
r
quantitative
days
diseases
estimate
safe
ty
due na
pasteur
rates
specific
fresh
effect
example
concentration
contaminated
cfu
milk
lower
applied
size
french
yaounde
pregnant
se
nsitiv
ity
chicken
compared
les
ml
sta
tistica
l
un
ite
d
described
national
bayesian
du
sample
prior
survey
month
s
vete
rinary
times
meat
reta
il
genotypes
major
estimation
ii
consumed
corr
espondin
g
salmon
brucellosis
functio
n
countries
signif icant
monocytogene
cells
conditions
outbreaks
process
respectively
tested
approach
impact
result
treatment
enterocolitica
maximum
infectious
potential
salmonella
african
laboratory
species
w eeks
research
sequences
differences
rte
cell
expected
inclu
ded
including
show n
epidemic
follow ing
stagev accine
n
public

Listeria monocytogenes
• Few complete outbreak data are available to derive a dose-response
– Hispanic cheese outbreak in Los Angeles county, 1985
– Listeria monocytogenes infection from butter in Finland for transplant patients, 1998-1999
– …
Lyytikäinen et al., J Infect Dis, 2000, Linnan et al., N Engl J Med, 1988, FDA/FSIS 2003, FAO/WHO 2004
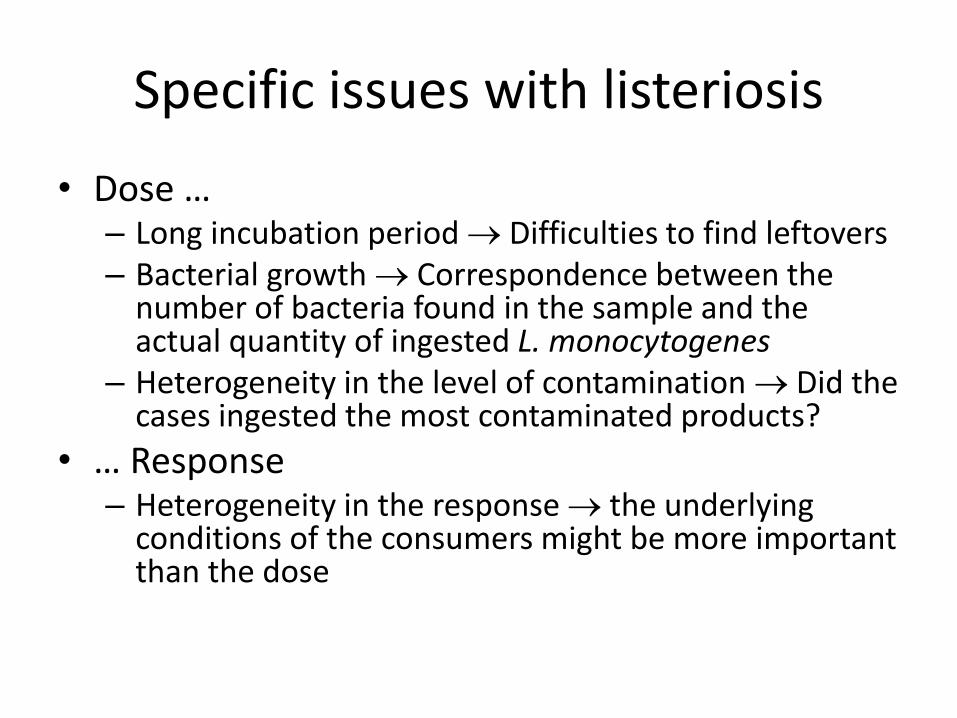
Specific issues with listeriosis
• Dose … – Long incubation period Difficulties to find leftovers – Bacterial growth Correspondence between the
number of bacteria found in the sample and the actual quantity of ingested L. monocytogenes
– Heterogeneity in the level of contamination Did the cases ingested the most contaminated products?
• … Response – Heterogeneity in the response the underlying
conditions of the consumers might be more important than the dose
Recent Data Collection in US
• Focus on data collection
– Celery Outbreak, TX, 2010
– Cantaloupe Outbreak, Multistate, 2011
– Caramel Apple, Multistate, 2015
– Ice Cream, Multistate, 2015
– …
9

The case of Celery
• Celery Outbreak, TX, 2010
– 10 cases in inpatients of an hospital
• Data on underlying health issues
– Growth studies
– Transfer studies
– Limited prevalence and contamination level data
Knudson Gaul, L et al., Clin Infect Dis, 2013, Sahu et al., Food Control, 2017; Kaminski et al., JFP, 2014
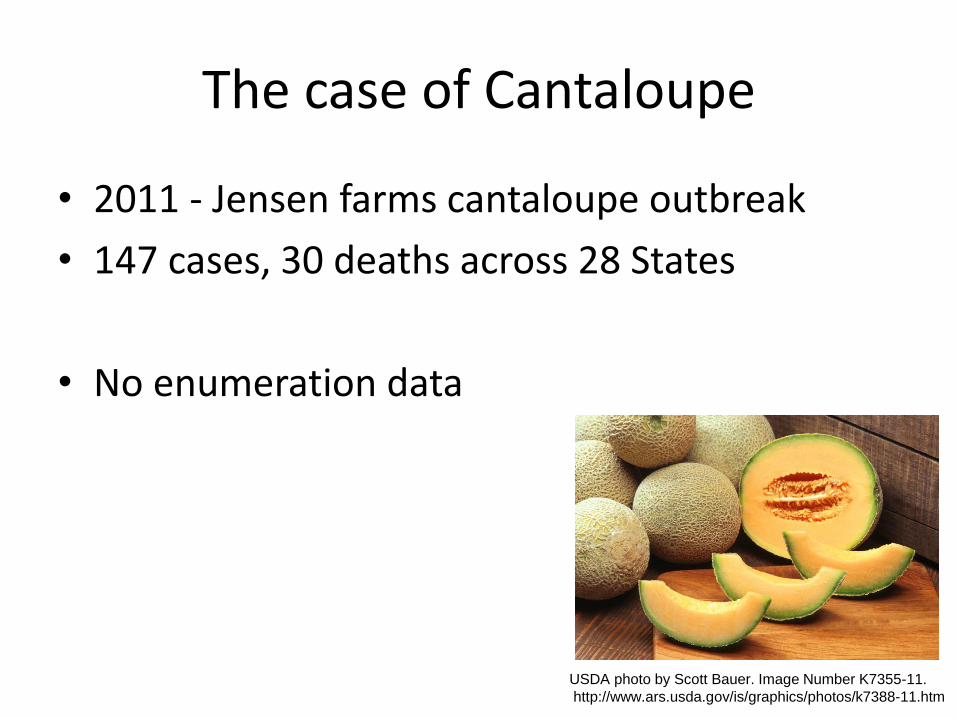
USDA photo by Scott Bauer. Image Number K7355-11.
http://www.ars.usda.gov/is/graphics/photos/k7388-11.htm
The case of Cantaloupe
• 2011 - Jensen farms cantaloupe outbreak
• 147 cases, 30 deaths across 28 States
• No enumeration data
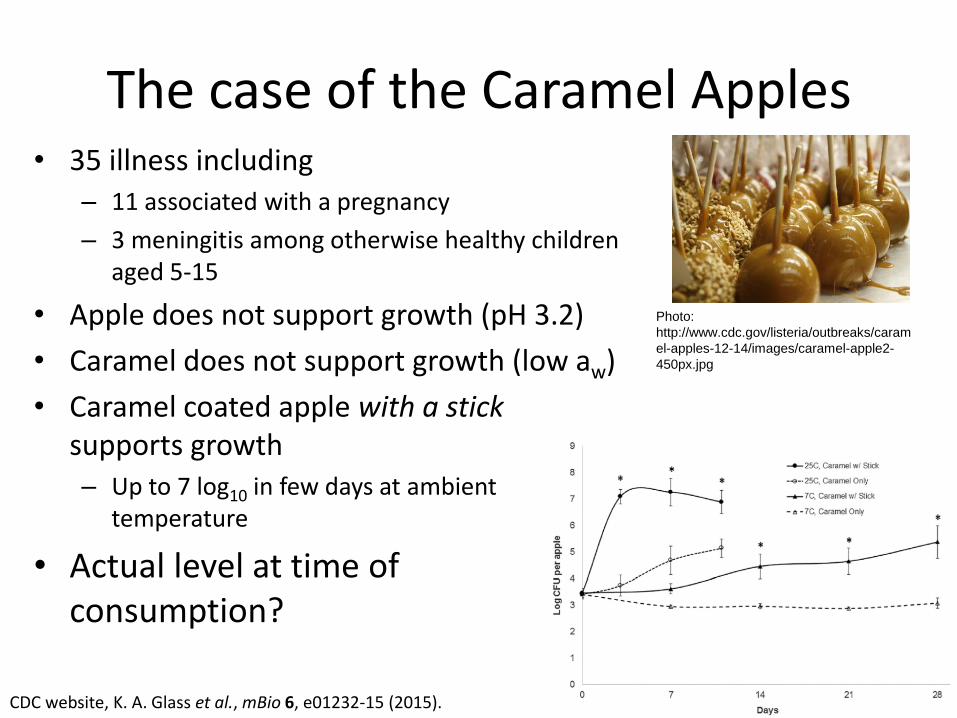
The case of the Caramel Apples • 35 illness including
– 11 associated with a pregnancy
– 3 meningitis among otherwise healthy children aged 5-15
• Apple does not support growth (pH 3.2)
• Caramel does not support growth (low aw)
• Caramel coated apple with a stick supports growth – Up to 7 log10 in few days at ambient
temperature
• Actual level at time of consumption?
12 CDC website, K. A. Glass et al., mBio 6, e01232-15 (2015).
Photo:
http://www.cdc.gov/listeria/outbreaks/caram
el-apples-12-14/images/caramel-apple2-
450px.jpg
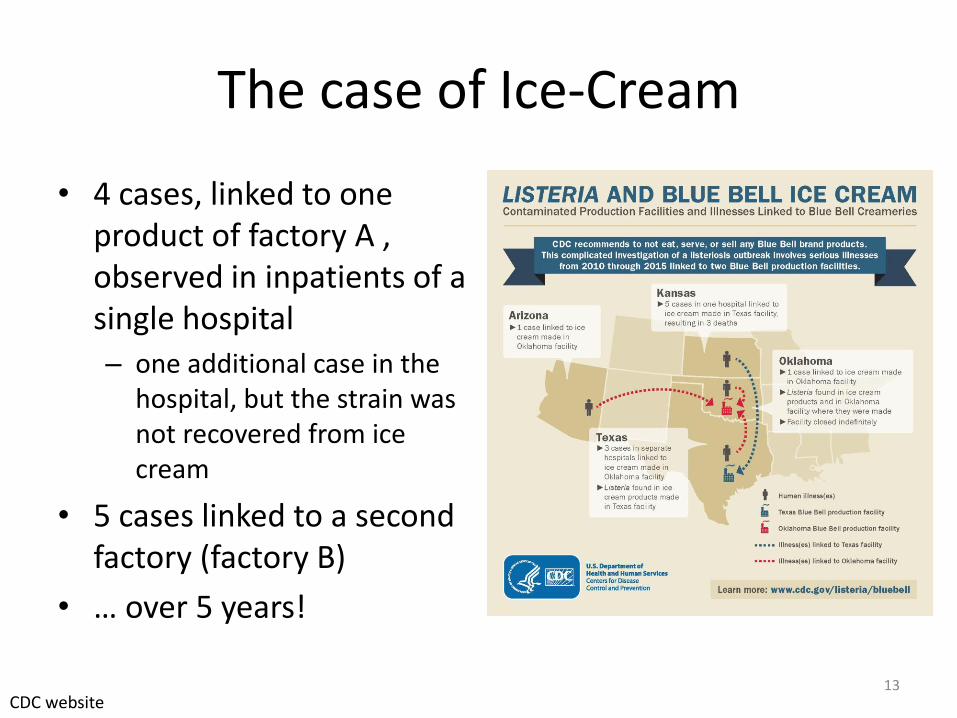
The case of Ice-Cream
• 4 cases, linked to one product of factory A , observed in inpatients of a single hospital
– one additional case in the hospital, but the strain was not recovered from ice cream
• 5 cases linked to a second factory (factory B)
• … over 5 years!
13 CDC website
• FDA collected more than 10 ½ pallets of samples from the company’s Factory A – FDA optimized enumeration methods for the
contamination in these products using both MPN and direct plating methods • The MPN method used a 3 × 10 g, 5 × 1.0 g,
8 × 0.1 g and 8 × 0.01 g dilution scheme (3-5-8-8)
• FDA collected sales data – With address Categorization Hospitals,
Schools, …
14
Chen et al., JFP, 79(11) 2016; Chen et al., IJFM, 241, 2017
The case of Ice-Cream

Jan 2010: First case linked to the brand
Mar 13th, 2015: Products removed from the market
Jan 2014: First case linked to the factory A: Patient #1
Sale log starting date: Nov 7th, 2013
Product B available, tested positive: May 21st, 2014
Product A available, tested positive: Nov 6th, 2014
Product C available, tested positive: Dec 8th, 2014
Mar 2014: Second case linked to the factory A: Patient #2
Oct 2014: Third case linked to the factory A: Patient #3
Jan 2015: Fourth case linked to the factory A: Patient #4
Cleaning and overhauling of the production line: Jan 2015
Timeline
Pouillot et al., EID 22(12) 2016

The 4 cases
• Onset ranges from January 2014 through January 2015 (over one year)
• All 4 were >67 and < 84 years of age • All 4 had underlying conditions that contributed
to compromised immune function before exposure
• Ate the product via milk shakes – Two patients had two milkshakes – One patient had three milkshakes – (unrecorded data for the fourth one)
Pouillot et al., EID 22(12) 2016
MPN/g
Fre
qu
en
cy
0 50 100 150 200 250 300 350
05
00
10
00
15
00
log10(MPN/g)
Fre
qu
en
cy
-1 0 1 2
05
01
00
15
02
00
25
0
MPN/g
Fre
qu
en
cy
0 50 100 150 200 250 300 350
05
00
10
00
15
00
log10(MPN/g)
Fre
qu
en
cy
-1 0 1 2
05
01
00
15
02
00
25
0
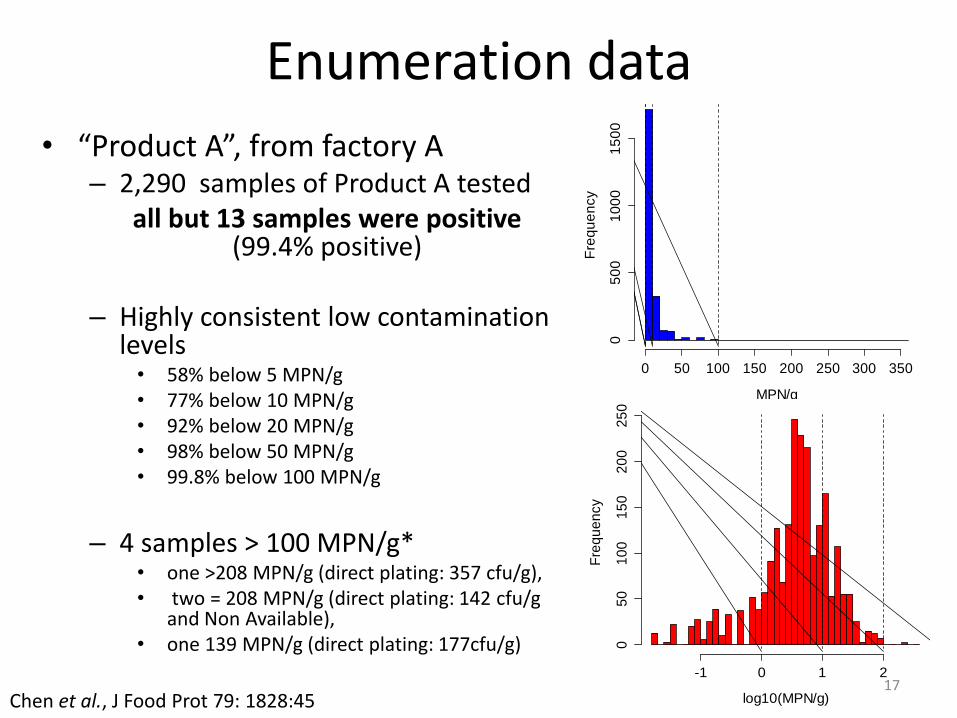
Enumeration data
• “Product A”, from factory A – 2,290 samples of Product A tested
all but 13 samples were positive (99.4% positive)
– Highly consistent low contamination
levels • 58% below 5 MPN/g • 77% below 10 MPN/g • 92% below 20 MPN/g • 98% below 50 MPN/g • 99.8% below 100 MPN/g
– 4 samples > 100 MPN/g*
• one >208 MPN/g (direct plating: 357 cfu/g), • two = 208 MPN/g (direct plating: 142 cfu/g
and Non Available), • one 139 MPN/g (direct plating: 177cfu/g)
17
Chen et al., J Food Prot 79: 1828:45
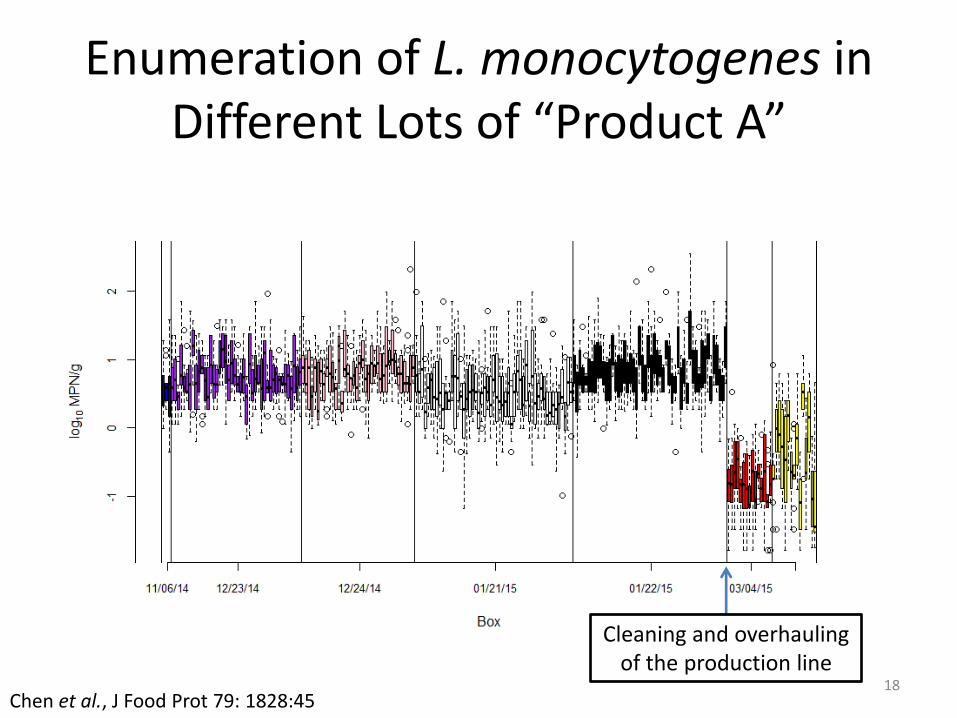
Enumeration of L. monocytogenes in Different Lots of “Product A”
18 Chen et al., J Food Prot 79: 1828:45
Cleaning and overhauling of the production line
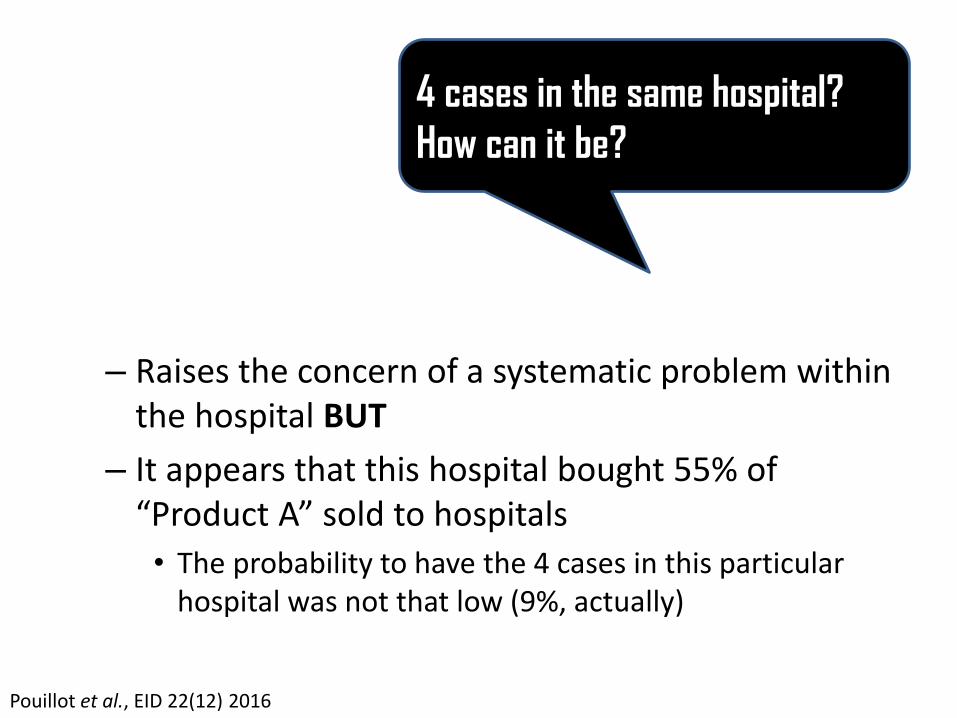
– Raises the concern of a systematic problem within the hospital BUT
– It appears that this hospital bought 55% of “Product A” sold to hospitals
• The probability to have the 4 cases in this particular hospital was not that low (9%, actually)
4 cases in the same hospital?
How can it be?
Pouillot et al., EID 22(12) 2016

• Under the assumption of no growth, the probability to have a high level of contamination of the product A was low… – But not null
• Product A Milk Shake – Growth in milk shake:
limited (Chen et al., 2016) – Contamination of the milk
shake machine: possible (the machine was “inoculated” multiple times, every days, during a long period of time), but not detected
• Answer: probably yes… but impossible to say.
Pouillot et al., EID 22(12) 2016
Did the cases eat a low number of bacteria ?
-2 -1 0 1 2 3
0.0
0.2
0.4
0.6
0.8
1.0
ScoopsMC
Fn
(x)
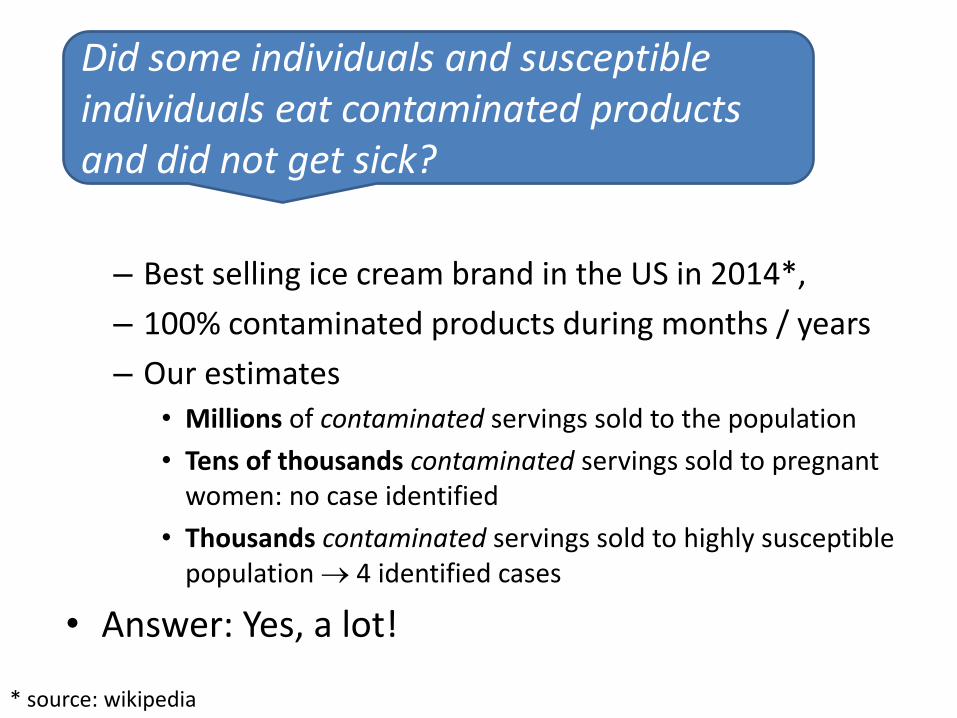
– Best selling ice cream brand in the US in 2014*,
– 100% contaminated products during months / years
– Our estimates
• Millions of contaminated servings sold to the population
• Tens of thousands contaminated servings sold to pregnant women: no case identified
• Thousands contaminated servings sold to highly susceptible population 4 identified cases
• Answer: Yes, a lot!
* source: wikipedia
Did some individuals and susceptible individuals eat contaminated products and did not get sick?

The tip of the ice cream Four cases: dose?
Millions of non-cases
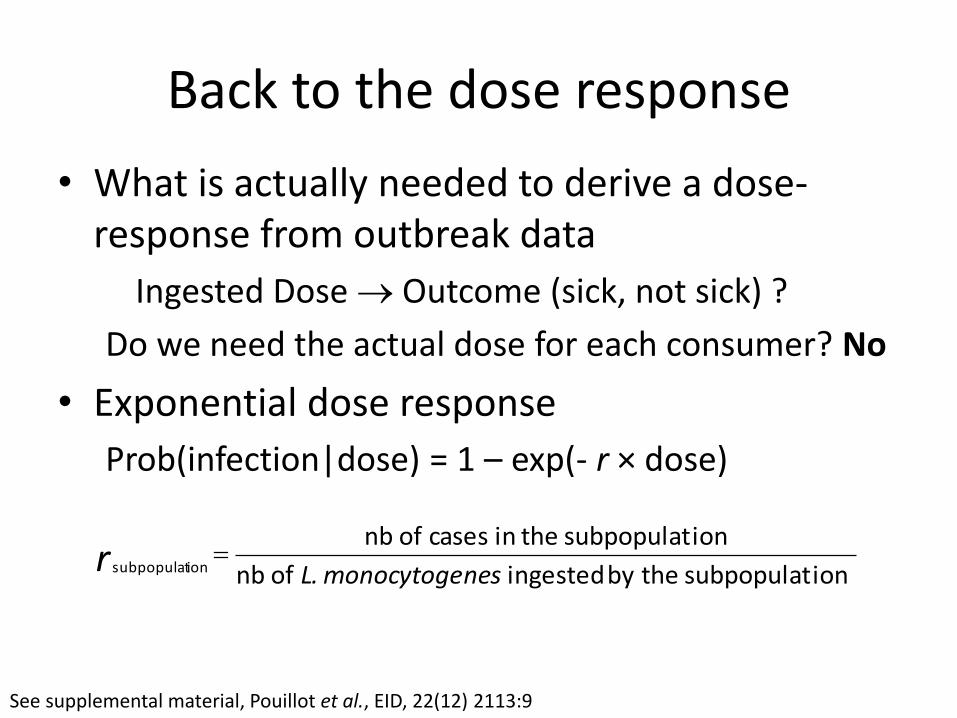
Back to the dose response
• What is actually needed to derive a dose-response from outbreak data
Ingested Dose Outcome (sick, not sick) ?
Do we need the actual dose for each consumer? No
• Exponential dose response
Prob(infection|dose) = 1 – exp(- r × dose)
ionsubpopulatthebyingestedofnb
ionsubpopulattheincasesofnbionsubpopulat nesmonocytogeL.r
See supplemental material, Pouillot et al., EID, 22(12) 2113:9
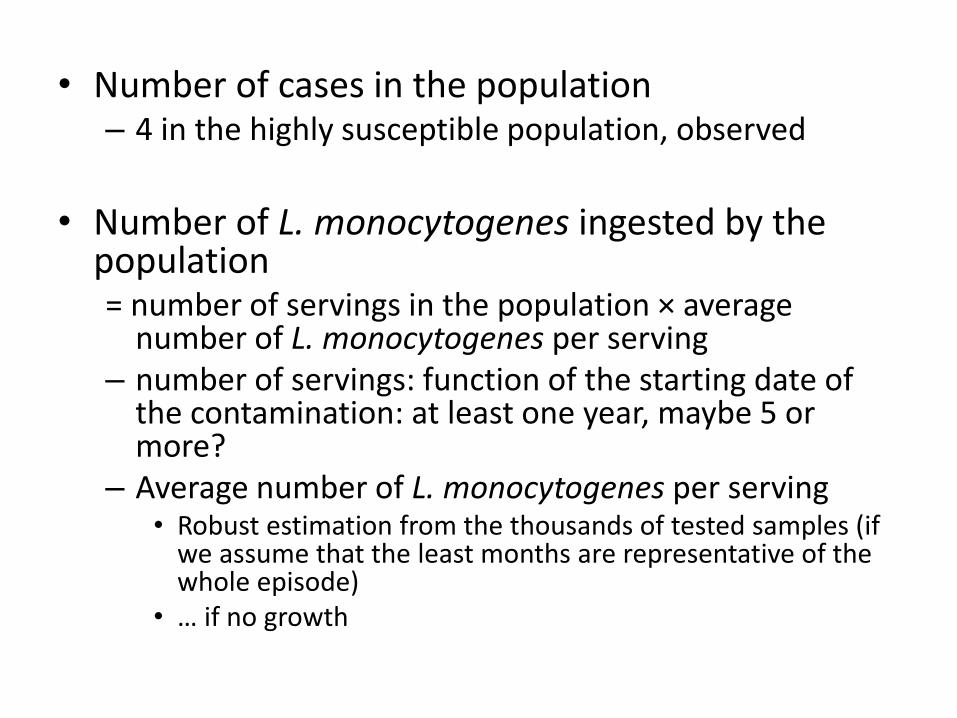
• Number of cases in the population – 4 in the highly susceptible population, observed
• Number of L. monocytogenes ingested by the
population = number of servings in the population × average
number of L. monocytogenes per serving – number of servings: function of the starting date of
the contamination: at least one year, maybe 5 or more?
– Average number of L. monocytogenes per serving • Robust estimation from the thousands of tested samples (if
we assume that the least months are representative of the whole episode)
• … if no growth
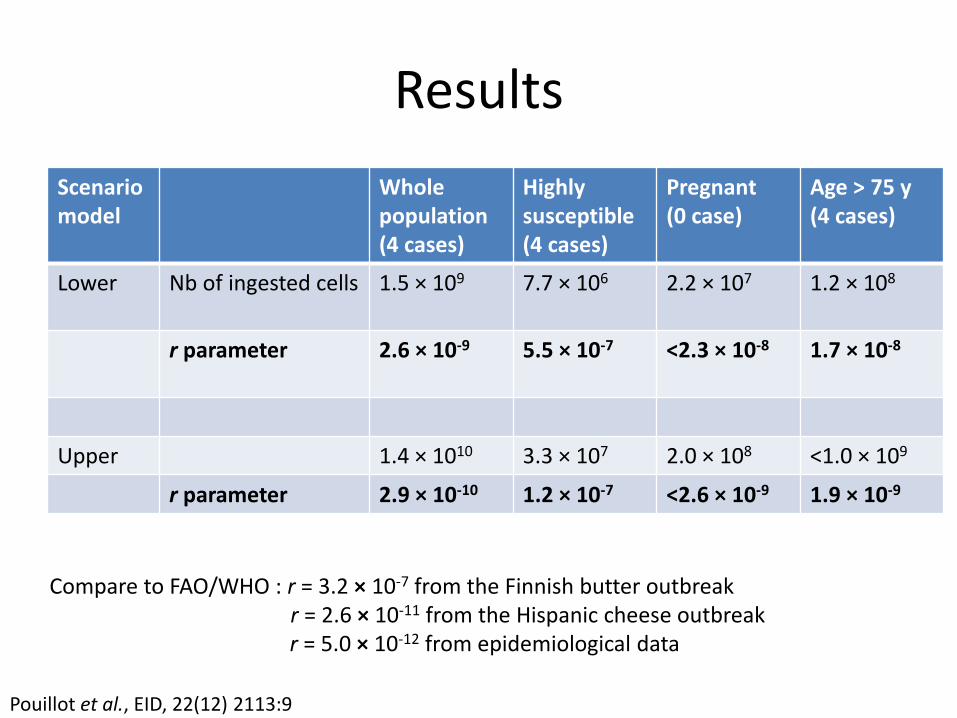
Results
Scenario model
Whole population (4 cases)
Highly susceptible (4 cases)
Pregnant (0 case)
Age > 75 y (4 cases)
Lower Nb of ingested cells 1.5 × 10⁹
7.7 × 10⁶
2.2 × 10⁷ 1.2 × 10⁸
r parameter 2.6 × 10⁻⁹ 5.5 × 10⁻⁷ <2.3 × 10⁻⁸
1.7 × 10⁻⁸
Upper 1.4 × 10¹⁰ 3.3 × 10⁷ 2.0 × 10⁸ <1.0 × 10⁹
r parameter 2.9 × 10⁻¹⁰ 1.2 × 10⁻⁷ <2.6 × 10⁻⁹ 1.9 × 10⁻⁹
Compare to FAO/WHO : r = 3.2 × 10⁻⁷ from the Finnish butter outbreak
r = 2.6 × 10⁻¹¹ from the Hispanic cheese outbreak r = 5.0 × 10⁻¹² from epidemiological data
Pouillot et al., EID, 22(12) 2113:9

1.E-15
1.E-14
1.E-13
1.E-12
1.E-11
1.E-10
1.E-09
1.E-08
1.E-07
1.E-06
1.E-05
1.E-04
1.E-03
1.E-02
1.E-01
1.E+00
Pro
ba
bilit
y o
f A
dve
rse
Eff
ec
t
Dose (log10 cfu/serving)
Butter Hispanic-style Cheese
Ice cream, All populations, lower estimate Ice cream, All populations, higher estimate
Ice cream, Highly Susceptible population, lower estimate Ice cream, Highly Susceptible population, higher estimate
FAO/WHO HHS/USDA

Conclusions • We’ll probably never get better data
– Impossible to know for sure what was the ingested dose of specific individuals
– Not needed to derive a dose response model!
• Paradox: more information on the non-cases than on the cases.
• Corresponding dose-response model comparable to previous dose-response models developed from outbreaks
– Other outbreaks: limited diffusion of products contaminated at relatively high level
– Here: large distribution of products contaminated at low level
• Probability of infection following the ingestion of a given dose higher than for models derived from epidemiological data
– Bias when working on outbreaks: what about large diffusion of contaminated products that never lead to a recorded outbreak?
27
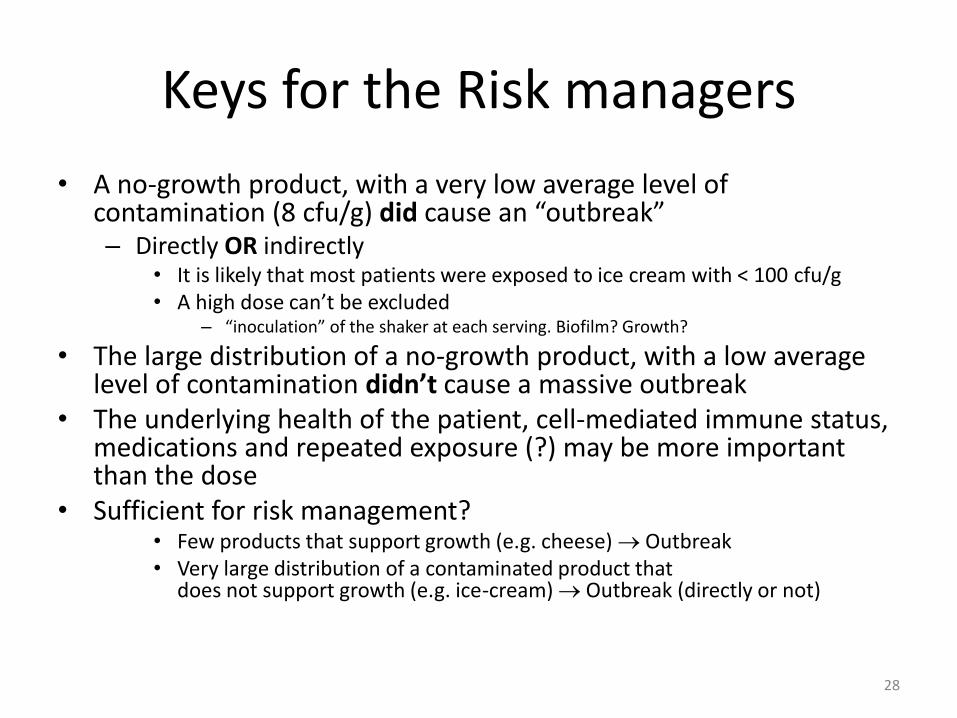
Keys for the Risk managers
• A no-growth product, with a very low average level of contamination (8 cfu/g) did cause an “outbreak” – Directly OR indirectly
• It is likely that most patients were exposed to ice cream with < 100 cfu/g • A high dose can’t be excluded
– “inoculation” of the shaker at each serving. Biofilm? Growth?
• The large distribution of a no-growth product, with a low average level of contamination didn’t cause a massive outbreak
• The underlying health of the patient, cell-mediated immune status, medications and repeated exposure (?) may be more important than the dose
• Sufficient for risk management? • Few products that support growth (e.g. cheese) Outbreak • Very large distribution of a contaminated product that
does not support growth (e.g. ice-cream) Outbreak (directly or not)
28
Thank you Co-authors of the manuscripts and everyone
involved in the data collection for these outbreaks
Among other papers…


Selection of a Listeria monocytogenes dose-response model for risk
assessment in ready-to-eat products
Dr. Prof. Fernando Perez Rodriguez Department of Food Science and Technology
University of Córdoba (Spain)

1. Risk assessment scheme 2. D-R models: types and approaches 3. Review of Listeria D-R models 4. Selection of Listeria D-R models for QMRA 5. D-R model integration into QMRA
Outline
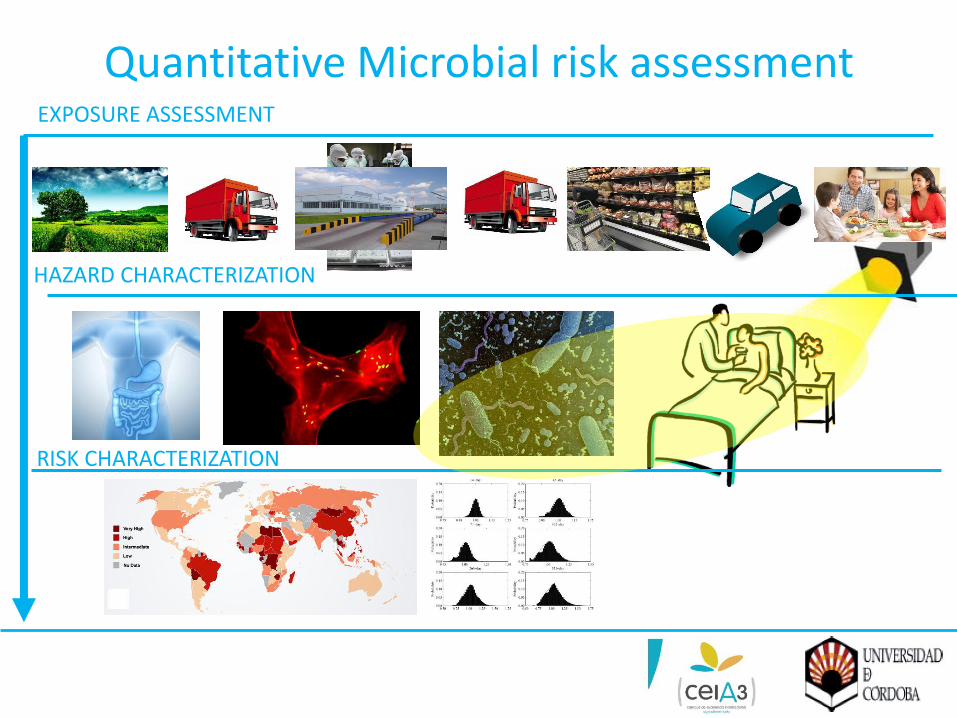
HAZARD CHARACTERIZATION
RISK CHARACTERIZATION
EXPOSURE ASSESSMENT
Quantitative Microbial risk assessment
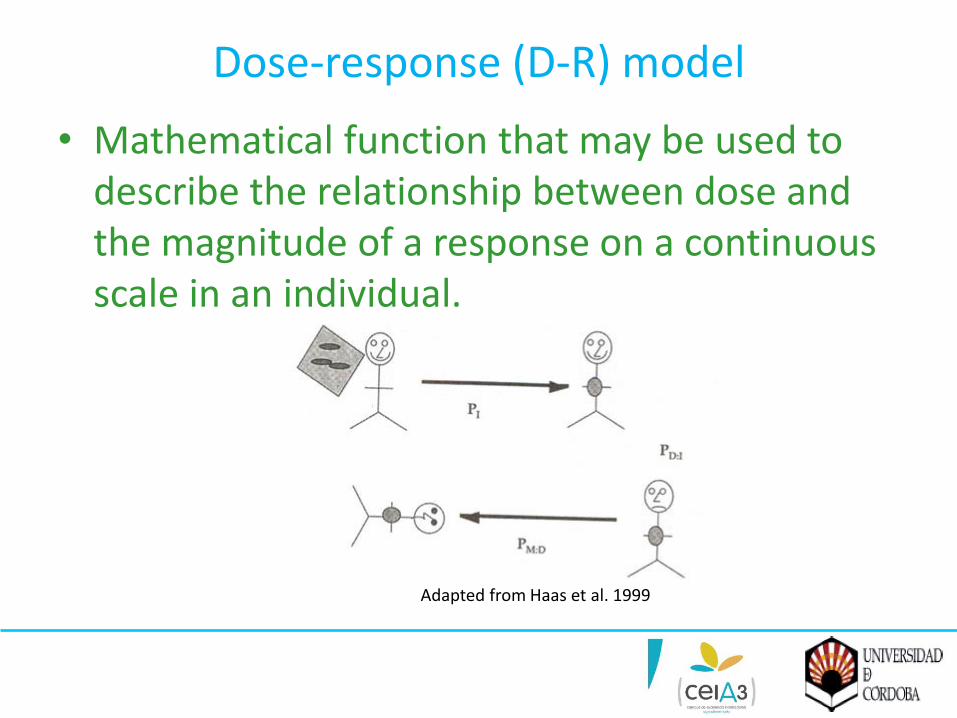
Dose-response (D-R) model
• Mathematical function that may be used to describe the relationship between dose and the magnitude of a response on a continuous scale in an individual.
Adapted from Haas et al. 1999
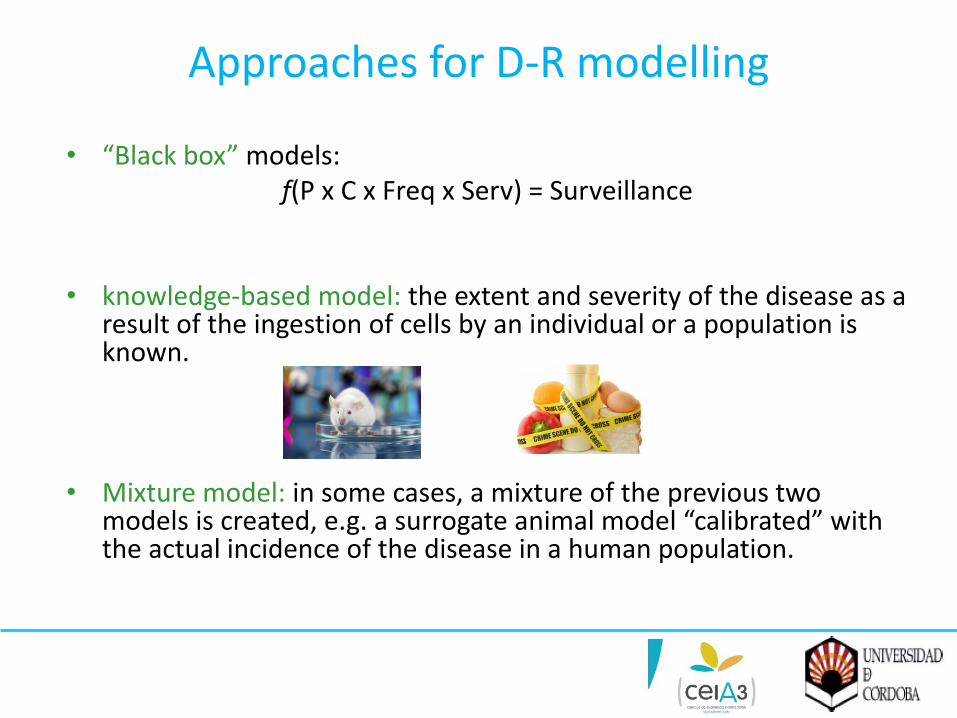
Approaches for D-R modelling
• “Black box” models: f(P x C x Freq x Serv) = Surveillance
• knowledge-based model: the extent and severity of the disease as a result of the ingestion of cells by an individual or a population is known.
• Mixture model: in some cases, a mixture of the previous two models is created, e.g. a surrogate animal model “calibrated” with the actual incidence of the disease in a human population.

• Empirical models are extensively applied in risk assessment, assuming a distribution of population tolerance: Limited in case of extrapolation
D-R modelling
0 2 4 6
0.0
0.2
0.4
0.6
0.8
1.0
Cumulative distribution
Censored data
CDF
Surveillance = f(P, C, Freq, Serv)
Black box” models:
• Mechanistic models are potentially more flexible: on a set of biologically plausible, mechanistic assumptions.
• They should account for the host-pathogen-food interaction (Hoelzer et al., 2013)
• Mechanistic models are based on the Independence of Action of microorganisms:
• No-theshold mechanistic models are the most frequent models
D-R models
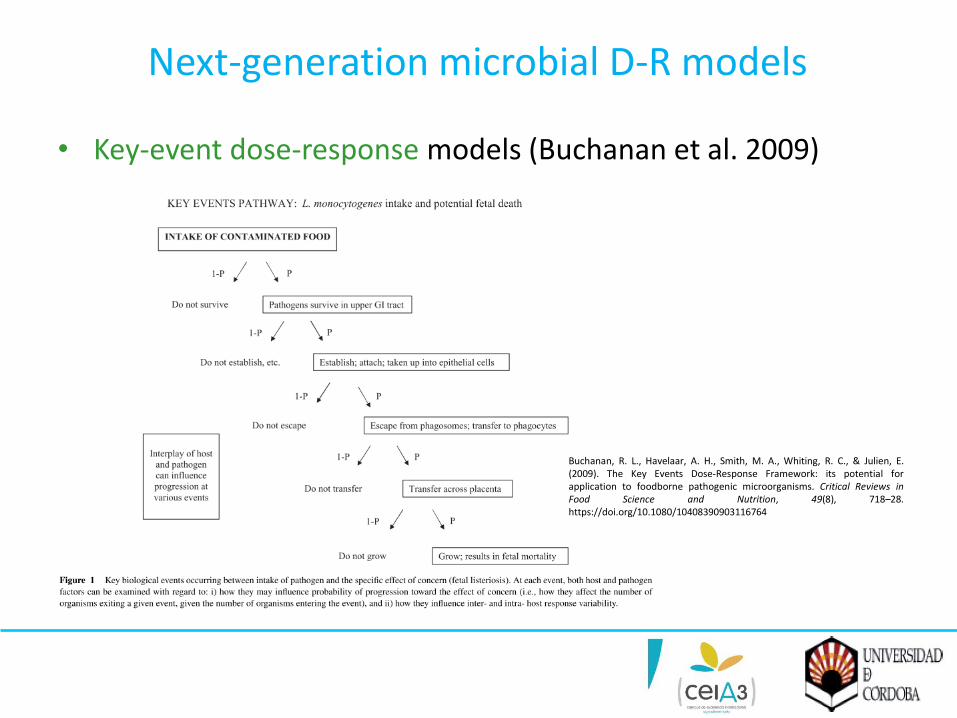
Next-generation microbial D-R models
• Key-event dose-response models (Buchanan et al. 2009)
Buchanan, R. L., Havelaar, A. H., Smith, M. A., Whiting, R. C., & Julien, E. (2009). The Key Events Dose-Response Framework: its potential for application to foodborne pathogenic microorganisms. Critical Reviews in Food Science and Nutrition, 49(8), 718–28. https://doi.org/10.1080/10408390903116764
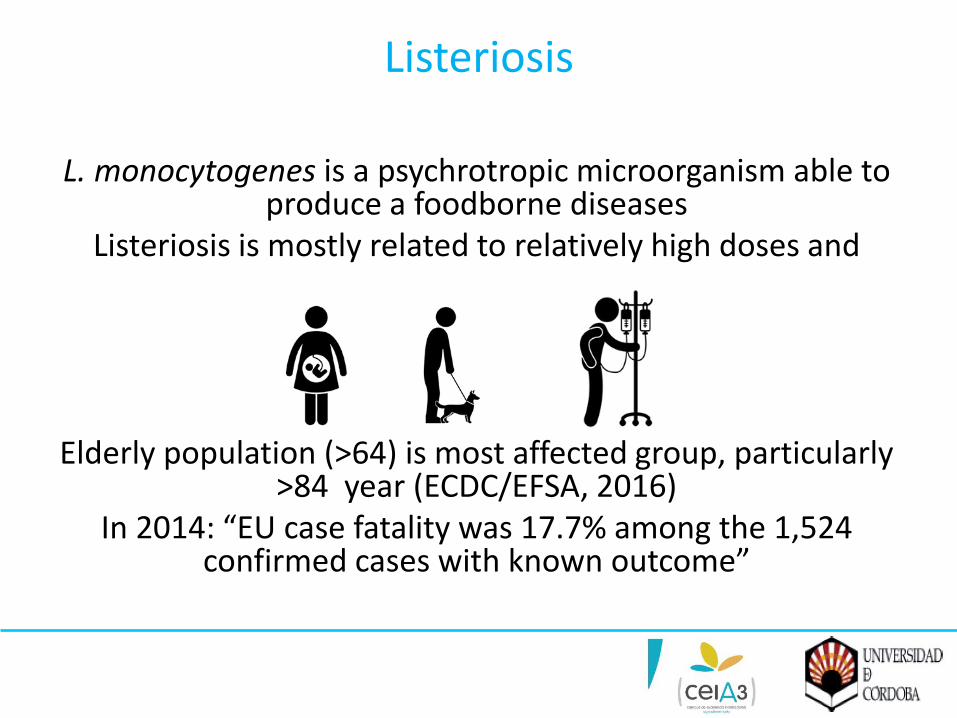
Listeriosis
L. monocytogenes is a psychrotropic microorganism able to produce a foodborne diseases
Listeriosis is mostly related to relatively high doses and
Elderly population (>64) is most affected group, particularly >84 year (ECDC/EFSA, 2016)
In 2014: “EU case fatality was 17.7% among the 1,524 confirmed cases with known outcome”

D-R models for L. monocytogenes
• Determinants of virulence variability among strains: fixed genetic determinant, transient determinant (e.g. stress response) Differential gene expression as a function of the environment (e.g. food)
• D-R data for strains with varying virulence
• Association of strains with clinical manifestation (e.g. meningitis)
• Growth and concentration of L. monocytogenes in the intestinal lumen.
• Impact of L. monocytogenes gene expression at each step of infection
Pathogen
• Improved outbreak data • New animal models • Better understanding of
determinant of susceptibility • Alternative models
Host
• Better understanding of L. monocytogenes pathophysiology (role microbiota)
• Better understanding of host susceptibility
• Prevalence and concentration of strains with/without PMSC in inlA
Food Matrix
• Food implicated in outbreaks; characterization of contamination patterns, representativeness and accuracy of count data
• Food characteristics modulating L. monocytogenes gene expression
• Food characteristics related to listeriosis and listeria growth
• Identifying infective dose and concentration in outbreaks.
• Virulence of strains with/without PMSC in inIA.
• Outbreak data, species differences in pathophysiology, guinea pigs and rhesus monkey dose-response data
Available Data need Long-term based on the Dose-Response Workshop outcomes (adapted from Hoelzer et al. (2013)).

Review of D-R models for L. monocytogenes
• Differences in the population groups
– Low-risk group vs. High risk group
– Age-based groups: Intermediate-age*, Elderly (over 60-65) and Pregnant
– Elderly, pregnant and immunocompromised population
• Different r-values (point-estimates)
• Mostly USA-originated D-R models
• Endpoint: 80% illness, infection (animals) and death
Review of D-R models for L. monocytogenes
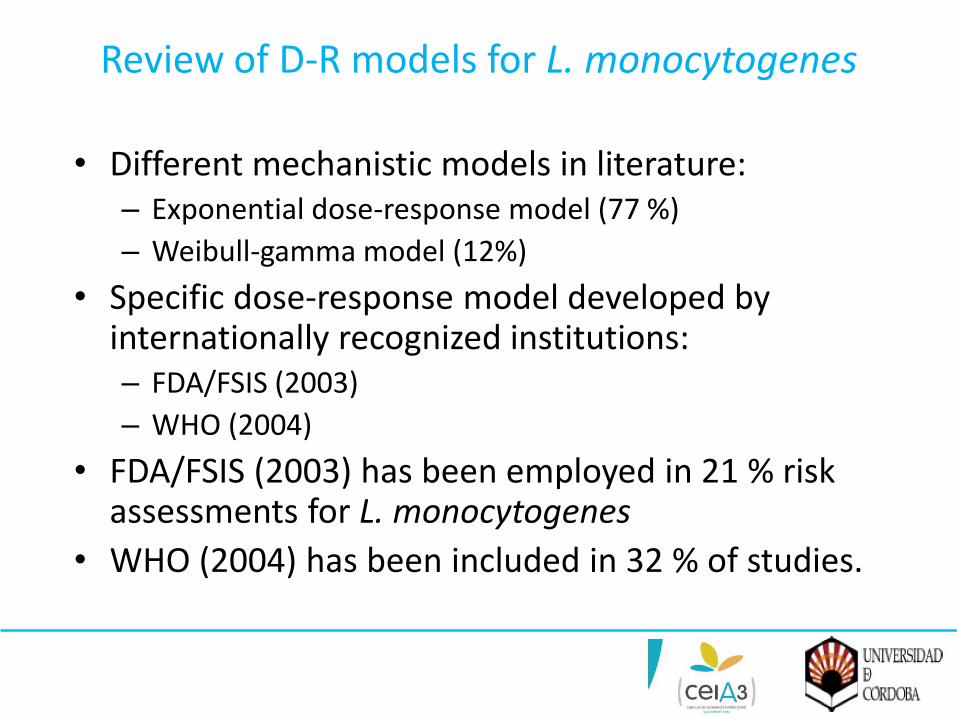
• Different mechanistic models in literature: – Exponential dose-response model (77 %)
– Weibull-gamma model (12%)
• Specific dose-response model developed by internationally recognized institutions: – FDA/FSIS (2003)
– WHO (2004)
• FDA/FSIS (2003) has been employed in 21 % risk assessments for L. monocytogenes
• WHO (2004) has been included in 32 % of studies.

D-R models for L. monocytogenes
P (ill; d, r) = 1-exp(-rd)
Exponential dose-response model
where “ill” stands for “illness”, “d” refers to “dose”, and r is the probability of developing listeriosis from the ingestion of one bacteria cell in a given specific serving.
The exponential form of the DR model relationship is mostly preferred due to • Mechanistic, it does not present threshold, • it is a one-parameter model, • and it has been widely used by different organizations including FAO/WHO and
FDA/FSIS

Tool to evaluate the quality of the Exponential dose-response models currently available:
Objective scores Assessors
Weights to Pedigree Criteria Experts
Selection of D-R models for risk assessment
Application of Numeral Unit Spread Assessment Pedigree (NUSAP) system
NUSAP scoring system
The NUSAP system (Boone et al., 2009) is intended to assess data quality resulting from uncertainties that are hard to quantify such as methodological and epistemological uncertainties, and that are not systematically taken into account in scientific studies.
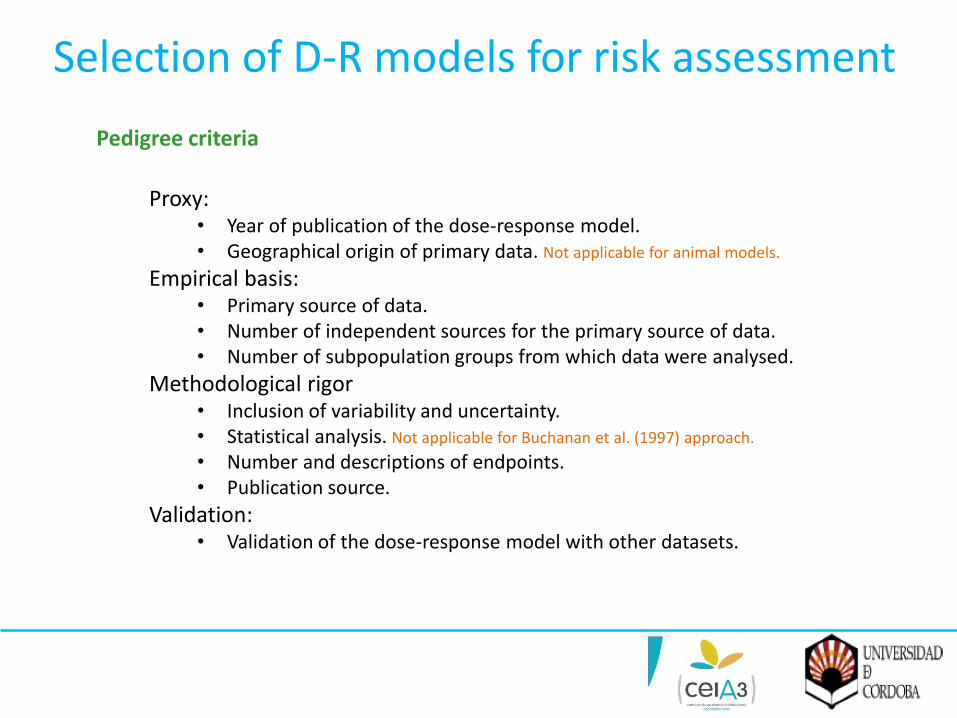
Proxy: • Year of publication of the dose-response model. • Geographical origin of primary data. Not applicable for animal models.
Empirical basis: • Primary source of data. • Number of independent sources for the primary source of data. • Number of subpopulation groups from which data were analysed.
Methodological rigor • Inclusion of variability and uncertainty. • Statistical analysis. Not applicable for Buchanan et al. (1997) approach.
• Number and descriptions of endpoints. • Publication source.
Validation: • Validation of the dose-response model with other datasets.
Selection of D-R models for risk assessment
Pedigree criteria

Pedigree criteria
Score system
Selection of D-R models for risk assessment
Scoring
weight
weight
Assessor
Expert
Final score
Self-assessment
Objective scoring
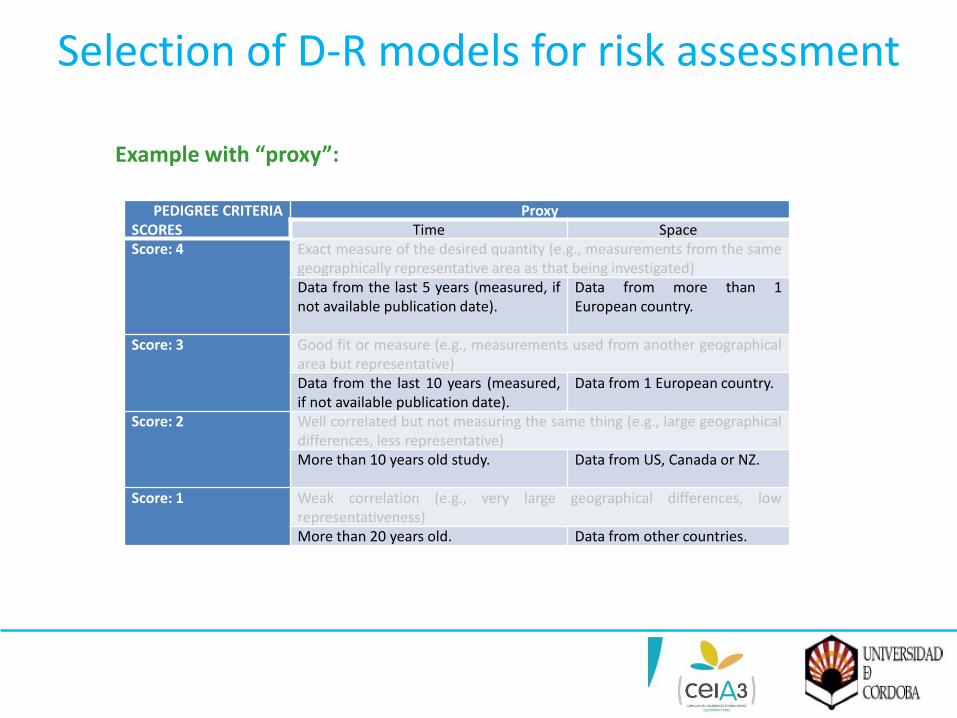
PEDIGREE CRITERIA SCORES
Proxy
Time Space
Score: 4
Exact measure of the desired quantity (e.g., measurements from the same geographically representative area as that being investigated) Data from the last 5 years (measured, if not available publication date).
Data from more than 1 European country.
Score: 3
Good fit or measure (e.g., measurements used from another geographical area but representative) Data from the last 10 years (measured, if not available publication date).
Data from 1 European country.
Score: 2
Well correlated but not measuring the same thing (e.g., large geographical differences, less representative) More than 10 years old study.
Data from US, Canada or NZ.
Score: 1
Weak correlation (e.g., very large geographical differences, low representativeness) More than 20 years old. Data from other countries.
Selection of D-R models for risk assessment
Example with “proxy”:
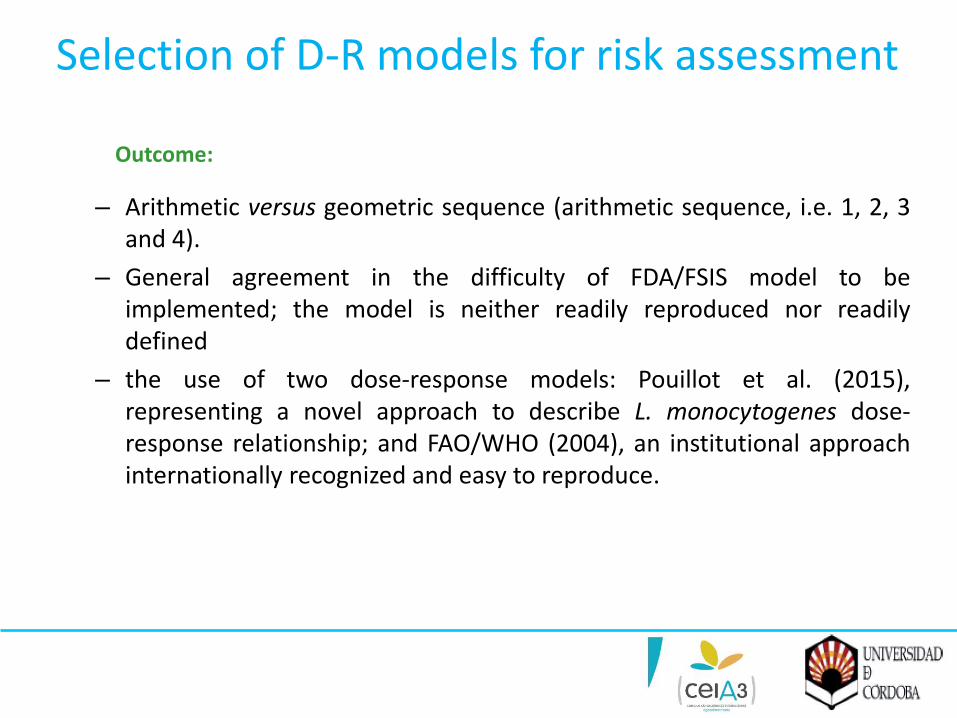
– Arithmetic versus geometric sequence (arithmetic sequence, i.e. 1, 2, 3 and 4).
– General agreement in the difficulty of FDA/FSIS model to be implemented; the model is neither readily reproduced nor readily defined
– the use of two dose-response models: Pouillot et al. (2015), representing a novel approach to describe L. monocytogenes dose-response relationship; and FAO/WHO (2004), an institutional approach internationally recognized and easy to reproduce.
Selection of D-R models for risk assessment
Outcome:

Prevalence
Concentration
Growth model
Final concentration
Final doses
Serving size
Serving number
Zero
Time-temperature
profiles
Prevalent
units (%)
Non-prevalent
units (%)
Dose response models
Probability illness/number of cases
Retailing
Home storage
Consumption
Recontamination
Serving size, frequency & level
of consumption
Products
formulation Storage time &
temperature Transportation
D-R models into risk assessment
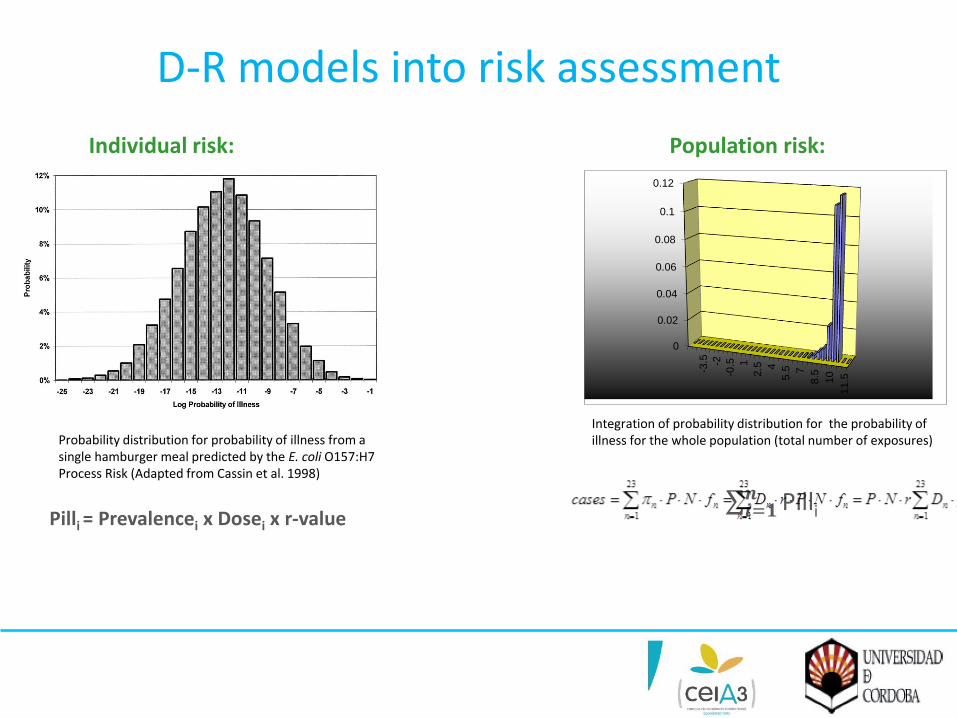
Individual risk:
D-R models into risk assessment
Probability distribution for probability of illness from a single hamburger meal predicted by the E. coli O157:H7 Process Risk (Adapted from Cassin et al. 1998)
Population risk:
0
0.02
0.04
0.06
0.08
0.1
0.12
-3.5 -2
-0.5 1
2.5 4
5.5 7
8.5 10
11.5
Integration of probability distribution for the probability of illness for the whole population (total number of exposures)
Pilli = Prevalencei x Dosei x r-value Pilli𝒏𝒊=𝟏
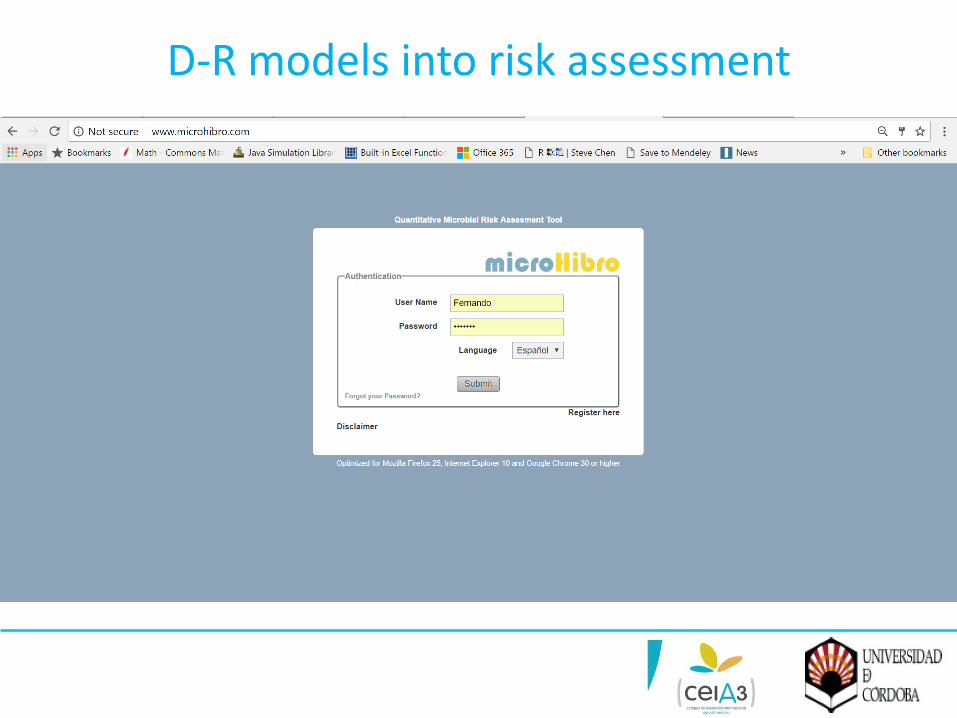
D-R models into risk assessment

D-R models into risk assessment
-Risk model for listeriosis in EU Elderly from Cooked meat-
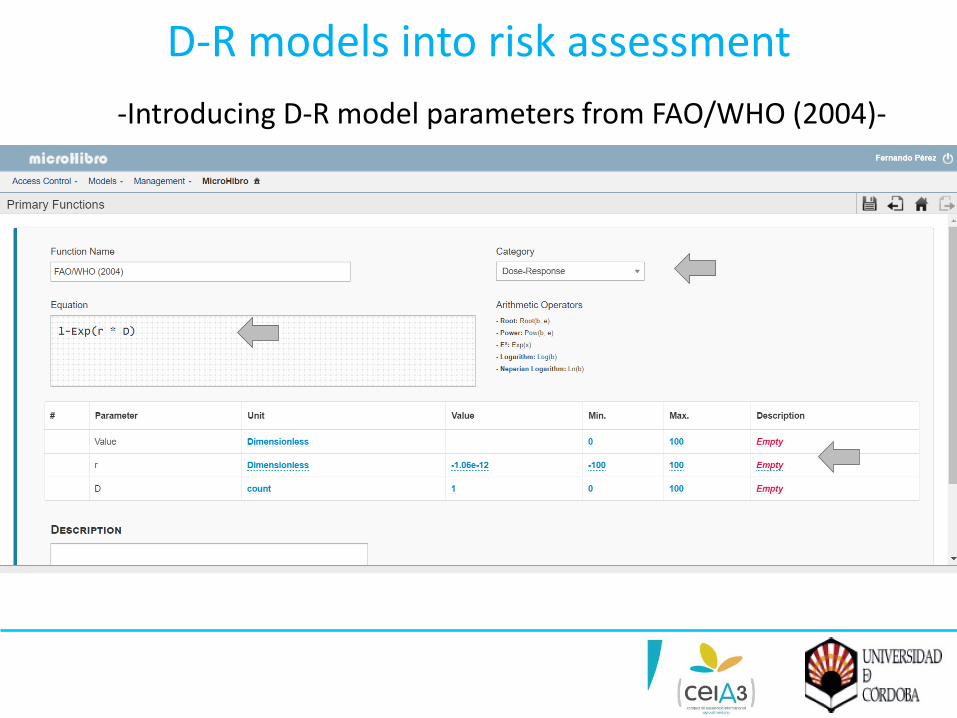
D-R models into risk assessment
-Introducing D-R model parameters from FAO/WHO (2004)-

D-R models into risk assessment -Initial concentration at retail-

D-R models into risk assessment -log increase from retail to home-

D-R models into risk assessment -Serving size-

D-R models into risk assessment -Exposure Assessment- Hazard Characterization-

D-R models into risk assessment
-Simulation output-
Individual risk
Elderly population risk 3.53E09 servings in EU
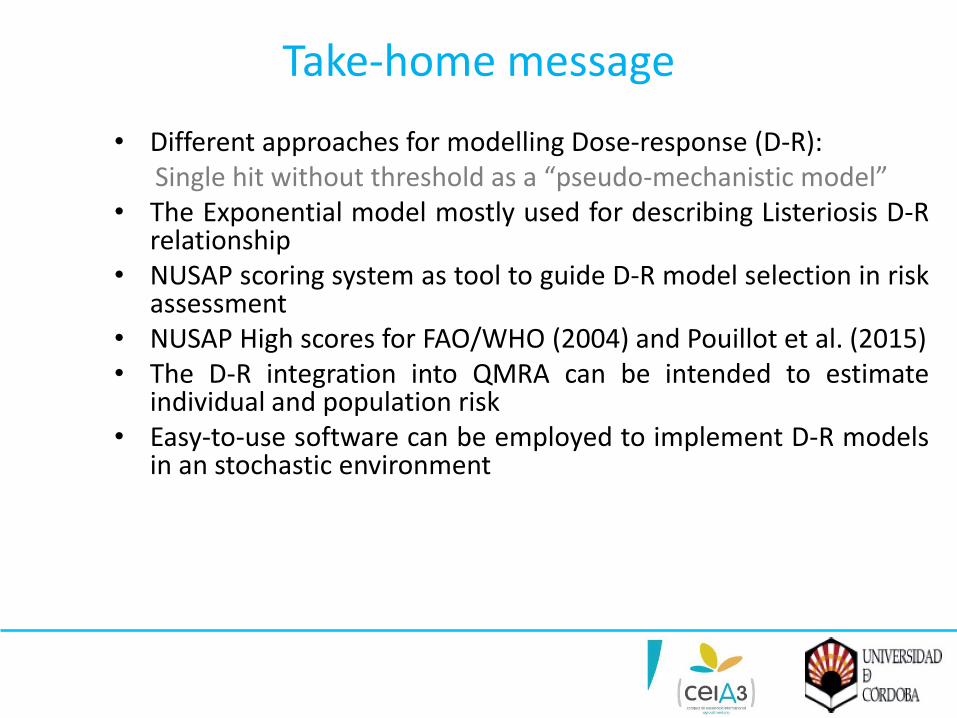
Take-home message
• Different approaches for modelling Dose-response (D-R): Single hit without threshold as a “pseudo-mechanistic model”
• The Exponential model mostly used for describing Listeriosis D-R relationship
• NUSAP scoring system as tool to guide D-R model selection in risk assessment
• NUSAP High scores for FAO/WHO (2004) and Pouillot et al. (2015) • The D-R integration into QMRA can be intended to estimate
individual and population risk • Easy-to-use software can be employed to implement D-R models
in an stochastic environment

Questions

Contact information for presenters
Dr. Régis Pouillot
Prof. Dr. Fernando Pérez Rodríguez
Marcel Zwietering, PhD
Keep your browsers open to complete the survey !!