double diffusion in the mediterranean sea: observation … diffusion in the mediterranean sea:...
TRANSCRIPT
Double diffusion in the Mediterranean Sea: Observation and
parameterization of salt finger convection
Reiner Onken1 and Elena Brambilla2
SACLANT Undersea Research Centre, La Spezia, Italy
Received 15 February 2002; revised 12 June 2002; accepted 14 June 2002; published 24 September 2003.
[1] For the Mediterranean Sea a large set of historical conductivity-temperature-depthcasts has been investigated for the occurrence of double-diffusive vertical mixing due tosalt finger convection. All casts were screened in terms of the density ratio Rr, providingprobability distributions of Rr for the upper 1000-dbar range of eight geographicalareas. Vertical profiles of the salt finger-driven diffusivities kS and kT of salinity andtemperature have been evaluated from the statistics of Rr and a presumed mixing law, andanalytic expressions are provided, which can be used to parameterize the effects of saltfinger mixing in ocean circulation models of the Mediterranean. In most areas thediffusivity profiles exhibit an absolute maximum below the core of the LevantineIntermediate Water. Toward the surface the diffusivities decrease rapidly, while thedownward decay is less pronounced. A different behavior is found in the Tyrrhenian andAdriatic Seas, where the diffusivities remain high also at greater depth. INDEX TERMS:
4243 Oceanography: General: Marginal and semienclosed seas; 4524 Oceanography: Physical: Fine structure
and microstructure; 4568 Oceanography: Physical: Turbulence, diffusion, and mixing processes; KEYWORDS:
Mediterranean, double diffusion, salt fingering, vertical mixing, density ratio
Citation: Onken, R., and E. Brambilla, Double diffusion in the Mediterranean Sea: Observation and parameterization of salt finger
convection, J. Geophys. Res., 108(C9), 8124, doi:10.1029/2002JC001349, 2003.
1. Introduction
[2] Since the early ideas of Stommel et al. [1956] on an‘‘oceanographic curiosity’’, the recognition of the impor-tance of double diffusion for vertical mixing has beensteadily increasing. The research on that topic peaked insome recent investigations, which provided evidence thattaking into account double-diffusive mixing has a signifi-cant impact on the thermohaline circulation of the WorldOcean. In particular, Zhang et al. [1998] found that in asingle-hemispheric general circulation model double diffu-sion reduces the meridional overturning and the polewardheat transport. After further analyses on the same subject,Zhang and Schmitt [2000, p. 1223] concluded ‘‘Theseresults indicate that salt fingers make the thermohalinecirculation more susceptible to transition to the haline mode(haline catastrophe), so should not be ignored in long-termclimate prediction models.’’[3] Consideration of double-diffusive processes in
numerical models means parameterization, usually in termsof the so-called density ratio Rr (see below), and expressingthe ratio of the vertical gradients of buoyancy due to salinityS and temperature T. An inherent shortcoming of suchmodels is that the vertical resolution is rather poor and
gradients are not resolved adequately, hence a directparameterization within the models may provide wronganswers. A potential way out of this dilemma is proposedin the present study: For the Mediterranean Sea, Rr distri-butions are calculated from real T/S casts, and an adequateparameterization of salt finger mixing is derived from thestatistics of the density ratio.[4] The Mediterranean was selected for this study for a
number of reasons.[5] 1. The oceanographic conditions appear to be favor-
able for salt finger convection, because of the warm andsalty Levantine Intermediate Water (LIW) overlying thecolder and fresher deep water. LIW is a convective watermass created in winter by surface buoyancy loss in theeastern Mediterranean. The major formation area is believedto be southeast to Rhodes, from where it is spreading allover the Mediterranean at intermediate depth. The core ofLIW is identified by means of T and S maxima betweenabout 200-m and 500-m depth [Millot, 1999; Ozsoy et al.,1989].[6] 2. Except for Onken and Yuce [2000], all investiga-
tions on double diffusion in the Mediterranean are confinedto the Tyrrhenian Sea [Johannessen and Lee, 1974;Molcardand Williams, 1975; Molcard and Tait, 1978; Zodiatis andGasparini, 1996]. Hence this study will improve knowledgeon this subject for the entire Mediterranean.[7] 3. The Mediterranean is considered as a ‘‘test basin’’
for physical processes [Wu and Haines, 1998], therefore it isof first-order importance to represent processes adequately.[8] 4. During the last decade, there is a pronounced
increase of modeling activity in the Mediterranean. As the
JOURNAL OF GEOPHYSICAL RESEARCH, VOL. 108, NO. C9, 8124, doi:10.1029/2002JC001349, 2003
1Now at GKSS Research Centre, Institute of Coastal Research,Geesthacht, Germany.
2Now at Scripps Institution of Oceanography, La Jolla, California,USA.
Copyright 2003 by the American Geophysical Union.0148-0227/03/2002JC001349$09.00
PBE 25 - 1

trend is directed toward models on thermohaline circulation[Wu and Haines, 1996; Haines and Wu, 1998] and processeson interannual and climatic timescales [Wu and Haines,1998; Castellari et al., 2000; Korres et al., 2000], doublediffusion can no longer be ignored.[9] The paper is organized in the following way: a brief
summary on the theory of double diffusion is presented inSection 2. Section 3 contains a description of the data beingused for this study and a detailed treatise on data processing.In Section 4, the statistics of Rr is calculated for individualgeographical areas of the Mediterranean. Parameterizationsfor the vertical diffusion of temperature and salinity due tosalt finger convection are derived in Section 5, and dis-cussion and conclusions are found in Section 6.
2. Theory
[10] This short section on theory conveys only theknowledge which is mandatory to understand the presentarticle. For more information, the reader is referred to thepublications of Schmitt [1981, 1994, 1998], Zhang et al.[1998], and Zhang and Schmitt [2000].[11] Double diffusion in the ocean is a convective over-
turning motion driven by the difference in magnitudebetween the molecular diffusion coefficients for heat andsalt, kT and kS. The condition for double diffusion is 0 < Rr< kT/kS � 100, where
Rr ¼abTz
Szð1Þ
is the so-called density ratio expressing the buoyancy ratio ofthe vertical gradients of T and S, Tz and Sz. a = �r�1@r/@Tand b = r�1@r/@S are the thermal and haline expansioncoefficients, respectively, and r is density. Rr > 0 implies thatdouble diffusion occurs whenever Tz and Sz have the samesign. The type of convection in the case when both arepositive (warm and salty water overlying colder and fresher),is called ‘‘salt finger convection’’; then Rr > 1, because thenegative buoyancy due the S stratification has to becompensated by positive buoyancy of T. On the contrary,when the T and S gradients are reversed, Rr < 1 and theconvective process is called ‘‘diffusive layering’’. Thepresent study is focusing primarily on salt finger convectionbecause it appears to be the more powerful double-diffusivemixing mechanism. However, for diffusive layering clearevidence was found as well (see below).[12] The growth rate of instabilities driven by salt finger
convection depends critically on Rr. Maximum growthoccurs when Rr is close to 1, and the rate decreases rapidlywith increasing Rr. Apparently, significant growth seems tooccur only when 1 < Rr < 2. Salt finger convection isaccompanied by vertical fluxes of heat and salt; therefore itmakes sense to parameterize their diffusivities in terms ofRr. For KS and KT, the vertical diffusivities of salinity andtemperature, Schmitt [1981] suggested
KS ¼ kS þ K1 and KT ¼ kT þ K1; ð2Þ
where
kS ¼ K*
1þ ðRr=Rr;cÞnand kT ¼ 0:7 � K*
Rr � 1þ ðRr=Rr;cÞn� � ð3Þ
are the diffusivities related to salt finger mixing, K1 is theconstant background diffusitivity due to other diapycnalmixing processes not related to double diffusion, Rr,c is acritical density ratio above which salt finger mixing dropsrapidly, K* is an upper limit for the salt finger diffusivity,and n controls the decay of kS, kT with increasing Rr. Forour calculations of kS and kT, we have used the sameconstants as Zhang et al. [1998]: K* = 1.0 cm2 s�1, Rr,c =1.6 and n = 6. As equation (3) implies differentdiffusivities for salinity and temperature, an importantconsequence is that mixing curves in the T/S diagram arerotated anticlockwise [Schmitt, 1981]. It should be notedthat equation (3) is closer to hypothesis than to provenfact, but it is felt not to be far wrong (Schmitt, personalcommunication, 2001).[13] In order to obtain an estimate of the magnitude of
double-diffusive mixing for a given ocean basin, one mightbe tempted to calculate Rr simply from climatologicaldistributions of T and S. This however, would provide afalse answer, because climatologies are the product ofaveraging procedures in space and time, which weakenthe vertical gradients necessary to drive double diffusion.An estimate of the vertical length scales associated withdouble-diffusive mixing can be obtained from a scalinganalysis of the diffusion equation: using kS = 1 cm2 s�1 [cf.Zhang et al., 1998] and an e-folding scale for salt fingers of10 s (order of the Brunt-Vaisala frequency [cf. Schmitt,1998], the length scale is of the order of centimeters. Thevertical resolution of climatologies is 10 m at best, i.e., threeorders of magnitudes larger. Therefore the method appliedhere is to calculate first of all Rr from individual T and Sprofiles, and then making a statistics of the distribution of Rrfor the basin.
3. Data Processing
[14] The analyses below are based on 10797 CTD(conductivity-temperature-depth) casts originating fromtwo sources: 9666 were downloaded from the MODB(Mediterranean Ocean Data Base, see Acknowledgments)website, and another 1131 casts were contributed bythe NATO SACLANT Undersea Research Centre(SACLANTCEN) in La Spezia (Italy). The latter werecollected by military vessels in the period 1996–2000,while the MODB data cover the range 1970–1990. Thetwo data sets were merged in order to provide optimalcoverage in space and time and to improve the signifi-cance of results.[15] Before calculating Rr, all casts had to undergo
several processing stages.[16] 1. Data cycles containing dummies were removed.[17] 2. Casts were pressure-monotonized, because the
pressure of some MODB casts was not monotonic.[18] 3. The resolution of MODB temperature and salinity
is 10�3. Mainly below the thermocline, this creates abso-lutely homogeneous layers both in T and S causing unde-fined Rr if Sz = 0 or Rr = 0 if Tz = 0. Another consequence isthat often T and S change simultaneously by 10�3 at the topand bottom of the layers, leading to frequent occurrence ofRr at multiples of a/b within those layers. As both of theseeffects are unrealistic, an uncorrelated random noise y 2[�10�4 10�4] was added to the original T and S. This is not
PBE 25 - 2 ONKEN AND BRAMBILLA: DOUBLE DIFFUSION IN THE MEDITERRANEAN

critical, because the noise amplitude is equivalent to thereproducibility of most common CTD probes. Althoughthe resolution of most SACLANTCEN casts was higher, thesame procedure was also applied to those in order to create ahomogeneous equal quality data set.[19] 4. T and S were vertically linearly interpolated on
1-dbar intervals. This was necessary because a significantamount of MODB casts was spaced at 5 dbar.[20] 5. Casts containing less than 11 data cycles were
eliminated and T and S were smoothed vertically applyingan 11-point moving average. This removed ambiguities ofvertical derivatives and also compensated for artefactsintroduced by the addition of random noise.[21] 6. Short casts (maximum pressure less than 50 dbar)
were discarded to reduce the amount of data. This is notcritical, because the near surface layers are subject toseasonal variability, and double diffusion is not expectedto play a significant role there. Together with the elimina-tion of casts mentioned in the previous item, the totalnumber of casts being subject to further analyses decreasedto 8255.[22] From precursor studies [Brambilla, 2000], it had
turned out that the structures of Rr exhibit large regionaldifferences. Therefore the CTD data set was separated insubsets representing approximately the eight major geo-graphical areas of the Mediterranean, i.e., the Levantine,Aegean, Adriatic, Ionian, and Tyrrhenian Seas, the Algerianand Liguro-Provencal basin, and the Sicily Channel (in thefollowing, the acronyms LEVANTINE, AEGEAN, ADRI-ATIC, IONIAN, TYRRHENIAN, ALGERIAN, PROVEN-CAL, and SICILY will be used instead). The areas, togetherwith the position of CTD casts, are shown in Figure 1.Although the amount of SACLANTCEN casts representsonly 14% of the final data set (see Table 1), it is evident thatthey provide significant information in IONIAN, ADRI-ATIC, TYRRHENIAN, and SICILY. Unfortunately, there
are still white spots left, however, the analysis below willshow that this is tolerable.
4. Density Ratio in IndividualGeographical Areas
[23] From individual CTD casts, the density ratio profilewas evaluated using the finite difference equivalent ofequation (1)
Rr pð Þ ¼ rS;T ;paS;T ;p
b*�T
�S; ð4Þ
where S, T, p are mean temperature, salinity and pressurewithin each 1-dbar pressure interval, and �T, �S are thevertical changes of T and S, respectively. For the thermalexpansion coefficient aS,T,p, it is necessary to take accountof the S, T, p dependency, because for typical conditions ofthe Mediterranean, a exhibits variations of up to 100%. Bycontrast, variations of b* = @r/@S are less than 5%, henceassuming a constant b* = 0.77 is a good approximation.[24] Application of equation (4) yields density ratios in
the range �1 Rr +1, and undefined Rr if �S = 0. In
Figure 1. Geographical areas and CTD casts of the final data set. Positions of MODB casts are markedby dots; SACLANTCEN casts are marked by open circles.
Table 1. Final Number of CTD Casts Contributed by MODB and
SACLANTCEN
Area MODB SACLANTCEN Total
Liguro-Provencal Basin 3180 0 3180Algerian basin 733 29 762Tyrrhenian Sea 847 21 868Sicily Channel 529 185 714Adriatic Sea 668 120 788Ionian Sea 710 629 1339Aegean Sea 85 0 85Levantine Sea 372 147 519Total 6915 1131 8255
ONKEN AND BRAMBILLA: DOUBLE DIFFUSION IN THE MEDITERRANEAN PBE 25 - 3

order to identify depth ranges critical for salt finger con-vection in individual areas, equation (4) was evaluated foreach cast within that area, and then for every 1-dbarpressure interval, the number of events Ncrit where 1 Rr 3, was summed up and divided by the total number ofcasts N containing that pressure interval. The result is adistribution
g3 pð Þ ¼ Ncrit pð ÞN pð Þ ; ð5Þ
which describes the probability that for a given pressure pthe density ratio lies in the critical range making saltfingering likely.[25] Figure 2 shows g3(p), �3(p) and N(p) for the upper
1000 dbar of each geographical area. �3 is the verticallysmoothed g3 after application of a 51-point moving average(50-dbar window width). This smoothing appeared to benecessary, as g3 becomes rather noisy when N is less thanabout 100. Except for the Adriatic, the �3 graphs lookqualitatively similar for all areas. There is an absolutemaximum between about 400 and 600 dbar. The value ofthe maximum is highest in LEVANTINE (�87), and then ittends to decrease to the west: 70 in AEGEAN, IONIAN57, 49 in SICILY, 44 in TYRRHENIAN, and 32 in
PROVENCAL. Against this tendency is ALGERIAN; here,the maximum value is 56, higher than in all other areas ofthe western Mediterranean and even above the numbers ofthe SICILY. Also the depth of the maximum exhibits azonal tendency; in the eastern Mediterranean it is generallyshallower than 500 dbar, while in the west it attains valuesgreater than 500 dbar. Below the maximum, �3 decays inall areas, but the decay rate is higher in the easternMediterranean and in ALGERIAN than in PROVENCALand TYRRHENIAN. Most graphs exhibit a relativeminimum between about 50 and 200 dbar. None of thefeatures described so far is present in ADRIATIC. Hereinstead, there is a minimum of �3 right at the surface, asecond minimum at about 200 dbar, and a maximum ofslightly more than 50% in between. Below the secondminimum, �3 increases rapidly within about 50 dbar andthen further increases at a slower rate downward. However,because of only a few available samples, the structuresbelow 250 dbar may not be significant.[26] As the density ratio is a function of stratification
only, the previous findings are interpreted in terms of meanhydrographic properties in the following. For that purpose,annual mean T and S profiles have been evaluated for theeight geographical areas from the MODB-MED2 climatol-ogy [Brasseur et al., 1996] being displayed in Figure 3. The
Figure 2. Probability distribution of the density ratio being in the critical range 1 < Rr < 3 for individualareas: g3 (thin line), probability (%); �3 (bold), same as g3 but vertically smoothed; and N (gray shaded),number of available samples.
PBE 25 - 4 ONKEN AND BRAMBILLA: DOUBLE DIFFUSION IN THE MEDITERRANEAN

�3 maximum of Figure 2 exhibits a close relationship to theS maximum of the LIW [cf. Wust, 1961; Hecht et al., 1998;Millot, 1999]. In the western Mediterranean and in SICILY,it lies about 100 dbar below the S maxima, while inLEVANTINE, IONIAN and AEGEAN, the pressure differ-ence is about 200–350 dbar. Worth mentioning are also thecorresponding T and S gradients being larger in the latterthree areas. Vertical changes of �3 may be explained interms of changes of Rr, depending on Tzz, Szz, @a/@T,@a/@S, @a/@p, and the corresponding derivatives of b andr. While the latter two and @a/@S appear to be relativelysmall, Tzz, Szz, @a/@T and @a/@p are certainly important. Wewon’t stress this too much in this place, but it is noticeablethat below the �3 maximum both the T and S profiles arepositively curved in LEVANTINE, IONIAN and AEGEAN,while the curvature is negative or close to zero in thewestern Mediterranean. These differences in curvaturemay help to explain area-to-area differences of the �3 decaywith depth. Concerning the relative minimum of �3 between50 and 200 dbar, Figure 3 reveals that within this pressurerange the gradients of T and S are opposed to each other,making salt fingers extremely unlikely. For ADRIATIC, it israther difficult to interpret the �3 profile in terms ofclimatological T and S. This is already the case for the �3
maximum at �120 dbar, which is not supported by themean T and S structure. As the MODB climatology is
largely based on bathythermograph data, we recalculatedmean T and S profiles only from those casts contributing tothe �3 distribution. This indeed facilitates interpretation,both the �3 maximum at 120 dbar and the steady increasetoward the bottom below about 300 dbar are supported bythe corresponding T and S structures.
5. Parameterization
[27] The diffusivities kS and kT are expected to be func-tions of Rr for salt fingers. Therefore vertical profiles of thediffusivities cannot be derived from the g3 or �3 distribu-tions as displayed in Figure 2, because Rr is not resolved.Instead, in order to proceed toward a parameterization of kSand kT, the Rr space between 1 and 5 was separated in 40constant intervals �Rr = 0.1, and the probability g wasevaluated for each interval. Again, g was smoothed verti-cally by a running mean over 50 dbar producing �. Theresult (Figure 4) shows that maximum � exceeding 10% isfound in LEVANTINE for 1.1 < Rr < 1.5 between 410 and570 dbar, and in TYRRHENIAN between 930 and 980 dbarat Rr = 1.05. In IONIAN, the maximum of 9–10% lies inthe range 1.1 < Rr < 1.3 and is located 460–590 dbar.Further high percentage values of 8–9% for Rr = 1.05 arefound in ALGERIAN at about 700 dbar. In the other areas,the maximum � values are generally smaller at 6–7% in
Figure 3. Annual mean distribution of MODB temperature T (dashed) and salinity S (solid) forindividual areas. The gray bar indicates the vertical position of the �3 maximum (see Figure 2).
ONKEN AND BRAMBILLA: DOUBLE DIFFUSION IN THE MEDITERRANEAN PBE 25 - 5

Figure
4.
Probabilitydistributionof�(R
r,p)forindividualareas.�has
beenevaluated
for1<=Rr<=5;only
therange1
<=Rr<=3isshown.
PBE 25 - 6 ONKEN AND BRAMBILLA: DOUBLE DIFFUSION IN THE MEDITERRANEAN
Figure
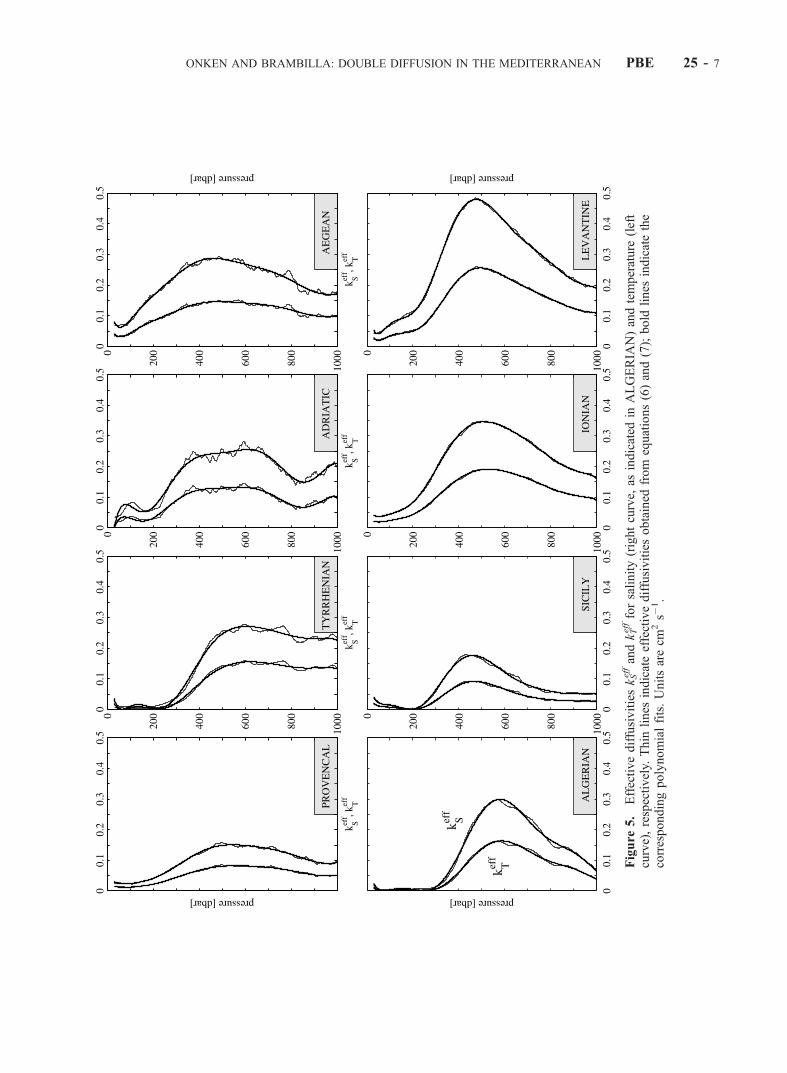
5.
Effectivediffusivitiesk Seffandk Teffforsalinity(rightcurve,
asindicated
inALGERIA
N)andtemperature
(left
curve),respectively.
Thin
lines
indicateeffectivediffusivitiesobtained
from
equations(6)and(7);bold
lines
indicatethe
correspondingpolynomialfits.Unitsarecm
2s�
1.
ONKEN AND BRAMBILLA: DOUBLE DIFFUSION IN THE MEDITERRANEAN PBE 25 - 7

ADRIATIC and AEGEAN, and 3–4% in PROVENCALand SICILY.[28] Concerning the � contours, AEGEAN, IONIAN and
LEVANTINE look qualitatively similar which is pointing toa common structure and history of the water masses: theshape of the contours is ellipse-like with the angle ofthe major semi-axis being about 40–70�, and for Rr =1.05, the � maximum lies always below 600 dbar. InSICILY, however, although this area is generally consideredto be part of the eastern Mediterranean, the angle is less than20� and the � maximum is found at about 500 dbar for Rr =1.05. Apparently, the LIW vertical structure is different. Apossible explanation is that while progressing from theIonian Sea to the Sicily Channel, the structure of LIW ismodified when it spills over the eastern sill of the Channel,the depth of which is less than 500 m (according toFrassetto [1972], the sill depth is 560 m at about 15 E,but this could not be verified from high-resolution seacharts). A similar explanation may also hold for the �distribution in TYRRHENIAN, which is fundamentallydifferent from that in SICILY. Recent investigations[Sparnocchia et al., 1999] have shown that LIW from theSicily Channel spills over the western sill (sill depth 430 m)and then cascades down into the Tyrrhenian basin to 1000-mdepth or more. This process is certainly accompanied bytremendous mixing, leading to modifications of the verticalstructure of water masses. In ALGERIAN, the � distribu-tion exhibits elements both from SICILY and TYRRHE-NIAN. This is on the one hand the rather small angle of the� contours being characteristic for Sicily Channel LIW, andon the other hand the deep reaching � maximum at Rr =1.05. This makes sense, as the Algerian basin LIW mayoriginate partly directly from the Channel, and partly fromthe Tyrrhenian [Astraldi et al., 2002; Onken and Sellschopp,2001]. By contrast, the structures in PROVENCAL are
more similar to TYRRHENIAN, although at the LIWlevel there is no direct link between these areas, exceptfor the Corsica Channel. However, the LIW throughflow isassumed to be rather weak [Astraldi et al., 1999]. It isconjectured that the Liguro-Provencal basin LIW stems onlyfrom the Tyrrhenian via the Sardinia Channel, and that theLIW originating directly from the Sicily Channel remainswithin the Algerian basin.[29] For each pressure level p, the diffusivities kS and kT
were first evaluated for each interval �Rr accordingto equation (3), then multiplied by the respective value of�( p, Rr) and finally summed up over all �Rr intervals. Thisprovides effective diffusivities for salt and temperature,
keffS ¼
X40i¼1
kS p;Rr;i� �
� � p;Rr;i� �
; ð6Þ
keffT ¼
X40i¼1
kT p;Rr;i� �
� � p;Rr;i� �
; ð7Þ
which may be substituted for kS and kT in equation (3). Theresult of this operation is shown in Figure 5.[30] At the first glance, the graphs of Figure 5 are looking
rather similar to the �3 curves of Figure 2, and one might betempted to assume that the �3 distribution, multiplied bysome empirical constant, would be already a good repre-sentation of the diffusion coefficients. However, a closeinspection of the figures reveals that this is not true. Forexample, the maxima of the coefficients are at differentdepths than the corresponding �3 maxima. The latter, for thebottom row of Figure 2, were approximately 380 (LEVAN-TINE), 460 (IONIAN), 400 (SICILY), and 540 (ALGE-RIAN) dbar, while the maximum values of the diffusioncoefficients are found at 470, 540, 430, and 570 dbar. Alsothe area-to-area ratio of the maxima of the coefficients aredifferent from the corresponding �3 ratios. Further differ-ences are illustrated by ADRIATIC: while �3 increasesalmost continuously below 300 dbar, the diffusion coeffi-cients increase only in the 300–600 dbar range, and thendecrease below. In addition, the well pronounced shallow �3
maximum is not mirrored by the diffusion coefficient.[31] The major objective of this study is to provide a
parameterization of salt finger mixing for use in numericalmodels. Therefore we tried to find analytic expressionsfor the vertical distributions of kS
eff and kTeff which were
obtained by tenth-order polynomial fits shown in Figure 5as well. The corresponding coefficients of the polynomialsare listed in the Appendix A. Because of slight deviationsnear the sea surface in some geographical areas, it isrecommended to apply the polynomials only for pressuresgreater than 50 dbar.[32] The polynomial fits are certainly useful for repre-
senting salt finger convection in individual geographicalareas, but large-scale models it would be desirable to havea unique formula for the entire Mediterranean. One methodto obtain such formula would be to repeat the abovecalculations without separating into the eight areas, how-ever, the answer would be biased because of the unevendistribution of CTD casts. Therefore we averaged the eightpolynomials obtained so far, and weighted the contribution
Figure 6. Effective diffusivities kSeffand kT
efffor salinity and
temperature, respectively, for the entire Mediterranean. Thecurves were obtained by an area-weighted mean of thepolynomials displayed in Figure 5.
PBE 25 - 8 ONKEN AND BRAMBILLA: DOUBLE DIFFUSION IN THE MEDITERRANEAN

of each geographical area by normalizing it by the area ofthe entire Mediterranean (for the weighting coefficients seethe Appendix). The result in Figure 6 is qualitativelysimilar to the graphs of most areas displayed in Figure 5,but application will lead to an underrepresentation ofdouble diffusion in LEVANTINE and to overestimates inSICILY and PROVENCAL.
6. Discussion and Conclusions
[33] The motivation for this study is to provide a param-eterization of salt finger-driven vertical mixing in theMediterranean for use in ocean circulation models. Theoptimal solution would be, of course, to evaluate the mixingcoefficients directly within the models from T and Sdistributions. However, this would require the verticalresolution to be sufficiently high to resolve the verticalgradients, which is not the case in today’s models. More-over, the sensitivity experiments of Zhang et. al. [1998]have shown that the distribution of water masses is directlyaffected by the vertical resolution, yielding higher diffusiv-ities with increasing resolution.[34] A large set of historical CTD data complemented by
recent casts was analyzed by statistical methods in termsof the density ratio Rr. The Mediterranean was separatedin eight geographical areas, and for each of those thedepth-dependent probability distribution of Rr was evalu-ated. Finally, diffusivity profiles of temperature and salin-ity were obtained, representing the vertical structure ofdouble-diffusive mixing of heat and salt due to salt fingerconvection.[35] A major criticism may arise from the uneven distri-
bution of the data in space. While for six areas the amountof casts lies between 519 and 1339 (see Table 1), there areonly 85 in the Aegean Sea and 3180 in the Liguro-Provencal basin on the high end. Surprisingly, these differ-ences apparently have only a minor impact on g3 (Figure 2):except for the Adriatic and the Aegean, the variance of g3 israther small on the order of 5% or less. For the Adriatic, thelarge variance is certainly due to the low number of castsextending beyond 200 dbar, making the results ratherquestionable. By contrast, the g3 distribution for the Aegeanappears to be trustworthy, because it lies within the trend ofthe neighboring Levantine and Ionian Seas. Moreover, for aspecific depth of a geographic area, about 100 samplesseem to be sufficient to obtain a reliable estimate on g3.This fairly small number is indicative for the temporalstability and spatial homogeneity of the water masses inthe Mediterranean and must not be applied to other oceanareas.[36] The distribution of data within individual areas is
largely biased: most casts of the Algerian basin are locatedin the Alboran Sea (Figure 1), the Catalan and LigurianSeas are overrepresented in the Liguro-Provencal basin,and also in the other six areas the distribution is inhomo-geneous. While the underrepresentation of subareas wouldlead to a reduction of the g3 variance for a specificgeographic area, one would in turn expect an increase ofvariance or a multimodal structure in the probabilitydistributions, if casts are accumulated in several subareasas it is the case in the Algerian and Liguro-Provencalbasin. However, nothing like that is evident from Figures 2
or 4 providing further indication for the uniformity ofwater masses within an area.[37] In the MODB historical data set, some months were
more intensely sampled than others [Brasseur et al., 1996],
Figure 7. Salt finger parameters in the Ionian Sea (left)before and (right) after the deepwater transient. (top)Number of available samples N (gray shaded), g3 (thinline), and �3 (bold); (center) �(Rr, p); and (bottom) effectivediffusivities kS
eff and kTeff.
ONKEN AND BRAMBILLA: DOUBLE DIFFUSION IN THE MEDITERRANEAN PBE 25 - 9

and also the majority of the SACLANTCEN casts werecollected in summer. Our analyses did not take account ofthe seasonal variability, because for some geographical areasthere are almost no data available for specific seasons [cf.Brasseur et al., 1996, Figures 8 and 9]. On the other hand,the study of Brambilla [2000] based on the MODB-MED2climatology clearly demonstrates that the stratificationbelow 200 dbar does not exhibit any significant seasonalsignal, except for the Adriatic. In addition, Brambilla [2000]has shown that the vertical structure of the density ratiobelow that depth is rather stable through the course of theyear. Although the latter study is based on climatologicaldata, which are considered to be inadequate for analyses ondouble-diffusive mixing (see section 1 and below), thestability of the density ratio nevertheless indicates the non-seasonality of temperature and salinity vertical gradients.
[38] It is well known that the structure of intermediate anddeep waters in the eastern Mediterranean were subject to amajor change in the early 1990s, referred to as the ‘‘largedeep water transient in the eastern Mediterranean’’ [Klein etal., 1999; Lascaratos et al., 1999]. It is not the intent of thispaper to investigate the interannual variability of Mediter-ranean water masses, but the bimodal structure of our dataset offers the unique chance to investigate the impact of thetransient on those parameters connected to salt fingerconvection. The Ionian Sea was covered rather well byMODB casts 1970–1990 and by those of SACLANTCEN1996–2000, hence before and after the transient whichoccurred in the period of time 1989–1995. Both data setswere analyzed separately and the result is displayed inFigure 7. The top panel of that figure shows that thetransient caused an increase of �3 in the 300–600 dbar
Table A1. Area Numbers j, Area Weighting Coefficients wj, and Polynomial Coefficients aj,n, bj,n of the Eight Geographical Areas
PROVENCAL TYRRHENIAN ADRIATIC AEGEAN
j 1 2 3 4wj 0.101 0.078 0.053 0.071aj,0 5.3469994 � 10�02 2.0688885 � 10�01 �2.1181992 � 10�01 1.8098960 � 10�01
aj,1 �1.2427796 � 10�03 �9.5471520 � 10�03 1.0113580 � 10�02 �5.5477819 � 10�03
aj,2 1.9799164 � 10�05 1.6672415 � 10�04 �1.2730918 � 10�04 9.2406107 � 10�05
aj,3 �1.6373977 � 10�07 �1.4262891 � 10�06 7.0302304 � 10�07 �7.0916588 � 10�07
aj,4 8.0859083 � 10�10 6.8019646 � 10�09 �1.6732827 � 10�09 3.2090294 � 10�09
aj,5 �2.3654254 � 10�12 �1.9445384 � 10�11 4.7398900 � 10�13 �9.0541437 � 10�12
aj,6 4.2009333 � 10�15 3.4838659 � 10�14 6.3376842 � 10�15 1.6259386 � 10�14
aj,7 �4.5695635 � 10�18 �3.9571225 � 10�17 �1.4972942 � 10�17 �1.8546273 � 10�17
aj,8 2.9588187 � 10�21 2.7733562 � 10�20 1.5699777 � 10�20 1.2992249 � 10�20
aj,9 �1.0378456 � 10�24 �1.0956314 � 10�23 �8.1512281 � 10�24 �5.0919951 � 10�24
aj,10 1.4971397 � 10�28 1.8678690 � 10�27 1.7005983 � 10�27 8.5404519 � 10�28
bj,0 2.6549872 � 10�02 1.1513987 � 10�01 �1.0652454 � 10�01 9.8431358 � 10�02
bj,1 �5.9930292 � 10�04 �5.3310447 � 10�03 5.2403113 � 10�03 �3.1790552 � 10�03
bj,2 9.6438025 � 10�06 9.2799539 � 10�05 �6.9446082 � 10�05 5.3461121 � 10�05
bj,3 �8.0676020 � 10�08 �7.9118269 � 10�07 4.1002328 � 10�07 �4.1672748 � 10�07
bj,4 4.0578546 � 10�10 3.7656037 � 10�09 1.1264000 � 10�09 1.9035112 � 10�09
bj,5 �1.2088800 � 10�12 �1.0768769 � 10�11 1.0658390 � 10�12 �5.4084741 � 10�12
bj,6 2.1867920 � 10�15 1.9348868 � 10�14 1.7141509 � 10�15 9.7853749 � 10�15
bj,7 �2.4261318 � 10�18 �2.2089780 � 10�17 �5.9061575 � 10�18 �1.1259933 � 10�17
bj,8 1.6062952 � 10�21 1.5588327 � 10�20 6.8216576 � 10�21 7.9678096 � 10�21
bj,9 �5.7851639 � 10�25 �6.2083298 � 10�24 �3.7119184 � 10�24 �3.1580399 � 10�24
bj,10 8.6311194 � 10�29 1.0678127 � 10�27 7.9722125 � 10�28 5.3619638 � 10�28
ALGERIAN SICILY IONIAN LEVANTINE
j 5 6 7 8wj 0.149 0.084 0.213 0.251aj,0 9.1914680 � 10�02 1.3407735 � 10�01 7.9625805 � 10�02 1.7818930 � 10�01
aj,1 �3.3804571 � 10�03 �5.4387959 � 10�03 �2.4169075 � 10�03 �7.9694810 � 10�03
aj,2 4.2998320 � 10�05 1.0152784 � 10�04 5.0652408 � 10�05 1.6644225 � 10�04
aj,3 �2.1409606 � 10�07 �9.7374477 � 10�07 �5.0948889 � 10�07 �1.5987079 � 10�06
aj,4 2.0547814 � 10�10 5.1627667 � 10�09 2.8842980 � 10�09 8.4022042 � 10�09
aj,5 1.8988225 � 10�12 �1.6022108 � 10�11 �9.4569260 � 10�12 �2.5831939 � 10�11
aj,6 �7.7733057 � 10�15 3.0464045 � 10�14 1.8823423 � 10�14 4.8660900 � 10�14
aj,7 1.3372643 � 10�17 �3.6060410 � 10�17 �2.3206527 � 10�17 �5.7047961 � 10�17
aj,8 �1.2128360 � 10�20 2.5973673 � 10�20 1.7356314 � 10�20 4.0664520 � 10�20
aj,9 5.6905043 � 10�24 �1.0436160 � 10�23 �7.2236965 � 10�24 �1.6150778 � 10�23
aj,10 �1.0913305 � 10�27 1.7957662 � 10�27 1.2844527 � 10�27 2.7432996 � 10�27
bj,0 4.0589856 � 10�02 7.2210975 � 10�02 4.5727099 � 10�02 1.0489379 � 10�01
bj,1 �1.4061697 � 10�03 �2.9563278 � 10�03 �1.4711294 � 10�03 �4.7346190 � 10�03
bj,2 1.5892738 � 10�05 5.4435052 � 10�05 2.9854887 � 10�05 9.5006529 � 10�05
bj,3 �5.2544544 � 10�08 �5.1143711 � 10�07 �2.8872644 � 10�07 �8.8697826 � 10�07
bj,4 �1.9248087 � 10�10 2.6569195 � 10�09 1.5744375 � 10�09 4.5363946 � 10�09
bj,5 1.9000565 � 10�12 �8.0988311 � 10�12 �5.0189893 � 10�12 �1.3611352 � 10�11
bj,6 �5.7690624 � 10�15 1.5160541 � 10�14 9.7926560 � 10�15 2.5099044 � 10�14
bj,7 9.0000160 � 10�18 �1.7703120 � 10�17 �1.1909966 � 10�17 �2.8877473 � 10�17
bj,8 �7.7857774 � 10�21 1.2600830 � 10�20 8.8301663 � 10�21 2.0242902 � 10�20
bj,9 3.5560055 � 10�24 �5.0110490 � 10�24 �3.6565498 � 10�24 �7.9195962 � 10�24
bj,10 �6.7070220 � 10�28 8.5462254 � 10�28 6.4863430 � 10�28 1.3267911 � 10�27
PBE 25 - 10 ONKEN AND BRAMBILLA: DOUBLE DIFFUSION IN THE MEDITERRANEAN

range, making salt fingering more likely. Below, �3
decreased. From the center panel, it emerges that the �3
increase is due to a higher probability of Rr being close to 1.In terms of the diffusion coefficients (bottom panel), thetransient apparently has pushed the maximum toward thesea surface, enhanced the maximum diffusivity, and dimin-ished the diffusivity below 700 dbar.[39] So far, this study has dealt only with double-diffusive
mixing due to salt finger convection. Applying the samemethods, we also scanned the data set for diffusive layering.Surprisingly, large regions of the Mediterranean appear tobe favorable for double-diffusive layering as well. In mostregions, the probability distributions for 0 < Rr < 1 exhibit amaximum between 150-m and 300-m depth; below, apronounced minimum is found in the 300 to 500-m depthrange, and the probability increases again toward thebottom. As the parameterized diffusivities due to diffusivelayering are supposed to be lower than those for salt fingerconvection [cf. Kelley, 1984, 1990], we conjecture thatdiffusive layering is only of secondary importance. How-ever, this requires further investigations.[40] Most ocean circulation models parameterize vertical
diffusion of temperature and salinity in terms of a constantcoefficient, which has the same value for both tracers.Sometimes [e.g., Wu and Haines, 1998] the coefficient isdepth dependent in order to take account of the differentintensity of turbulent mixing above the seasonal thermo-cline and below, while in other models [e.g., Pinardi et al.,1997] it is constant throughout the water column. For theMediterranean, our results offer for the first time thepossibility to include the effects of salt finger convectionin such models. On the one hand, this makes computationsmore expensive (about 10% increase of computation time[cf. Zhang et al., 1998] because the mixing of salinity andtemperature have to be evaluated separately because of thedifferent coefficients. On the other hand, this is a chance toobtain more realistic model results due to a more adequaterepresentation of three-dimensional turbulence effects. Weconjecture that the consequences are significant: for thedepth range below the seasonal thermocline, we obtainedsalinity diffusion coefficients of up to about 0.5 cm2 s�1 inthe Levantine Sea and up to 0.3 cm2 s�1 in the other areas.This is several magnitudes higher than the diffusivities usedby Wu and Haines [1998].
Appendix A: Fitting Curves to the VerticalDistribution of Diffusion Coefficients
[41] For each geographical area j, tenth-order polynomialfits
Pj;S pð Þ ¼X10m¼0
aj;mpm
and
Pj;T pð Þ ¼X10m¼0
bj;mpm
have been applied to the kSeff and kT
eff distributions (the thinlines in Figure 5), where p is pressure in dbar. Thecoefficients aj,m and bj,m are listed in Table A1.
[42] For the entire Mediterranean, the correspondingpolynomials are simply the area-weighted mean of thepolynomials for the geographical areas:
PMed;S pð Þ ¼X8j¼1
wjPj;S ¼X8j¼1
wj
X10m¼0
aj;mpm
!
¼X8j¼1
X10m¼0
wjaj;mpm ¼
X10m¼0
X8j¼1
wjaj;m
!pm
for the diffusion of salinity and
PMed;T pð Þ ¼X8j¼1
wjPj;T ¼X8j¼1
wj
X10m¼0
bj;mpm
!
¼X8j¼1
X10m¼0
wjbj;mpm ¼
X10m¼0
X8j¼1
wjbj;m
!pm
for temperature. For convenience, we have evaluated thecoefficients
cm ¼X8j¼1
wjaj;m and dm ¼X8j¼1
wjbj;m:
They are listed in Table A2.[43] All calculations have been carried out with MAT-
LAB 6.0 software on a 64-bit Compaq AlphaStationXP1000.
[44] Acknowledgments. This study is largely based on historical andclimatological data, which where downloaded from the MODB websitehttp://modb.oce.ulg.ac.be/. MODB was funded by the European Commis-sion as part of the MAST-II program. Further CTD data were contributed bythe military research and survey vessels Alliance (NATO), D’Entrecasteaux(French Navy), Roebuck (Royal Navy), Pathfinder (United States Navy),Planet (German Ministry of Defense), and Pytheas (Hellenic Navy).
Table A2. Coefficients cm, dm for the Evaluation of Polynomials
Describing the Mean Distribution of Diffusivities in the
Mediterranean
Coefficient Value
c0 1.098050 � 10�01
c1 �4.203759 � 10�03
c2 8.231870 � 10�05
c3 �7.643705 � 10�07
c4 3.938975 � 10�09
c5 �1.193445 � 10�11
c6 2.225606 � 10�14
c7 �2.595701 � 10�17
c8 1.849495 � 10�20
c9 �7.374206 � 10�24
c10 1.261977 � 10�27
d0 6.118710 � 10�02
d1 �2.383918 � 10�03
d2 4.547378 � 10�05
d3 �4.126371 � 10�07
d4 2.078643 � 10�09
d5 �6.172261 � 10�12
d6 1.131528 � 10�14
d7 �1.301165 � 10�17
d8 9.165570 � 10�21
d9 �3.621379 � 10�24
d10 6.153668 � 10�28
ONKEN AND BRAMBILLA: DOUBLE DIFFUSION IN THE MEDITERRANEAN PBE 25 - 11

ReferencesAstraldi, M., S. Balopoulos, J. Candela, J. Font, M. Gacic, G. P. Gasparini,B. Manca, A. Theocharis, and J. Tintore, The role of straits and channelsin understanding the characteristics of Mediterranean circulation, Prog.Oceanogr., 44, 65–108, 1999.
Astraldi, M., G. P. Gasparini, A. Vetrano, and S. Vignudelli, Hydrographiccharacteristics and interannual variability of water masses in the centralMediterranean region: A sensitivity test for the long-term changes in theMediterranean, Deep Sea Res., Part I, 49, 661–680, 2002.
Brambilla, E., Doppio flusso diffusivo di temperatura e salinita nel marMediterraneo, Ph.D. thesis, 104 pp., Univ. ’a degli Stud. di Milano,Milano, Italy, 2000.
Brasseur, P., J. M. Beckers, J. M. Brankart, and R. Schoenauen, Seasonaltemperature and salinity fields in the Mediterranean Sea: Climatologicalanalyses of a historical data set,Deep Sea Res., Part I, 43, 159–192, 1996.
Castellari, S., N. Pinardi, and K. Leaman, Simulation of water mass for-mation processes in the Mediterranean Sea: Influence of the time fre-quency of the atmospheric forcing, J. Geophys. Res., 105, 24,157–24,181, 2000.
Frassetto, R., A study of the turbulent flow and character of the watermasses over the Sicilian Ridge in both summer and winter, paper pre-sented at 7th SACLANTCEN Conference, SACLANT Undersea Res.Cent., La Spezia, Italy, 1972.
Haines, K., and P. Wu, A modelling study of the thermohaline circulation ofthe Mediterranean: Water formation and dispersal, Oceanol. Acta, 18,401–417, 1998.
Hecht, A., N. Pinardi, and A. R. Robinson, Currents, water masses, eddiesand jets in the Mediterranean Levantine basin, J. Phys. Oceanogr., 18,1320–1353, 1998.
Johannessen, O. M., and O. S. Lee, Thermohaline staircase structure in theTyrrhenian Sea, Deep Sea Res., 21, 629–639, 1974.
Kelley, D. E., Effective diffusivities within oceanic thermohaline staircases,J. Geophys. Res., 89, 10,484–10,488, 1984.
Kelley, D. E., Fluxes through diffusive staircases: A new formulation,J. Geophys. Res., 95, 3365–3371, 1990.
Klein, B.,W. Roether, B. B.Manca, D. Bregant, V. Beitzel, V. Kovacevic, andA. Luchetta, The large deep water transient in the eastern Mediterranean,Deep Sea Res., Part I, 46, 371–414, 1999.
Korres, G., N. Pinardi, and A. Lascaratos, The ocean response to lowfrequency interannual atmospheric forcing variability in the Mediterra-nean Sea, J. Clim., 13, 705–731, 2000.
Lascaratos, A., W. Roether, K. Nittis, and B. Klein, Recent changes in deepwater formation and spreading in the eastern Mediterranean Sea: Areview, Prog. Oceanogr., 44, 5–36, 1999.
Millot, C., Circulation in the western Mediterranean Sea, J. Mar. Syst., 20,424–442, 1999.
Molcard, R., and R. I. Tait, The steady state of the step structure in theTyrrhenian Sea, in A voyage of Discovery, edited by M. Angel, Deep SeaRes., 24, suppl., 221–233, 1978.
Molcard, R., and A. J. Williams, Deep-stepped structure in the TyrrhenianSea, Mem. Soc. R. Sci. Liege, 6, 191–210, 1975.
Onken, R., and J. Sellschopp, Water masses and circulation between theeastern Algerian basin and the Strait of Sicily in October 1996, Oceanol.Acta, 24, 151–165, 2001.
Onken, R., and H. Yuce, Winter circulation and convection in the Antalyabasin (eastern Mediterranean), J. Phys. Oceanogr., 20, 1099–1110, 2000.
Ozsoy, E., A. Hecht, and U. Unluata, Circulation and hydrography of theLevantine basin: Results of POEM coordinated experiments 1985–1986,Prog. Oceanogr., 22, 125–170, 1989.
Pinardi, N., G. Korres, A. Lascaratos, V. Roussenov, and E. Stanev,Numerical simulation of the interannual variability of the MediterraneanSea upper ocean circulation, Geophys. Res. Lett., 24, 425–428, 1997.
Schmitt, R. W., Form of the temperature-salinity relationship in the centralwater: Evidence for double-diffusive mixing, J. Phys. Oceanogr., 11,1015–1026, 1981.
Schmitt, R. W., Double diffusion in oceanography, Annu. Rev. Fluid Mech.,26, 255–285, 1994.
Schmitt, R. W., Double-diffusive convection: Its role in ocean mixing andparameterization schemes for large scale modeling, in Ocean Modelingand Parameterization, edited by E. Chassignet and J. Verron, pp. 215–234, Kluwer Acad., Norwell, Mass., 1998.
Sparnocchia, S., G. P. Gasparini, M. Astraldi, M. Borghini, and P. Pistek,Dynamics and mixing of the eastern Mediterranean outflow in the Tyr-rhenian basin, J. Mar. Syst., 20, 301–317, 1999.
Stommel, H.M., A. B.Arons, andD. Blanchard, An oceanographic curiosity:The perpetual salt fountain, Deep Sea Res., 3, 152–153, 1956.
Wu, P., and K. Haines, Modelling the dispersal of Levantine IntermediateWater and its role in Mediterranean Deep Water formation, J. Geophys.Res., 101, 6591–6607, 1996.
Wu, P., and K. Haines, The general circulation of the Mediterranean Seafrom a 100-year simulation, J. Geophys. Res., 103, 1121–1135, 1998.
Wust, G., On the vertical circulation of the Mediterranean Sea, J. Geophys.Res., 66, 3261–3271, 1961.
Zhang, J., and R. W. Schmitt, The impact of salt fingering on the thermoha-line circulation under mixed boundary conditions, J. Phys. Oceanogr., 30,1223–1231, 2000.
Zhang, J., R. W. Schmitt, and R. X. Huang, Sensitivity of the GFDLModular Ocean Model to parameterization of double-diffusive processes,J. Phys. Oceanogr., 28, 589–605, 1998.
Zodiatis, G., and G. P. Gasparini, Thermohaline staircases in the TyrrhenianSea, Deep Sea Res., Part I, 43, 655–678, 1996.
�����������������������E. Brambilla, Scripps Institution of Oceanography, 9500 Gilman Drive,
La Jolla, CA 92093-0208, USA.R. Onken, Institute of Coastal Research, GKSS Research Center, Max-
Planck-Str. 1, 21502 Geesthacht, Germany. ([email protected])
PBE 25 - 12 ONKEN AND BRAMBILLA: DOUBLE DIFFUSION IN THE MEDITERRANEAN