download (223kb) - the university of huddersfield repository
TRANSCRIPT

University of Huddersfield Repository
Tesfa, Belachew, Mishra, Rakesh, Gu, Fengshou and Powles, Nicholas
Prediction Models for Density and Viscosity of Biodiesel and their Effects on Fuel Supply System in CI Engines
Original Citation
Tesfa, Belachew, Mishra, Rakesh, Gu, Fengshou and Powles, Nicholas (2010) Prediction Models for Density and Viscosity of Biodiesel and their Effects on Fuel Supply System in CI Engines. Renewable Energy, 35 (12). pp. 2752-2760. ISSN 0960-1481
This version is available at http://eprints.hud.ac.uk/id/eprint/7659/
The University Repository is a digital collection of the research output of theUniversity, available on Open Access. Copyright and Moral Rights for the itemson this site are retained by the individual author and/or other copyright owners.Users may access full items free of charge; copies of full text items generallycan be reproduced, displayed or performed and given to third parties in anyformat or medium for personal research or study, educational or not-for-profitpurposes without prior permission or charge, provided:
• The authors, title and full bibliographic details is credited in any copy;• A hyperlink and/or URL is included for the original metadata page; and• The content is not changed in any way.
For more information, including our policy and submission procedure, pleasecontact the Repository Team at: [email protected].
http://eprints.hud.ac.uk/
1
Prediction Models for Density and Viscosity of Biodiesel and their
Effects on Fuel Supply System in CI Engines
B. Tesfa1,a
, R. Mishra1,b
, F. Gu1,c
, and N .Powles,2,d
a
Computing and Engineering, b Chemistry & Forensic Science
University of Huddersfield, Queensgate, Huddersfield, HD1 3DH, UK
Abstract
Biodiesel is a promising non-toxic and biodegradable alternative fuel used in the transport
sector. Nevertheless, the higher viscosity and density of biodiesel poses some acute problems
when it is used it in unmodified engine. Taking this into consideration, this study has been
focused towards two objectives. The first objective is to identify the effect of temperature on
density and viscosity for a variety of biodiesels and also to develop a correlation between
density and viscosity for these biodiesels. The second objective is to investigate and quantify
the effects of density and viscosity of the biodiesels and their blends on various components
of the engine fuel supply system such as fuel pump, fuel filters and fuel injector. To achieve
first objective density and viscosity of rapeseed oil biodiesel, corn oil biodiesel and waste oil
biodiesel blends (0B, 5B, 10B, 20B, 50B, 75B, and 100B) were tested at different
temperatures using EN ISO 3675:1998 and EN ISO 3104:1996 standards. For both density
and viscosity new correlations were developed and compared with published literature. A
new correlation between biodiesel density and biodiesel viscosity was also developed. The
second objective was achieved by using analytical models showing the effects of density and
viscosity on the performance of fuel supply system. These effects were quantified over a
wide range of engine operating conditions. It can be seen that the higher density and viscosity
of biodiesel have a significant impact on the performance of fuel pumps and fuel filters as
well as on air-fuel mixing behaviour of compression ignition (CI) engine.
Key words: Biodiesel, Density, Viscosity, Blend, Fuel supply system, SMD

2
1. Introduction
Biodiesel is one of the renewable and environmentally friendly alternative biofuels that can
be used in a diesel engine with little or no modification in the engine. The stringent emissions
law, the depletion of fossil fuels and the interrelation of fossil fuels with politics have forced
the world to find alternatives to fossil fuels [1,2]. Currently biodiesel is seen as a solution and
almost every country is preparing a policy on production and use of biodiesel in its transport
sector. In addition, the scientific research on production, storage, performance and emission
of biodiesel has increased exponentially [3]. Biodiesel’s characteristics strongly depend on
various plant feed stock, growing climate conditions, soil type, plant health and plant
maturity upon harvest. These parameters affect the physical and chemical properties, which
also have direct relationship with performance and emission of the engine [4]. Among the
biodiesel properties kinematics viscosity, density and heating value are the most important
parameters that affect the engine performance and the emission characteristics [5]. One of the
major shortcomings of the biodiesels when used in a diesel engine is the detrimental effects
caused by the high viscosity of fuel. Higher viscosity causes poor fuel atomization during
spray, increases the carbon deposition on fuel filter, demands more energy from the fuel
pump and wears the fuel pumps and injectors [2,6]. The higher viscosity causes mixture to
burn lean in the engine as fuel moves slowly through the fuel filter and fuel lines. In addition,
the higher viscosity of biodiesel fuel affects the start of injection, injection pressure and the
fuel spray characteristics, which are the main parameters that affect engine performance and
exhaust emission [7,8,9].The density of the diesel fuel is also very important parameter, since
other crucial performance parameters of engine such as cetane number and heating value
have been correlated against it [10]. In addition, the density values have also been used to
measure the amount fuel in fuel system by volumetric method [5]. The variation of the
density affects the power and the fuel spray characteristics during fuel injection and
combustion in cylinder. To improve viscosity and density of the biodiesel the available
techniques that are used are mixing the diesel with biodiesel and/or pre-heating the biodiesel
[11]. The effect of mixing on density and viscosity variation of biodiesel with respect to
temperature, percentage of blend, and the chemical structure (fatty acid, position and number
of double bond) have been well reported. Different empirical correlations have been
developed, which relate various performance parameters with density and viscosity of
biodiesel [5-11]. The works of previous researchers on biodiesel density and viscosity have
been summarized below.

3
1.1 Density of biodiesel
The specific gravity of biodiesel has been investigated by many researchers. Specific gravity
is defined as a ratio of the density of a given solid or liquid substance to the density of water
at a specific temperature and pressure, typically at 4°C and 1atm. Tat and Garpen [10]
measured experimentally the specific gravity of 20%, 50%, 75%, and 100% soyabean
biodiesel as a function of temperature in the temperature range of crystallization temperature
to 100oC using the standard hydrometer method. The results indicate that the biodiesel and its
blends demonstrate temperature dependent behaviour. They developed 1st degree linear
regression equation (1) shown below.
bTaSG += (1)
Where SG is the specific gravity of blended biodiesel, T is the temperature in oC, and a and b
are constants that depend on different percentages of biodiesel blends. Tat et al. [4] also
reported similar linear equation for three different biodiesels namely, canola-oil biodiesel,
soyabean-oil biodiesel and fish-oil biodiesel. These equations were developed based on the
data obtained from a capacitance type liquid level meter within temperature range of 20 o
C to
300oC. Clements (referenced in [10]) suggested that equation (2) can be used to determine the
specific gravity of different biodiesel blends at a standard temperature. In this equation the
specific gravity of the blend has been considerd to be proportional to mass fractions of the
constituents.
∑= iiblend MSGSG (2)
Where SGblend is the specific gravity of the blend, SGi is the specific gravity of the component
i, and Mi is the mass fraction of the component i.
Alptekin and Canakci [5] carried out experimental tests on different biodiesels made of
soybean oil, waste palm oil, sunflower oil, corn oil, canola oil, and cottonseed. They
suggested a 1st degree empirical equation, which can relate the density of a biodiesel blend
with the percentage of a biodiesel used as shown in equation (3).
BAxD += (3)
Where D is density (g/cm3), A and B are constants, which vary with the type of the biodiesel
and x is the biodiesel fraction. It can be clearly seen that there is no equation to the best of
authors’ knowledge that relates density of biodiesel blend, biodiesel fraction and temperature.

4
1.2 Viscosity of biodiesel
Viscosity is the property of a fluid by virtue of which it offers resistance to flow. The
viscosity of a biodiesel is higher than the viscosity of fossil-diesel and some researchers have
reported that the biodiesel viscosity can be up to 1.6 times that of diesel at 40oC [11]. This
ratio increases especially when the temperature is below 25oC [11]. Blending of the biodiesel
with diesel and preheating of the biodiesel improves the viscous characteristics significantly
[5,12,13]. The viscosity of biodiesel can be estimated from well known mixing laws such as
the Grun-Nissan and Katti-Chaudhri laws, which were originally proposed by Arrhenis [14].
The laws are expressed in mathematical form as written in equation (4).
)ln()ln()ln( 2211max ηηη xx += (4)
Where, maxη is the kinematic viscosity (mm
2/s) of the mixture, 1η and 2η are
kinematic viscosities (mm2/s) of components 1 and 2 and x1 and x2 are the mass or volume
fractions of components 1 and 2. Alpetekin and Canakci [5] investigated the variation of the
viscosity as a function of different percentages of blends of biodiesel. The test was done at
40oC for a wide variety of biodiesels such as waste palm oil biodiesel, sunflower oil
biodiesel, soybean oil biodiesel, corn oil biodiesel, cotton seed oil biodiesel and commercial
diesel. They developed a second degree empirical equation (5) to calculate the viscosity of
blended biodiesel taking the fraction of biodiesel in the mixture as the main parameter. It was
found that the estimated values were close to the measured values.
CBxAxblend ++= 2η (5)
Where η is the kinematic viscosity (mm2/s), A, B, C are coefficients and x is the biodiesel
fraction. Most of the available methods for the estimation of biodiesel viscosity at different
temperatures are fairly complicated and depend on a number of input parameters. These
empirical correlations vary for each type of biodiesel depending on the Biodiesel source [15].
Riazi and Al-Otaibi[15] developed equation (6) for estimation of viscosity of liquid
hydrocarbons and petroleum mixtures at various temperatures from their refractive index
5
values (I). However, in this model the equation needs the values of molecular weight, specific
gravity, boiling temperature and refractive index of compounds as input.
I
BA +=
µ
1 (6)
In the above equation µ is the dynamic viscosity (cp), A and B are constants specific to each
component and I is the refractive index.
A modified equation was proposed by Tat and Van Gerpen [16] to determine the viscosity of
the biodiesel at different temperatures. The equation is shown below
2)ln(
T
C
T
BA ++=η . (7)
Where A, B and C are constants, T is temperature in K, and η is the kinematic viscosity
(mm2/s).
In Tat and Van Gerpen’s equation the constants A, B and C vary with the biodiesel type and
the biodiesel fraction and this limits the general use of this equation. Pegg et al. [17]
developed the equation (8) to calculate the dynamic viscosity of B100 as a function of
temperature in the temperature range of 277K to 573K.
2
29352366.2164343.2)ln(
TT++−=η (8)
Where η is the dynamic viscosity (mPa s), A and B are constants and T is the temperature
(K). The comparison of predictions from empirical equation and the measured data showed
an absolute error of 0.223 and correlation coefficient R2
of 1.
By considering the carbon number, Krisnangkura et al. [18] proposed different equations
[equation (9) and equation (10)] to determine viscosity of biodiesels with long and short
carbon structure at different temperatures.
zTT
zCC
772.10966.403202.0177.2)ln(
1812++−−=−η (9)
zTT
zCC
35.10312.492158.0915.2)ln(
126++−−=−η (10)
Where 126 cc −η and
1812 cc −η are the kinematic viscosities of biodiesels with number of
carbon atoms varying from 6 to 12 and 12 to 18 respectively, in mm2/s ,T is the temperature
in K, and z is carbon number.
6
In Krisnangkura’s equations, number of the carbon atoms is required a-priori which limits
the use of equation (9) and equation (10).
Most of the empirical correlations described above are dependent on some constants and vary
with type of biodiesel and percentage of blends. It is very important to have a simple, stable
and reliable estimation method of viscosity as a function of biodiesel fraction, temperature
and density of biodiesel. These relations will be of immense use in engine intake,
combustion, and exhaust modelling. Further the properties of biodiesels affect the dynamic
flow phenomena in the fuel pump, fuel pipe, fuel filter and injector spray [19]. Based on the
above requirements the objectives of this study have been formulated as : 1) to identify the
effect of temperature and biodiesel fraction on density and viscosity of biodiesel blend as
well as to develop a correlation for biodiesel fraction, temperature, density and viscosity of
biodiesel and 2) to investigate and quantify the effect of density and viscosity of the biodiesel
and its blends on the fuel supply system such as fuel pump, fuel filter, fuel injector and spray
characteristics.
2.Materials and Methods
2.1 Materials
In this study, commercially available three common types of biodiesels (corn oil biodiesel,
rapeseed oil biodiesel, and waste oil biodiesel) obtained from a local company have been
used for analysis. The corn oil biodiesel and rapeseed oil biodiesel were produced by
transesterfication process from ‘virgin’ oil using methanol and waste oil biodiesel was
produced from local cooking oil waste. Normal diesel fuel was obtained from a local fuel
supplier. The biodiesel were blended with diesel fuel at 5%, 10%, 20%, 50%, 75% and 100%
on volume basis. For each biodiesel six samples were prepared. In total (including diesel) 19
samples were used for the density and viscosity measurements.
2.2 Density measurement
For measuring the density, standard procedures have been followed [20]. A glass hydrometer
with specific gravity range of 0.7 to 1.0 with an accuracy of three decimal places was used in
the measurement. To collect temperature-dependent data, a 100ml graduated cylinder
containing a biodiesel sample was placed in a temperature controlled bath. The water bath
temperature could vary from room temperature to 95oC. The test was repeated twice and the

7
average value was taken. In addition to the hydrometer measurements, mass/volume method
of density measurement was also used for comparison at 15.6oC.
2.3 Viscosity measurement
The Standard Method [Petroleum products: Determination of kinematic viscosity and
calculation of dynamic viscosity, the European standard EN ISO 3104:1996 [21] ] was used
to measure the viscosity of the biodiesel samples. This method is commonly used to measure
the kinematic viscosity of liquid petroleum products. Since biodiesels also have almost
similar properties as the fossil fuel this method has been considered appropriate for the
measurement of viscosity of the biodiesel samples. The kinematic viscosity is determined by
measuring the time taken for a known volume of fuel flowing under gravity to pass through a
calibrated glass capillary viscometer tube. Cannon-Fenske Viscometer tube (size B) and
Selecta viscosity bath were used for this purpose. The size B viscometer has approximate
constants of 0.01 and kinematic viscosity range from 2 to 10mm2/s. The timing device with
0.01 seconds least count was used in present tests. The water bath temperature used has a
temperature range from room temperature to 85oC. The viscosity values below the room
temperature were determined from the regression correlation from the data of this study and
previous reports. For the experimental data to be acceptable the EN ISO 3104:1196 standards
require the tests to be done two times and the first and second measurements should be within
an accuracy of 0.02mm2/s. If the accuracy condition is satisfied the average of the two tests
was taken. The tests were repeated two times and the average value was taken as
representative value.
2.4 Mathematical models of fuel supply system
To evaluate the effects of density and viscosity of different biodiesel blends on the fuel
supply system (fuel pump, fuel pipe, fuel filter and fuel injector) several key fuel supply
parameters such as, head loss, flow rate and Sauter mean diameter (SMD) were predicted
using well-accepted mathematical models for different fuel blends under a wide range of
engine operating conditions. The characteristics of the compression ignition (CI) engine used
in this prediction model is summarised in Table 1. The model was used to determine the mass
flow rate of fuel used to produce the required amount of power by the engine. The mass flow
rate of fuel that needs to be injected for each cylinders and the power produced by the engine
are calculated by the following equations:

8
(11)
(12)
(13)
(14)
Where mi is the fuel mass rate of injection for each cylinder (kg/s), P is the power developed,
n is the number of cylinders, η is the thermal efficiency calculated by equation(13), Qv is the
calorific value of fuel(J/kg), ρ is the density of fuel(kg/m3), NR is the rotational speed of
engine(rev/s), N is the number of cycles calculated by N = NR/2 for 4-stroke engine (cycles
per sec), θ is the crank angle duration for injection(degrees), V1 is the volume at start of the
compression process per cycle (M3), α is the compression ratio, β is the cut-off ratio in the
diesel cycle (1.5), γ is the air specific heat ratio, q is the heat supply factor , A is the
stoichiometric air fuel ratio, and, R is the gas constant of air (287J/kg.K), and T1 is the
ambient temperature.
Table 1 Engine characteristics
One of the other important fuel supply system components in the engine is a fuel filter. The
main application of the fuel filter is to remove foreign matter of different sizes from the fuel
Type of engine Tturbocharged Diesel
engine
Number of cylinders 4
Bore 103mm
Stroke
Inlet valve diameter
Exhaust valve diameter
Compressor inlet diameter
Compressor outlet diameter
Turbine inlet diameter
Turbine outlet diameter
132mm
36.2mm
33.5 mm
60 mm
60mm
100mm
80mm
Compression ratio 18.3:1
Injection system Direct injection
Displacement 4.399 litre
Cooling system water
Recommended speed 850 rpm
Maximum power 74.2 kw @ 2200 rpm
)/(360 ηθnNQPNm vRi =
−
−−=
)1(
)1(11
γ
β γ
qnVNPP
1ART
v=
)1(
)1(11
)1( −
−−=
− β
β
γαη
γ
γ

9
as these could cause wear of the well polished materials. In addition, it filters any fraction of
water left in the fuel to save the equipments from corrosion. The filter flow characteristics
have been presented by Coulson and Richardsons [8] and modelled as described in equations
(15 -17). Equation (14) is the basic charctersitic equation for filtration. By assuming constant
pressure difference ( ∆P), equation (15) can be modified to equation (16). Further, Γ , v and A
are assumed constants and taking the fuel filter specific properties described in Table 2,
equation (17) was developed. Equation (17) shows the inverse relationships between fuel
flow rate and the viscosity of the fuel in the filter media.
(15)
v
tPAV
ηΓ
∆−=
)(
2
22
(16)
t
CQ
η=
(17)
In the above equations V (m3) is the volume of filtrate which passes through the filter in time
t(s), A (m2) is the cross-sectional area of the filter cake, η (mm
2/s) is the kinematic viscosity
of the filtrate and ∆P (pa) is the applied pressure difference, Γ (m-2
) is the filtration
resistance constant, v is the volume of cake deposited by unit volume of filtrate, and C is
filtration property constant.
Table 2 Fuel filter specification
The effect of viscosity on fuel flow through pump was investigated by calculating the head
loss that occurs in the pumping network. The head loss that occurs in pipes is dependent on
the flow velocity, pipe length and diameter, and a friction factor based on the roughness of
the pipe and the Reynolds number of the flow. In the simulation model the frictional head
loss in section and head pipe was calculated by:
Filter size 33cm x 20.32cm
Thickness: 0.45mm
Maximum pore size 30 -120 µ m
Particle removal efficiency >97%
Particle size in diesel: > 15 µ m
particle size range in filter 3-10 µ m
vV
PA
dt
dV
ηΓ
∆−=
)(2

10
(18)
Where hf (m) is friction head loss, 2u
R
ρ the dimension-less friction factor calculated by the
equation 25.02
Re
0396.0
Nu
R=
ρ for the turbulent flow, NRe is Reynolds number,
id
L is the equivalent
length to pipe diameter ratio, u is the velocity head (m/s) and g is the gravitational
acceleration (m/s2).
The other important process that affects the performance of the engine system is the fuel-air
mixing process in the engine cylinder. The penetration length, spray angle and Sauter mean
diameter (SMD) are the major parameters to quantify the efficiency of mixing process. Since
the viscosity and density of the fuel have less effect on the penetration length and the spray
angle, the present work is focused only on the effect of biodiesel blending on the SMD. The
SMD is the diameter of the model droplet whose volume to surface area ratio is equal to the
ratio of the sum of all droplet volumes (V) in the spray to the sum of all droplet surface areas
(A). There are different models to correlate the fuel properties and the injector characteristics
with SMD. In this simulation the model developed by Hiroyasu and Arai has been used [22]:
���� � 0.38�.� ����.�� ������
�.��������
��.�� (19)
Where lWe is the Weber number given by σ
ρ ll
DuWe
2
= , Re is the Reynolds number given
by l
luD
µ
ρ=Re , u(m/s) is the velocity of jet, lρ (kg/m
3) is the density of the liquid , lµ
(N.s/m2) is the dynamic viscosity of the liquid, D (m) is the nozzle hole diameter, gρ is the
density of the gas , and gµ is the dynamic viscosity of the gas (N.s/m2) , and σ is the surface
tension at the liquid-gas interface(N/m).
3.Result and Discussion
3.1 Effect of Biodiesel fraction and temperature on density
Density can be defined as the ratio of the mass of an object divided by its volume. The
density of the biodiesel was measured for various temperatures and biodiesel blends. Table 3
)2
)()((4384.22
2 g
u
d
L
u
Rh
i
fρ
=
11
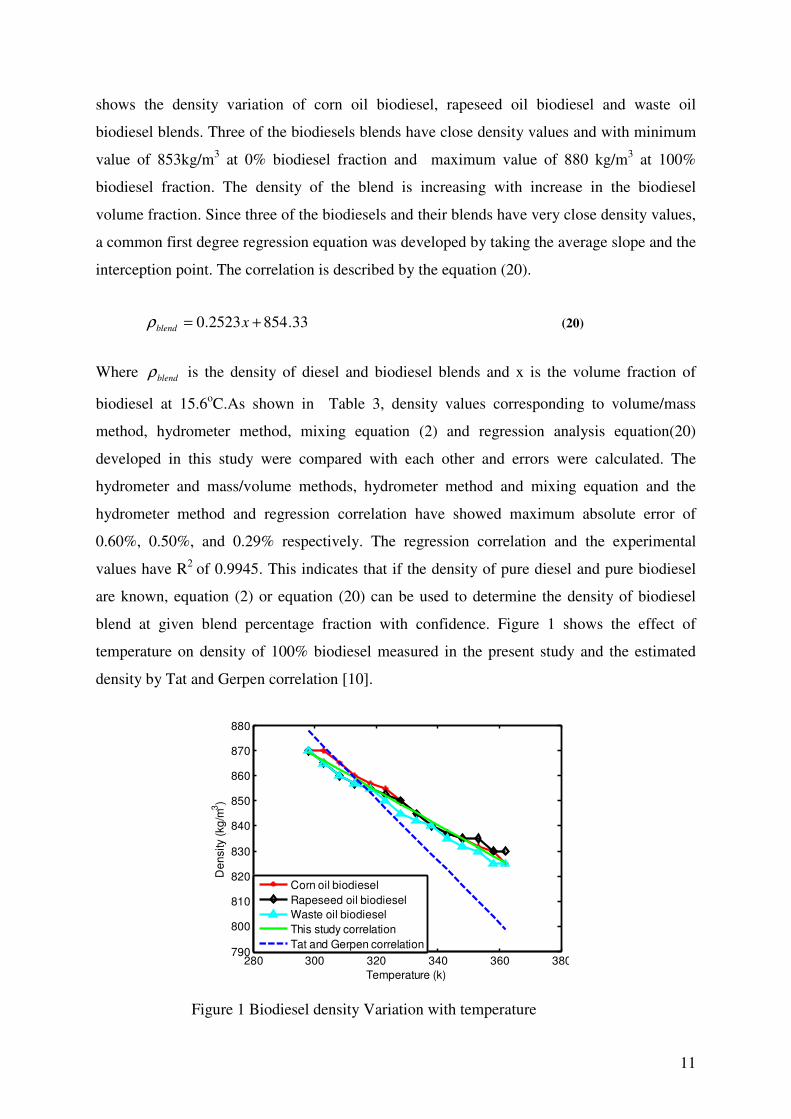
shows the density variation of corn oil biodiesel, rapeseed oil biodiesel and waste oil
biodiesel blends. Three of the biodiesels blends have close density values and with minimum
value of 853kg/m3 at 0% biodiesel fraction and maximum value of 880 kg/m
3 at 100%
biodiesel fraction. The density of the blend is increasing with increase in the biodiesel
volume fraction. Since three of the biodiesels and their blends have very close density values,
a common first degree regression equation was developed by taking the average slope and the
interception point. The correlation is described by the equation (20).
(20)
Where blendρ is the density of diesel and biodiesel blends and x is the volume fraction of
biodiesel at 15.6oC.As shown in Table 3, density values corresponding to volume/mass
method, hydrometer method, mixing equation (2) and regression analysis equation(20)
developed in this study were compared with each other and errors were calculated. The
hydrometer and mass/volume methods, hydrometer method and mixing equation and the
hydrometer method and regression correlation have showed maximum absolute error of
0.60%, 0.50%, and 0.29% respectively. The regression correlation and the experimental
values have R2
of 0.9945. This indicates that if the density of pure diesel and pure biodiesel
are known, equation (2) or equation (20) can be used to determine the density of biodiesel
blend at given blend percentage fraction with confidence. Figure 1 shows the effect of
temperature on density of 100% biodiesel measured in the present study and the estimated
density by Tat and Gerpen correlation [10].
Figure 1 Biodiesel density Variation with temperature
33.8542523.0 += xblendρ
280 300 320 340 360 380790
800
810
820
830
840
850
860
870
880
Temperature (k)
De
nsity (
kg
/m3)
Corn oil biodiesel
Rapeseed oil biodiesel
Waste oil biodiesel
This study correlation
Tat and Gerpen correlation

12
The temperature was varied from 290K to 360K for 100% corn oil biodiesel, rapeseed and
waste oil biodiesel. Three of the biodiesel have very close density values at a given
temperature and the density of the biodiesel decreases with the increase in temperature. To
generate the regression correlation the average density of the biodiesel at given temperature
was taken and a linear-regression equation (21) was developed. The measured average
biodiesel density and regression line have maximum absolute error of 0.25% and R2
of
0.9930. Similarly the density of diesel as a function temperature was experimentally
determined and is described in equation (22). The diesel density empirical equation and the
measured density values have maximum absolute error of 0.15% and R2
of 0.9962.
(21)
(22)
Where biodρ is the density of biodiesel is, dieselρ is the density of diesel and T is the
temperature.
These regression equations were compared with Tat and Gerpen linear-regression equation
(1) and it was noticed that there is a relatively higher absolute error of about 3.5%. This
difference may be because of the different biodiesels used in this study and that used by Tat
and Gerpen [11]. In figure 1 it can further be seen that in between 320 to 330K the density of
the biodiesel is similar to the normal diesel density (850kg/m3 to 860kg/m
3). This implies that
if there is a system to pre-heat the biodiesel in the temperature-range of 320 to 330K, the
density of Bio-diesel could be matched to the density of pure diesel. In the present study
equation (23) has been developed to estimate the density of various biodiesel blends at a
given temperature. For this purpose mixing equation (2) developed by Clements [10] and the
regression equations (21) and (22) of this study have been used. Equation (23) can be used to
determine the density of a binary blend of biodiesel and diesel at given temperature and
blending fraction.
1051657.0)4.24033.0( +−+−= TXTmixρ (23)
Where mixρ is density of the binary (kg/m3), X is volume fraction of the biodiesel and T is
the temperature (K).
The density as obtained from experiments results on rapeseed oil biodiesel were compared
with estimated value of biodiesel density using equation (23) and a maximum percentage
error of 0.54% was observed. This implies that equation (23) can be used with confidence to
estimate the density of the biodiesel blend at any temperature and biodiesel fraction.
107569.0 +−= Tbiodρ
1051657.0 +−= Tdieselρ

13
Table 3 Density of biodiesel blend by experimental methods, mixing equation and correlation equation at 15.6oC
Type of Biodiesel
Fraction of Biodiesel (%)
Density, by mass/volume
Density using hydrometer
Density using mixing equation (2)
Density using correlation equation (11)
Absolute percentage error between
Mass/volume and hydrometer methods
Mixing equation(2) and hydrometer methods
Correlation equation(11) and hydrometer methods
0
853.36
855.00
853.36
854.43
0.1919
0.0000
0.1252
5 856.39 860.00 854.68 855.70 0.3049 0.3164 0.0799
Corn Oil 10 857.94 860.00 855.99 856.97 0.2406 0.2268 0.1121
biodiesel 20 859.10 860.00 858.62 859.52 0.0112 0.1719 0.0491
50 866.61 865.00 866.50 867.15 0.1856 0.0120 0.0625
75 874.10 875.00 873.08 873.51 0.1025 0.1177 0.0680
100 879.65 885.00 879.65 879.87 0.6087 0.0000 0.0255
5 854.96 855.00 854.68 855.70 0.4608 0.5008 0.0870
Rapeseed oil 10 859.04 860.00 855.99 856.97 0.1115 0.3552 0.2407
biodiesel 20 856.97 860.00 858.62 859.52 0.3536 0.1924 0.2973
50 865.09 865.00 866.50 867.15 0.0102 0.1637 0.2384
75 871.77 870.00 873.08 873.51 0.2028 0.1499 0.1998
100 879.35 880.00 879.65 879.87 0.0739 0.0337 0.0591
5 857.48 860.00 854.68 855.70 0.2944 0.3265 0.2069
10 857.58 855.00 855.99 856.97 0.3008 0.1854 0.0707
Waste oil 20 860.25 850.00 858.62 859.52 1.1911 0.1892 0.0846
biodiesel 50 866.68 860.00 866.50 867.15 0.7710 0.0205 0.0540
75 875.32 875.00 873.08 873.51 0.0366 0.2565 0.2068
100 879.55 880.00 879.65 879.87 0.0512 0.0109 0.0364

14
3.2 Effect of Biodiesel fraction and temperature on viscosity
Various studies were conducted to estimate viscosity of corn oil biodiesel, rapeseed
oil biodiesel, and waste oil biodiesel blends at various temperatures. The effect of the
biodiesel blends’ fraction and temperature on the kinematic viscosity of biodiesel was
investigated and corresponding models were developed. The models were compared
with the models published in the literature. Figure 2 shows the kinematic viscosity of
corn oil biodiesel, rapeseed oil biodiesel, and waste oil biodiesel blends at different
biodiesel volume fractions as obtained in the present study.
Figure 2 Kinematic viscosity variations with biodiesel blend percentage
The biodiesel kinematic viscosity increases with increasing biodiesel blend fraction
for all the blends. The rapeseed biodiesel have higher kinematic viscosity as compared
to corn oil biodiesel and waste oil biodiesel blends. The experimental data were
correlated by an empirical second degree correlation described as equation (24). The
coefficients A, B, and C used in equation 24 are described in Table 4. This equation
can be used to estimate the viscosity of biodiesel at a given biodiesel fraction.
CBxAxcorr ++= 2η (24)
Where corrη is the kinematics viscosity (mm2/s), A, B, C are coefficients of the second
degree equation and x is biodiesel fraction. Table 4 also presents the experimentally
measured viscosity, the calculated viscosity by equation (4), the regression correlation
0 20 40 60 80 1003.5
4
4.5
5
5.5Viscosity vartaion with biodiesel fraction
Biodiesel fraction (%)
Kin
em
atic V
isco
sity (
mm
2/s
)
Corn oil biodiesel
Rapeseed oil biodiesel
Waste oil biodiesel
15
(24) and R2 values, and the absolute error between the measured and calculated
viscosities of the three biodiesel blends.
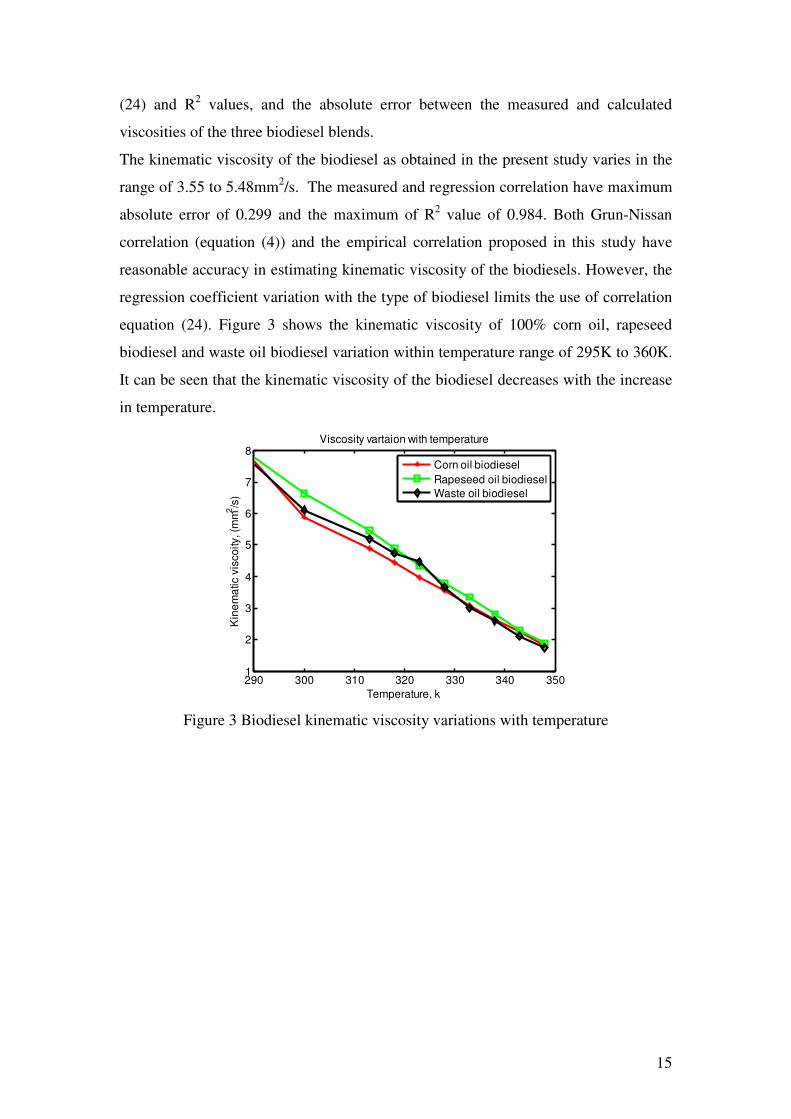
The kinematic viscosity of the biodiesel as obtained in the present study varies in the
range of 3.55 to 5.48mm2/s. The measured and regression correlation have maximum
absolute error of 0.299 and the maximum of R2 value of 0.984. Both Grun-Nissan
correlation (equation (4)) and the empirical correlation proposed in this study have
reasonable accuracy in estimating kinematic viscosity of the biodiesels. However, the
regression coefficient variation with the type of biodiesel limits the use of correlation
equation (24). Figure 3 shows the kinematic viscosity of 100% corn oil, rapeseed
biodiesel and waste oil biodiesel variation within temperature range of 295K to 360K.
It can be seen that the kinematic viscosity of the biodiesel decreases with the increase
in temperature.
Figure 3 Biodiesel kinematic viscosity variations with temperature
290 300 310 320 330 340 3501
2
3
4
5
6
7
8Viscosity vartaion with temperature
Temperature, k
Kin
em
atic v
isco
ity, (m
m2/s
)
Corn oil biodiesel
Rapeseed oil biodiesel
Waste oil biodiesel

16
Table 4 kinematic viscosity of biodiesel and its blends at 40oC.
Biodiesel
Blend (%)
Measured
A
B
C
R
2
Calculated kinematic viscosity Absolute error between measured and
Regression correlation
Grun-Nissan Regression correlation
Grun-Nissan
0 3.50 8x10⁻⁶
0.0147 3.593 0.984 3.5930 3.5000 0.0930 0.0000
Corn oil biodiesel
5 3.80 3.6667 3.5590 0.1333 0.2410
10 3.74 3.7408 3.6190 0.0008 0.1210
20 3.72 3.8902 3.7421 0.1702 0.0221
50 4.35 4.3480 4.1370 0.0020 0.2130
75 4.54 4.7405 4.4978 0.2005 0.0422
100 4.89 5.1430 4.8900 0.2530 0.0000
0 3.50 7*10-6
0.0143 3.537 0.987 3.5366 3.5000 0.0366 0.0000
Rapeseed biodiesel
5 3.76 3.6083 3.5793 0.1517 0.1807
10 3.90 3.6803 3.6605 0.2197 0.2395
20 4.08 3.8254 3.8283 0.2546 0.2517
50 4.47 4.2691 4.3795 0.2009 0.0905
75 4.62 4.6485 4.8989 0.0285 0.2789
100 5.48 5.0366 5.4800 0.4434 0.0000
0 3.50 5x10⁻⁵
0.0129 3.597 0.992 3.5970 3.5000 0.0970 0.0000
5 3.87 3.6628 3.5703 0.2073 0.2997
Waste oil biodiesel
10 3.77 3.7310 3.6420 0.0390 0.1280
20 3.95 3.8750 3.7898 0.0750 0.1602
50 4.30 4.3670 4.2702 0.0670 0.0298
75 4.85 4.8458 4.7168 0.0042 0.1332
100 5.21 5.3870 5.2100 0.1770 0.0000

17
The empirical correlation for the dynamic viscosity as a function of temperature is
described by equation (25) which has been developed based on the experimental
results and the developed equation has R2
value of 0.9999. Josi et al. [6] and Tat &
Gerpen [12] have modified the Arrhens equation for prediction of biodiesel viscosity
at different temperatures. The viscosity values obtained from Joshi et al. and Tat &
Gerpen viscosity correlations and the regression correlation developed in this study
are shown in Figure 4. All of the curves follow similar trend. The empirical
correlation of the kinematic viscosity and temperature is described by equation (25)
for the experimental results obtained in the present study.
12.90219.0)ln( +−= Tη (25)
Where T is the temperature in K, and η is the kinematic viscosity in mm
2/s
.
Figure 4 Viscosity of biodiesel with temperature range of 290K to 360K
Further, the density and kinematic viscosity of biodiesel were correlated and an
equation was developed relating viscosity as function of density as shown below in
equation (26). This equation could be used to estimate kinematic viscosity of the
biodiesel for the known density of biodiesel. The values from predicting model and
the experimental values have a maximum absolute error of 0.37.
(26)
02.290357.0)ln( −= ρη
290 300 310 320 330 340 350 3601
2
3
4
5
6
7
8
9Viscosity vartaion with temperature
Temperature, (K)
Kin
em
atic v
isco
sity, (m
m2/s
)
Joshi et al. correlation
Tat & Gerpen correlation
This study correlation

18
Where η is the viscosity of the fuel biodiesel at a given temperature and ρ is the
density of the biodiesel at a given temperature.
Furthermore an attempt has been made to develop a correlation to predict viscosity of
a biodiesel blend at a given temperature. For this a new equation (27) has been
developed by combining equation (21), (22) and (26) to determine the viscosity of the
blend at given temperature and biodiesel fraction. The modified mixing equation has a
maximum absolute error of 0.50.
64.80234.0)8456.00012.0()ln( +−+−= TxTmixη (27)
Where mixη is the viscosity of the biodiesel, x is the volume fraction of the biodiesel
and T is the temperature (K).
The kinematic viscosity prediction models of the biodiesel described by equations
(25), (26) and (27) are used to determine numerically the kinematic viscosity at
various temperatures, density and biodiesel fraction values. These models can be used
in design and investigation of fuel supply systems (fuel pump, fuel filter, fuel pipe,
and injectors) as well as in predicting air-fuel mixing phenomena and combustion
characteristics.
3.3 Effect of density and viscosity on the fuel filter, pump pressure and air-fuel mixture
This section describes the effects of the biodiesel viscosity and density on the fuel
filter; fuel pump and injection spray characteristics in the engine cylinder. The
simulation results obtained from the model have been explained below. Figure 5
illustrates the variation of the fuel flow rate through the fuel filter as function of time
for different values of kinematic viscosity representing various biodiesel blends. It can
be seen that the fuel flow rate decreases with time in the fuel filter media. This can be
explained on the simple fact that at the starting of filtration the voidage are active and
the filtration rate is higher [8]. After a while the active voidage of the filter reduces
and the filtration rate becomes constant. Figure 5 also shows the effect of viscosity on
the fuel flow rate through the fuel filter. It can be seen that when the fuel viscosity
increases the fuel flow rate decreases. This can be attributed to higher flow resistance
encountered by highly viscous fluid.

19
Figure 5 Fuel flow rate through fuel filter for fuels with different kinematic
viscosity values
The fuel filter rate has direct effect on the fuel flow rate in the injector and hence the
power produced by the engine. The higher viscosity means lower flow rate of fuel and
lower engine power by the engine.
Figure 6 Flow rate- friction head loss characteristics of fuel pump at different
viscosity
Figure 6 shows the fuel pump head loss versus the fuel flow rate of biodiesel and
diesel fuel for different viscosity values. It can be seen that at a constant head, fuel
with higher viscosity yields lower fuel flow rate than fuel with lower viscosity. A
similar trend has been reported by Bannikov et al. [23].
0.5 1 1.5 2 2.5 31
2
3
4
5
6
7
8x 10
-5
time (s)
Fuel f
low
rate
(m
3/s
)
Kenematic viscosity 7.68 mm2/s
Kenematic viscosity 6.17 mm2/s
Kenematic viscosity 4.96 mm2/s
Kenematic viscosity 3.20 mm2/s
0.6 0.8 1 1.2 1.4 1.6
x 10-3
0.2
0.4
0.6
0.8
1
1.2
1.4
1.6
1.8
Fuel flow rate (m3/s)
Fri
ctio
n h
ea
d lo
ss (
m)
Kinematic viscosity = 6.89mm2/s
Kinematic viscosity = 4.44mm2/s
Kinematic viscosity = 2.57mm2/s

20
Figure 7 shows the relationship between the kinematic viscosity and Sauter mean
diameter (SMD) of fuel for different engine speeds. The SMD value of the fuel in
combustion cylinder is determined by using a well-accepted model of Hiroyasu and
Arai [22]. It can be seen that when the engine speed increases the SMD of the fuel in
the cylinder decreases. The same trend has been reported by Hiroyasu [24]. It is also
seen that when the kinematic viscosity of the biodiesel increases, the SMD also
increases proportionally. This can be explained by the fact that when the kinematic
viscosity and surface tension of the fuel increase, the cohesion and the surface
viscosity between fuel molecules increase [25]. As a result, the SMD of the fuel
increases in the cylinder chamber. The increase in the SMD means reduced surface
area of the fuel droplet. As a result the tendency of evaporation of fuel decreases and
this might decrease the performance of the engine and increase the emissions. Geo et
al. [26] compared the SMD corresponding to diesel, B5, B10, B20 and B100 of
Jatropha oils blends. Their results show that the SMD gradually increases with
increasing blend ratio of the biodiesel and they concluded the kinematic viscosity to
be the major factor for this. The effect of kinematic viscosity of the biodiesel on the
SMD has been reported by Geo et al and has been shown on fig 7. The reported
values show the same trend with data predicted in this study.
Figure 7 Sauter mean diameter variation with kinematic viscosity of
biodiesel using Hiroyasu and Arai Model [22].
The same trend has been also reported by Park et al. [27] for SMD variation for 20%
ethanol blend biodiesel (BDE20) and 100% biodiesel. Since BDE20 has lower
0 2 4 6 8 1060
70
80
90
100
110
120
130
140
150
Kinematic viscosity (mm2/s)
SM
D (
µm
)
1000rpm
1400rpm
1800rpm
Geo et al.[26]

21
kinematic viscosity than 100B, the former has lower SMD. Figure 8 illustrate the
SMD of the biodiesel fuel verses injected fuel temperature for different engine speeds.
It can be seen that the SMD of the biodiesel decreases with increase in the injected
fuel temperature. This is because when the temperature increases, the inter-molecular
forces decrease. As a result the SMD decreases in the engine cylinder. This facilitates
the evaporation of the fuel and combustion rate in the engine cylinder.
Figure 8 Sauter mean diameters for temperature range of 290K to 395K using
Hiroyasu and Arai Model [22].
Conclusion
In this study models have been developed for predicting the density and kinematic
viscosity of biodiesel blends at various temperatures and volume fractions. The
experiments have been conducted according to EN ISO 3675:1998 and EN ISO
3104:1996 test procedures. From the study the following conclusions can be drawn:
1. The density and kinematic viscosity of the rapeseed oil biodiesel, corn oil
biodiesel and waste oil biodiesel blends (0B, 5B, 10B, 20B, 50B, 75B, and 100B)
have been measured in the temperature range of 15.6oC to 90
oC. It has been
noticed that the specific gravity and the viscosity of the biodiesel blends increase
with increase of the biodiesel fraction. It is also seen that the density and viscosity
of each blend decreases with increase in the temperature.
2. Empirical equations to predict the density and the viscosity of the biodiesel and
its blends as function of temperature have been developed. The empirical
290 300 310 320 330 340 350 36060
70
80
90
100
110
120
130
140
150
Fuel inlet temperature (K)
SM
D (
µm
)
1000rpm
1400rpm
1800rpm

22
equations and the measured data are closely matched with R2
of 0.993 for the
density model and 0.999 for the kinematic viscosity model.
3. Empirical equations to predict the kinematic viscosity of biodiesel and its blends
from the density of biodiesel have been developed. The values from predicting
models and the experimental values match closely.
4. The Grun-Nissan viscosity equation has been further modified to predict the
kinematic viscosity of biodiesel blends from the biodiesel fraction and operating
temperature values. The empirical models show fair degree of accuracy with a
maximum absolute error of 0.50.
5. Viscosity of the biodiesel affects the performance of the fuel supply system
including fuel pump, fuel filters and air-fuel mixing behaviour. The available
experimental data show reasonable agreement with predicted trends.
Reference
[1] Lapuerta M, Octavio Armas O, Ballesteros, R and Fernández J. Diesel
emissions from biofuels derived from Spanish potential vegetable oils. Fuel 2005,
84(6), 773-780.
[2] Meher, L., Vidya Sagar, D. & Naik, S. Technical aspects of biodiesel
production by transesterification--a review. Renewable and Sustainable Energy
Reviews, 2006, 10(3), 248-268.
[3] Lapuerta, M., Armas, O., & Herreros, M. Effect of biodiesel fuels on diesel
engine emissions .Progress in Energy and Cumbstion Science,2008, 34, pp. 198-
223
[4] Tate R, Watts KC, Allen, CA and Wilkie KI. The densities of three biodiesel
fuels at temperatures up to 300 °C. Fuel 2006, 85(7-8), 1004-1009.
[5] Alptekin, E. & Canakci, M., 2008. Determination of the density and the
viscosities of biodiesel-diesel fuel blend. Renewable Energy, 33(12), 2623-2630.
[6] Tate R, Watts, , KC, Allen, CA and Wilkie, KI. The viscosities of three
biodiesel fuels at temperatures up to 300 °C. Fuel 2006, 85(7-8), 1010-1015.
[7] Heywood, J.,B., Internal Combustion Engine Fundamentals, McGraw-Hill., New
York, 1988.
[8] Coulson, J.F., & Richardson, J.H. Particle Technology and separation Process,
Butterworth Heinemann, London, 2002.

23
[9] Holland & Chapman, Pumping of Liquids. Reinhold Publishing Corporation,
New york, 1966.
[10] Tate, M. & Garpen, J. The specific gravity of biodiesel and its blends with
diesel fuel. JAOCS, 2000, 77(2), 115-119.
[11] Bhale, P.V., Deshpande, N.V. & Thombre, S.B.. Improving the low
temperature properties of biodiesel fuel. Renewable Energy,2009, 34(3), 794-800.
[12] Tate, M. & Garpen, J. The kinematic viscosity of biodiesel and its blends with
diesel fuel. JAOCS, 2000, 76(12), 1511-1513.
[13] Albuquerque M, Machado Y, Torres A, Azevedo D, Cavalcante Jr, Firmiano L
and Parente Jr, 2009. Properties of biodiesel oils formulated using different
biomass sources and their blends. Renewable Energy 2009, 34(3), 857-859.
[14] Grunberg L, Nissan AH.. Mixture law for viscosity. Nature , 1949, 164, 799-
800.
[15] Riazi, M.R. & Al-Otaibi, G.N. Estimation of viscosity of liquid hydrocarbon
systems. Fuel, 2001, 80(1), 27-32.
[16] Tat, M. and Gerpen, J. The Kinematic Viscosity of Biodiesel and its blends
with Diesel Fuel, JAOCS, 1999, 76(12), 1511-1513
[17] Joshi M., R. and Pegg, J. Flow properties of biodiesel fuel blends at low
temperatures. Fuel, 2007, 86, 143–151
[18] Krisnangkura, K., Yimsuwan, T. & Pairintra, R. An empirical approach in
predicting biodiesel viscosity at various temperatures. Fuel, 2006, 85(1), 107-113.
[19] Yamane K., Ueta A., & Shimamaoto Y. Influence of physical and chemical
Properties of biodiesel fuels on injection, combustion, and exhaust emission
characteristics in a direct injection compression ignition engine. Proceedings of
the Institution of Mechanical Engineers, Part D: Journal of Engine research, 2001,
2(4), 249-261.
[20] BS EN 3675, Crude petroleum and liquid petroleum products -- Laboratory
determination of density -- Hydrometer method. The Institute of petroleum and
BSI 1996
[21] BS EN ISO 3104:1996, Methods of test for Petroleum and its products:
Transparent and opaque liquids- Determination of kinematic viscosity and
calculation of dynamic viscosity. The Institute of petroleum and BSI 1996
[22] Hiroyasu H, Arai M, Tabata M.. Empirical Equations for the Sauter Mean
Diameter of a diesel Spray, 1989, SAE paper 890464

24
[23] Bannikov, M. et al. Investigation of the Characteristics of the Fuel Injection
Pump of a Diesel Engine Fuelled with Viscous Vegetable Oil-Diesel Oil Blends.
Proceedings of the Institution of Mechanical Engineers, Part D: Journal of
Automobile Engineering, 2006, 220(6), 787-792.
[24] Hiroyasu, H., Diesel Engine Combustion and its Modelling. In Diagnostics and
modelling of combustion in Reciprocating Engines, pp. 53-75, CoMODIA 85 ,
Proceedings of Symposium, Tokyo, Sept. 4-6, 1985.
[25] Baumgarten, C. 2006. Mixture Formation in Internal Combustion Engines,
Springer, Verlag Berlin Heidelberg, 2006.
[26 ] Gao Y, Gao Y, Deng J, Chunwang L, Fengling D, Zhuo L, et al.
Experimental study of the spray characteristics of biodiesel based on inedible
oil. Biotechnology Advances 2009, 27(5), 616-624.
[27] Park, S.H., Suh, H.K. & Lee, C.S., 2010. Nozzle flow and atomization
characteristics of ethanol blended biodiesel fuel. Renewable Energy, 35(1), 144-
150.