download (3469kb) - university of huddersfield repository
TRANSCRIPT

University of Huddersfield Repository
Bedford, Susan
The Application of Microwave Heating Methods in Pharmaceutical Formulations
Original Citation
Bedford, Susan (2011) The Application of Microwave Heating Methods in Pharmaceutical Formulations. Doctoral thesis, University of Huddersfield.
This version is available at http://eprints.hud.ac.uk/id/eprint/12905/
The University Repository is a digital collection of the research output of theUniversity, available on Open Access. Copyright and Moral Rights for the itemson this site are retained by the individual author and/or other copyright owners.Users may access full items free of charge; copies of full text items generallycan be reproduced, displayed or performed and given to third parties in anyformat or medium for personal research or study, educational or notforprofitpurposes without prior permission or charge, provided:
• The authors, title and full bibliographic details is credited in any copy;• A hyperlink and/or URL is included for the original metadata page; and• The content is not changed in any way.
For more information, including our policy and submission procedure, pleasecontact the Repository Team at: [email protected].
http://eprints.hud.ac.uk/

The Application of Microwave Heating Methods in
Pharmaceutical Formulations
Bedford, S.L PhD
2011
The Application of Microwave Heating Methods in Pharmaceutical
Formulations
Susan Louise Bedford
Thesis submitted to the University of Huddersfield in the partial fulfilment of the degree of Doctor of
Philosophy

I certify that this work has not been accepted in substance for any degree, and is not concurrently submitted for any degree other than that of Doctor of Philosophy (PhD) of the University of Huddersfield. I also declare that this work is the result of my own investigations except where otherwise stated.
Quorum, ita texturae ceciderunt mutua contra ut cava conveniant plenis haec illius illa huiusque inter se, iunctura haec optima constat (Titus Lucretius Caro, 96-55 BC, De Rerum Natura, Liber VI). Bodies, that interact in structural harmony to fill each other’s voids, combine most perfectly (Translation by James Grant, 1896-1966, English poet).
Acknowledgements
I would like to thank my supervisors, Dr Laura Waters and Dr Gareth
Parkes for their support, help and for being there to guide me through the
most testing times of this research project. Without their understanding,
enthusiasm and continuous confidence in my capabilities the last three
years would have been considerably harder.
I owe an exceptional amount to my family, especially my mother and
fiancé. Without your help, support, encouragement, and ability to keep me
going when times were hard, I would not be in the position I find myself in
today.
Many thanks go to the technical staff at the Department of Chemical and
Biological Sciences at the University of Huddersfield.
I would also like to acknowledge the financial support of the Department of
Chemical and Biological Sciences, University of Huddersfield.

This thesis is dedicated to the memory of my father,
Robert Bedford.

Publication
Influence of lipophilicity on drug-cyclodextrin interactions: A
calorimetric study, Waters, LJ, Bedford, S, Parkes, GMB, Mitchell,
JC, Thermochimica Acta, 511, 102-106, 2010
Controlled Microwave Processing Applied to the Pharmaceutical
Formulation of Ibuprofen, Waters, LJ, Bedford, S, Parkes,
American Association of Pharmaceutical Scientists, 1-6, 2011

Contents
Chapter 1: Introduction
1.1 What are pharmaceuticals? 1
1.2 How are drugs delivered 2
1.2.1 The therapeutic window 2
1.2.2 Methods of drug delivery 3
1.2.3 The requirement for formulation 3
1.2.4 Excipients 4
1.3 Formulation methods 4
1.3.1 Solid dispersions 7
1.3.2 Fusion methods 7
1.3.3 Solvent method 8
1.3.4 Melt-solvent method 8
1.3.5 Microwave assisted formulation 9
1.3.6 Conventional heating 9
1.3.7 Microwave heating 10
1.3.7.1 Instrumentation of the microwave oven 14
1.4 Techniques used in the analysis of pharmaceutical formulations 15
1.4.1 Isothermal titration calorimetry 16
1.4.1.1 Instrumentation 17
1.4.2 Differential scanning calorimetry 18
1.4.3 Thermal activity monitor 19
1.4.3.1 Instrumentation 21
1.4.4 Scanning electron microscope 22
1.4.4.1 SEM instrumentation 22
1.4.5 Dissolution analysis 24
1.4.5.1 Methods of dissolution 25
1.4.5.2 Instrumentation 26

1.4.5.3 Buffers 26
1.5 Materials used in this research 27
1.5.1 Excipients 31
1.6 Aims 35
References 36
Chapter 2: Materials and Methods
2.1 Materials 52
2.2.1 Formulation methods 52
2.2.1.2 Conventional heating 53
2.2.1.4 Microwave heating 53
2.2.2.1 Isothermal titration calorimetry 61
2.2.2.2 Differential scanning calorimetry 64
2.2.2.3 Thermal activity monitor 64
2.2.2.4 Scanning electron microscope 65
2.2.2.5 Drug dissolution analysis 65
References 68
Chapter 3: Drug-Excipient Binding
3.1 Introduction 69
3.1.1 Overview of ITC 69
3.2 Previous research 71
3.3 Experimental 72
3.4 Results and discussion 72
3.4.1 Ibuprofen and BCD 74
3.4.2 Ibuprofen and 2HPBCD 75
3.4.3 Ketoprofen and BCD 75
3.4.4 Ketoprofen and 2HPBCD 76
3.4.5 Flurbiprofen and BCD 76
3.4.6 Flurbiprofen and 2HPBCD 77
3.4.7 Comparison between ibuprofen, ketoprofen and flurbiprofen 78
3.5 Overall summary 79
References 80
Chapter 4: Compatibility of Drugs with Excipients
4.1 Differential scanning calorimetry 82
4.1.1 Pure compounds 83
4.1.2 Ibuprofen and SA 89
4.1.3 Ibuprofen and BCD 90
4.1.4 Ibuprofen and 2HPBCD 93
4.1.5 Ibuprofen and PVP 95
4.1.6 Ketoprofen and SA 99
4.1.7 Ketoprofen and BCD 101
4.1.8 Ketoprofen and 2HPBCD 103
4.1.9 Ketoprofen and PVP 104
4.1.10 Flurbiprofen and SA 106
4.1.11 Flurbiprofen and PVP 108
4.1.12 Paracetamol and SA 110
4.1.13 Paracetamol and BCD 111
4.1.14 Paracetamol and 2HPBCD 113
4.1.15 Paracetamol and PVP 115
4.2 Scanning electron microscope 116
4.2.1 Comparison of pure compounds 116
4.2.2 Different formulations 120
4.2.3 Summary 130
4.3 Thermal activity monitor, ibuprofen 130
References 136

Chapter 5: Drug Release
5.1 Introduction 137
5.2 Ibuprofen, ketoprofen and flurbiprofen drug release in water 138
5.3.1 The effects of the presence of water during formulation 145
5.3.2 The influence of microwave heating compared to conventional 156
5.3.3 Excipients 166
5.3.4 Summary 167
5.4.1 The effects of water on the release profile of ketoprofen 167
5.4.2 The influence of microwave heating compared to conventional 175
5.4.3 Excipients 183
5.4.4 Summary 184
5.5.1 The effects of water on the release profile of flurbiprofen 184
5.5.2 The influence of microwave heating compared to conventional 191
5.5.3 Excipients 196
5.5.4 Summary 197
5.6.1 The influence of microwave heating compared to conventional 197
5.6.2 Excipients 206
5.6.3 Summary 206
References 207
Chapter 6: Conclusions and Future Work
6.1 Conclusions 209
6.2 Future work 218

Abstract
This study investigated the potential application of formulating pharmaceutical products using
microwave heating methods alongside associated analytical investigations. Firstly, the
interaction between three functionally related drugs, ibuprofen, ketoprofen and flurbiprofen, with
two distinct forms of cyclodextrin at three temperatures, 298, 303 and 310K was investigated
using isothermal titration calorimetry (ITC). In all cases, the associated changes in Gibbs free
energy, enthalpy, and entropy are presented along with the stoichiometry and binding constant.
It was found that binding always occurred at a 1:1 ratio with an associated negative enthalpy
and Gibbs free energy with the formation of the complex enthalpically, rather than entropically
driven. The data further demonstrated a clear relationship between the thermodynamic
behaviour and logP of the drug molecules and provides an insight into the chemistry of drug-
excipient binding for the compounds under investigation in this work.
Secondly, four drugs, ibuprofen, ketoprofen, flurbiprofen and paracetamol were
formulated using microwave and conventional heating, with and without the presence of water,
with four excipients, namely, stearic acid (SA), β-cyclodextrin (BCD), 2-(hydroxypropyl)-β-
cyclodextrin (2HPBCD) and polyvinylpyrrolidone (PVP). Three different analytical techniques
were employed to determine whether the formulation method made a significant difference to
the appearance and behaviour of the product. For example, the thermal behaviour of the drug
and excipient, was investigated by differential scanning calorimetry (DSC). Scanning electron
microscopy was utilised to determine if the formulation method illustrated any physical
differences between the formulations and lastly, a thermal activity monitor was used to
investigate the stability of the different formulations. Overall, it was found that the formulation
method can make a significant difference to the character of the resultant formulations with a
change in thermal behaviour or physical appearance observed in certain formulations but with a
consistent stability seen across all products.
Lastly, each of the resultant formulations were subjected to dissolution analysis to
determine if the presence of water or choice of heating method, i.e. conventional heating vs.
microwave heating affected the dissolution profile obtained. It was found that in the majority of
cases water increased drug dissolution, which may have occurred because of a reduction in
particle size. In summary, the application of microwave heating for pharmaceutical formulations
has been thoroughly investigated and found to be a potential alternative to conventional heating
with several distinct benefits for industry and the patient.

List of Tables Chapter One
Table 1.2.2.1: Examples of drug delivery systems
Table 1.5.1 – Structural summary of the four drugs used
Table 1.5.2 – Summary of chemical properties of the drugs used in this work
Table 1.5.3 – Pharmaceutical properties of the drugs used in this research
Table 1.5.1.1 – Summary of the four different excipients employed for this research
Chapter Three
Table 3.4.1 – All ITC data conducted with ibuprofen, ketoprofen and flurbiprofen binding
to BCD and 2HPBCD
Chapter Four
Table 4.2.2.1 – Summary of SEM results obtained for the different ibuprofen
formulations
Table 4.2.2.2 – Summary of SEM results obtained for the different ketoprofen
formulations
Table 4.2.2.3 – Summary of SEM results obtained for the different flurbiprofen
formulations
Table 4.2.2.4 – Summary of SEM results obtained for the different paracetamol
formulations
Chapter Five
Table 5.3.1.1 – Rate of release of ibuprofen from SA when prepared with or without the
presence of water during microwave formulation
Table 5.3.1.2 – Rate of release of ibuprofen from PVP, 1:9 when prepared with or
without the presence of water during formulation
Table 5.3.1.3 – Rate of release of ibuprofen from SA, when prepared with or without the
presence of water during conventional formulating
Table 5.3.1.4 – Rate of release of ibuprofen from BCD, when prepared with or without
the presence of water during formulation

Table 5.3.1.5 – Rate of release of ibuprofen from PVP, when prepared with or without
the presence of water during formulation
Table 5.3.1.6 – Rate of release of ibuprofen from BCD, when prepared with or without
the presence of water during formulation
Table 5.3.1.7 – Rate of release of ibuprofen from BCD, when prepared with or without
the presence of water during formulation
Table 5.3.1.8 –A summary to indicate conditions that created the greatest drug release
for ibuprofen with the four different excipients formulated with and without the presence
of water over a ninety minute time period
Table 5.3.2.1 – Rate of release of ibuprofen from SA, microwave heating compared with
conventional heating
Table 5.3.2.2 – Rate of release of ibuprofen from BCD 1:1, microwave heating
compared with conventional heating
Table 5.3.2.3 – Rate of release of ibuprofen from BCD 1:1, microwave heating
compared with conventional heating
Table 5.3.2.4 – Rate of release of ibuprofen from PVP 1:1, microwave heating
compared with conventional heating
Table 5.3.2.5 – Rate of release of ibuprofen from SA, microwave heating compared with
conventional heating
Table 5.3.2.6 – Rate of release of ibuprofen from HPBCD, microwave heating compared
with conventional heating
Table 5.3.2.7 – Rate of release of ibuprofen from PVP, microwave heating compared
with conventional heating
Table 5.3.2.8 – Rate of release of ibuprofen from PVP, microwave heating compared
with conventional heating
Table 5.3.2.9 –A summary to indicate conditions that created the greatest drug release
for ibuprofen and the different excipients analysed for differences between microwave
and conventional heating over a ninety minute time period
Table 5.4.1.1 Rate of release of ketoprofen from SA, when prepared with or without the
presence of water during microwave formulation
Table 5.4.1.2 Rate of release of ketoprofen from SA, when prepared with or without the
presence of water during conventional formulation
Table 5.4.1.3 Rate of release of ketoprofen from BCD, 1:9 when prepared with or
without the presence of water during conventional formulation
Table 5.4.1.4 Rate of release of ketoprofen from BCD, 1:1 when prepared with or
without the presence of water during microwave formulation
Table 5.4.1.5 Rate of release of ketoprofen from BCD, 1:9 when prepared with or
without the presence of water during microwave formulation
Table 5.4.1.6- A summary to indicate conditions that created the greatest drug release
for ketoprofen with the four different excipients formulated with and without the
presence of water over a ninety minute time period
Table 5.4.2.1- Rate of release of ketoprofen from SA, microwave heating compared with
conventional heating
Table 5.4.2.2- Rate of release of ketoprofen from SA, microwave heating compared with
conventional heating
Table 5.4.2.3- Rate of release of ketoprofen from BCD 1:9, microwave heating
compared with conventional heating
Table 5.4.2.4- Rate of release of ketoprofen from 2HPBCD 1:9, microwave heating
compared with conventional heating
Table 5.4.2.5- Rate of release of ketoprofen from PVP 1:9, microwave heating
compared with conventional heating
Table 5.4.2.6- Rate of release of ketoprofen from BCD 1:1, microwave heating
compared with conventional heating
Table 5.4.2.7- A summary to indicate conditions that created the greatest drug release
for ketoprofen and the excipients analysed for differences between microwave and
conventional heating
Table 5.5.1.1 Rate of release of flurbiprofen from SA when prepared with or without the
presence of water during formulation
Table 5.5.1.2 Rate of release of flurbiprofen from SA when prepared with or without the
presence of water during formulation

Table 5.5.1.3 Rate of release of flurbiprofen from PVP 1:1 when prepared with or
without the presence of water during formulation
Table 5.5.1.4 Rate of release of flurbiprofen from PVP 1:9 when prepared with or
without the presence of water during formulation
Table 5.5.1.5 Rate of release of flurbiprofen from PVP 1:9 when prepared with or
without the presence of water during formulation
Table 5.5.1.6 – A summary to indicate conditions that created the greatest drug release
for flurbiprofen with the two different excipients formulated with and without the
presence of water over a ninety minute time period
Table 5.5.2.1- Rate of release of flurbiprofen from PVP 1:1, microwave heating
compared to conventional heating
Table 5.5.2.2- Rate of release of flurbiprofen from PVP 1:1, microwave heating
compared with conventional heating
Table 5.5.2.3- Rate of release of flurbiprofen from PVP 1:1, microwave heating
compared with conventional heating
Table 5.5.2.4 - Rate of release of flurbiprofen from PVP 1:9, microwave heating
compared with conventional heating
Table 5.5.2.5 – A summary to indicate conditions that created the greatest drug release
for flurbiprofen with excipients analysed for differences between microwave and
conventional heating
Table 5.6.1.1 - Rate of release of Paracetamol from SA, microwave heating compared
with conventional heating
Table 5.6.1.2 - Rate of release of Paracetamol from PVP 1:1, microwave heating
compared with conventional heating
Table 5.6.1.3 - Rate of release of Paracetamol from HPBCD 1:9, microwave heating
compared with conventional heating
Table 5.6.1.4 - Rate of release of Paracetamol from BCD 1:1, microwave heating
compared with conventional heating
Table 5.6.1.5 - Rate of release of paracetamol from BCD 1:9, microwave heating
compared with conventional heating

Table 5.6.1.6 - Rate of release of paracetamol from BCD 1:9, microwave heating
compared with conventional heating
Table 5.6.1.7 – Summary to indicate conditions that created the greatest drug release
for paracetamol and excipients analysed for differences between microwave and
conventional heating

List of Figures Chapter One
Figure 1.2.1.1: Therapeutic Drug Plasma Concentration Time Profile
Figure 1.3.1: The major formulation methods for tablets and capsules
Figure 1.3.6.1 – Illustration of thermal conduction
Figure 1.3.7.1: Diagram of the electromagnetic wave
Figure 1.3.7.2: Illustration of Ohmic and Frictional Heating in Solids and Liquids
Figure 1.3.7.3 Interactions of materials with microwave energy
Figure 1.3.7.4: Illustration of thermal run-away under microwave heating
Figure 1.4.1.1.1 – A typical ITC cell
Figure1.4.3.1: Heat flow principle
Figure 1.4.4.1.1 – Illustration of SEM instrumentation
Figure 1.5.1.1: Structure of Stearic acid
Figure 1.5.1.2 – Structure of β-cyclodextrin, front and side view
Figure 1.5.1.3 Structure of β-cyclodextrin
Figure 1.5.1.4: Structure of PVP
Chapter Two
Figure 2.2.1.1: Illustration of dry and wet formulation process carried out using
microwave and conventional heating.
Figure 2.2.1.2 – Microwave and Control unit
Figure 2.2.1.3 – Microwave Cavity
Figure 2.2.1.4 - The above graph shows the heating of ibuprofen and PVP, 1:1 without
water
Figure 2.2.1.5 – The above graph shows the heating of ibuprofen and BCD, 1:1 with
water
Figure 2.2.1.6 – The above graph shows the heating of ketoprofen and BCD, 1:9
without water
Figure 2.2.1.7 – The above graph shows the heating of ketoprofen and BCD, 1:9 with
water

Figure 2.2.1.8 – The above graph shows the heating flurbiprofen and PVP, 1:9 without
water
Figure 2.2.1.9 – The above graph shows the heating of flurbiprofen and PVP, 1:9 with
water
Figure 2.2.1.10 – An illustration of temperature monitoring (red line) using the
conventional heating method, in this case for flurbiprofen and PVP, 1:1 with water
Figure 2.2.2.1.1- A typical ITC graph displaying the raw data and calculated data for a
drug-excipient interaction, in this case ketoprofen at 298K with BCD
Figure 2.2.2.5.1 Systematic diagram of the dissolution apparatus
Figure 2.2.2.5.2 – Dissolution Bath
Figure 2.2.2.5.3 – Bath, pump and UV
Chapter Three
Figure 3.1.1.1 – A typical ITC titration curve including raw data and calculated values for
barium chloride and 18-crown-6
Chapter Four
Figure 4.1.1.1 - DSC trace for pure ibuprofen
Figure 4.1.1.2 - DSC trace for pure ketoprofen
Figure 4.1.1.3 - DSC trace for pure flurbiprofen
Figure 4.1.1.4 - DSC trace for pure stearic acid (SA)
Figure 4.1.1.5 - DSC trace for pure β-cyclodextrin (BCD)
Figure 4.1.1.6 - DSC trace for pure 2-hydroxypropyl-β-cyclodextrin (2HPBCD)
Figure 4.1.1.7 - DSC trace for pure polyvinylpyrrolidone (PVP)
Figure 4.1.2.1 - DSC trace for microwave ibuprofen and stearic acid (SA) without water
present in the formulation process
Figure 4.1.3.1 - Microwave formulated ibuprofen and BCD, 1:1 without water present in
the formulation process
Figure 4.1.3.2 - Microwave formulated ibuprofen and BCD, 1:9 without water present in
the formulation process

Figure 4.1.4.1 - Microwave formulated ibuprofen and 2HPBCD, 1:1 without present in
the formulation process
Figure 4.1.4.2 - Microwave formulated ibuprofen and 2HPBCD, 1:9 without water
present in the formulation process
Figure 4.1.5.1 - Microwave formulated ibuprofen and PVP 1:1 without water present in
the formulation process
Figure 4.1.5.2 - Conventional formulated ibuprofen and PVP 1:1 with water present in
the formulation process
Figure 4.1.5.3 - Microwave formulated ibuprofen and PVP, 1:9 with water present in the
formulation process
Figure 4.1.5.3 - Conventional formulated ibuprofen and PVP, 1:9 with water present in
the formulation process
Figure 4.1.6.1- Microwave formulated ketoprofen and SA, with water present in the
formulation process
Figure 4.1.6.2 - Conventional formulated ketoprofen and SA, without water present in
the formulation process
Figure 4.1.7.1 - Microwave formulated ketoprofen and BCD, 1:1 without water present in
the formulation process
Figure 4.1.7.2 – Microwave formulated ketoprofen and BCD, 1:9 without water present
in the formulation process
Figure 4.1.8.1 - Microwave formulated ketoprofen and 2HPBCD 1:1, without water
present in the formulation process
Figure 4.1.8.4 - Conventional formulated ketoprofen and 2HPBCD, 1:9 without water
present in the formulation process
Figure 4.1.9.1 – Microwave formulated ketoprofen and PVP, 1:1 without water present
in the formulation process
Figure 4.1.9.2 - Microwave formulated ketoprofen and PVP, 1:9 with water present in
the formulation process
Figure 4.1.10.1- Microwave formulated flurbiprofen and SA, 1:3 with water present in
the formulation process

Figure 4.1.10.2 - Conventional formulated flurbiprofen and SA, 1:3 without water
present in the formulation process
Figure 4.1.11.1 - Microwave formulated flurbiprofen and PVP, 1:1 without water present
in the formulation process
Figure 4.1.11.2 - Microwave formulated flurbiprofen and PVP, 1:9 with water present in
the formulation process
Figure 4.1.12.1 – Microwave formulated paracetamol and SA, 1:3 without water present
in the formulation process
Figure 4.1.12.2-Conventional formulated paracetamol and SA, 1:3 without water present
in the formulation process
Figure 4.1.13.1 - Paracetamol and BCD, 1:1 formulated using microwave heating
without the presence of water
Figure 4.1.13.2 - Paracetamol and BCD, 1:1 formulated using microwave heating
without the presence of water
Figure 4.1.14.1 – Microwave formulated paracetamol and 2HPBCD, 1:1 without water
present in the formulation process
Figure 4.1.14.2 – Microwave formulated paracetamol and 2HPBCD, 1:9 without water
present in the formulation process
Figure 4.2.1 -SEM image for pure ibuprofen, magnification x300
Figure 4.2.2 – SEM image for pure ketoprofen, magnification x300
Figure 4.2.3 – SEM image for pure flurbiprofen, magnification x300
Figure 4.2.4 – SEM image for pure paracetamol, magnification x300
Figure 4.2.5 - SEM image for pure stearic acid (SA), magnification x300
Figure 4.2.6 - SEM image for pure β-cyclodextrin (BCD), magnification x300
Figure 4.2.7 – SEM image for pure hydroxypropyl-β-cyclodextrin (2HPBCD),
magnification x300
Figure 4.2.8 – SEM image for pure polyvinylpyrrolidone (PVP), magnification x300
Figure 4.2.2.1 - Microwave formulated ibuprofen and BCD, 1:1 ratio, with water present
during formulation, magnification x85
Figure 4.2.2.2 - Microwave formulated ibuprofen and 2HPBCD 1:1 ratio, without water
present during formulation, magnification x85
Figure 4.2.2.3 - Microwave formulated ibuprofen and PVP 1:9 ratio, without water
present during formulation, magnification x85
Figure 4.2.2.4 - Microwave formulated ketoprofen and BCD 1:1 ratio, with water present
during formulation, magnification x85
Figure 4.2.2.5 - Microwave formulated ketoprofen and BCD 1:9 ratio, without water
present during formulation, magnification x85
Figure 4.2.2.6 - Microwave formulated ketoprofen and PVP 1:1 ratio, with water present
during formulation, magnification x85
Figure 4.2.2.7 - Microwave formulated ketoprofen and PVP 1:1 ratio, without water
present during formulation, magnification x85
Figure 4.2.2.8 - Microwave formulated flurbiprofen and PVP 1:1, without water present
during formulation, magnification x85
Figure 4.2.2.9 - Microwave formulated flurbiprofen and PVP 1:9, with water present
during formulation, magnification x85
Figure 4.2.2.10 - Conventionally formulated paracetamol and BCD 1:1 ratio, without
water present during formulation, magnification x85
Figure 4.2.2.11 - Microwave formulated paracetamol and 2HPBCD 1:9 ratio, without
water present during formulation, magnification x85
Figure 4.2.2.12 - Microwave formulated paracetamol and PVP 1:9 ratio, without water
present during formulation, magnification x85
Figure 4.3.1 - Pure Ibuprofen, held at 30°C, 0% relative humidity
Figure 4.3.2 - Ibuprofen with SA, held at 30°C, 0% relative humidity, formulated using
the microwave method with water present during formulation
Figure 4.3.3 - Ibuprofen with BCD, 1:1 ratio, held at 30°C, 0% relative humidity,
formulated using the conventional method with water present during formulation
Figure 4.3.4 - Ketoprofen with PVP, 1:1 ratio, held at 30°C, 0% relative humidity,
formulated using the microwave method with water present during formulation
Figure 4.3.5 - Flurbiprofen with PVP, 1:1 ratio, held at 30°C, 0% relative humidity,
formulated using the microwave method without water present during formulation
Figure 4.3.6 - Paracetamol with BCD, 1:1 ratio, held at 30°C, 0% relative humidity,
formulated using the microwave method without water present during formulation

Chapter Five
Figure 5.1.1 – A drug release profile for Ibuprofen and BCD, 1:1 ratio, displaying the full
four hours of data
Figure 5.2.1 – A drug release profile for Ibuprofen and BCD, 1:9 ratio, highlighting the
improved release in the presence of the excipient
Figure 5.2.2 – A drug release profile for Ibuprofen and 2HPBCD 1:9 ratio highlighting
the improved release in the presence of the excipient
Figure 5.2.3 – A drug release profile for ketopofen and PVP, ratio 1:9 using both
microwave and conventional heating methods compared with ketoprofen alone
Figure 5.2.4 – A drug release profile for ketopofen and SA, ratio 1:3 using both
microwave and conventional heating methods compared with ketoprofen alone
Figure 5.2.5 – A drug release profile for flurbiprofen and SA, ratio 1:3 using microwave
heating and conventional heating compared with flurbiprofen alone
Figure 5.3.1.1 – A drug release profile for Ibuprofen and SA (ratio 1:3), formulated using
microwave heating both with and without the presence of water during the formulation
process
Figure 5.3.1.2 – A drug release profile for Ibuprofen and PVP (ratio 1:9), formulated
using conventional heating both with and without the presence of water during the
formulation process
Figure 5.3.1.3 – A drug release profile for Ibuprofen and SA (ratio 1:3), formulated using
conventional heating both with and without the presence of water during the formulation
process
Figure 5.3.1.4 – A drug release profile for Ibuprofen and BCD (ratio 1:1), formulated
using microwave heating both with and without the presence of water during the
formulation process
Figure 5.3.1.5– A drug release profile for Ibuprofen and PVP (ratio 1:9), formulated
using microwave heating both with and without the presence of water during the
formulation process
Figure 5.3.1.6 – A drug release profile for Ibuprofen and BCD (ratio 1:9), formulated
using microwave heating both with and without the presence of water during the
formulation process

Figure 5.3.1.7 – A drug release profile for Ibuprofen and BCD (ratio 1:9), formulated
using conventional heating both with and without the presence of water during the
formulation process
Figure 5.3.2.1 – A drug release profile for Ibuprofen and SA (ratio 1:3), formulated using
microwave heating and conventional heating, in both cases with water present as a
solvent
Figure 5.3.2.2 - A drug release profile for Ibuprofen and BCD (ratio 1:1), formulated
using microwave heating and conventional heating, in both cases without water present
as a solvent
Figure 5.3.2.3 – A drug release profile for Ibuprofen and BCD (ratio 1:1), formulated
using microwave heating and conventional heating, in both cases with water present as
a solvent
Figure 5.3.2.4 – A drug release profile for Ibuprofen and PVP (ratio 1:1), formulated
using microwave heating and conventional heating, in both cases without water present
as a solvent
Figure 5.3.2.5 - A drug release profile for Ibuprofen and SA, formulated using
microwave heating and conventional heating, in both cases without water present as a
solvent
Figure 5.3.2.6 – A drug release profile for Ibuprofen and HPBCD, formulated using
microwave heating and conventional heating, in both cases without water present as a
solvent
Figure 5.3.2.7 – A drug release profile for Ibuprofen and PVP (ratio 1:9), formulated
using microwave heating and conventional heating, in both cases with water present as
a solvent
Figure 5.3.2.8 – A drug release profile for Ibuprofen and BCD (ratio 1:9), formulated
using microwave heating and conventional heating, in both cases with water present as
a solvent
Figure 5.4.1.1 – A drug release profile for ketoprofen and SA (ratio 1:3), formulated
using microwave heating both with and without the presence of water during the
formulation process

Figure 5.4.1.2 – A drug release profile for ketoprofen and SA (ratio 1:3), formulated
using conventional heating both with and without the presence of water during the
formulation process
Figure 5.4.1.3 – A drug release profile for ketoprofen and BCD (ratio 1:9), formulated
using conventional heating both with and without the presence of water during the
formulation process
Figure 5.4.1.4 – A drug release profile for ketoprofen and BCD (ratio 1:1), formulated
using microwave heating both with and without the presence of water during the
formulation process
Figure 5.4.1.5 – A drug release profile for ketoprofen and BCD (ratio 1:9), formulated
using microwave heating both with and without the presence of water during the
formulation process
Figure 5.4.2.1 – A drug release profile for ketoprofen and SA (ratio 1:3), formulated
using microwaves and conventional heating, in both cases with water present as a
solvent
Figure 5.4.2.2 – A drug release profile for ketoprofen and SA (ratio 1:3), formulated
using microwaves and conventional heating, in both cases without water present as a
solvent
Figure 5.4.2.3 – A drug release profile for ketoprofen and BCD (ratio 1:9), formulated
using microwaves and conventional heating, in both cases with water present as a
solvent
Figure 5.4.2.4 – A drug release profile for ketoprofen and 2HPBCD (ratio 1:9),
formulated using microwaves and conventional heating, in both cases without water
present as a solvent
Figure 5.4.2.5 – A drug release profile for ketoprofen and PVP (ratio 1:9), formulated
using microwaves and conventional heating, in both cases without water present as a
solvent
Figure 5.4.2.6– A drug release profile for ketoprofen and BCD (ratio 1:1), formulated
using microwaves and conventional heating, in both cases without water present as a
solvent

Figure 5.5.1.1 – A drug release profile for flurbiprofen and SA (ratio 1:3), formulated
using conventional heating both with and without the presence of water during the
formulation process
Figure 5.5.1.2 – A drug release profile for flurbiprofen and SA (ratio 1:3), formulated
using microwave heating both with and without water the presence of water during the
formulation process
Figure 5.5.1.3 – A drug release profile for flurbiprofen and PVP (ratio 1:1), formulated
using microwave heating both with and without water the presence of water during the
formulation process
Figure 5.5.1.4 – A drug release profile for flurbiprofen and PVP (ratio 1:9), formulated
using microwave heating both with and without water the presence of water during the
formulation process
Figure 5.5.1.5 – A drug release profile for flurbiprofen and PVP (ratio 1:9), formulated
using conventional heating both with and without water the presence of water during the
formulation process
Figure 5.5.2.1 – A drug release profile for flurbiprofen and PVP (ratio 1:9), formulated
using microwave and conventional heating, in both cases with water present as a
solvent
Figure 5.5.2.2– A drug release profile for flurbiprofen and PVP (ratio 1:1), formulated
using microwave and conventional heating, in both cases without water present as a
solvent
Figure 5.5.2.3 – A drug release profile for flurbiprofen and SA (ratio 1:3), formulated
using microwave and conventional heating, in both cases without water present as a
solvent
Figure 5.5.2.4 – A drug release profile for flurbiprofen and PVP (ratio 1:9), formulated
using microwave and conventional heating, in both cases without water present as a
solvent
Figure 5.6.1.1 – A drug release profile for paracetamol and SA (ratio 1:3), formulated
using microwave and conventional heating, in both cases without water present as a
solvent
Figure 5.6.1.2 – A drug release profile for paracetamol and PVP (ratio 1:1), formulated
using microwave and conventional heating, in both cases without water present as a
solvent
Figure 5.6.1.3 – A drug release profile for paracetamol and 2HPBCD (ratio 1:9),
formulated using microwave and conventional heating, in both cases without water
present as a solvent
Figure 5.6.1.4 – A drug release profile for paracetamol and BCD (ratio 1:1), formulated
using microwave and conventional heating, in both cases without water present as a
solvent
Figure 5.6.1.5 – A drug release profile for paracetamol and BCD (ratio 1:9), formulated
using microwave and conventional heating, in both cases without water present as a
solvent
Figure 5.6.1.6 – A drug release profile for paracetamol and 2HPBCD (ratio 1:1),
formulated using microwave and conventional heating, in both cases without water
present as a solvent

List of Equations Chapter One
Equation 1.4.1.1 - Associated binding constant
Equation 1.4.1.2 - Standard Gibb’s Free Energy
Equation 1.4.1.3 - Standard Gibb’s Free Energy, relating enthalpy and entropy
Equation 1.4.5.1 - Noyes-Whitney
Equation 1.4.5.2 - Fick’s Law of diffusion
Equation 1.4.5.2.1 - Absorbance
Equation 1.5.1 - pKa
Equation 1.5.2 - Dissociation Constant

Chapter One
Introduction
1
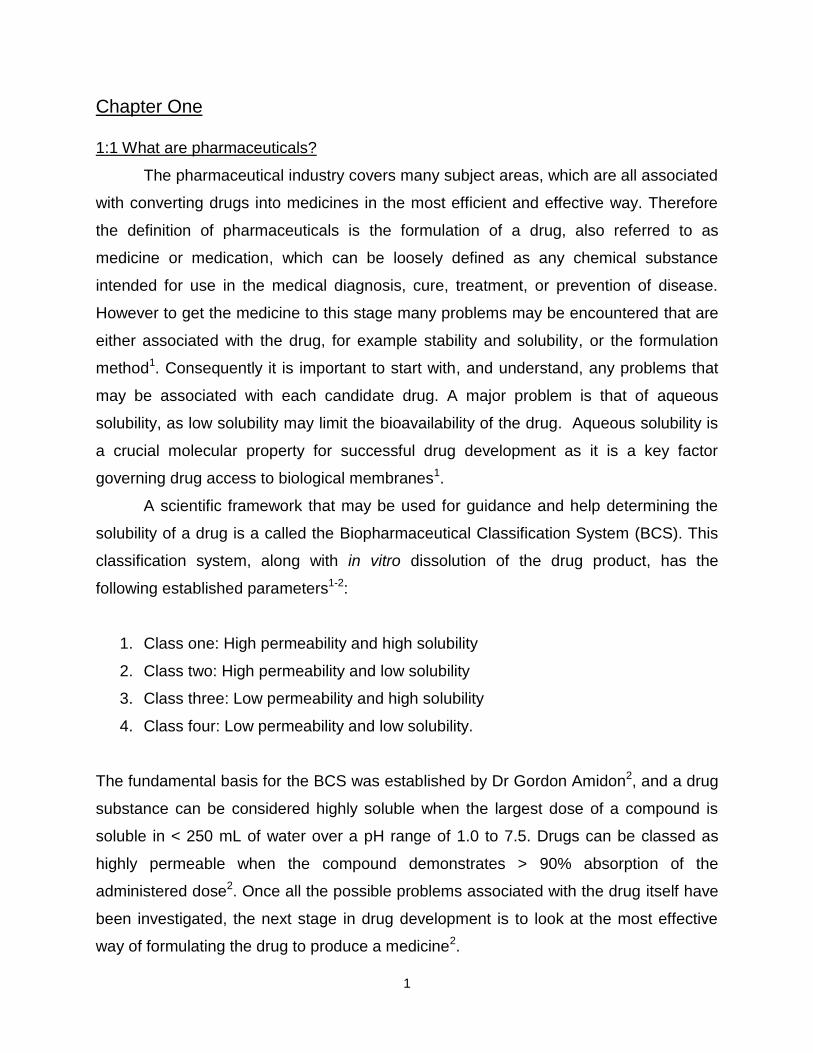
Chapter One 1:1 What are pharmaceuticals?
The pharmaceutical industry covers many subject areas, which are all associated
with converting drugs into medicines in the most efficient and effective way. Therefore
the definition of pharmaceuticals is the formulation of a drug, also referred to as
medicine or medication, which can be loosely defined as any chemical substance
intended for use in the medical diagnosis, cure, treatment, or prevention of disease.
However to get the medicine to this stage many problems may be encountered that are
either associated with the drug, for example stability and solubility, or the formulation
method1. Consequently it is important to start with, and understand, any problems that
may be associated with each candidate drug. A major problem is that of aqueous
solubility, as low solubility may limit the bioavailability of the drug. Aqueous solubility is
a crucial molecular property for successful drug development as it is a key factor
governing drug access to biological membranes1.
A scientific framework that may be used for guidance and help determining the
solubility of a drug is a called the Biopharmaceutical Classification System (BCS). This
classification system, along with in vitro dissolution of the drug product, has the
following established parameters1-2:
1. Class one: High permeability and high solubility
2. Class two: High permeability and low solubility
3. Class three: Low permeability and high solubility
4. Class four: Low permeability and low solubility.
The fundamental basis for the BCS was established by Dr Gordon Amidon2, and a drug
substance can be considered highly soluble when the largest dose of a compound is
soluble in < 250 mL of water over a pH range of 1.0 to 7.5. Drugs can be classed as
highly permeable when the compound demonstrates > 90% absorption of the
administered dose2. Once all the possible problems associated with the drug itself have
been investigated, the next stage in drug development is to look at the most effective
way of formulating the drug to produce a medicine2.
2
1.2 How drugs are delivered
Medicines are drug delivery systems and research must be continuously
undertaken to ensure that these medicines offer the most efficient, safe and convenient
way of administering the drugs incorporated in them to the site of action1.
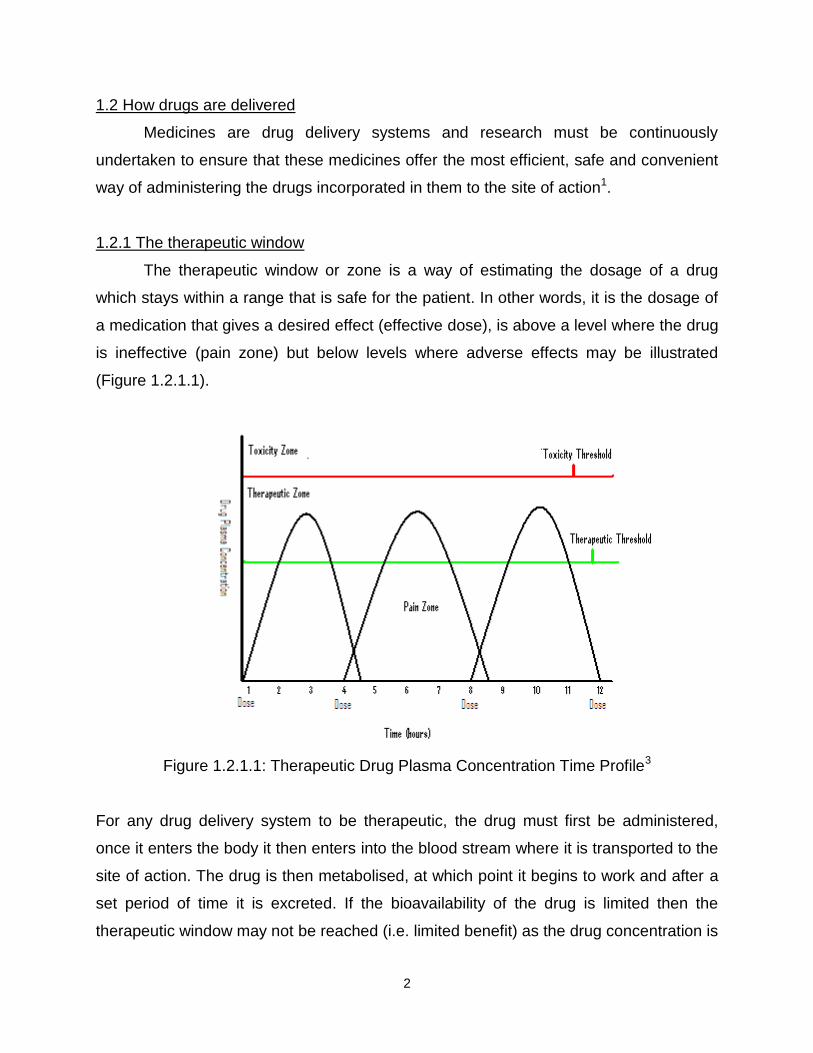
1.2.1 The therapeutic window
The therapeutic window or zone is a way of estimating the dosage of a drug
which stays within a range that is safe for the patient. In other words, it is the dosage of
a medication that gives a desired effect (effective dose), is above a level where the drug
is ineffective (pain zone) but below levels where adverse effects may be illustrated
(Figure 1.2.1.1).
Figure 1.2.1.1: Therapeutic Drug Plasma Concentration Time Profile3
For any drug delivery system to be therapeutic, the drug must first be administered,
once it enters the body it then enters into the blood stream where it is transported to the
site of action. The drug is then metabolised, at which point it begins to work and after a
set period of time it is excreted. If the bioavailability of the drug is limited then the
therapeutic window may not be reached (i.e. limited benefit) as the drug concentration is

3
too low. If however the drug delivery system causes the drug to be released too rapidly
then the concentration will exceed the upper limits of the therapeutic window and toxic
effects may occur. As a result it is exceptionally important to administer the drug in the
correct way to optimise the therapeutic benefits. To do this there are a number of drug
delivery systems available, with different routes to deliver the correct amount of drug to
the site of action.
1.2.2 Methods of drug delivery
Table 1.2.2.1 is a summary of the major drug delivery systems and the different
routes of administration for each one.
Route Example
Oral Capsules and tablets
Rectal Suppositories and creams
Topical Ointments and lotions
Parenteral Injections and implants
Respiratory Inhalations and sprays
Nasal Inhalations and solutions
Eye Solutions and creams
Ear Solutions and creams
Table 1.2.2.1: Examples of drug delivery systems1
The oral route is the most common form of administration, with tablets and capsules the
most likely drug delivery system to be encountered. However, there are also a number
of problems associated with this type of administration, for example the stability and
solubility of the drug can be an issue.
1.2.3 The requirement for formulation
Each of the above delivery methods will have a number of requirements so that
the drug is effective. The drug may need protection to prevent it from being metabolised
before it reaches the target site1. The drug will have to be released at a certain rate so
that the levels remain within the therapeutic zone for the optimum amount of time plus it
may have to overcome problems associated with solubility, and possibly stability. As a
result, depending on the drug and mode of delivery, the pharmaceutical active is rarely

4
used in the pure form but combined with one or more materials called excipients
(inactive part of the medication)4.
1.2.4 Excipients
Excipients are added to the formulation for a number of reasons. They may
function, for example, as an antimicrobial preservative, a solubility enhancer, a stability
enhancer or a taste masker, to name a few1. As a result the International
Pharmaceutical Excipients Council (IPEC) has defined a pharmaceutical excipient as:
Any substance other than the active drug which has been appropriately evaluated for
safety and is included in a drug delivery system to either4:
1. Aid processing of the system during manufacture, or
2. Protect, support or enhance stability, bioavailability or patient acceptability, or
3. Assist in product identification, or
4. Enhance any other attribute of the overall safety and effectiveness of the drug
product during storage or use.
Each additive must have clear justification for inclusion into the formulation and must
perform a defined function in the presence of the active component and any other
excipient present in the formulation. Each excipient must be shown to be compatible
with the formulation and effectively perform its desired function in the product4. Above
all it must not be toxic to humans after consumption and not affect the bioavailability of
the drug. After the choice of drug and excipients have been established the next stage
in development is a formulation method that will enable these components to interact
and work together to produce the final product medicine4.
1.3 Formulation methods
Along with the importance of choice of the excipient, the way the drug and
excipient are mixed together becomes important. This is known as the formulation
method, and because the type of dosage form and its method of preparation can
influence drug dissolution and consequently the bioavailability of the drug, the

5
formulation method must not affect these key parameters. Therefore the method must
be optimal and not cause any problems with the final product4.
There are a number of different methods available and the choice is dependent
on the type of dosage form that is required, for example any injected medication needs
to be in solution and as a result the solubility and stability of this type of formulation is
critical4,5. Therefore the choice of excipients and the formulation method must ensure
that the active remains within solution but is also protected and stable until the site of
action is reached4,5. The following diagram is an illustration of the different types of
formulation methods that can be used to formulate tablets and capsules (Figure 1.3.1).

6
Figure 1.3.1: The major formulation methods for tablets and capsules1.
Active pharmaceutical ingredient (API) and
Excipients
Wet
Granulation
Dry
Granulation
Direct
Compression Melt Spray Drying Freeze
Drying
Blend Blend
Blend
Blend Blend
Blend
Mix/Dissolve/Suspend
Dry
Mill/Size
Blend
Mill/Size
Compact
Melt/Dissolve
Congeal
Mill/Size
Dissolve/Suspend
Spray/Dry
Dissolve
Freeze
Vacuum/Dry
Finished Dosage Form
Capsule
Filling
Tabletting
Compact
Coating
Dissolve/Suspend
Spray/Dry

7
The focus of this research specifically considers an adaptation of the melt method to
formulate drugs with excipients to produce solid dispersions.
1.3.1 Solid dispersions
One way to overcome the problem of poorly aqueous soluble drugs is to mix with
particular excipients producing what is now commonly known as a solid dispersion.
The first solid dispersion was developed in 1961 by Sekiguchi and Obi6-8. Their
research found that by melting Sulfathiazole with urea and cooling the mixture in an ice
bath a solid dispersion was produced that enhanced the absorption of the drug6.
Sekiguchi then extended this work in 1964, with the fusion method used to prepare
chloramphenicol and urea to improve formulations with this drug7.
In 1966, Arthur Goldberg and his team confirmed that the drug may be
molecularly dispersed in a matrix, forming a solid solution. Subsequent investigation
then went into a wide range of drugs and methods to produce solid dispersions9-14. As a
result, a solid dispersion is now defined as:
The dispersion of one or more active ingredients in an inert excipient or matrix,
where the active ingredient could exist in a finely crystalline, solubilised or
amorphous state15-18.
Solid dispersions can be formulated in the following three ways14-16: the Fusion method,
the Solvent method, and the Melt-Solvent method.
1.3.2 Fusion method
The first fusion method consisted of a physical mixture of a drug and a water
soluble carrier, which were heated directly until both melted. The melted mixture was
then cooled and solidified rapidly in an ice bath whilst stirred. Finally, the solid mass
was then crushed, pulverised and sieved. An advantage of this method includes its
simplicity and disadvantages included that the drug and/or excipients may decompose,
or evaporate, at temperatures sufficient to melt either or both components6-7,14.

8
1.3.3 Solvent method
For the solvent method, the physical mixture of the drug and carrier are dissolved
in a common solvent followed by evaporation leaving the solid dispersion of the drug in
the carrier. Advantages for this method include the thermal decomposition of drugs or
carriers can be prevented because low temperatures are required for the evaporation of
organic solvents. Disadvantages include the high cost of preparation, difficulty in
removing solvent completely, possible adverse effects of solvent on the stability of
drugs, and also difficulty in reproducing crystal forms14,16,19.
1.3.4 Melt-Solvent method
For this method the drug is first dissolved in a suitable solvent, and then
incorporated directly into a melt of a chosen excipient.
Over the past fifty years the three methods discussed, have received much
interest including different ways of mixing drugs with different excipients to produce a
solid dispersion14,20-31.
Although solid dispersions have been extensively studied, their application in
drug development has only become significant in the last twenty years. This is because
of the discovery of more and more poorly soluble drugs that are now under
development. Common strategies such as particle size reduction, salt formation, and
solubilisation in organic solvents, are not always successful at achieving the desired
dissolution and absorption enhancement for a drug4.
Current issues that impede the commercial development of solid dispersions
include: problems in scaling up from the laboratory to industrial manufacture, difficulty in
controlling physicochemical properties, difficulty in delivering solid dispersion
formulations as tablets or capsules, and physical and chemical instability of drug and/or
excipients4.
Despite these potential issues, solid dispersions still remain a viable way to improve
current problems within formulation of drugs. As previously discussed there has been
much research into solid dispersions, however little is known with respect to the
potential of microwave heating for this method of formulation. This consequently forms
the basis of the current project.

9
1.3.5 Microwave assisted formulation
A research paper published in 2003 by Bergese et al27 reported that by heating a
drug and an excipient, solid state diffusion may occur between the two components.
Furthermore, this diffusion may be enhanced by the use of microwave heating but so
little data has been published in this area it is hard to be certain of this statement.
1.3.6 Conventional heating
In conventional heating, thermal energy passes to the surface of the sample
from an external heat source mainly through conduction32 (Figure 1.3.6.1). The
temperature of the sample is usually uneven with the outside hotter than the interior. In
the case of pharmaceutical formulations prepared by melting or thermal diffusion a non-
uniform product may result, which could have detrimental effects on the product.
Thermal conduction mainly occurs in solids and it works because every atom in the
solid is physically bonded together in some way. If heat energy is supplied to one part of
the solid the atoms begin to vibrate faster, and this vibration is passed onto the
adjoining atoms32. This eventually passes throughout the material and the temperature
increases.
Conduction always occurs from regions of high temperature with the heat energy
passed to regions of low temperature to equalise the temperature differences33.
Different types of solids will transfer heat by conduction at different rates, and the rate
each solid will transfer heat is calculated by the material’s thermal conductivity.
Materials with a large thermal conductivity will transfer large amounts of heat over time,
and materials with a low thermal conductivity will transfer small amounts of heat over
the same period of time33.

10
through a solid
Figure 1.3.6.1 – Illustration of thermal conduction
1.3.7 Microwave heating
Microwave technology is a relatively new technique to the pharmaceutical
industry, and previous work has concentrated on applying microwaves to the drying of
pharmaceutical products34-39. However the use of microwave energy is now advancing
into the formulation side of the pharmaceutical industry27-31 with the prospect of
improving drugs with water solubility issues and also controlling how a drug is released
in vitro/in vivo.
Microwaves are part of the electromagnetic spectrum. Electromagnetic radiation is
a form of energy radiated in a wave travelling at the speed of light40. It compromises of
an electric and magnetic field that oscillates at right angles to each other and in the
direction of propagation (Figure 1.3.7.1). Generally electromagnetic radiation is
classified by the wavelength into radiowaves, microwaves, infrared radiation, visible
light, ultraviolet radiation, X-rays, and gamma rays40, with microwaves spanning the
300MHz to 300GHz frequency range of the spectrum39. The growing interest in
microwave heating technology derives from the fact that it relies on direct interaction of
the material with the electromagnetic radiation and less dependence on thermal
conduction41-44. The benefit of microwave heating compared with conventional heating
includes selective and faster heating which allows energy and time saving41-42. The
depth of microwave heating depends mostly on the frequency of the microwave, the
power used and the electrical and thermal conductive properties of the material41. This
type of heating is instantaneous, uniform and penetrating throughout the material41.
High Temperature
Low Temperature
HEAT

11
Figure 1.3.7.1: Diagram of the electromagnetic wave45
Not all materials are heated to the same extent when exposed to microwave radiation 41-
44. When considering how a material will behave once exposed to microwave heating, a
critical factor is the material’s dielectric properties. This is the ability to form a dipole
when exposed to an electric field45. The operation of microwave heating can be
explained simply in terms of two mechanisms: Ohmic and Frictional heating45-46.
In ohmic heating (conductance), which particularly applies to solids, the
alternating electric field of the microwave (E) causes movement of charged carriers, like
electrons within the solid45,47. This movement creates a current which produces heat
through any electrical resistance of the solid (dielectric properties). In frictional heating
(dipolar polarisation), which practically applies to polar liquids such as water or ethanol,
the permanent dipoles attempt to track the alternating electric field of the microwave47.
At microwave frequencies, the molecules can’t quite track the rapidly alternating field
and the resultant ‘jostling’ produces heat and the liquid heats up (Figure 1.3.7.2).

12
Figure 1.3.7.2: Illustration of Ohmic and Frictional Heating in Solids and Liquids45
The ability for a material to turn microwave energy into heat is sometimes called the
‘loss factor’. Materials with a high loss factor will readily absorb microwave energy, for
example, water and alcohol. Materials with a low loss factor are either reflecting or
transparent to the microwave energy, for example quartz glass and PTFE35,45. The
diagram below illustrates some materials and how they behave upon exposure to
microwave energy (Figure 1.3.7.3).
+ E -
+
-
-
+ -
+
+
- -
Frictional (Liquids)
Polar mobile molecules (groups) rotate trying to track alternating E-field.
Ohmic (Solids)
Electrons dragged back and forth through material trying to track alternating E-field.
e- e
- e-
e-

13
Figure 1.3.7.3 Interactions of materials with microwave energy45
The loss factor is temperature dependant and for some materials can rise as it gets
hotter. In addition, chemical or physical changes in the material (i.e. going from solid to
liquid) can cause a significant change in the loss factor35. These changes may
contribute to the process called thermal run-away (illustrated in Figure 1.3.7.4, seen
within the highlighted circle). This is where the temperature of the material rises rapidly
even though the amount of microwave power is unchanged35.
Figure 1.3.7.4: Illustration of thermal run-away under microwave heating
0
5
10
15
20
25
30
0
10
20
30
40
50
60
70
80
90
100
0 5 10 15
M
W
p
O
W
E
R
%
T
e
m
p
e
r
a
t
u
r
e
C
Time (mins)
temp
microwave power
These reflect microwave energy
These absorb microwave energy
Transparent to microwave energy, including PTFE, PP, TPX

14
Despite the chance of thermal run-away and the potential heating capabilities of
microwaves, the actual amount of energy supplied to a material is below the energy
required to break bonds. Microwaves do not have adverse effects on the actual material
being heated, they just facilitate this process, allowing a faster and a more uniform
heating process45.
1.3.7.1 The microwave oven
The majority of microwave heating is performed in a microwave oven and a
modified form of this was used in this research. Microwaves are generated by a
magnetron; vacuum diodes that are made up of circular resonating cavities around a
cathode immersed in a perpendicular magnetic field46.
Albert Hull created the magnetron in the 1920’s, and this was then further
investigated by Harry Boot and John Randall in the 1930’s and the early 1940’s.
Eventually in 1947, Dr Percy Spenser made the first microwave oven47.
The microwave oven differs from that used in domestic applications in four
aspects.
A) The power control system has been modified so that there are two, rather than
the usual one transformer to supply the current to the magnetron filament and
provide the accelerating potential. This configuration means that the power can
be switched on and off more rapidly, leading to better temperature control.
B) The incorporation of a metal reflector within the oven. The reflector is made of a
1mm thick square piece of aluminium that rotates while the microwave is on. This
allows for the microwave energy to be focused onto the material been heated,
aiding the whole heating process and allowing the desired temperature to be
reached at a faster rate.
C) The use of a fibre optic temperature probe to accurately measure the
temperature of the sample within the oven. The temperature is monitored by a
fibre optic probe with a fluorescent chemical (phosphorescent chemical) at the
tip. This chemical is excited by a light pulse sent down the fibre via a control unit.
The fluorescent chemical then re-emits the light over a period of time
(milliseconds) and this is proportional to the actual temperature of the material

15
been heated. The control unit measures the time it takes for the fluorescent
chemical to re-emit the light and calculates the temperature which is then sent
and seen on the computer. The operating range for the fibre optic probe is from
0°C to 300°C48.
D) The use of bespoke control and acquisition software that allows the microwave
power to be set to any desired level in real-time and records both the power and
the fibre optic probe temperature as a function of time. For a visual picture of the
microwave cavity, refer to Chapter Two, Section 2.2, and Figure 2.2.1.3.
1.4 Techniques used in the analysis of pharmaceutical formulations
To evaluate the success of any pharmaceutical formulation careful analysis is
required. Some of the techniques used within the pharmaceutical industry for the
analysis of formulations are: Particle size analysis, X-ray diffraction (XRD), scanning
electron microscopy (SEM), differential scanning calorimetry (DSC), fourier transform
infrared spectroscopy (FT-IR), isothermal titration calorimetry (ITC), thermal activity
monitoring (TAM), and in vitro dissolution. All these techniques use different principles
to help determine how a formulation behaves and the compatibility of the drug and
excipients. These techniques will also show if any damage or degradation has occurred
to the drug during the formulation process or potential storage.
For the purpose of this research, analysis was limited to the five most appropriate
techniques, namely
1. Isothermal titration calorimetry,
2. Differential scanning calorimetry,
3. Scanning electron microscopy,
4. Thermal activity monitoring,
5. In vitro dissolution.
16
1.4.1 Isothermal Titration Calorimetry (ITC)
Calorimetry is the measurement of heat evolved or absorbed by a chemical or
physical process49.
All chemical and physical changes are accompanied by a change in heat content or
enthalpy. Therefore all chemical reactions, including solid-state, solution-phase, gas-
phase and biological reactions can be studied using calorimetric techniques50.
One of these calorimetric techniques is isothermal titration calorimetry (ITC). ITC
is a highly sensitive technique that investigates weak interactions between molecules
and by investigating this, it provides thermodynamic and kinetic information for the
reaction51. Therefore ITC measures binding interactions between, for example, drug
molecule-carriers, and these interactions can be detected by the associated heat
absorbed or released during a reaction52. From this, ΔH (enthalpy), and ΔS (entropy)
can be calculated and a significant amount of information about an interaction can be
concluded. It is only possible to calculate ΔH, and therefore ΔS, because nearly all
binding interactions are accompanied by a change in enthalpy. Therefore a full
thermodynamic profile can be gained from one single ITC experiment53.
For a reversible association between D and C then the following applies:
D + C ↔ DC
Which is characterised by its association binding constant (bonding affinity between two
molecules at equilibrium), Kb, defined by the following:
[DC] = Kb Equation 1.4.1.1
[D] [C]
[DC] = Drug-excipient complex,
[D] = Drug
[C] = Excipient
17
In addition, the association constant, K, is related to standard free energy, ΔG, by:
ΔG = ─RTInK Equation 1.4.1.2
Where R = Gas constant (8.314 J mol─1)
T = Absolute Temperature (K)
Furthermore, the standard free energy is composed of a heat term ΔH, (enthalpy) and
ΔS (entropy) and related by:
ΔG = ΔH – TΔS54-58 Equation 1.4.1.3
ΔG = Standard free energy (kJ mol─1)
ΔH = Enthalpy (kJ mol─1)
T = Absolute Temperature (K)
ΔS = Entropy (kJ mol─1)
1.4.1.1 ITC Instrumentation
ITC comprises two identical cells, a reference cell and a sample cell (1.8mL in
volume). These two coin-shaped cells are enclosed in an adiabatic shield or jacket,
illustrated in Figure 1.4.1.1.1. The temperature difference between the reference cell
and the jacket is continuously monitored to maintain a constant temperature58. A
feedback system monitors the difference in temperature between the sample and
reference through a thermocouple that is positioned between the two cells58. This
thermocouple allows for a highly sensitive response to fluctuations in temperature
between the cells and the jacket59. Therefore the feedback signal is the measured
signal.
The sample cell contains a solution of the chosen excipient (titrand), and the
injection syringe contains a solution to be injected into the sample cell called a titrant
(drug), that will cause a heat change. The injection syringe injects this solution into the
sample cell in a stepwise manner, usually between 5-10μL at each step and produces a

18
response. Along with delivery into the sample cell, the syringe rotates and stirs the
mixture at the same time. This mixing of the interacting species is rapid and allows
response times of the instrument to be less than ten seconds.
Figure 1.4.1.1.1 – A typical ITC cell60
ITC provides information on thermodynamic parameters to be investigated by direct
measurements of the enthalpy over the course of a titration. This information can then
be used to provide an insight into stability, specificity and stoichiometry of numerous
biomolecular interactions.
ITC is just one calorimetric method, there are many more including non-
isothermal methods such as differential scanning calorimetry (DSC).
1.4.2 Differential Scanning Calorimetry (DSC)
Thermal analysis is a group of techniques in which a property of a sample is
monitored against time or temperature while the temperature of the sample, in a specific
atmosphere is varied61-65. The chosen program may involve heating or cooling of the
sample at a fixed temperature rate, holding at a specific temperature, or any sequence
of these61-65. DSC is a technique that measures the energy difference (heat flow)
between the sample and the reference61-65.
DSC is the most often used thermal analysis method, mainly because of its
speed, simplicity and availability. DSC however also provides detailed information on
physical and energetic properties of a substance (for example, melting points, re-
crystallisation, and glass transitions)66. It offers the analyst quantitative information

19
about exothermic, endothermic and heat capacity changes as a function of temperature
and time66.
To conduct these measurements, the sample is placed into a small pan usually made of
aluminium. The reference is also an aluminium pan but usually left empty, they may
also have lids that have a hole pierced into the top of them67. The sample size is usually
between 5-10mg and the temperature range is typically 25-700°C67.
There are variations in the type of DSC instrumentation available and this research
used the common ‘heat-flux’ form.
In heat-flux DSC the difference in heat flow into the sample and reference is measured
while the sample temperature is changed at a constant rate66. Both the sample and
reference pans are heated by a single heating unit, and heat flows into the sample and
reference via an electrically heated thermoelectric disk66. The differential heat flow into
the two pans is directly proportional to the difference in the temperature between the
two pans.
1.4.3 Thermal Activity Monitoring (TAM)
The thermal activity monitor (TAM), is an isothermal calorimetric system
designed to monitor a wide range of chemical and biological reactions. It works on the
principle that all chemical and biological processes are accompanied by a heat
exchange with their surroundings, and therefore the system can observe and quantify
both exothermic (heat-producing) and endothermic (heat-absorbing) processes68-73. The
TAM can be used to obtain information on the rate, and extent of basic chemical
reactions, phase changes, changes in structure and metabolism of living systems. Any
thermal events that these reactions or changes provide, even in the microwatt range
(μW) can be observed by the TAM. This means that any temperature differences less
than 10-6°C can be detected68-73.
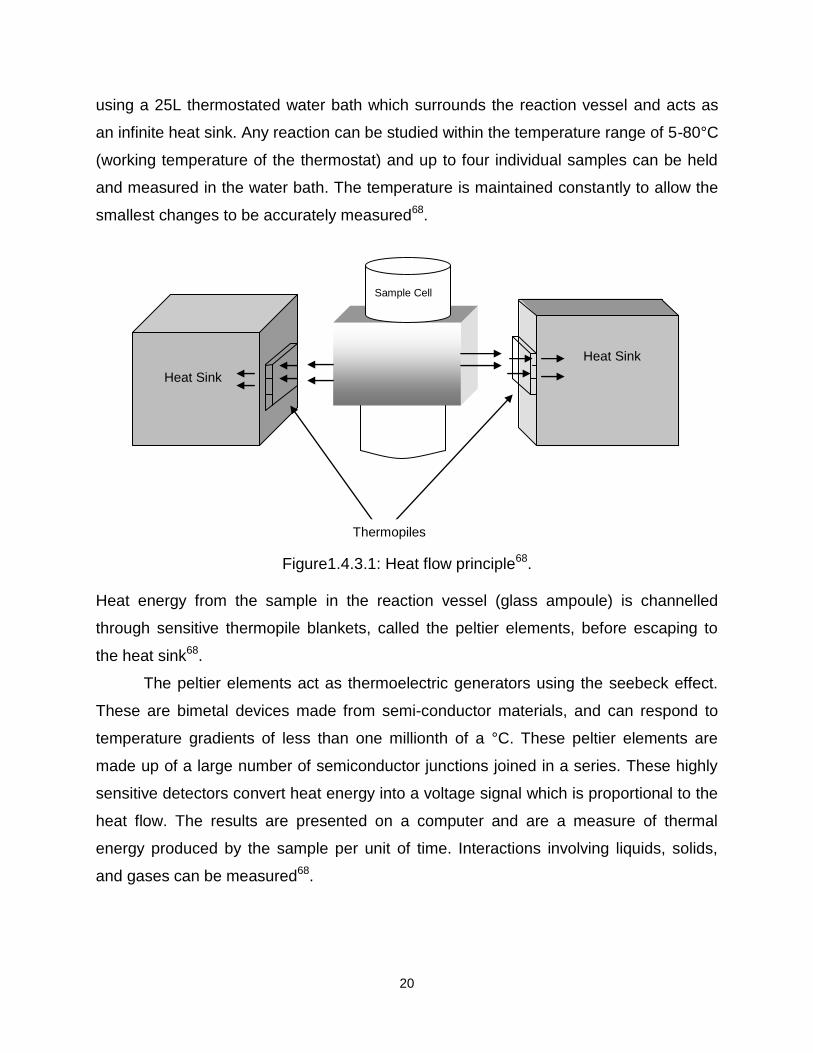
TAM utilises the heat flow or heat leakage principle (Figure 1.4.3.1), where heat
produced from the sample in a thermally-defined vessel flows away in an effort to
establish thermal equilibrium with the surroundings. Thermal stability is achieved by
20
using a 25L thermostated water bath which surrounds the reaction vessel and acts as
an infinite heat sink. Any reaction can be studied within the temperature range of 5-80°C
(working temperature of the thermostat) and up to four individual samples can be held
and measured in the water bath. The temperature is maintained constantly to allow the
smallest changes to be accurately measured68.
Figure1.4.3.1: Heat flow principle68.
Heat energy from the sample in the reaction vessel (glass ampoule) is channelled
through sensitive thermopile blankets, called the peltier elements, before escaping to
the heat sink68.
The peltier elements act as thermoelectric generators using the seebeck effect.
These are bimetal devices made from semi-conductor materials, and can respond to
temperature gradients of less than one millionth of a °C. These peltier elements are
made up of a large number of semiconductor junctions joined in a series. These highly
sensitive detectors convert heat energy into a voltage signal which is proportional to the
heat flow. The results are presented on a computer and are a measure of thermal
energy produced by the sample per unit of time. Interactions involving liquids, solids,
and gases can be measured68.
Heat Sink
Heat Sink
Sample Cell
Thermopiles

21
1.4.3.1 Instrumentation
The TAM itself is a free-standing multichannel microcalorimeter. Continuous heat
leakage measurements are conducted under isothermal conditions.
The two main functions of the system are precise control of the isothermal
temperature with the water thermostat, and detection of thermal events by a
measurement system68.
The samples are placed in the TAM via measuring cylinders (glass ampoules)
which are maintained at constant temperature by the water thermostat. Each cylinder,
together with a signal amplified, forms the measuring channel. Up to four channels can
be operated at the same time in the TAM68.
In all channels, measurements take place in the measuring cup which is between
a pair of peltier thermopile heat sensors. In each cylinder there is a single peltier
element mounted on the base of each cup, and the samples are introduced to each cup
in sealed ampoules after a pre-equilibration period. This equilibrium period is carried out
in the neck of the cylinder and outside of the neck is in direct contact with the water from
the thermostat bath. This allows for rapid exchange of heat between the ampoules and
the water bath via the neck68.
The TAM is fitted with two amplifiers, one for each channel. The output signal
from any thermal event within the sample is fed directly to the appropriate channel
amplifier and the signal is monitored by a computer.
In summary, calorimetric techniques can provide an array of information about the
behaviour of a pharmaceutical sample as it undergoes chemical or physical changes.
However it does not allow the analyst to visually see any differences. To achieve this
form of analysis requires a technique such as scanning electron microscopy (SEM).
22
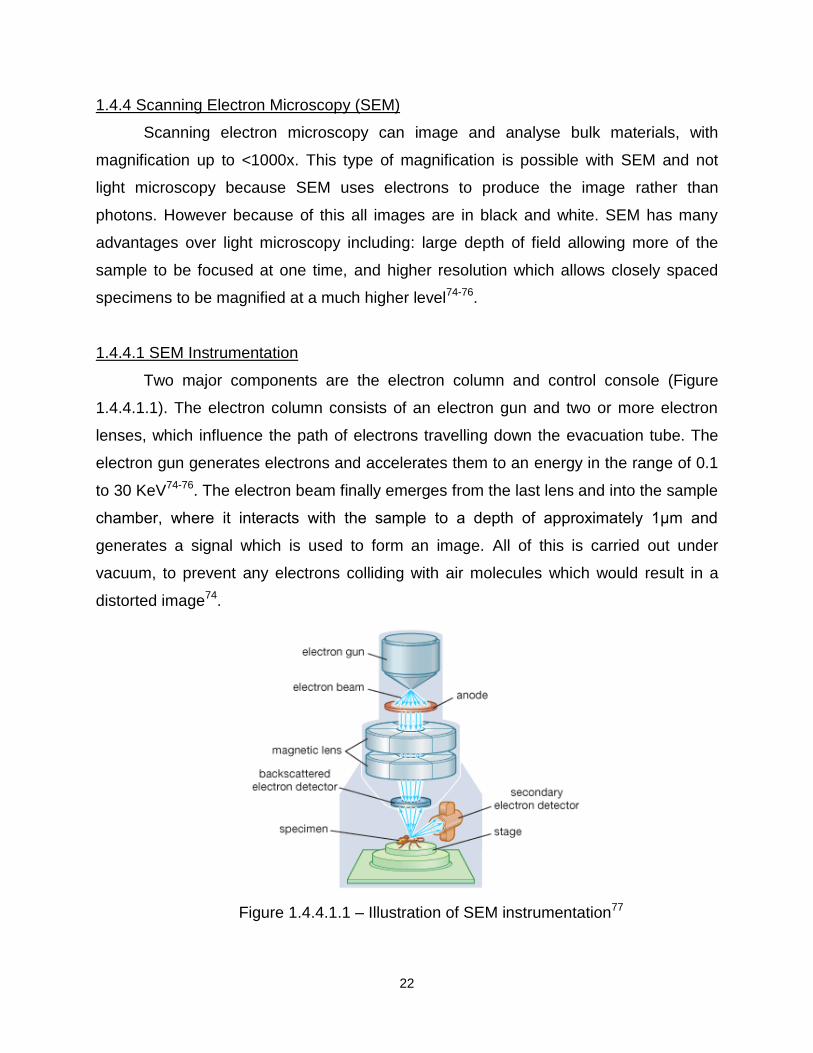
1.4.4 Scanning Electron Microscopy (SEM)
Scanning electron microscopy can image and analyse bulk materials, with
magnification up to <1000x. This type of magnification is possible with SEM and not
light microscopy because SEM uses electrons to produce the image rather than
photons. However because of this all images are in black and white. SEM has many
advantages over light microscopy including: large depth of field allowing more of the
sample to be focused at one time, and higher resolution which allows closely spaced
specimens to be magnified at a much higher level74-76.
1.4.4.1 SEM Instrumentation
Two major components are the electron column and control console (Figure
1.4.4.1.1). The electron column consists of an electron gun and two or more electron
lenses, which influence the path of electrons travelling down the evacuation tube. The
electron gun generates electrons and accelerates them to an energy in the range of 0.1
to 30 KeV74-76. The electron beam finally emerges from the last lens and into the sample
chamber, where it interacts with the sample to a depth of approximately 1μm and
generates a signal which is used to form an image. All of this is carried out under
vacuum, to prevent any electrons colliding with air molecules which would result in a
distorted image74.
Figure 1.4.4.1.1 – Illustration of SEM instrumentation77

23
Two pairs of electromagnetic deflection coils (scan coils) sweep the electron beam
across the sample. The first pair of coils deflect the beam from an optical axis within the
microscope and the second pair bends the beam back onto the axis at the pivot point of
the scan74. Once the electron beam interacts with the sample, a number of signals are
generated. The electronics of the detector system converts these signals to point-by-
point intensity changes which are passed to a computer that reads the signals and
produces an image74.
The two most important signals that are used to produce an SEM image are
secondary and backscatter electrons (SE and BSE). These signals are capable of
carrying information about the sample composition, shape (topography), surface textile,
and thickness. Secondary electrons are loosely bound outer shell electrons from the
sample atoms. These receive sufficient kinetic energy during the scattering of the
electron beam and are ejected from the sample and set in motion. Secondary electrons
are defined on the basis of their kinetic energy and all electrons that are emitted from
the sample with energy less than 50eV are classed as secondary electrons74.
Backscatter electrons are a beam of electrons whose trajectories occur because
of an interception with the surface of the sample. Backscatter electrons remove a
significant amount of the total energy from the primary beam and the number of these
electrons that reach the detector is proportional to the mean atomic number of the
sample74-76.
Two types of detectors are used to identify the secondary and backscatter
electrons these are then used to provide information on the sample. However for the
electron beam to interact with the sample and for SE and BSE to be produced, the
sample must be a solid and conducting. Samples that are not conducting are coated
with a thin layer of a conducting material, such as gold, by a device called a ‘sputter
coater’.
All the above techniques provide information concerning the formulated product,
however it is also important to consider how formulation choices affect the subsequent
drug release profile. One technique that can help in this respect is in vitro dissolution
analysis.

24
1.4.5 Dissolution analysis
Dissolution studies of pharmaceutical compounds are exceptionally important
because the dissolution behaviour will govern the bioavailability of the drug78.
Dissolution is defined as the process by which a solid substance enters into a
solvent yielding a solution. Simply, dissolution is the process by which a solid substance
dissolves79. Dissolution testing is generally carried out on pharmaceutical dosage
forms, including solid and solid-liquid dispersed formulations and mainly for quality
control between batches78-80.
Once a dosage form is administered to the body, it undergoes dissolution in the
biological media, followed by absorption of the drug79. However for any of this to occur,
the drug must dissolve before absorption can take place (in vivo). Dissolution (in vitro)
can help to predict how well the drug will dissolve, therefore help to predict in vivo
activity (in vivo, in vitro correlation, IVIVC).
Solid Solution Blood
Many factors can affect dissolution, including: the manufacturing process of the
drug/excipient (granulation, tablet punch pressure, composition of the formulation), drug
properties (solubility/permeability, particle size, wettability, pH, pKa) and the dissolution
method (paddle/basket method, rotation speed, temperature, volume and pH)79-80.
If absorption is slow (drug dissolves, but diffusion, or active transport of drug over
GI tract restricted) when compared with dissolution then absorption is the rate
determining step. However if dissolution is the rate determining step then the factors
that affect dissolution will control the overall process81.
The dissolution rate is described by the Noyes-Whitney equation (this relates the
rate of dissolution of solid to the properties of the solid and the dissolution medium)82-83:
Dissolution
Absorption (ingestion)

25
Equation 1.4.5.1
M = Mass of solute dissolved in time, t.
dm/dt = Mass rate of dissolution (mass/time)
D = Diffusion coefficient of solute in solution
S = Surface area of exposed solid
h = Thickness of diffusion layer
Cs = Solubility of solid
C = Concentration of solute in bulk solution at time, t.
t = Time
If diffusion is the rate determining step, Fick’s Law of diffusion can be used. Also if the
drug concentration at various distances from the surface of the solid are measured then
a concentration gradient can be seen81.
Fick’s Law of diffusion
Rate of Solution = Equation 1.4.5.2
D = Diffusion coefficient
A = Surface area
Cs = Solubility of drug
Cb = Concentration of the drug in bulk solution
h = Thickness of diffusion layer
1.4.5.1 Methods of dissolution
There are a number of methods, but the most common and the official BP
method is the rotating basket and paddle method for testing solid oral dosage forms.
The rotating basket method was developed by Pernarowski in 196884, and then soon
after Hayes developed the paddle method in 196985 which was further improved by
Poole in 1969. The basket method uses a wire mesh basket to hold a solid dosage form

26
which is in the dissolution media allowing for wetting of the formulation and release of
the drug.
For the paddle method, the solid dosage form is dropped into the dissolution
media and the paddle rotates the media and the solid dosage form allowing for the
wetting of the formulation and release of the drug4,79.
1.4.5.2 Instrumentation
The dissolution instrument comprises of six 200mL dissolution cells and two
further one litre cells containing a blank and the other, a standard solution. The
dissolution cells stand in a water bath maintained at 37°C±0.1°C. Drug dissolution is
monitored using a UV-Vis spectrometer monitoring a chosen wavelength for the drug of
interest. The solution is circulated from the cells to the UV-Vis using a peristaltic pump
while software (Icalis) allows a real-time dissolution profile for each of the cells to be
determined. Beer-Lambert calibration plots were constructed to allow the absorbance
values to be converted to percentage drug release.
1.4.5.3 Buffers
The definition of a buffer is a ‘substance which by its presence in solution
increases the amount of acid or alkali that must be added to cause a unit increase in
pH85. A buffer contains a weak acid and its conjugated base (or a weak base and its
conjugated acid). This type of solution can maintain a constant pH when a small amount
of acid or base are added, and are widely used where a change in pH may have
detrimental effects.
Dissolution is pH sensitive and so dissolution studies frequently use buffer
solutions to ensure reliable results as some drugs are acidic in solution. In addition, the
use of buffers can simulate the pH of parts of the gastrointestinal system to increase the
realism of the dissolution study85.
For the current research, a buffer comprising 0.2M Di-sodium hydrogen
orthophosphate dodechydrate and 0.2M Di-hydrogen orthophosphate di-hydrate was
used to maintain a pH of 8 as found in the small intestine.

27
1.5 Materials used in this research
There were four drugs and four different excipients chosen for the current study.
These were ibuprofen, ketoprofen, flurbiprofen and paracetamol. These particular drugs
were chosen because all are non-steroidal anti-inflammatory drugs (NSAID’s)
commonly used. Consequently there is extensive knowledge on these drugs, i.e. they
are well characterised. Each of these drugs properties are summarised in Table 1.5.1 to
1.5.3.
Table 1.5.1 – Structural summary of the four drugs used86-108

28
Drug Therapeutic Dose
(mg) Solubility (mg/mL) at
25°C Appearance pKa
Ibuprofen 200-1200 0.06 White Crystalline
powder 4.5
Ketoprofen 200-1000 0.30 White Crystalline
powder 4.5
Flurbiprofen 200-1000 0.08 White Crystalline
powder 4.5
Paracetamol 500-1000 20.90 White Crystalline
powder 9.5
Table 1.5.2 – Summary of chemical properties of the drugs used in this work86-108

29
Drug logP MP (°C) BCS Dosage Forms
Ibuprofen 3.6 75-77 2 Tablets
Capsules
Liquids Gels
Ketoprofen 0.97 95-97 2 Capsules
Injections
Suppositories Gels
Flurbiprofen 4.2 114-117 2 Tablets
Capsules
Eye Solutions
Paracetamol 0.49 169-170 1 Tablets
Capsules
Suspensions
Suppositories
Table 1.5.3 – Pharmaceutical properties of the drugs used in this research86-108
Ibuprofen, ketoprofen and flurbiprofen have poor aqueous solubility because they are
weak acids with pKa values in the range 4-5 i.e. when they dissociate, hydrogen ions
are released. The more hydrogen ions that are released the more acidic the solution
becomes, this then inhibits the solubility of these drugs because weak acids dissolve to
a greater extent when in mild basic solutions. Therefore the solubility is pH dependant
and increases with increasing pH, related by the following equations (Equations 1.5.1-
1.5.2)86-108
pKa = -log10(Ka) (Equation 1.5.1)
Ka = [H+] [A-]
[HA] (Equation 1.5.2)
[H+] = Hydrogen ions
[A-] = Ionised drug
[HA] = Unionised form of drug

30
1.5.1 Previous research
Previous research for ibuprofen solid dispersions and inclusion complexes has
included a number of methods to incorporate ibuprofen into polyvinylpyrrolidone (PVP),
stearic acid (SA) and β-cyclodextrin (BCD). These include wet granulation109, the
solvent method110, spray drying111, and freeze drying112-113. This previous work suggests
that these excipients can help control the release of the drug or improve the solubility
using the chosen formulation method.
Other research which is directly relatable to this work incorporated ibuprofen into
the above excipients by melting114-115 using conventional heating. Referring to
references 27-31, Bergese et al, and Moneghini et al formulated ibuprofen with PVP
and BCD using microwaves to produce solid dispersions or inclusion complexes to
improve the properties of the drug. All suggest that microwave heating, with the use of
ibuprofen, could be advantageous and help to control the release of the drug. This
research, although demonstrating the potential of microwave heating, had drawbacks in
terms of accurate temperature measurement and power control that the current work
seems to address. In addition, a wider range of drug-excipient systems were studied
than previously considered.
Previous research for ketoprofen solid dispersions and inclusion complexes has
covered a number of methods including incorporation of ketoprofen into PVP and BCD.
These include freeze drying to produce a solid dispersion116-117, spray drying118,
kneading and co-evaporation119. However, little has been published on the use of the
melt method for the formulation of this drug with the chosen excipients other than two
papers published in 2008 by Cirri et al120-121. In both the published papers ketoprofen
was tumble mixed with β-cyclodextrin, methyl-β-cyclodextrin and egg
phosphatidylcholine in various ratios. Each different mixture was then subjected to
microwave heating for varying amounts of time and power. It was seen in all cases that
an improvement for the dissolution of the drug occurred. However despite another
method of microwave heating illustrating the potential, these methods still illustrated
drawbacks which have previously been discussed and seem to be taken into
consideration in the current project. Another novel aspect of this research is the
incorporation of ketoprofen into PVP, SA and 2HPBCD using the melt method.

31
Previous research into flurbiprofen has been carried out using various methods that
include co-precipitation, co-evaporation and spray drying122-126. However, no known
research has incorporated flurbiprofen into the chosen excipients via the different
heating methods.
Paracetamol was the last drug incorporated into this research, however little
research was found relating to this work. The only paper found that illustrated
paracetamol and β-cyclodextrin mixed together was published in 1992 by Tasic et al.
The solid dispersions of paracetamol were prepared by mixing the drug with β-
cyclodextrin via a kneading method (mortar and pestle) and a water-ethanol solvent
mixture.
In addition to varying the drugs under investigation, this research focuses on varying
excipients, namely stearic acid (SA), β-cyclodextrin (BCD), polyvinylpyrrolidone (PVP)
and 2-hydroxypropyl-β-cyclodextrin (2HPBCD).
1.5.2 Excipients
The choice of excipient is important to any drug formulation. This choice can
affect the solubility of the drug and therefore the dissolution4. Excipients are generally
added to a drug to provide a specific function. This can be to mask an unpleasant taste
provided by the drug, it can provide protection for the drug so it is not damaged before it
reaches its target site, and they can be added to increase solubility and increase or
decrease the kinetics of drug release4. However the magnitude of the effects will
depend upon the drug, the quantities, properties of the excipient4 and the formulation
method. A summary of the different excipients used within this research, stearic acid, β-
cyclodextrin, polyvinylpyrrolidone, and 2-hydroxypropyl-β-cyclodextrin can be seen in
Table 1.5.1.1.

32
Excipient Chemical formula Solubility Appearance MP (°C) Uses
SA C18H36O2 Insoluble Waxy solid 66-70 oral and topical
formulations
Lubricant and binder
BCD (C6H10O5)2.3H2O Soluble
(0.18g/mL) White
powder 280 Improve solubility by
forming
inclusion complexes
2HPBCD (C6H10O5)2.3H2O. CH2CH(OH)CH3
Soluble (1g/mL)
White powder 280
Improve solubility by forming
inclusion complexes
PVP C6H10NOn Cross-Linked
PVP White
Powder 300 Complex formation with
Insoluble pharmaceutical drugs
Table 1.5.1.1 – Summary of the four different excipients employed for this research128-
132
Stearic acid (Figure 1.5.1.1), is a long chain fatty acid and previous research has
utilised it with ibuprofen to aid or control the release of the drug132. However in this
research the stearic acid and ibuprofen mixture was heated using conventional heating
to encapsulate the drug.
OH
O
Figure 1.5.1.1: Structure of Stearic acid
Cyclodextrins are natural or semi-synthetic cyclic oligosaccharides with α-, β- and γ- the
most commonly used, consisting of six, seven and eight D-glucopyranose units
respectively133. Each of these units are linked by an α-1,4, glycosidic bond and because
of the chair formation of the glucopyranose units, the cyclodextrin takes the shape of a
truncated cone134-140. As each cyclodextrin increases in glucopyranose units, their cavity
also increases in size and therefore larger drug molecules can be included (β-
cyclodextrin has a cavity size around 6-6.5Å)141. The cavity is hydrophobic and forms
inclusion complexes preferentially with hydrophobic drugs134-147.

33
Cyclodextrin complex formation usually results from a combination of electrostatic
interactions, van der Waal’s, hydrogen-bonding and charge-transfer interactions146-147
and some papers have suggested that these complexes form in a 1:1 ratio134-147. The
structure of β-cyclodextrin (BCD) is illustrated in Figure 1.5.1.2.
Figure 1.5.1.2 – Structure of β-cyclodextrin, front and side view144
2-Hydroxypropyl-β-cyclodextrin (2HPBCD) has gained much interest over the years
because of its increased solubility when compared to the parent β-cyclodextrin148-150. It
is produced from β-cyclodextrin by hydroxypropylation of the hydroxyl groups of the
cyclodextrin151. It is chemically stable and the degree of substitution is the average
number of hydroxypropyl groups per cyclodextrin. The structure is illustrated in Figure
1.5.1.3 and the hydroxypropyl group is CH2CH(OH)CH3, substituted onto the
cyclodextrin in the R position.

34
Figure 1.5.1.3 Structure of β-cyclodextrin
the R groups show where the hydroxypropyl group can be substituted151
The cavity retains its hydrophobic nature and the hydroxypropyl groups give an
increased water solubility148-155. The degree of substitution of these hydroxypropyl
groups also allows some control over the bonding to any drug molecule.
Polyvinylpyrrolidone (PVP) is widely used because of the following properties: it is
highly hydrophilic, it has good biological compatibility, rapid water uptake, low toxicity,
good swelling properties, adhesive characteristics, it is relatively inert against salts and
acids, and it is resistant to thermal degradation156-160.
PVP falls into two different categories based on aqueous solubility. However for
the purpose of this research only the insoluble form of PVP was utilised. This is
synthesised by polymerisation of N-vinylpyrrolidone which yields mainly a cross-linked
polymer156-160. It is widely used in the pharmaceutical industry as a swelling polymer
(absorbs water) with selective absorptive properties, and it also has favourable
disintegration effects for tablets160. The structure of this excipient is illustrated in Figure
1.5.1.4.

35
N O
CH CH2
n
Figure 1.5.1.4: Structure of PVP
Previous research has incorporated a number of drugs into PVP to help improve the
dissolution behaviour. Methods used to incorporate drugs into the structure of PVP
include co-precipitation157-159, solid dispersions161-165, spray drying160, solvent
evaporation, 161-165, and mixing166. Previous research suggests that PVP does help to
improve solubility and dissolution, because PVP may inhibit crystal growth167-168
1.6 Aims and objectives
The aims of this project were as follows:
A) To determine the thermodynamic parameters associated with the binding
between the chosen drug and excipients, and to analyse whether this is
temperature dependant.
B) To compare and contrast the behaviour of drug-excipient formulations
prepared using conventional and microwave heating.
Each of these aims was determined by analysing the product formulations via a range
of analytical techniques including calorimetry, microscopy, and dissolution studies.
These chosen techniques were used to help illustrate the effectiveness of the
formulation process. Three objectives were identified to complete the aforementioned
aims and these are discussed in Chapter Six (p209-217).
Although previous researchers have indicated that microwave heating may have
benefits in drug formulation, their work largely used relatively primitive microwave
equipment where, critically, the temperature of the mixture or the microwave power was
not monitored or controlled.
36
References
1. Developing solid oral dosage forms – pharmaceutical theory and practice, Y Qiu,
Y Chen, G Zhang, Abbott Laboratories, Novast Laboratories, 1st Edition,
Academic press, USA, 2009
2. A theoretical basis for a biopharmaceutical drug classification: The correlation of
in vitro drug product dissolution and in vivo bioavailability, GL Amidon, H
Lennernas, VP Shah, JR Crison, Pharmaceutical Research, 2, Vol 12, 413-420,
1995
3. The Merck manuals, RS Porter, JL Kaplan, Assessed online at
http://www.merckmanuals.com/professionals/sec20/ch303c.html, 3rd February
2011
4. Pharmaceutical preformulations and formulations, A practical guide from
candidate drug selection to commercial dosage form, M Gibson, Interpharm,
London, 2004
5. Drug delivery and targeting for pharmacists and pharmaceutical scientists, AM
Hillery, AW Lloyd, J Swarbrick, Taylor and Francis, London, 2001
6. Studies on absorption of eutectic mixture. Ι. A comparison of the behaviour of
eutectic mixture of sulfathiazole and that of ordinary sulfathiazole in man, K
Sekiguchi, N Obi, Pharmaceutical Sciences, Vol 9, 866-872, 1961
7. Studies on absorption of eutectic mixture. II. Absorption of fused conglomerates
of chloramphenicol and urea in rabbits, K Sekiguchi, N Obi, Pharmaceutical
Sciences, Vol 12, 131-144, 1964
8. Pharmaceutical solid dispersion technology, MJ Habib, technomic publishing,
USA, 2001
9. Properties of fused mannitol in compressed tablets, JL Kanig, Journal of
Pharmaceutical Sciences, 2, Vol 53, 188-192, 1964
10. Increasing dissolution rates and gastrointestinal absorption of drugs via solid
solutions and eutectic mixtures II, AH Goldberg, M Gibaldi, JL Kanig, Journal of
Pharmaceutical Sciences, 5, Vol 55, 482-486, 1966
37
11. Increasing dissolution rates and gastrointestinal absorption of drugs via solid
solutions and eutectic mixtures III, AH Goldberg, M Gibaldi, JL Kanig, Journal of
Pharmaceutical Sciences, 5, Vol 55, 487-488, 1966
12. Increasing dissolution rates and gastrointestinal absorption of drugs via solid
solutions and eutectic mixtures IV, AH Goldberg, M Gibaldi, JL Kanig, Journal of
Pharmaceutical Sciences, AH Goldberg, M Gibaldi, JL Kanig, M Mayersohn,
Journal of Pharmaceutical Sciences, 6, Vol 55, 581-583, 1966
13. New methods of solid-state dispersion for increasing dissolution rates, M
Mayersohn, M Gibaldi, Journal of Pharmaceutical Sciences, 1323-1324, 1966
14. The current status of solid dispersions, JL Ford, Pharmaceutica Acta, 3, 61,
1986
15. Water-Insoluble Drug Formulation, L Rong, 2nd edition, CRC Press, London,
2008
16. Improving drug solubility for oral delivery using solid dispersions, C Leuner, J
Dressman, European Journal of Pharmaceutical and Biopharmaceutical, 50, 47-
60, 2000
17. Pharmaceutical applications of solid dispersions systems, WL Chiou, S
Riegelman, Journal of Pharmaceutical Sciences, 9, Vol 60, 1971
18. Preparation and dissolution characteristics of several fast-release solid
dispersions of griseofulvin, WL Chiou, S Riegelman, Journal of Pharmaceutical
Sciences, 12, Vol 58, 1969
19. A method for preparing an aqueous colloidal dispersion of organic materials by
using water-soluble polymers: Dispersion of β-carotene by polyvinylpyrrolidone,
T Tachibana, A Nakamura, Kolloide und naturliche Makromolekule, 1965
20. Evaluation of nanoparticles as drug-delivery systems I: Preparation methods, J
Kreuter, Pharmaceutica Acta, 7, Vol 58, 1983
21. Solid dispersions: Comparison of prepared melts and coprecipitates of
diazepam and polyoxyethylene glycol 4000, C Anastasiadou, S Henry, B
Legendre, C Souleau, D Duchene, Drug development and industrial pharmacy,
9, Vol 1, 103-115, 1983

38
22. Stabilization of amorphous state if indomethacin by solid dispersions in
polyvinlypolypyrrolidone, H Imaizumi, N Nambu, T Nagai, Chemical
Pharmaceutical Bulletin, 7, Vol 31, 2510-2512, 1983
23. Mechanisms of dissolution of fast release solid dispersions, OI Corrigan, Drug
Development and Industrial Pharmacy, 11, Vol 2, 697-724, 1985
24. The effect of wetting agents on the dissolution of indomethacin solid dispersions
systems, JE Hilton, MP Summers, International Journal of Pharmaceutics, 31,
157-164, 1986
25. Bioavailability and erosive activity of solid dispersions of some non-steroidal
anti-inflammatory drugs, EM Ramadan, A El-Gawad H, A El-Gawad, AT Nouh,
Pharmaceutical Industry, 5, Vol 49, 1987
26. Solid dispersions of poorly water soluble drugs: Early promises, subsequent
problems, and recent breakthroughs, ATM Serajuddin, Journal of
Pharmaceutical Sciences, 10, Vol 88, 1999
27. Microwave generated nanocomposites for making insoluble drugs soluble, P
Bergese, I Colombo, D Gervasoni, LE Depero, Materials Science and
Engineering C, 23, 791-795, 2003
28. Melting of nanostructured drugs embedded into a polymeric matrix, P Bergese,
I Colombo, D Gervasoni, LE Depero, Journal of Physical Chemistry B, 108,
15488-15493, 2004
29. Microwave generated solid dispersions containing ibuprofen, M Moneghini, B
Bellich, P Baxa, F Princivalle, International Journal of Pharmaceutics, 1-6, 2008
30. Sustained-released solid dispersions of ibuprofen prepared by microwave
irradiation, M Moneghini, N De Zordi, M Grassi, G Zingone, Journal of Drug
Delivery Science and Technology, 5, Vol 18, 327-333, 2008
31. Influence of the Microwave Technology on the Physical-Chemical Properties of
Solid Dispersions with Nimesulide, M Moneghini, G Zingone, N De Zordi,
Powder Technology, 195, 259-263, 2009
32. Conduction, Available [online] at:
http://www.bbc.co.uk/schools/gcsebitesize/science/aqa/energy/heatrev1.shtml
2011, Accessed on the 28th May 2011.

39
33. Heat conduction, LM Jiji, Third Edition, Springer Publishing, 2-3, 2009
34. Microwave drying of pharmaceutical powder, CM McLoughlin, WAM McMinn,
TRA Magee, Institution of Chemical Engineers, C, Vol 78, 90-96, 2000
35. Microwave Drying, GV Vaerenbergh, NV Collette, 1-18, 2000
36. Physical and dielectric properties of pharmaceutical powders, CM McLoughlin,
WAM McMinn, TRA Magee, Powder Technology, 134, 40-51, 2003
37. Application of microwaves in the pharmaceutical industry, MJ Cliff, Institution of
Chemical Engineers, 3, 4.1-4.12, 1986
38. Microwave-convective drying characteristics of pharmaceutical powders, WAM
McMinn, CM McLoughlin, TRA Magee, Powder Technology, 153, 23-33, 2005
39. Microwave-assisted drying of pharmaceutical granules and its impact on drug
stability, ZH Loh, CV Liew, CC Lee, PWS Heng, International Journal of
Pharmaceutics, 359, 53-62, 2008
40. Microwave endometrial ablation: An overview, SA Jack, KG Cooper, Reviews in
Gynaecological Practice, 5, 32-38, 2005
41. Specific heat, polarization and heat conduction in microwave heating systems:
A nonequilibrium thermodynamic point of view, P Bergese, Acta Materialia, 54,
1843-1849, 2006
42. Design of controlled-release solid dosage forms of alginate and chitosan using
microwaves, TW Wong, LW Chan, SB Kho, PWS Heng, Journal of Controlled
Release, 84, 99-114, 2002
43. Microwave and metal, M Gupta, WL Wong, LW Wong, 1st Edition, Wiley-
Interscience, London, 1-256, 2007
44. Engineers handbook of industrial microwave heating, R Meredith, Institution of
Electrical Engineers, 1st Edition, 1-16, 1998
45. Microwave Heating, GMB Parkes, Presentation, University of Huddersfield,
2008
46. Handbook of Microwave Technology: Applications, Koryu Ishii T, Academic
Press, London, 1-679, 1995
47. Microwave assisted proteomics, JR Lili, Royal Society of Chemistry, London, 1-
125, 2009

40
48. Fibre optic technology, Lumasence Technologies, Available [online]
http://www.innova.dk/en/ , 2011, Accessed on the 26th January 2011
49. Pharmaceutical applications of microcalorimetry, MJ Koenigbauer,
Pharmaceutical Research, 6, Vol 11, 777-783, 1994
50. Determination of thermodynamics and kinetic parameters from isothermal heat
conduction microcalorimetry: Applications to long-term-reaction studies, RJ
Willson, AE Beezer, JC Mitchell, W Loh, Journal of Physical Chemistry, 99,
7108-7113, 1995
51. Isothermal titration calorimetry and theoretic studies on host-guest interaction of
ibuprofen with α-, β- and γ-cyclodextrin, S Xing, Q Zhang, C Zhang, Q Zhao, H
Ai, D Sun, Journal of Solution Chemistry, 38, 531-543, 2009
52. Characterization of binding interactions by isothermal titration calorimetry, ML
Doyle, Current Opinion in Biotechnology, 8, 31-35, 1997
53. Isothermal titration calorimetry method for determination of cyclodextrin
complexation thermodynamics between artemisinin and naproxen under varying
environmental conditions, AC Illapakurthy, CM Wyandt, SP Stodghill, European
Journal of Pharmaceutics and Biopharmaceutics, 59, 325-332, 2005
54. Determination of accurate thermodynamics of binding by titration
microcalorimetry, DR Bundle, BW Sigurskjold, Methods in Enzymology, Vol 247,
288-304, 1994
55. Isothermal microcalorimetry for the characterization of interactions between
drugs and biological materials, I Wadso, Thermochimica Acta, Vol 267, 45-59,
1995
56. Measurements of binding thermodynamics in drug discovery, GA Holdgate,
WHJ Ward, Drug Discovery Today, 22, Vol 10, 1543-1550, 2005
57. Isothermal titration calorimetry and differential scanning calorimetry as
complementary tools to investigate the energetic of biomolecular recognition, I
Jelesarov, HR Bosshard, Journal of Molecular Recognition, Vol 12, 3-18, 1999
58. Isothermal titration calorimetry, A Velazquez-Campoy, H Ohtaka, A Nezami, S
Muzammil, E Freire, Current Protocols in Cell Biology, John Wiley and Sons,
London, 1st Edition, 17.8.1-17.8.24, 2004

41
59. Sensing the heat: The application of isothermal titration calorimetry to
thermodynamics studies of biomolecular interactions, JE Ladbury, BZ
Chowdhry, Chemistry and Biology, Vol 3, 791-801, 1996
60. ITC diagram, Available [online] http://www.innova.dk/en/ 2011, Accessed on the
26th January 2011
61. Thermal methods of analysis, principle, applications and problems, PJ Haines,
Blackie academic and professional, London, 4-282, 1995
62. Principles of thermal analysis and calorimetry, PJ Haines, Royal Society of
Chemistry, London, 1-220, 2002
63. Differential scanning calorimetry: Application in drug development, SD Clas, CR
Dalton, BC Hancock, PSTT, 8, Vol 2, 311-320, 1999
64. Differential scanning calorimetry, HKDH Bhadeshia, Materials Science and
Metallurgy, Vol 1, 1-9, 2004
65. Differential scanning calorimetry, E Freire, Methods in Molecular Biology, Vol
40, 191-218, 1995
66. Principles of instrumental analysis, DA Skoog, FJ Holler, SR Crouch, David
Harris, Canada, 6th Edition, 900-906, 2007
67. Undergraduate instrument analysis, JW Robinson, GM Frame, CRC Press,
London, 6th Edition, 1026-1027, 2004
68. Instrument Manual, 2277 Thermal Activity Monitor, Thermometric
69. Isothermal microcalorimetry, a powerful tool in quality control of pharmaceutical
solids, Thermometric, Introduction Letter Solid State Physical Changes, 1995
70. Solid-state stability testing of drugs by isothermal calorimetry, MJ Koenigbauer,
SH Brooks, G Rullo, RA Couch, Pharmaceutical Research, 7, Vol 9, 939-944,
1992
71. Stability assessment of pharmaceuticals by isothermal calorimetry: Two
components systems, CV Skaria, S Gaisford, MAA O’Neill, G Buckton, AE
Beezer, International Journal of Pharmaceutics, Vol 292, 127-135, 2005
72. Potential applications of microcalorimetry for the study of physical processes in
pharmaceutical, S Gaisford, G Buckton, Thermochimica Acta, Vol 380, 185-198,
2001
42
73. The applications of microcalorimetry in the field of physical pharmacy, G
Buckton, AE Beezer, International Journal of Pharmaceutics, Vol 72, 181-191,
1991
74. Scanning electron microscope and x-ray microanalysis, J Goldstein, Springer,
London, 1st Edition, 1-19, 2003
75. SEM, X-ray microanalysis and analytical electron microscopy, CE Lyman,
Springer, London, 1-90, 1990
76. The principles of practice for electron microscope, LM Watt, Cambridge
University Press, London, 1st Edition, 89-135, 1997
77. SEM image, Available [online] http://www.britannica.com/ebchecked/topic-
art/526571/110970/scanning-electron-microscope, 2011, Accessed on the 28th
January 2011
78. Modelling of the dissolution of a pharmaceutical compound, D Mangin, E
Garcia, S Gerard, C Hoff, JP Klein, S Veesler, Journal of Crystal Growth, Vol
286, 121-125, 2006
79. Pharmaceutical testing, JJ Dressman, J Kramer, Informa healthcare, London, 1-
429, 2005
80. Dissolution testing for solid oral drug products: Theoretical considerations, H
Zhang, LX Yu, Journal of Cell Science, 5, Vol 7, 26-31, 2004
81. Drug dissolution, Available [online] http://www.boomer.org/c/p3/c23/c2303.html,
2011, Accessed on the 29th January 2011
82. Approaches for enhancing the dissolution of poorly soluble drugs, PhD thesis, A
Naseem, University of Brighton, 2004
83. The rate of solution of solid substances in their own solutions, AA Noyes, WR
Whitney, Journal of Physical Chemistry, 16, Vol 128, 930-934, 1897
84. Continuous flow apparatus for the determination of the dissolution
characteristics of tablets and capsules, M Pernarowski, W Woo, RO Searl,
Journal of Pharmaceutical Science, 8, Vol 57, 1419-1421, 1968
85. Pharmaceutical analysis, DG Watson, Elsevier Churchill Livingstone, London,
2nd Edition, 88-99, 2005

43
86. The Evaporation of ibuprofen from ibuprofen-starch mixtures using
simultaneous TG-DTA, S Lerdkanchanaporn, D Dollimore, Thermochimica Acta,
Vol 357-358, 71-78, 2000
87. A thermal analysis study of ibuprofen and starch mixtures using simultaneous
TG-DTA, S Lerdkanchanaporn, Thermochimica Acta, Vol 340-341, 131-138,
1999
88. Thermodynamic study of ibuprofen by adiabatic calorimetry and thermal
analysis, F Xu, LX Sun, ZC Tan, JG Liang, RL Li, Thermochimica Acta, Vol 412,
33-37, 2004
89. Novel inclusion complex of ibuprofen tromethamine with cyclodextrins: Physico-
chemical characterization, MM Al Omari, NH Daraghmeh, MI El-Barghouthi, MB
Zughul, BZ Chowdhry, SA Leharne, AA Badwan, Journal of Pharmaceutical and
Biomedical Analysis, Vol 50, 449-458, 2009
90. Improving the solubility and dissolution of poorly soluble drugs, PhD thesis, S
David, Aston University, 2005
91. Driving forces and the influence of the buffer composition on the complexation
reaction between ibuprofen and HPCD, GL Perlovich, M Skar, A Bauer-Brandl,
European Journal of Pharmaceutical Sciences, Vol 20, 197-200, 2003
92. Bioavailability of ibuprofen from hot-melt extruded mini-matrices, C De
Brabander, C Vervaet, LV Bortel, JP Remon, International Journal of
Pharmaceuticals, Vol 271, 77-84, 2004
93. Discovery, mechanisms of action and safety of ibuprofen, KD Rainsford, IJCP
Supplement, 3-8, 2003
94. Biopharmaceutical classification system: The scientific basis for biowaiver
extensions, LX Yu, GL Amidon, JE Polli, H Zhao, MU Mehta, DP Conner, VP
Shah, LJ Lesko, ML Chen, VHL Lee, AS Hussain, Pharmaceutical Research, 7,
Vol 19, 921-925, 2002
95. Ketoprofen: A review of its pharmacologic and clinical properties, TG Kantor,
Pharmacotherapy, 3, Vol 6, 93-103, 1986

44
96. Microencapsulation of semisolid ketoprofen/polymer microspheres, GF Palmieri,
G Bonacucina, P Di Martino, S Martelli, International Journal of Pharmaceutics,
Vol 242, 175-178, 2002
97. Modern bioavailability, bioequivalence, and biopharmaceutics classification
system. New scientific approaches to international regulatory standards, R
Lobenberg, GL Amidon, European Journal of Pharmaceutics and
Biopharmaceutics, Vol 50, 3-12, 2000
98. The influence of the physicochemical characteristics and pharmacokinetic
properties of selected NSAID’S on their transdermal absorption, E Beetge, J Pu
Plessis, DG Muller, C Goosen, FJ Van Rensburg, International Journal of
Pharmacy, Vol 193, 261-264, 2000
99. Solubilization and dissolution of insoluble weak acid, ketoprofen: Effects of pH
combined with surfactant, JJ Sheng, NA Kasim, R Chandrasekharan, GL
Amidon, European Journal of Pharmaceutical Sciences, Vol 29, 306-314, 2006
100. Binding, molecular mechanics, and thermodynamics of cyclodextrin inclusion
complexes with ketoprofen in aqueous medium, D Diaz, CME Lianos, MJB
Bernad, JG Mora, Pharmaceutical Development and Technology, 3, Vol 3, 307-
313, 1998
101. Interaction of ketoprofen and ibuprofen with β-cyclodextrins in solution and in
solid state, P Mura, GP Bettinetti, A Manderioli, MT Faucci, G Bramanti, M
Sorrenti, International Journal of Pharmaceutics, Vol 166, 189-203, 1998
102. Determination of flurbiprofen in pharmaceutical formulations by UV
spectrophotometry and liquid chromatography, C Sajeev, PR Jadhav, D
Ravishankar, RN Saha, Analytica Chimica Acta, Vol 463, 207-217, 2002
103. Characteristics of the transdermal transport of flurbiprofen and indomethacin,
Q Li, TY Kato, Y Sai, Y Kubo, A Tsuji, Journal of Controlled Release, Vol 110,
542-556, 2006
104. Photochemical and photophysical properties, and photodegradation
mechanism, of the non-steroid anti-inflammatory drug, flurbiprofen, KAK Musa,
LA Eriksson, Journal of Photochemistry and Photobiology A: Chemistry, Vol
202, 48-56, 2009
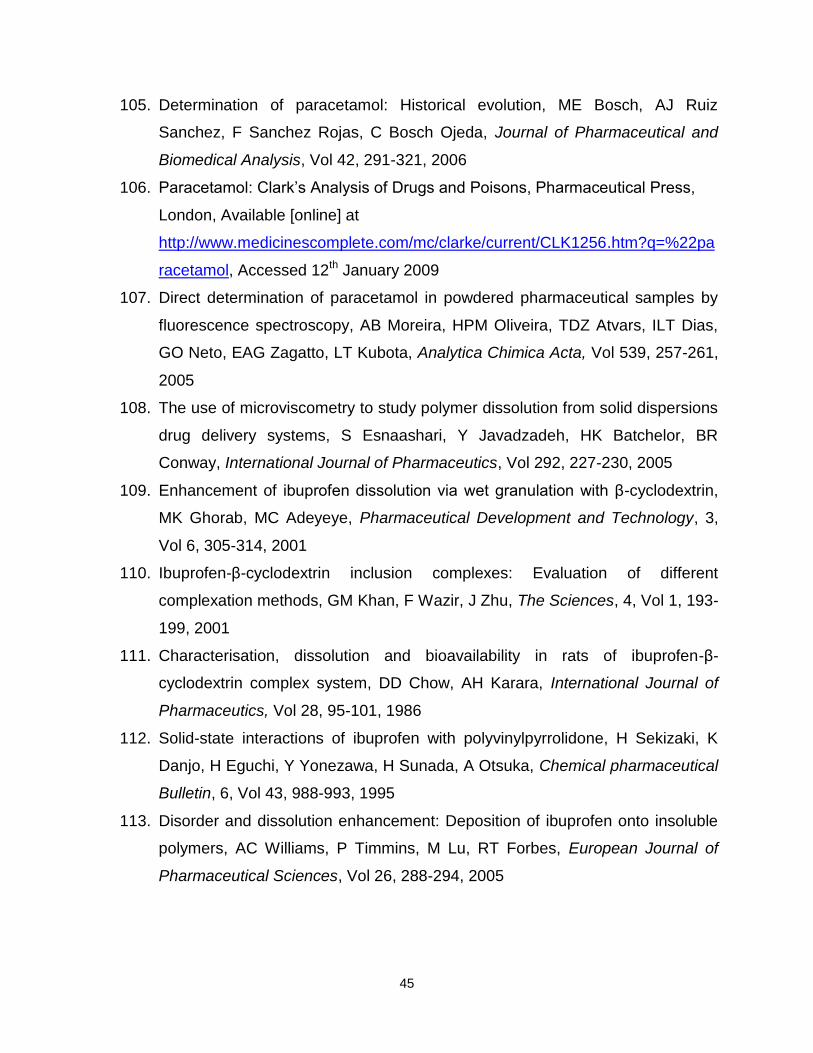
45
105. Determination of paracetamol: Historical evolution, ME Bosch, AJ Ruiz
Sanchez, F Sanchez Rojas, C Bosch Ojeda, Journal of Pharmaceutical and
Biomedical Analysis, Vol 42, 291-321, 2006
106. Paracetamol: Clark’s Analysis of Drugs and Poisons, Pharmaceutical Press,
London, Available [online] at
http://www.medicinescomplete.com/mc/clarke/current/CLK1256.htm?q=%22pa
racetamol, Accessed 12th January 2009
107. Direct determination of paracetamol in powdered pharmaceutical samples by
fluorescence spectroscopy, AB Moreira, HPM Oliveira, TDZ Atvars, ILT Dias,
GO Neto, EAG Zagatto, LT Kubota, Analytica Chimica Acta, Vol 539, 257-261,
2005
108. The use of microviscometry to study polymer dissolution from solid dispersions
drug delivery systems, S Esnaashari, Y Javadzadeh, HK Batchelor, BR
Conway, International Journal of Pharmaceutics, Vol 292, 227-230, 2005
109. Enhancement of ibuprofen dissolution via wet granulation with β-cyclodextrin,
MK Ghorab, MC Adeyeye, Pharmaceutical Development and Technology, 3,
Vol 6, 305-314, 2001
110. Ibuprofen-β-cyclodextrin inclusion complexes: Evaluation of different
complexation methods, GM Khan, F Wazir, J Zhu, The Sciences, 4, Vol 1, 193-
199, 2001
111. Characterisation, dissolution and bioavailability in rats of ibuprofen-β-
cyclodextrin complex system, DD Chow, AH Karara, International Journal of
Pharmaceutics, Vol 28, 95-101, 1986
112. Solid-state interactions of ibuprofen with polyvinylpyrrolidone, H Sekizaki, K
Danjo, H Eguchi, Y Yonezawa, H Sunada, A Otsuka, Chemical pharmaceutical
Bulletin, 6, Vol 43, 988-993, 1995
113. Disorder and dissolution enhancement: Deposition of ibuprofen onto insoluble
polymers, AC Williams, P Timmins, M Lu, RT Forbes, European Journal of
Pharmaceutical Sciences, Vol 26, 288-294, 2005

46
114. Product development studies on the tablet formulation of ibuprofen to improve
bioavailability, LK Ghosh, NC Ghosh, M Chatterjee, BK Gupta, Drug
development and industrial Pharmacy, 5, Vol 24, 473-477, 1998
115. Characteristics of the in vitro release of ibuprofen from polyvinylpyrrolidone
solid dispersions, NM Najib, M Suleiman, A Malakh, International Journal of
Pharmaceutics, Vol 32, 229-236, 1986
116. Factors affecting the dissolution of ketoprofen from solid dispersions in various
water-soluble polymers, K Takayama, N Nambu, T Nagai, Chemical
pharmaceutical Bulletin, 8, Vol 30, 3013-3016, 1982
117. Inclusion complexes of ketoprofen with β-cyclodextrins: Oral pharmacokinetics
of ketoprofen in humans. PT Tayade, PR Vavia, Indian Journal of
Pharmaceutical Sciences, 2, Vol 68, 164-170, 2006
118. Effects of cyclodextrin derivatives on bioavailability of ketoprofen, HJ Ahn, KM
Kim, JS Choi, CK Kim, Drug Development and Industrial Pharmacy, 4, Vol 23,
397-401, 1997
119. Microspheres for colonic delivery of ketoprofen-hydroxypropyl-β-cyclodextrin
complex, F Maestrelli, N Zerrouk, M Cirri, N Mennini, P Mura, European
Journal of Pharmaceutical Sciences, Vol 34, 1-11, 2008
120. Physical-chemical characterisation of binary and ternary systems of ketoprofen
with cyclodextrins and phospholipids, M Cirri, F Maestrelli, N Mennini, P Mura,
Journal of Pharmaceutical and Biomedical Analysis, Vol 50, 683-689, 2009
121. Influence of the preparation method on the physical-chemical properties of
ketoprofen-cyclodextrin-phosphatidylcholine ternary systems, M Cirri, F
Maestrelli, N Mennini, P Mura, Journal of Pharmaceutical and Biomedical
Analysis, Vol 50, 690-694, 2009
122. Dissolution, solubility, XRD, and DSC studies on flurbiprofen-nicotinamide solid
dispersions, MM Varma, JK Pandi, Drug Development and Industrial
Pharmacy, Vol 31, 417-423, 2005
123. Development of fast-dissolving tablets of flurbiprofen-cyclodextrin complexes,
M Cirri, C Rangoni, F Maestrelli, G Corti, P Mura, Development and Industrial
Pharmacy, Vol 31, 697-707, 2005

47
124. Preparation and evaluation of flurbiprofen dry elixir as a novel dosage form
using a spray-dying technique, CK Kim, YS Yoon, JY Kong, International
Journal of Pharmaceutics, Vol 120, 21-31, 1995
125. Evaluation of the bioavailability of flurbiprofen and its β-cyclodextrin inclusion
complex in four different doses upon oral administration to rats, A Muraoka, T
Tokumura, Y Machida, European Journal of Pharmaceutics and
Biopharmaceutics, Vol 58, 667-671, 2004
126. Improvement of oral bioavailability of flurbiprofen from flurbiprofen/β-
cyclodextrin inclusion complex by action of cinnarizine, T Tokumura, A
Muraoka, Y Machida, European Journal of Pharmaceutics and
Biopharmaceutics, Vol 73, 202-204, 2009
127. The influence of β-cyclodextrin on the solubility and dissolution rate of
paracetamol solid dispersions, Journal of Pharmaceutical Pharmacology, Vol
44, 52-55, 1992
128. Cyclodextrins, Pharmaceutical Excipients, Pharmaceutical Press, London,
Available [online] at
http://www.medicinescomplete.com/mc/excipients/current/1001937155.htm?q=
%22c Assessed on the 14th August 2009
129. Cyclodextrins as sustained-release carriers, VR Sinha, A Nanda, R Kumria,
Pharmaceutical Technology, Vol 1, 36-46, 2002
130. Microcalorimetric investigation of the complexation between 2-hydroypropyl-β-
cyclodextrin and amine drugs with the diphenylmethyl functionality, W Tong, JL
Lach, T Chin, JK Guillory, Journal of Pharmaceutical and Biomedical Analysis,
10-12, Vol 9, 1139-1146, 1991
131. Povidone, Pharmaceutical Excipients, Pharmaceutical Press, London,
Available[online] at
http://www.medicinescomplete.com/mc/excipients/current/1001937155.htm?q=
%22c Assessed on the 14th August 2009
132. In vitro controlled drug release from loaded Microspheres – dose regulation
through formulation, LJ Waters, EV Pavlakis, Journal of Pharmacy &
Pharmaceutical Sciences, 4, Vol 10, 464-472, 2007

48
133. Cyclodextrin complexes of salts of acidic drugs. Thermodynamic properties,
structural features, and pharmaceutical applications, E Redenti, L Szente, J
Szejtli, Journal of Pharmaceutical Sciences, 8, Vol 90, 979-986, 2001
134. Enhanced bioavailability of process-induced fast-dissolving ibuprofen
cogranulated with β-cyclodextrin, MK Ghorab, MC Adeyeye, Journal of
Pharmaceutical Sciences, 8, Vol 92, 1690-1697, 2003
135. Evaluation of cyclodextrin solubilisation of drugs, T Loftsson, D Hreinsdottir, M
Masson, International Journal of Pharmaceutics, Vol 302, 18-28, 2005
136. Cyclodextrin complexation of NSAID’s: Physicochemical characteristics, T
Loftsson, BJ Olafsdottir, H Frioriksdottir, S Jonsdottir, European Journal of
Pharmaceutical Sciences, Vol 1, 95-101, 1993
137. Cyclodextrins: Their future in drug formulation and delivery, VJ Stella, RA
Rajewski, Pharmaceutical Research, 5, Vol 14, 556-567, 1997
138. Cyclodextrin based novel drug delivery systems, A Vyas, S Saraf, S Saraf,
Journal of Inclusion Phenomena and Macrocyclic Chemistry, Vol 62, 23-42,
2008
139. Use of dehydrated beta-cyclodextrin as pharmaceutical excipient, MA Torricelli,
L Muggetti, R De Ponte, Drug Development and Industrial Pharmacy, 15, Vol
20, 2381-2393, 1994
140. Supramolecular chemistry of cyclodextrins in enzyme technology, R Villalonga,
R Cao, A Fragoso, Chemical Review, Vol 107, 3088-3116, 2007
141. Improvement of drug properties by cyclodextrins, K Uekama, F Hirayama, The
Practice of medicinal Chemistry, Elsevier, London, 649-673, 2003
142. Cyclodextrins – Enabling excipients: Their present and future use in
pharmaceuticals, DO Thomson, Critical Reviews in Therapeutic Drug Carrier
Systems, 1, Vol 14, 1-104, 1997
143. The influence of the preparation methods on the inclusion of model drugs in a
β-cyclodextrin cavity, PJ Salustio, G Feio, JL Figueirinhas, JF Pinto, HM Cabral
Marques, European Journal of Pharmaceutics and Biopharmaceutics, Vol 71,
377-386, 2009

49
144. Cyclodextrins as pharmaceutical solubilisers, ME Brewster, T Loftsson,
Advanced Drug Delivery Reviews, Vol 59, 645-666, 2007
145. Mechanism of drug dissolution rate enhancement from β-cyclodextrin-drug
systems, OI Corrigan, CT Stanley, Journal of Pharmaceutical Pharmacology,
Vol 34, 621-626, 1982
146. Mechanisms of drug release from cyclodextrin complexes, VJ Stella, VM Rao,
EA Zannou, V Zia, Advanced Drug Delivery Review, Vol 36, 3-16, 1999
147. Cyclodextrin-based controlled drug release system, F Hirayama, K Uekama,
Advanced Drug Delivery Review, Vol 36, 125-141, 1999
148. An intravenous toxicity study of 2-hydroxypropyl-β-cyclodextrin, a useful drug
solubiliser, in rats and monkeys, ME Brewster, KS Estes, N Bodor,
International Journal of Pharmaceutics, Vol 59, 231-243, 1990
149. Hydroxypropyl-β-cyclodextrin: Preparation and characterization; effects on
solubility of drugs, J Pitha, J Milecki, H Fales, L Pannell, K Uekama,
International Journal of Pharmaceutics, Vol 29, 73-82, 1986
150. Pharmaceutical applications of cyclodextrins. III. Toxicological issues and
safety evaluation, T Irie, K Uekama, Journal of Pharmaceutical Sciences, 2,
Vol 86, 147-162, 1997
151. Hydroxypropyl-β-cyclodextrin, RDI division of Fitzgerald industries, Vol 1, 1-12,
2010
152. 2-hydroxypropyl- β-cyclodextrin, Sigma product information
153. Development and characterisation of paracetamol complexes with
hydroxypropyl-β-cyclodextrin, S Talegaonkar, AY Khan, RK Khar, FJ Ahmad,
ZI Khan, Iranian Journal of Pharmaceutical Research, 2, Vol 6, 95-99, 2007
154. 2-hydroxypropyl-β-cyclodextrin (HP-β-CD): A toxicology review, S Gould, RC
Scott, Food and Chemical Toxicology, Vol 43, 1451-1459, 2005
155. A rapid screening tool for estimating the potential of 2- hydroxypropyl-β-
cyclodextrin complexation for solubilisation purposes, A Trapani, A Lopedota,
N Denora, V Laquintana, M Franco, A Latrofa, G Trapani, G Liso, International
Journal of Pharmaceutics, Vol 295, 163-175, 2005

50
156. Studies in dissolution enhancement of atenolol, Part 1, M Moneghini, A
Carcano, G Zingone, B Perissutti, International Journal of Pharmaceutics, Vol
175, 177-183, 1998
157. Inhibitory effect of polyvinylpyrrolidone on the crystallisation of drugs, H
Sekikawa, M Nakano, T Arita, Chemical Pharmaceutical Bulletin, 1, Vol 26,
118-126, 1978,
158. Dissolution, characteristics of reserpine-polyvinylpyrrolidone co-precipitates,
TR Bates, Journal of Pharmaceutical Pharmacology, Vol 21, 710-712, 1969
159. Inhibition of indomethacin crystallisation in polyvinylpyrrolidone coprecipitates,
M Yoshioka, BC Hancock, G Zografi, Journal of Pharmaceutical Sciences, 8,
Vol 84, 983-986, 1995
160. Amorphous spray-dried hydroflumethiazide-polyvinylpyrrolidone systems:
Physicochemical properties, OI Corrigan, EM Holohan, Journal of
Pharmaceutical Pharmacology, Vol 36, 217-221, 1984
161. Effect of polyvinylpyrrolidone on the crystallinity and dissolution rate of solid
dispersions of the anti-inflammatory CI-987, AS Kearney, DL Gabriel, SC
Mehta, GW Radebaugh, International Journal of Pharmaceutics, Vol 104, 169-
174, 1994
162. Raman and thermal analysis of indomethacin/PVP solid dispersions enteric
microparticles, A Fini, C Cavallari, F Ospitali, European Journal of
Pharmaceutics and Biopharmaceutics, Vol 70, 409-420, 2008
163. Dissolution behaviour and gastrointestinal absorption of dicumarol from solid
dispersions systems of dicmarol-polyvinylpyrrolidone and dicumarol-β-
cyclodextrin, H Sekikawa, N Fukuda, M Takada, K Ohtani, T Arita, M Nakano,
Chemical Pharmaceutical Bulletin, 4, Vol 31, 1350-1356, 1983
164. Dissolution behaviour of prednisolone from solid dispersions systems with
cyclodextrins and polyvinylpyrrolidone, N Fukuda, N Higuchi, M Ohno, H
Kenmochi, H Sekikawa, M Takada, Chemical Pharmaceutical Bulletin, 3, Vol
34, 1366-1369, 1986
165. Solubilisation and interaction of naproxen with polyvinylpyrrolidone in aqueous
solution and in solid state, GP Bettinetti, P Mura, A Liguori, G Bramanti,

51
Pharmaceutical Technology and Pharmacy Education, 11, Vol 43, 331-343,
1988
166. Polymer-mediated disruption of drug crystallinity, CF Rawlinson, AC Williams,
P Timmins, I Grimsey, International Journal of Pharmaceutics, Vol 336, 42-48,
2007
167. Crystallisation inhibition in solid dispersions of MK-0591 and
polyvinylpyrrolidone polymers, K Khougaz, SD Clas, Journal of Pharmaceutical
Sciences, 10, Vol 89, 1325-1334, 2000
168. Inhibition of sulfathiazole crystals growth by polyvinylpyrrolidone, AP Simonelli,
C Mehta, WI Higuchi, Journal of Pharmaceutical Sciences, 5, Vol 59, 1970

Chapter 2
Materials and Methods

52
Chapter 2
In this research a series of drug-excipient formulations were manufactured using
conventional heating and microwave heating methods. All resultant products were then
subjected to an array of analytical techniques to fully characterise their properties and
behaviour.
Materials and Methods
2.1 Materials
Ibuprofen was a gift from Galpharm, UK. Paracetamol, stearic acid, β-cyclodextrin,
polyvinylpyrrolidone and 2-hydroxypropyl-β-cyclodextrin were purchased from Sigma-
Aldrich, Dorset UK.
Ketoprofen and Flurbiprofen were purchased from TCI chemicals (Manchester
UK). Di-sodium hydrogen orthophosphate dodechydrate and sodium di-hydrogen
orthophosphate di-hydrate were purchased from Fisher Scientific, UK. All chemicals
were ≥99% purity and used as received with no further purification undertaken.
2.2 Methods
Figure 2.2.1.1 is an illustration of dry and wet formulation, seen on p55.
2.2.1 Formulation methods
Two methods of heating the drug-excipient mixture during the formulation
process were investigated, namely conventional heating and a novel microwave heating
method. In both cases it was possible to undertake the process both with, and without,
the presence of water as a solvent.

53
Method one: Conventional Heating, Wet Formulation1
1. 10g of the drug and excipient were prepared in a 1:1, 3:1, and a 1:9 mass ratio.
2. The dry powders were then tumble mixed for a period of five minutes.
3. A sample mass of powder (2g) was added to a beaker containing deionised
water to achieve a 10% w/v solution.
4. This was then transferred to a hotplate, the temperature was adjusted until the
water reached 85°C, as monitored by a fibre optic probe.
5. The temperature was monitored and maintained over a five minute period to
ensure all contents were at the required temperature.
6. The beaker was then removed from the hotplate and allowed to cool.
7. When the contents of the beaker were at 45°C, the resultant formulation was
collected through vacuum filtration and dried overnight in a desiccator over silica
gel.
2.2.1.2 Conventional Heating, Dry Formulation
1. 10g of the drug and excipient were prepared in a 1:1, 3:1, and a 1:9 mass ratio.
2. The dry powders were then tumble mixed for a period of five minutes.
3. A sample mass of powder (2g) was added to a crucible and placed in an oven
set at 85°C.
4. This was then left for a twenty minute period at this temperature.
5. The crucible and contents were removed from the oven and allowed to cool to
room temperature.
Method two: Microwave Heating, Wet Formulation.
1. 10g of the drug and excipient were prepared in a 1:1, 3:1, and a 1:9 mass ratio.
2. The dry powders were then tumble mixed for a period of five minutes.
3. A sample mass of powder (2g) was added to a beaker containing deionised
water to achieve a 10% w/v solution.
4. This was then transferred to the microwave oven.
5. The power was manually adjusted until the water temperature reached 85°C, as
monitored by the fibre optic probe, Figure 2.2.1.2 and Figure 2.2.1.3.

54
6. This temperature was then monitored and maintained for a five minute period to
ensure all contents were at the required temperature.
7. To mimic the conditions on the hotplate, the microwave power was then adjusted
to allow cooling of the water.
8. When the temperature reached 45°C, the product was collected through vacuum
filtration and dried overnight in a desiccator over silica gel.
2.2.1.4 Microwave Heating, Dry Formulation
1. 10g of the drug and excipient were prepared in a 1:1, 3:1, and a 1:9 mass ratio.
2. The dry powders were then tumble mixed for a period of five minutes.
3. A sample mass of powder (2g) was added to a crucible and placed in the
microwave oven.
4. The microwave power was then manually adjusted until the temperature reached
85°C, as monitored by the fibre optic probe, Figure 2.2.1.2 and Figure 2.2.1.3.
5. This temperature was maintained and monitored for a five minute period to
ensure all the contents were at the required temperature.
6. The microwave power was then adjusted to allow the sample to cool.

55
Figure 2.2.1.1: Illustration of dry and wet formulation process carried out using
microwave and conventional heating.

56
Figure 2.2.1.2 demonstrates the full microwave oven and power control unit (Arrow 1
and 2 respectively). Figure 2.2.1.3 illustrates the inside of the microwave cavity and
arrow 3 and 4 illustrate the novel parts of this equipment in terms of the fibre optic probe
(arrow 3) and the aluminium reflector (arrow 4).
Figure 2.2.1.3 – Microwave Cavity
Figure 2.2.1.2 – Microwave and Control unit
The following pages show examples of the types of experimental profiles that were
obtained for selected formulation experiments using the microwave oven. In all cases
the blue line represents the applied microwave power, shown as a percentage of the
total power (800W), while the red line shows the formulation temperature as monitored
by the fibre optic probe. During an experiment the user adjusts the microwave power, in
1% steps, as required to obtain the desired temperature. At the end of the formulation
period the microwave power was set to 0% so that the cooling profile could be recorded.
3
4
1
2
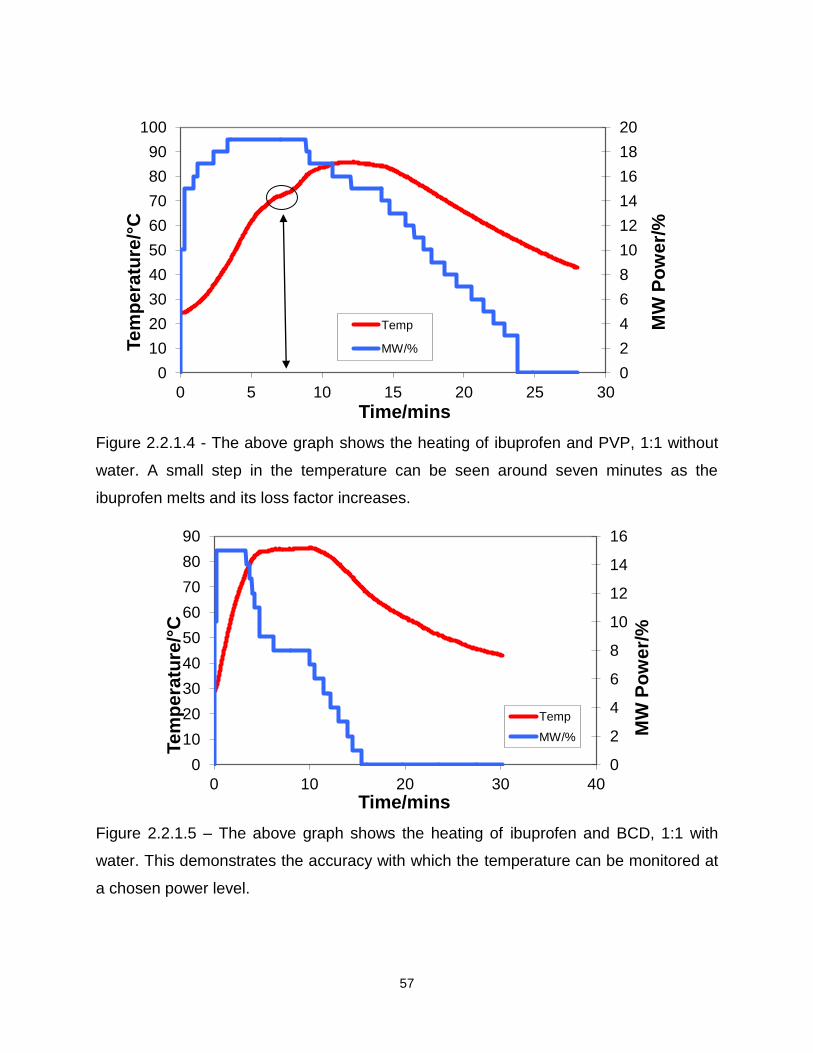
57
Figure 2.2.1.4 - The above graph shows the heating of ibuprofen and PVP, 1:1 without
water. A small step in the temperature can be seen around seven minutes as the
ibuprofen melts and its loss factor increases.
Figure 2.2.1.5 – The above graph shows the heating of ibuprofen and BCD, 1:1 with
water. This demonstrates the accuracy with which the temperature can be monitored at
a chosen power level.
0
2
4
6
8
10
12
14
16
18
20
0
10
20
30
40
50
60
70
80
90
100
0 5 10 15 20 25 30
MW
Po
we
r/%
Tem
pera
ture
/°C
Time/mins
Temp
MW/%
0
2
4
6
8
10
12
14
16
0
10
20
30
40
50
60
70
80
90
0 10 20 30 40
MW
Po
we
r/%
Tem
pera
ture
/°C
Time/mins
Temp
MW/%
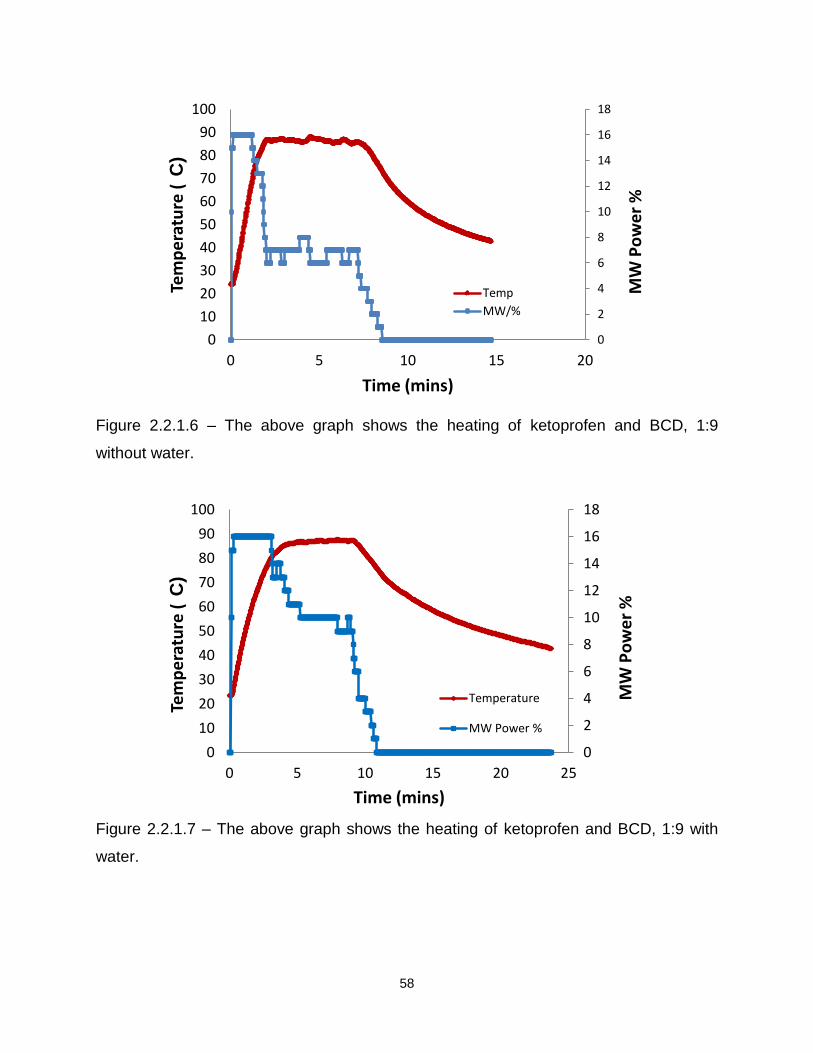
58
Figure 2.2.1.6 – The above graph shows the heating of ketoprofen and BCD, 1:9
without water.
Figure 2.2.1.7 – The above graph shows the heating of ketoprofen and BCD, 1:9 with
water.
0
2
4
6
8
10
12
14
16
18
0
10
20
30
40
50
60
70
80
90
100
0 5 10 15 20
Tem
pe
ratu
re (
C)
Time (mins)
Temp
MW/%
MW
Po
we
r %
0
2
4
6
8
10
12
14
16
18
0
10
20
30
40
50
60
70
80
90
100
0 5 10 15 20 25
Tem
pe
ratu
re (
C)
Time (mins)
Temperature
MW Power %
MW
Po
we
r %
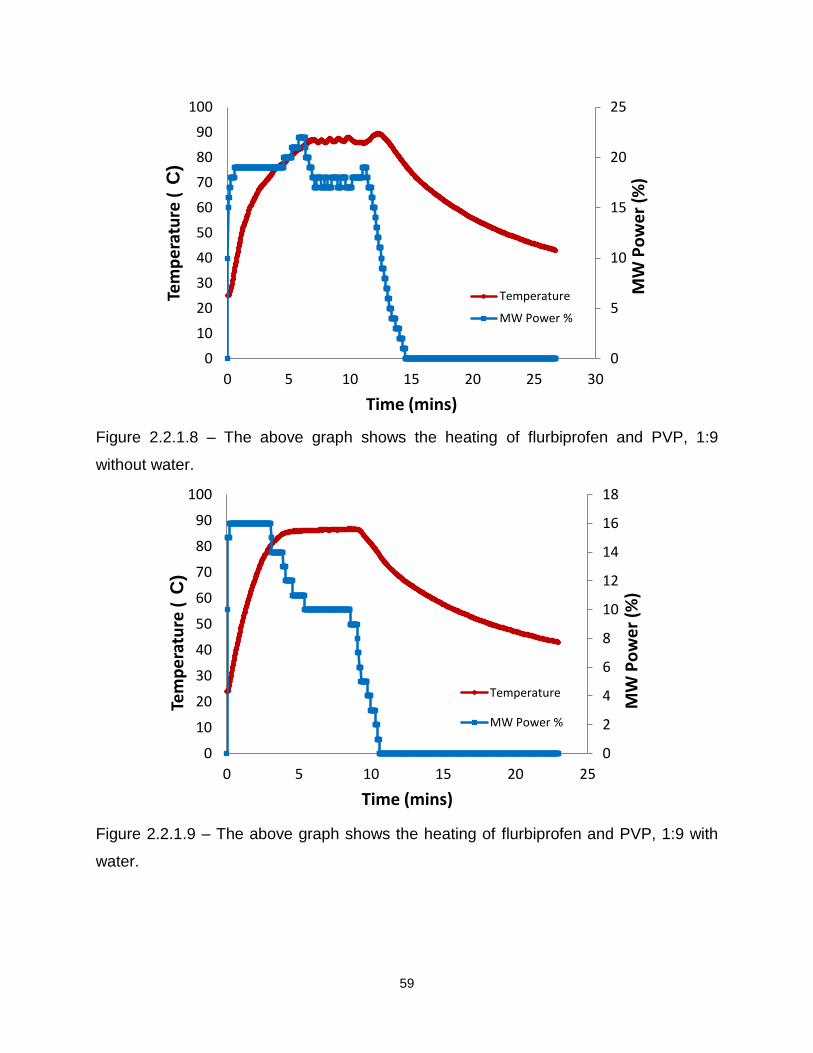
59
Figure 2.2.1.8 – The above graph shows the heating of flurbiprofen and PVP, 1:9
without water.
Figure 2.2.1.9 – The above graph shows the heating of flurbiprofen and PVP, 1:9 with
water.
0
5
10
15
20
25
0
10
20
30
40
50
60
70
80
90
100
0 5 10 15 20 25 30
Tem
pe
ratu
re (
C)
Time (mins)
Temperature
MW Power %
MW
Po
we
r (%
)
0
2
4
6
8
10
12
14
16
18
0
10
20
30
40
50
60
70
80
90
100
0 5 10 15 20 25
Tem
pe
ratu
re (
C)
Time (mins)
Temperature
MW Power %
MW
Po
we
r (%
)
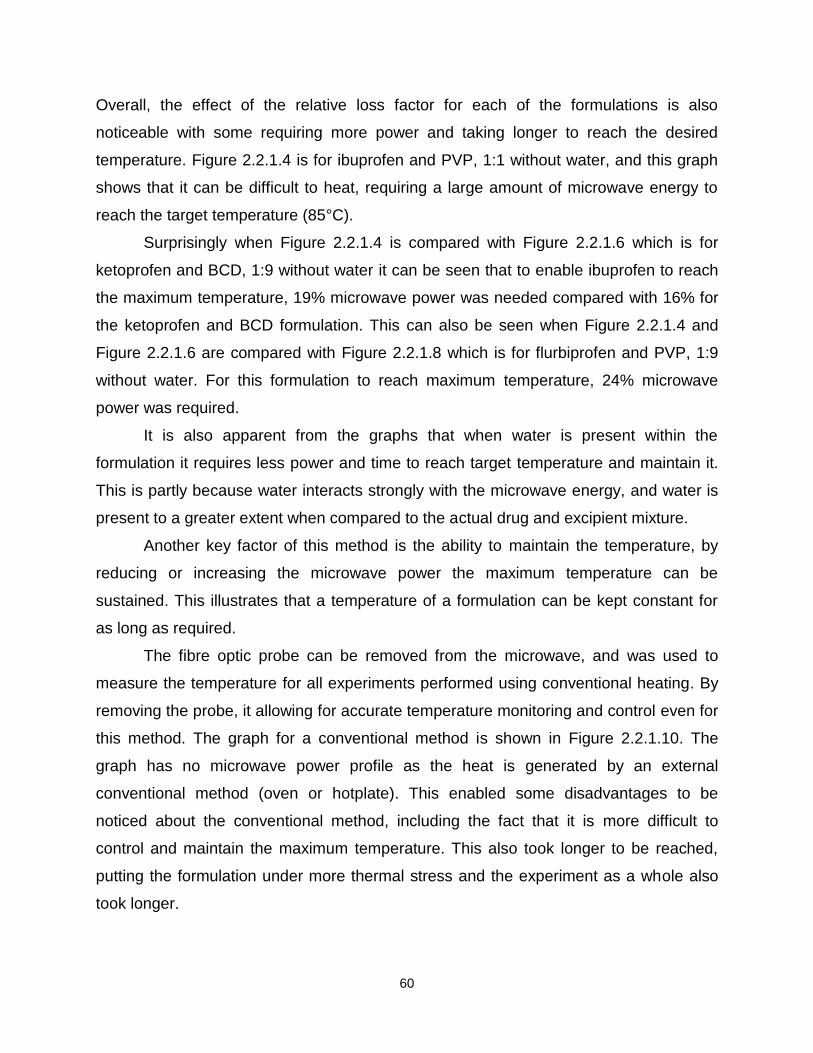
60
Overall, the effect of the relative loss factor for each of the formulations is also
noticeable with some requiring more power and taking longer to reach the desired
temperature. Figure 2.2.1.4 is for ibuprofen and PVP, 1:1 without water, and this graph
shows that it can be difficult to heat, requiring a large amount of microwave energy to
reach the target temperature (85°C).
Surprisingly when Figure 2.2.1.4 is compared with Figure 2.2.1.6 which is for
ketoprofen and BCD, 1:9 without water it can be seen that to enable ibuprofen to reach
the maximum temperature, 19% microwave power was needed compared with 16% for
the ketoprofen and BCD formulation. This can also be seen when Figure 2.2.1.4 and
Figure 2.2.1.6 are compared with Figure 2.2.1.8 which is for flurbiprofen and PVP, 1:9
without water. For this formulation to reach maximum temperature, 24% microwave
power was required.
It is also apparent from the graphs that when water is present within the
formulation it requires less power and time to reach target temperature and maintain it.
This is partly because water interacts strongly with the microwave energy, and water is
present to a greater extent when compared to the actual drug and excipient mixture.
Another key factor of this method is the ability to maintain the temperature, by
reducing or increasing the microwave power the maximum temperature can be
sustained. This illustrates that a temperature of a formulation can be kept constant for
as long as required.
The fibre optic probe can be removed from the microwave, and was used to
measure the temperature for all experiments performed using conventional heating. By
removing the probe, it allowing for accurate temperature monitoring and control even for
this method. The graph for a conventional method is shown in Figure 2.2.1.10. The
graph has no microwave power profile as the heat is generated by an external
conventional method (oven or hotplate). This enabled some disadvantages to be
noticed about the conventional method, including the fact that it is more difficult to
control and maintain the maximum temperature. This also took longer to be reached,
putting the formulation under more thermal stress and the experiment as a whole also
took longer.

61
Figure 2.2.1.10 – An illustration of temperature monitoring (red line) using the
conventional heating method, in this case for flurbiprofen and PVP, 1:1 with water.
In summary, two heating methods were employed in this research to formulate a series
of pharmaceutical formulations. To completely characterise all samples then required
the application of several analytical techniques.
2.2.2 Analytical methods 2.2.2.1 Isothermal Titration Calorimetry (ITC)
All ITC experiments were conducted using a Microcal VP-ITC Microcalorimeter.
The sample and reference cell were enclosed in an adiabatic outer shield jacket (to
maintain temperature and prevent loss of heat to surroundings), and during all
experiments both the sample and reference cell were completely filled. It should be
noted that the sample cell fill volume was 1.8mL. Experiments initially involved a
primary temperature equilibration period for the sample in the cell, followed by a
secondary equilibration with the syringe in place. Periodic calibration was conducted to
confirm the validity of the data using a known chemical calibration reaction, namely
barium chloride and 1,4,7,10,13,26-hexaoxacyclooctadecane (18-crown-6)2-5
0
10
20
30
40
50
60
70
80
90
100
0 10 20 30 40 50
Tem
pe
ratu
re (
C)
Time (mins)
Temperature

62
Experimental
1. The drug and cyclodextrin solutions were weighed out and placed in pH8 buffer
solution. Drug concentration ranged from 0.01M to 0.03M, with the cyclodextrin
concentrations ranging from 0.0005M to 0.001M.
2. All solutions were then de-gassed using a Thermovac for two minutes.
3. The reference cell was filled with pH8 phosphate buffer with no significant
difference in mass recorded before and after degassing. The sample cell was
filled with a known concentration of cyclodextrin solution up to 1.8mL, and the
syringe was filled with a drug solution of a known concentration up to 290μL.
4. The syringe was then placed in the sample cell with the stirring speed of the
syringe maintained at 300rpm to ensure thorough mixing throughout the
experiment.
5. Twenty nine injections were then injected in to the sample cell, each of 10μL
volume with sufficient time allowed between injections.
6. All experimental data was monitored via VP-ITC origin software, and this was
used to analyse all data with a standard fit model. This allowed reaction
stoichiometry (n), binding constant (Kb) and enthalpy to be calculated. The
change in Gibbs free energy was calculated using the derived Kb value and the
van’t Hoff isotherm with the change in entropy also calculated.
7. All six drug-cyclodextrin complexes were studied at three different temperatures,
namely 298, 303, 310K to determine the significance of temperature on the
complex formation.
8. All experiments were repeated in a minimum of triplicate for statistical validation
with all contributions from heats of dilution subtracted from isotherms.
9. A typical ITC graph is illustrated in Figure 2.2.2.1.1. It can be seen from the
titration curve that a number of peaks are present which correspond to each
injection and each peak is the differential power between the sample and the
reference cell (μCal sec-1). Each peak is deflected in the negative direction
showing an exothermic reaction had occurred. Towards the end of the titration it
can be seen that the exothermic peaks begin to reduce as all the possible
binding sites become saturated. From the titration curve and with the non-linear

63
least squares fit model the following parameters can be determined: Kb, ΔH and
consequently ΔG and ΔS. Kb is the binding constant and is determined from the
shape of the curve and is dependent on the concentration of the components,
enthalpy change (ΔH) is calculated from each injection and from the end point of
the titration (saturation point)6.
-0.50.0 0.51.0 1.52.0 2.53.0 3.54.0 4.55.0 5.56.0 6.57.0
-1.0
-0.8
-0.6
-0.4
-0.2
0.0
-5
0
-10 0 10 20 30 40 50 60 70 80 90 100110120
Time (min)µ
cal/sec
Data: Ketoprofen2_NDH
Model: OneSites
Chi^2/DoF = 118.1
N 1.24 ±0.151
K 763 ±136
H -3040 ±51.39
S 2.99
Molar Ratio
kcal/m
ole
of
inje
cta
nt
Figure 2.2.2.1.1- A typical ITC graph displaying the raw data and calculated data for a
drug-excipient interaction, in this case ketoprofen at 298K with BCD

64
As a result, at the end of each experiment the computer software (Origin) can then be
used to analyse the data and provide thermodynamic information on the above
parameters. Titration calorimetry is the only technique capable of defining all the above
parameters in a single experiment resulting in a nearly completed thermodynamic
profile of the reaction.
2.2.2.2 Differential Scanning Calorimetry (DSC)
Calorimetric experiments were performed using a DSC Mettler Toledo 822.
Periodic calibration was performed using Benzil to confirm temperature and enthalpy
values.
Experimental
1. Between 5-10mg of the samples were weighed out into a 40μL aluminium pan,
2. The lid for the sample pan was pierced using a pin and then crimped.
3. The samples were subjected to a heating and cooling method starting from 25°
and finishing at 125°C, 135°C, or 185°C (depending on the formulation) with an
isotherm of ten minutes after each stage. The heating rate was 10°C min-1 with
a gas flow of nitrogen at 80mL min-1.
2.2.2.3 Thermal Activity Monitor (TAM)
All experiments were performed using an isothermal calorimeter, (2277 TAM)
and the system was electronically calibrated to ensure the validity of the results.
Experimental
1. 100mg of each formulation was placed in a 5mL ampoule.
2. The cap was then crimped onto the ampoule.
3. The TAM was set at an isothermal temperature of 30°C and the samples were
lowered into it and allowed to equilibrate for a forty minute period.
4. The sample was then left running isothermally at 30°C for a four day period.
5. Heat changes were monitored and recorded using computer software that
recorded in real-time to allow a heat time profile to be determined.
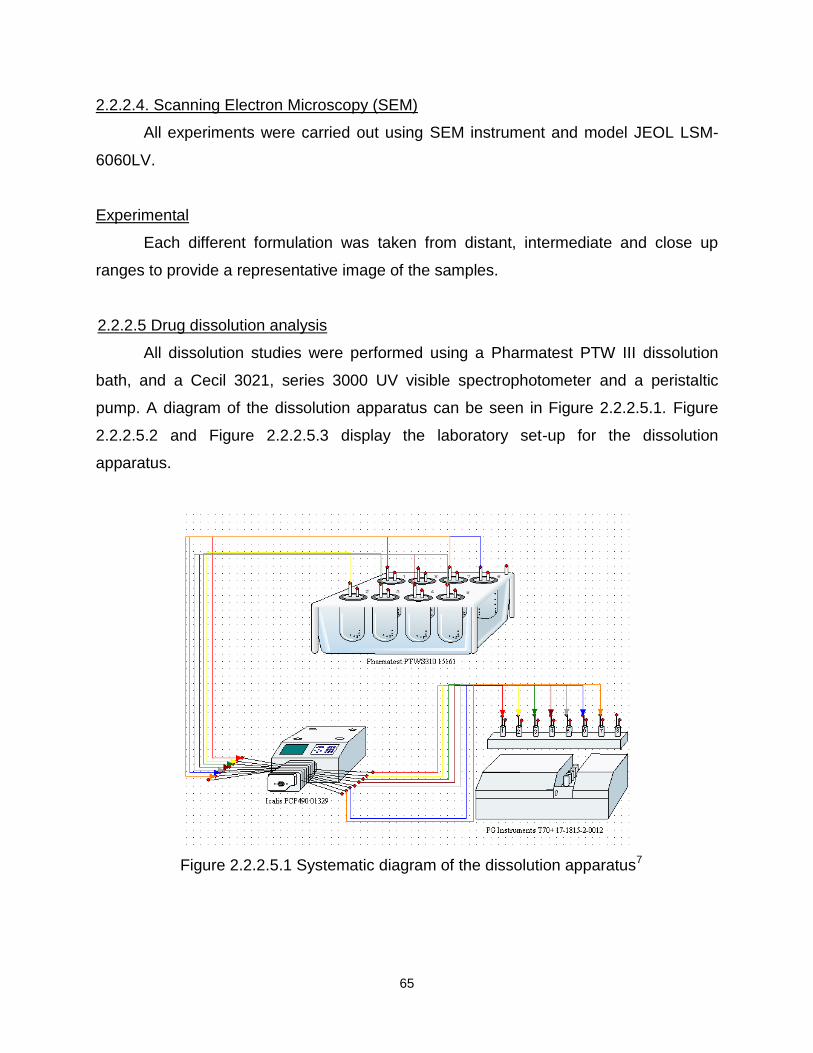
65
2.2.2.4. Scanning Electron Microscopy (SEM)
All experiments were carried out using SEM instrument and model JEOL LSM-
6060LV.
Experimental
Each different formulation was taken from distant, intermediate and close up
ranges to provide a representative image of the samples.
2.2.2.5 Drug dissolution analysis
All dissolution studies were performed using a Pharmatest PTW III dissolution
bath, and a Cecil 3021, series 3000 UV visible spectrophotometer and a peristaltic
pump. A diagram of the dissolution apparatus can be seen in Figure 2.2.2.5.1. Figure
2.2.2.5.2 and Figure 2.2.2.5.3 display the laboratory set-up for the dissolution
apparatus.
Figure 2.2.2.5.1 Systematic diagram of the dissolution apparatus7
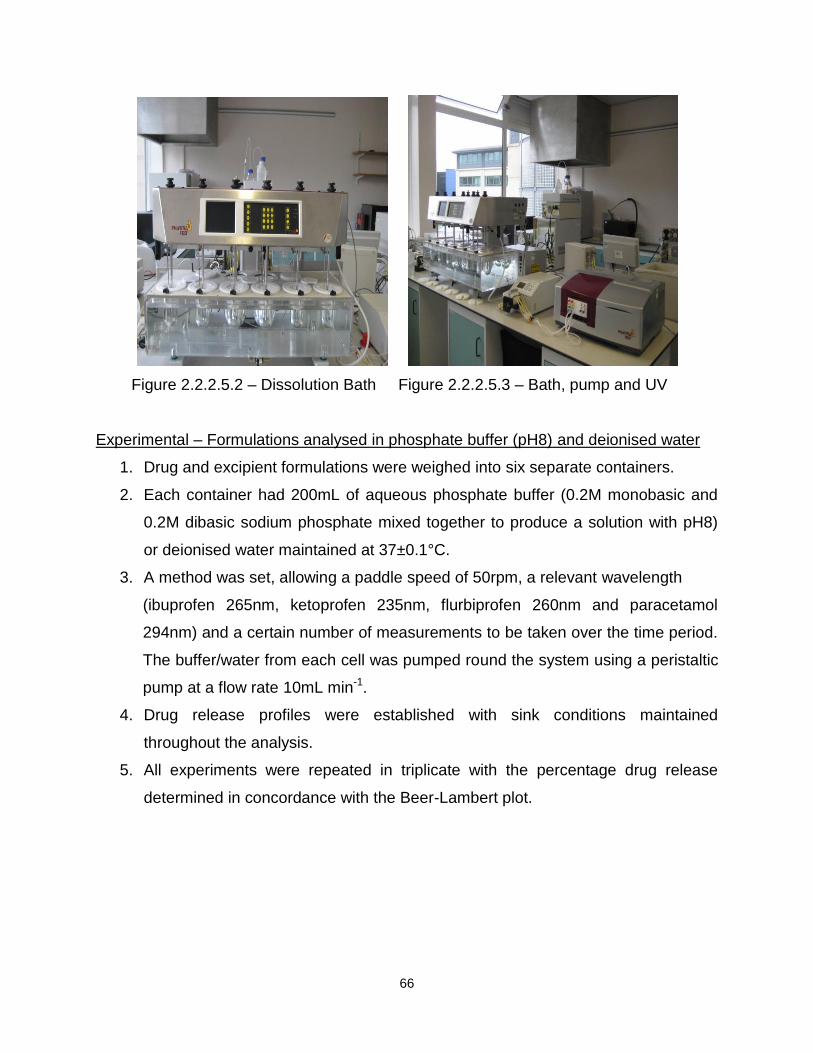
66
Figure 2.2.2.5.2 – Dissolution Bath Figure 2.2.2.5.3 – Bath, pump and UV
Experimental – Formulations analysed in phosphate buffer (pH8) and deionised water
1. Drug and excipient formulations were weighed into six separate containers.
2. Each container had 200mL of aqueous phosphate buffer (0.2M monobasic and
0.2M dibasic sodium phosphate mixed together to produce a solution with pH8)
or deionised water maintained at 37±0.1°C.
3. A method was set, allowing a paddle speed of 50rpm, a relevant wavelength
(ibuprofen 265nm, ketoprofen 235nm, flurbiprofen 260nm and paracetamol
294nm) and a certain number of measurements to be taken over the time period.
The buffer/water from each cell was pumped round the system using a peristaltic
pump at a flow rate 10mL min-1.
4. Drug release profiles were established with sink conditions maintained
throughout the analysis.
5. All experiments were repeated in triplicate with the percentage drug release
determined in concordance with the Beer-Lambert plot.

67
Determination of Beer-Lambert plots
To allow for the percentage drug release to be determined for each drug a Beer-
Lambert plot was established. A number of solutions with known concentrations were
tested in the dissolution bath. The absorbance was determined and the linear equation
was related to the percentage drug release for all formulations tested.
In summary, several analytical techniques were employed to characterise each
formulated sample to achieve a comprehensive understanding of the structure and
behaviour of the products. By combining all of the resultant data it was possible to
achieve an understanding of the application of microwave heating to pharmaceutical
formulations.

68
References
1. In vitro controlled drug release from loaded Microspheres – dose regulation
through formulation, LJ Waters, EV Pavlakis, Journal of Pharmacy &
Pharmaceutical Sciences, 4, Vol 10, 464-472, 2007
2. Microcal ITC user manual, tutorial guide, Version 5, 1998
3. Microcal ITC data analysis in origin, tutorial guide, version 5, 1998
4. Van’t hoff and calorimetric enthalpies from isothermal titration calorimetry: Are
there significant discrepancies, JR Horn, D Russell, EA Lewis, KP Murphy,
Biochemistry, Vol 40, 1774-1778, 2001
5. A test reaction from macrocyclic chemistry for calorimetric titrations, HJ
Buschmann, E Schollmeyer, Thermochimica Acta, Vol 333, 49-53, 1999
6. Optimizing experimental parameters in isothermal titration calorimetry: Variable
volume procedures, J Tellinghuisen, Journal of Physical Chemistry B, Vol 111,
11531-11537, 2007
7. A schematic of the dissolution apparatus as seen on the Icalis software program
(Version 3.0)

Chapter Three
Drug-Excipient Binding
(Analysis of Formulations using ITC)

69
Chapter 3
3.1 Introduction
One of the most fundamental methods of analysing a material is to monitor its
response as it is heated in a controlled manner, or maintained at a constant
temperature, and these responses can be measured by a range of calorimetric
methods. A way to investigate the interactions and compatibility of a drug and excipient
is to heat the two components and measure any changes that occur during this process
or combine drugs and excipients at one temperature. With this, important changes on a
molecular level and valuable conclusions about the sample, previous history,
preparation, chemical nature, and behaviour of the sample during its proposed use can
be determined.
Chapter Three concentrates on a technique called ITC, which provides
information on thermodynamic properties including binding constants, stoichiometry,
enthalpy, entropy and Gibb’s free energy associated with the interactions between
drugs and excipients. Also investigated will be the potential application of ITC to
thermodynamically differentiate the complex formation for three guest molecules
(ibuprofen, ketoprofen and flurbiprofen) of pharmaceutical interest with two forms of
cyclodextrins over a range of temperatures. This information can then be used to
determine and understand the complexation process including the strength of the
interaction between the drug and cyclodextrin and whether the interaction is favourable.
3.1.1 Overview of ITC
A full discussion of ITC can be found in Chapter One. ITC is a calorimetric
technique that is kept at one constant temperature throughout an experiment
(isothermal). The unit directly measures heat evolved or absorbed in liquid samples
(heat changes) as a result of mixing precise amounts of reactants (direct enthalpic
measurements). It contains two identical coin-shaped cells (sample and reference) that
are filled with liquid throughout the experiment. Both these cells are enclosed in an
adiabatic outer shield (jacket) and any temperature difference between the sample and
reference are monitored and measured. The entire experiment is computer controlled
and the user inputs the experimental parameters (temperature, number of injections,

70
injection volumes). Origin software is then used to analyse the ITC data using fitting
models which can then be used to calculate binding constants, reaction stoichiometry
(n), enthalpy, entropy and Gibbs free energy thus providing a complete thermodynamic
profile of the molecular interaction in a single experiment. Equations can be seen in
Chapter One (p17).
Once the various parameters have been determined, ITC can be used to
determine the strength of the drug and excipient interaction, the effect of temperature on
this interaction and the ratio of the drug to the excipient molecule.
A typical ITC titration curve is illustrated in Figure 3.1.1.1 for barium chloride and
18-crown-6 which is used for calibrating the ITC. The barium chloride forms a 1:1
complex with the crown ether which has a well characterised enthalpy of -33kJ mol-1(1-2).
Figure 3.1.1.1 – A typical ITC titration curve including raw data and calculated values for
barium chloride and 18-crown-6

71
The reaction for this particular compound shows a 1:1 interaction, with a ΔH value that
equals to -31±0.4kJ mol-1 which is in agreement with the literature (after taking into
consideration experimental and instrumental error). It can be seen from the graph, the
ΔH value is in calories therefore this value was converted from calories to Joules and
then Joules to kJ mol-1 to give the recognisable ΔH value.
3.2 Previous research
Extensive research has incorporated non-pharmaceutical compounds into
cyclodextrins to investigate the thermodynamic parameters and these include
complexes with benzene5, hexanol6, cyclohexanol7, butanediol8, benzoic acid9-10, amino
acids11-12, glucose13, and aspartame14. Despite the importance of understanding the
binding process of drugs to a significant excipient, little research has investigated the
thermodynamics of pharmaceutical complexes such as a drug to a cyclodextrin
molecule. However two papers published in 2007 and 2009 by Todorova et al and Xing
et al investigated the incorporation of ibuprofen and flurbiprofen into β-cyclodextrin15-16.
The former paper investigated the thermodynamic parameters of the reaction between
ibuprofen and β-cyclodextrin using a thermal activity monitor at a single temperature
(298K) and at pH7 (Tris-HCl buffer). The latter paper investigated the reaction between
flurbiprofen and β-cyclodextrin using ITC, over two different temperatures (293K and
313K) and a sodium phosphate buffer to give pH6 and pH8. However, the current
research is the first to investigate three different drugs (ibuprofen, ketoprofen and
flurbiprofen), into two different cyclodextrin compounds (β-cyclodextrin, and 2-
hydroxypropyl-β-cyclodextrin) at three temperatures 298, 303, and 310K using ITC.

72
3.3 Experimental
Six different guest-host interactions were investigated, each at three specific
temperatures, namely 298, 303, and 310K. In each case the reference cell was filled
with degassed phosphate buffer (pH8) and the sample cell was filled with one of the
cyclodextrin solutions. The stirring speed of the syringe was maintained at 300rpm to
ensure thorough mixing throughout the experiment. A total of twenty-nine consecutive
injections (10μL each) of the drug solution were then injected into the sample cell. Drug
concentrations in the syringe varied from 0.01-0.03M with the cyclodextrin
concentrations in the cell ranging from 0.0005-0.001M. All experiments were carried out
in triplicate to allow for an average to be determined, and in all cases heats of dilution
were investigated and subtracted from the final titration curves. To understand the
complexation process, it is important to realise the binding mechanism. An interaction
will occur once the drug molecule enters the cyclodextrin cavity in a reversible way, and
the more lipophilic (hydrophobic) part of the molecule will enter the cavity (lipophilic
cavity) with the more hydrophilic part remaining exposed to the bulk solvent16.
3.4 Results and discussion
ITC was used to determine the stoichiometry (n), binding constant (Kb) and
change in enthalpy (ΔH) for a total of eighteen complexation events. From these values
it is possible to calculate thermodynamic properties, i.e. changes in Gibbs free energy
(ΔG) and entropy (ΔS) for each complex formation. The results obtained can be seen in
Table 3.4.1 below with an example of the experimental data for a typical ITC result seen
in Figure 3.4.1 which has the corresponding binding isotherm alongside (stoichiometry,
binding constant and enthalpy were determined from this).

73
Drug Cyclodextrin Temperature (K)
Drug: CD Ratio
103 Kb
(dm3.mol
-1)
ΔH (kJ mol-1
) ΔG (kJ mol-1
) ΔS (kJ mol-1
)
Ibuprofen BCD 298 1:1 8.34 (± 0.6) -10.6 (± 0.4) -22.4 (±0.2) 0.04 (± 0.002)
303 1:1 6.72 (± 0.3) -12.2 (±0.6) -22.2 (±0.1) 0.03 (± 0.002)
310 1:1 9.51 (± 0.5) -12.8 (±0.2) -23.6 (±0.3) 0.03 (± 0.002)
2-(hydroxypropyl)-BCD 298 1:1 1.58 (± 0.1) -7.2 (±0.3) -18.2 (±0.1) 0.04 (± 0.002)
303 1:1 2.1 (± 0.8) -8.9(±1.0) -19.3 (±0.8) 0.03 (± 0.002)
310 1:1 2.52 (± 0.7) -11.1 (±1.1) -20.2 (±0.9) 0.03 (± 0.002)
Ketoprofen BCD 298 1:1 1.09 (± 0.1) -14.2 (±1.1) -17.3 (±0.1) 0.01 (±0.001)
303 1:1 1.14 (± 0.1) -16.0 (±0.5) -17.7 (±0.2) 0.01 (± 0.002)
310 1:1 1.14 (± 0.1) -17.4 (±0.1) -18.1 (±0.1) 0.01 (±0.001)
2-(hydroxypropyl)-BCD 298 1:1 0.48 (± 0.1) -10.2 (±0.1) -15.3 (±0.5) 0.02 (±0.001)
303 1:1 0.72 (± 0.1) -10.8 (±0.9) -16.7 (±0.1) 0.02 (± 0.002)
310 1:1 0.82 (± 0.1) -12.9 (±0.2) -17.3 (±0.1) 0.01 (±0.001)
Flurbiprofen BCD 298 1:1 14.93 (± 0.6) -15.1 (±1.4) -23.8 (±0.1) 0.03 (± 0.002)
303 1:1 8.83 (± 0.8) -15.0 (±1.9) -22.9 (±0.6) 0.03 (± 0.002)
310 1:1 5.44 (± 0.4) -15.0 (±0.6) -22.2 (±0.1) 0.02 (± 0.002)
2-(hydroxypropyl)-BCD 298 1:1 5.29 (± 0.1) -15.8 (±0.1) -21.2 (±0.1) 0.02 (± 0.002)
303 1:1 6.46 (± 0.1) -16.8 (±0.1) -22.1 (±0.1) 0.02 (±0.001)
310 1:1 6.53 (± 0.1) -18.5 (±0.2) -22.6 (±0.1) 0.01 (±0.001)
Table 3.4.1 – All ITC data conducted with ibuprofen, ketoprofen and flurbiprofen binding
to BCD and 2HPBCD.
It can be seen from the table that all the interactions between the three different drugs
and the two different cyclodextrins have a stoichiometry of 1:1 and are independent of
temperature. It is apparent from the data that, despite differences in the size of the
molecules, that a 1:1 stoichiometry is maintained between the drugs and both forms of
cyclodextrins. This ratio was also unaffected by temperature over the range studied.
However, there are significant differences in the binding constants, ΔH, and
consequently ΔG. The results are discussed in greater detail in the following sections.
Previously to this research only the interaction between flurbiprofen and BCD at 298 K,
and 303 K in pH6 and pH8 buffer was published with an enthalpy of ─17 kJ mol-1 and 19
kJ mol-1 (15). The enthalpy values presented in this work for this particular binding
process were all ─15 kJ mol-1 across the range of temperatures. The results obtained
correlated well with the published enthalpy values and suggests an unchanged binding

74
mechanism. The slight discrepancy in the enthalpy values may have come from
experimental and/or instrumental error. In addition to flurbiprofen, experimental data
was published for ibuprofen and BCD at 298 K which again showed similar ∆H values
(─14 kJ mol-1) to those presented in this research (─10 to ─12 kJ mol-1) after variation
within buffer and instrumentation has been taken into consideration. However despite
these slight discrepancies which are accountable for, it is possible to say that the data
obtained in this research is accurate and reliable and is a consequence of the
interaction between the drug and excipient.
Any differences seen within the reaction (binding constant, ∆H, ∆G and ∆S) can
be associated with the following differences: logP value of the drug, the choice of
cyclodextrin (BCD and the more sterically hindered 2HPBCD), and the chosen
temperature range.
Section 3.4.1 and onwards is a separation and explanation of the three individual
drugs with BCD and 2HPBCD. Each section investigates the results obtained and any
trends that can be seen between the drug and the two excipients. Section 3.4.2 is a
comparison of all the results obtained, each drug is then compared to determine any
differences in the thermodynamic parameters. All results are illustrated in Table 3.4.1.
3.4.1 Ibuprofen and BCD
It can be seen from Table 3.4.1 that as the temperature increases from 298-310K
there is a slight difference in the binding constant but it is largely unchanged. This
therefore suggests that an increase in temperature has minimal effect on the equilibria
for the formation of the ibuprofen-cyclodextrin complex.
The enthalpy change for ibuprofen and BCD increases over the temperature
range, showing the bonding becomes more exothermic as the temperature increases.
An enthalpy change arises mainly as a result of change in the interaction, for example
hydrogen bonding17-18. ΔG also shows a slight decrease to a more negative value with
an increase in temperature. The negative values for ΔG indicates that the complex has
less free energy than the free drug and cyclodextrin, and consequently the negative
value for enthalpy, negative values for Gibb’s free energy suggests binding is favoured
and this promotes the complex formation.
75
3.4.2 Ibuprofen and 2HPBCD
The reaction between Ibuprofen and 2HPBCD was also investigated. From the
results obtained, it can be seen that as the temperature increases so do the values for
ΔH, and ΔG. This shows that there is an increase in the strength of bonding interaction
as the temperature increases. For all the complexation events between ibuprofen, BCD
and 2HPBCD, the observed values are negative and it can be said that the process of
binding is exothermic and enthalpically driven. However when both the binding
constants and therefore the enthalpy, Gibb’s free energy and entropy were compared
for ibuprofen binding to BCD and ibuprofen to 2HPBCD it can be seen that ibuprofen
does form a complex with 2HPBCD but it is a relatively weak process (ibuprofen and
BCD show significantly higher negative values when compared to 2HPBCD). To
hypothesise, this result could be occurring because 2HPBCD has seven substituted
hydroxypropyl groups (CH2CH(OH)CH3) attached in the C6 position of each unit of the
cyclodextrin making it more sterically hindered. This will then make it more difficult for
any drug to bind to the cavity of the cyclodextrin thus lowering the binding constants,
ΔH, and ΔG.
3.4.3 Ketoprofen and BCD
For ketoprofen with BCD the binding constant showed little change over the
temperature range (298-310 K) and as a result the ratio of drug and excipient binding is
unaffected by an increase in the temperature of the reaction. However when the
temperature increases, there is a change in the enthalpy, and consequently Gibb’s free
energy. As the temperature increases, the enthalpy (ΔH) for the reaction also
decreases with ─14.2 kJ mol-1 obtained at 298 K and ─17.4 kJ mol-1 at 310 K. This
illustrates a more exothermic process is occurring, which may suggest that the strength
of the interaction between ketoprofen and the cyclodextrin cavity has increased.
Along with this decrease in enthalpy, there is an increase in negativity in the
Gibb’s free energy with a value of ─17.3 kJ mol-1 (±0.1) obtained for the reaction at 298
K and ─18.1 kJ mol-1 (±0.1) obtained at 310 K. Consequently the resultant complex has
less free energy than the free drug and BCD molecules and therefore binding is
favoured.
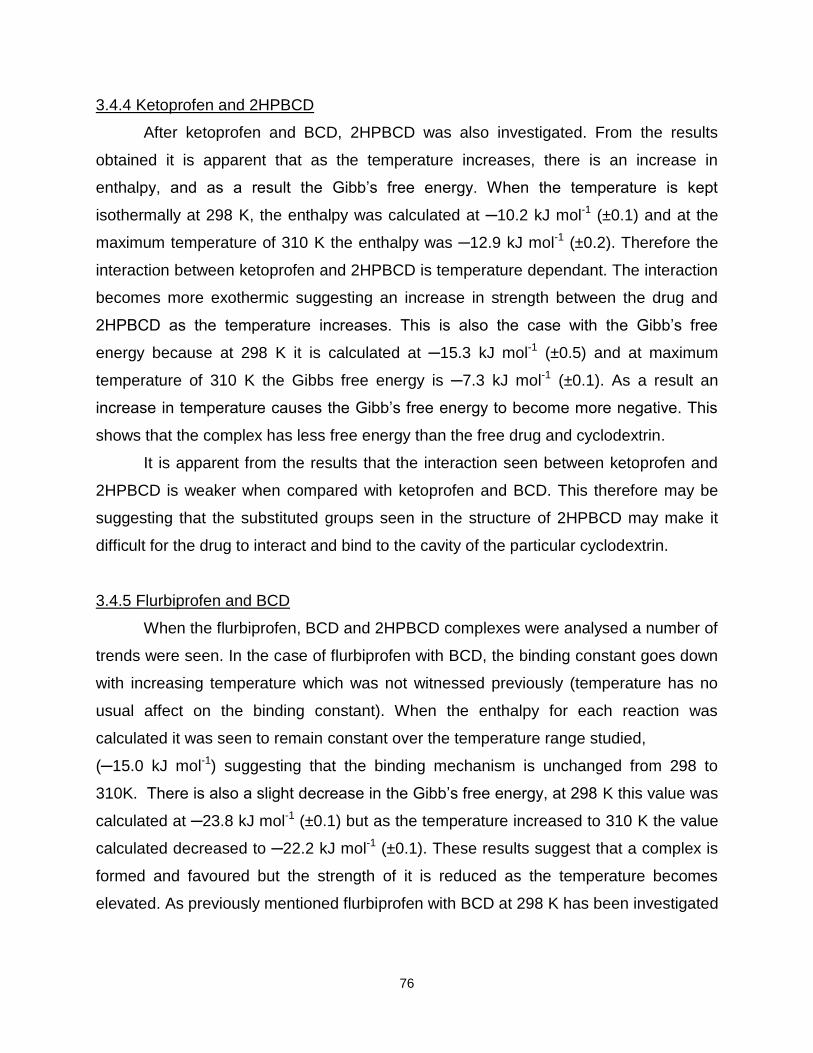
76
3.4.4 Ketoprofen and 2HPBCD
After ketoprofen and BCD, 2HPBCD was also investigated. From the results
obtained it is apparent that as the temperature increases, there is an increase in
enthalpy, and as a result the Gibb’s free energy. When the temperature is kept
isothermally at 298 K, the enthalpy was calculated at ─10.2 kJ mol-1 (±0.1) and at the
maximum temperature of 310 K the enthalpy was ─12.9 kJ mol-1 (±0.2). Therefore the
interaction between ketoprofen and 2HPBCD is temperature dependant. The interaction
becomes more exothermic suggesting an increase in strength between the drug and
2HPBCD as the temperature increases. This is also the case with the Gibb’s free
energy because at 298 K it is calculated at ─15.3 kJ mol-1 (±0.5) and at maximum
temperature of 310 K the Gibbs free energy is ─7.3 kJ mol-1 (±0.1). As a result an
increase in temperature causes the Gibb’s free energy to become more negative. This
shows that the complex has less free energy than the free drug and cyclodextrin.
It is apparent from the results that the interaction seen between ketoprofen and
2HPBCD is weaker when compared with ketoprofen and BCD. This therefore may be
suggesting that the substituted groups seen in the structure of 2HPBCD may make it
difficult for the drug to interact and bind to the cavity of the particular cyclodextrin.
3.4.5 Flurbiprofen and BCD
When the flurbiprofen, BCD and 2HPBCD complexes were analysed a number of
trends were seen. In the case of flurbiprofen with BCD, the binding constant goes down
with increasing temperature which was not witnessed previously (temperature has no
usual affect on the binding constant). When the enthalpy for each reaction was
calculated it was seen to remain constant over the temperature range studied,
(─15.0 kJ mol-1) suggesting that the binding mechanism is unchanged from 298 to
310K. There is also a slight decrease in the Gibb’s free energy, at 298 K this value was
calculated at ─23.8 kJ mol-1 (±0.1) but as the temperature increased to 310 K the value
calculated decreased to ─22.2 kJ mol-1 (±0.1). These results suggest that a complex is
formed and favoured but the strength of it is reduced as the temperature becomes
elevated. As previously mentioned flurbiprofen with BCD at 298 K has been investigated
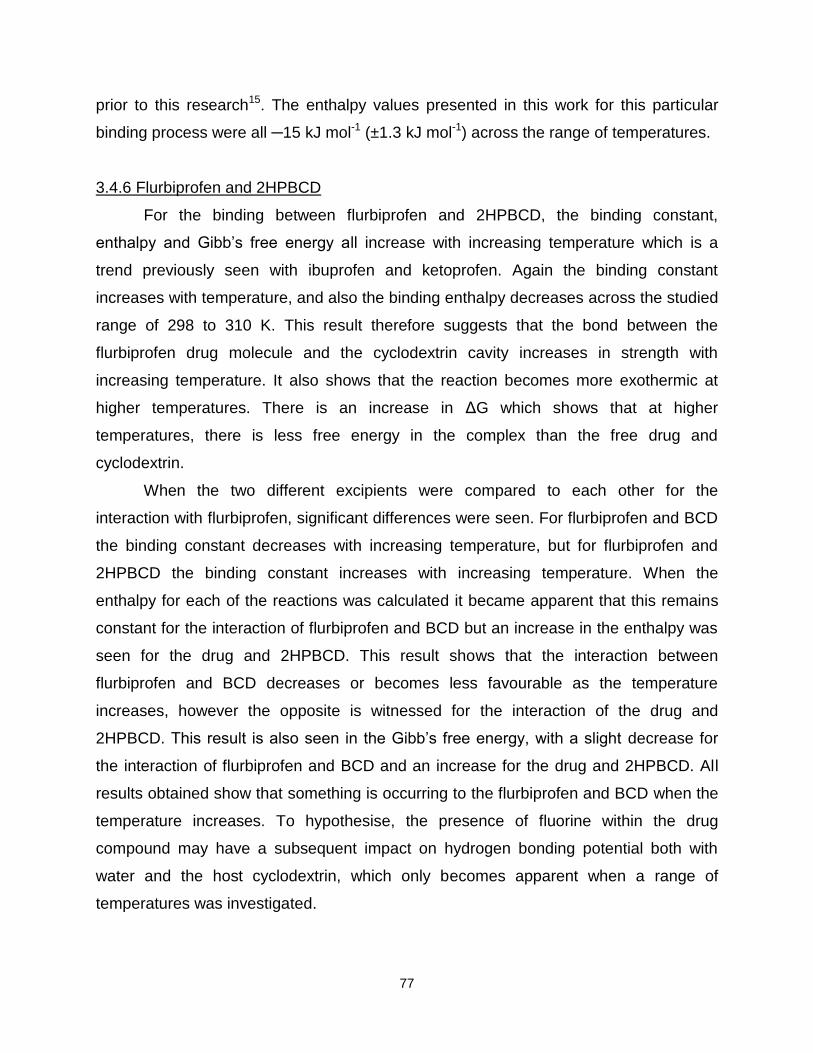
77
prior to this research15. The enthalpy values presented in this work for this particular
binding process were all ─15 kJ mol-1 (±1.3 kJ mol-1) across the range of temperatures.
3.4.6 Flurbiprofen and 2HPBCD
For the binding between flurbiprofen and 2HPBCD, the binding constant,
enthalpy and Gibb’s free energy all increase with increasing temperature which is a
trend previously seen with ibuprofen and ketoprofen. Again the binding constant
increases with temperature, and also the binding enthalpy decreases across the studied
range of 298 to 310 K. This result therefore suggests that the bond between the
flurbiprofen drug molecule and the cyclodextrin cavity increases in strength with
increasing temperature. It also shows that the reaction becomes more exothermic at
higher temperatures. There is an increase in ΔG which shows that at higher
temperatures, there is less free energy in the complex than the free drug and
cyclodextrin.
When the two different excipients were compared to each other for the
interaction with flurbiprofen, significant differences were seen. For flurbiprofen and BCD
the binding constant decreases with increasing temperature, but for flurbiprofen and
2HPBCD the binding constant increases with increasing temperature. When the
enthalpy for each of the reactions was calculated it became apparent that this remains
constant for the interaction of flurbiprofen and BCD but an increase in the enthalpy was
seen for the drug and 2HPBCD. This result shows that the interaction between
flurbiprofen and BCD decreases or becomes less favourable as the temperature
increases, however the opposite is witnessed for the interaction of the drug and
2HPBCD. This result is also seen in the Gibb’s free energy, with a slight decrease for
the interaction of flurbiprofen and BCD and an increase for the drug and 2HPBCD. All
results obtained show that something is occurring to the flurbiprofen and BCD when the
temperature increases. To hypothesise, the presence of fluorine within the drug
compound may have a subsequent impact on hydrogen bonding potential both with
water and the host cyclodextrin, which only becomes apparent when a range of
temperatures was investigated.

78
3.4.7 Comparison of ibuprofen, ketoprofen and flurbiprofen with BCD and 2HPBCD
From analysis of all the results obtained there appears to be differences not only
between the drug and the choice of cyclodextrin but also between the different drugs.
Each drug does have some similarities but the main differences include the structures
and the partition coefficients of the drugs (logP).
Ketoprofen has the lowest logP of 0.9719, then ibuprofen with a logP of 3.619,
while flurbiprofen has the highest logP of 4.220. Upon analysis of the results there
appears to be a clear correlation between the lipophilicity of the drug molecule and the
experimentally determined binding constant and enthalpy of binding. For example at
298K the binding constant for ketoprofen is 1.09x10³ dm3mol-1, ibuprofen has a binding
constant of 8.34x10³ dm3mol-1 and flurbiprofen has a binding constant of 14.93x10³
dm3mol-1. From this it can be seen that the higher the partition coefficient, and thus the
greater the lipophilicity, the stronger the interaction between the drug molecule and the
cyclodextrin. This could therefore be a reflection of the greater affinity of the lipophilic
compound towards the less polar internal cavity of the cyclodextrin when compared with
water.
This trend can be seen throughout the scenarios and over the temperature range
until 310 K, where the decrease in binding constant, ΔH and ΔG for flurbiprofen and
BCD causes this result to become smaller than the ibuprofen and BCD scenario at this
temperature. This consequently suggests another explanation may be involved in this
result. In addition to the lipophilic difference, another hypothesis is the structural
difference for flurbiprofen when compared with ibuprofen and ketoprofen. Flurbiprofen
has a fluorine atom attached to the first benzene ring from the carboxylic group. This
may have a subsequent impact on the hydrogen bonding potential with the cyclodextrin
cavity causing a decrease in strength as the temperature increases.
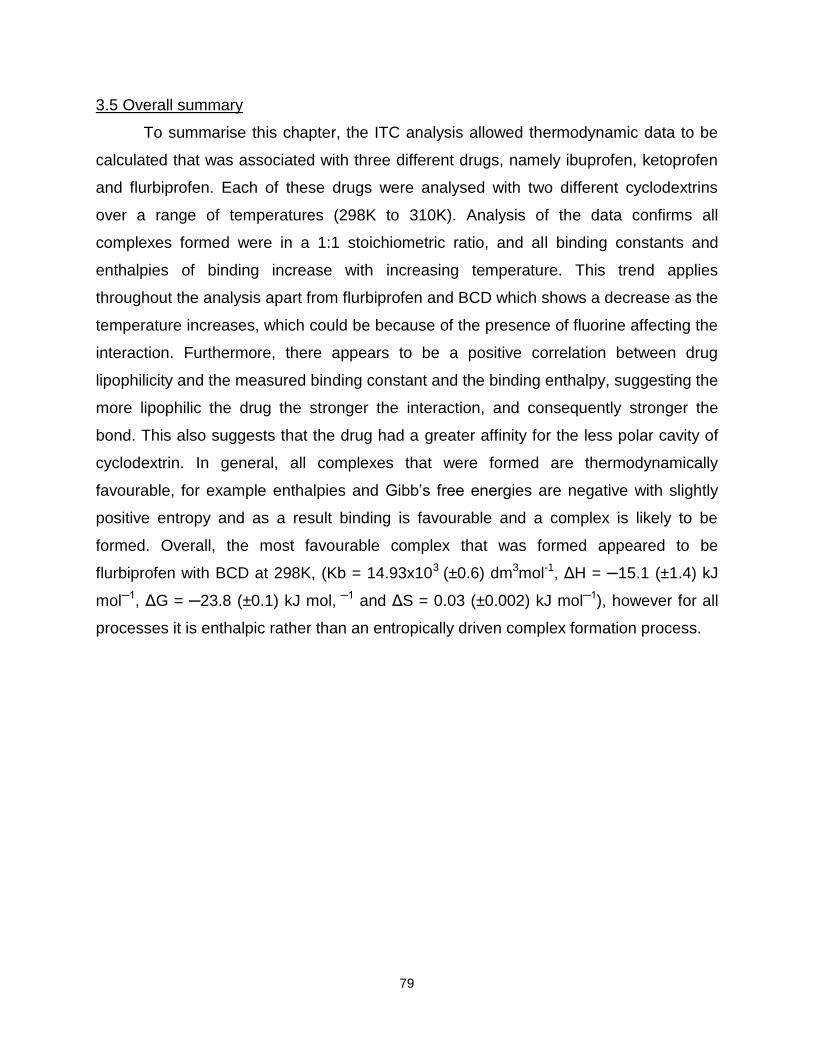
79
3.5 Overall summary
To summarise this chapter, the ITC analysis allowed thermodynamic data to be
calculated that was associated with three different drugs, namely ibuprofen, ketoprofen
and flurbiprofen. Each of these drugs were analysed with two different cyclodextrins
over a range of temperatures (298K to 310K). Analysis of the data confirms all
complexes formed were in a 1:1 stoichiometric ratio, and all binding constants and
enthalpies of binding increase with increasing temperature. This trend applies
throughout the analysis apart from flurbiprofen and BCD which shows a decrease as the
temperature increases, which could be because of the presence of fluorine affecting the
interaction. Furthermore, there appears to be a positive correlation between drug
lipophilicity and the measured binding constant and the binding enthalpy, suggesting the
more lipophilic the drug the stronger the interaction, and consequently stronger the
bond. This also suggests that the drug had a greater affinity for the less polar cavity of
cyclodextrin. In general, all complexes that were formed are thermodynamically
favourable, for example enthalpies and Gibb’s free energies are negative with slightly
positive entropy and as a result binding is favourable and a complex is likely to be
formed. Overall, the most favourable complex that was formed appeared to be
flurbiprofen with BCD at 298K, (Kb = 14.93x10³ (±0.6) dm3mol-1, ΔH = ─15.1 (±1.4) kJ
mol─1, ΔG = ─23.8 (±0.1) kJ mol, ─1 and ΔS = 0.03 (±0.002) kJ mol─1), however for all
processes it is enthalpic rather than an entropically driven complex formation process.

80
References
1. Thermodynamic analysis of biomolecular interactions, A Cooper, Current Opinion
in Chemical Biology, Vol 3, 557-563, 1999
2. Influence of lipophilicity on drug-cyclodextrin interactions: A calorimetric study, LJ
Waters, S Bedford, GMB Parkes, JC Mitchell, Thermochimica Acta, 1-2, Vol 511,
102-106, 2010
3. Theoretical aspects of isothermal titration calorimetry, L Indyk, HF Fisher,
Methods in Enzymology, Vol 295, 350-364, 1998
4. Optimizing experimental parameters in isothermal titration calorimetry: Variable
volume procedures, J Tellinghuisen, Journal of Physical Chemistry B, Vol 111,
11531-11537, 2007
5. The thermodynamics of the binding of benzene to β-cyclodextrin in aqueous
solution, I Gomez-Orellana, D Hallen, Thermochimica Acta, Vol 221, 183-193,
1993
6. Tight inclusion-complex formation with negative entropy change by 1-hexanol
molecules into α-cyclodextrin cavities in aqueous solution, S Takagi, M Fujisawa,
T Kimura, Chemistry Express, 2, Vol 6, 93-96, 1991
7. Calorimetric determination of enthalpies, Gibbs energies, and entropies of
inclusion of some alcohols into α- and β-cyclodextrins in aqueous solutions, S
Takagi, M Maeda, Journal of Inclusion Phenomena, Vol 2, 775-780, 1984
8. Enthalpy and entropy changes on molecular inclusion of 1,3-butanediol into α-
and β-cyclodextrin cavities in aqueous solutions, S Takagi, M Fujisawa, T
Kimura, Thermochimica Acta, Vol 183, 289-297, 1991
9. Calorimetric studies of benzoic acid-cyclodextrin inclusion complexes, E Siimer,
Thermochimica Acta, Vol 140, 161-168, 1989
10. Thermochemical investigation of β-cyclodextrin complexes with benzoic acid and
sodium benzoate, E Siimer, Thermochimica Acta, Vol 116, 249-256, 1987
11. Thermodynamics of binding of aromatic amino acids to α-, β- and γ-
cyclodextrins, K Matsuyama, S El-Gizawy, JH Perrin, Drug Development and
Industrial Pharmacy, 15, Vol 13, 2687-2691, 1987

81
12. Thermodynamics of the interaction of cyclodextrins with aromatic and α, ω-
amino acids in aqueous solutions: A calorimetric study at 25˚C, G Castronuovo,
V Elia, D Fessas, A Giordano, F Vellrca, Carbohydrate Research, Vol 272, 31-39,
1995
13. Complexation of glucose by α- and β- cyclodextrins, W Hirsch, T Muller, R Pizer,
PJ Ricatto, Canadian Journal of Chemistry, 12, Vol 73, 12-15, 1995
14. Microcalorimetric study of the interaction of aspartame with β-cyclodextrin and
hydroxypropyl-β-cyclodextrin: The anomalous heat of dilution of the latter, D
Moelands, NA Karnik, RJ Prankerd, KB Sloan, HW Stine, JH Perrin, International
Journal of Pharmaceutics, Vol 86, 263-265, 1992
15. The role of water in the thermodynamics of drug inding to cyclodextrin, NA
Todorova, FP Schwarz, Journal of Chemical Thermodynamics, Vol 39, 1038-
1048, 2007
16. New challenges for pharmaceutical formulations and drug delivery systems
characterization using isothermal titration calorimetry, K Bouchemal, Drug
Discovery Today, Vol 0, 1-13, 2008
17. Measurements of binding thermodynamics in drug discovery, GA Holdgate, WHJ
Ward, Drug Discovery Today, 22, Vol 10, 1543-1550, 2005
18. Isothermal titration calorimetry, A Velazquez-Campoy, H Ohtaka, A Nezami, S
Muzammil, E Freire, Current Protocols in Cell Biology, John Wiley and Sons,
London, 1st Edition, 17.8.1-17.8.24, 2004
19. The influence of the physicochemical characteristics and pharmacokinetics
properties of selected NSAID’s on their transdermal absorption, E Beetge, J Du
Plessis, DG Muller, C Goosen, FJ Van Rensburg, International Journal of
Pharmaceutics, Vol 193, 261-264, 2000
20. Characterisation of the transdermal transport of flurbiprofen and indomethacin, Q
Li, TY Kato, Y Sai, Y Kubo, A Tsuji, Journal of Controlled Release, Vol 110, 542-
556, 2006

Chapter 4
Formulation Stability

82
Chapter 4
The previous chapter looked into how the drug and excipient bond and the
energy associated with that mechanism. This chapter presents analytical results of the
formulated products.
For clarity, the chapter is separated into three different techniques, namely
differential scanning calorimetry (DSC), scanning electron microscopy (SEM) and
thermal activity monitoring (TAM). These techniques will allow the compatibility of the
drug and excipient to be determined, how each formulation appears, the stability of the
drug/excipient mixture and if there are any differences between the formulation methods
(heating and the presence of water).
4.1 Differential Scanning Calorimetry (DSC)
Differential scanning calorimetry (DSC) is a thermal analysis technique that
measures the physical and chemical properties of a sample as a function of
temperature or time. DSC is useful within the pharmaceutical industry because it helps
to determine the physical properties of the drug and the excipient and then a mixture of
the two. Therefore DSC can help to illustrate whether or not the drug and excipient are
compatible1-4.
To determine the compatibility of the drug and excipient and to investigate if the
formulation method changed the thermal behaviour, analysis considered each of the
four different drugs and excipients in isolation. Also, all of the different formulations
prepared using microwave and conventional heating, and with or without water present.
The illustrated DSC traces are for the initial melt of the formulations and consequently
only a short section of the trace is illustrated. Each sample weighed 8mg (±0.5mg) and
was placed within an aluminium pan with a pierced lid. The sample was then placed into
a heat flux DSC and subjected to a heating program (10°C/min) to mimic the formulation
process, and to determine the behaviour of the sample.

83
4.1.1 Pure components
Each of the four different drugs, ibuprofen, ketoprofen, flurbiprofen and
paracetamol were first investigated in isolation using DSC. Secondly the four different
excipients were also investigated in isolation. The results are illustrated below in Figure
4.1.1.1 - 4.1.1.8. Each of the pure drugs and excipients were subjected to a heating
program (illustrated by the red line on the graph) with a maximum temperature of
125°C. This consequently allowed the drug to melt (unless otherwise stated) and also
determine the behaviour of the drug at the formulation temperature (represented by the
green line).
Figure 4.1.1.1 - DSC trace for pure ibuprofen
Figure 4.1.1.1 shows the melting of pure ibuprofen at 77°C as revealed by the
endothermic peak. Recrystallisation was often not observed on cooling liquid ibuprofen
and literature suggests it can remain in a metastable form for a considerable period of
time5.
-18
-16
-14
-12
-10
-8
-6
-4
-2
0
2
0
10
20
30
40
50
60
70
80
90
100
0 3.75 7.5 11.25 15
Enth
alp
y /
mW
Tem
per
atu
re /
C
Time / mins
Temperature DSC

84
Figure 4.1.1.2 - DSC trace for pure ketoprofen
Figure 4.1.1.2 is for pure ketoprofen, it can be seen from the graph that an endothermic
peak is present which represents the melt of the drug at around 95°C.
-10
-9
-8
-7
-6
-5
-4
-3
-2
-1
0
0
20
40
60
80
100
120
140
160
0 2 4 6 8 10 12 14 16
Enth
alp
y /
mW
Tem
per
atu
re /
C
Time / mins
Temperature
DSC

85
Figure 4.1.1.3 - DSC trace for pure flurbiprofen
Figure 4.1.1.3 illustrates the thermal behaviour of flurbiprofen and it can be seen that an
endothermic peak is present. This corresponds to the melt of the drug with a
temperature of 115°C. The final drug analysed using DSC was paracetamol and
similarly to the other three drugs, an endothermic peak is seen for the melt of the drug,
which occurred around 169°C.
After all the drugs were analysed, each of the different excipients were
investigated. Each of the excipients were analysed up to 125°C, however in the case of
BCD, PVP and HPBCD these were heated to 300°C to determine how they behaved
when taken to their decomposition temperature. This however was for interest purposes
only and because the formulation temperature was 85°C, only the thermal behaviour up
to 125°C is illustrated.
-25
-20
-15
-10
-5
0
5
0
20
40
60
80
100
120
140
160
1 11 21
Enth
alp
y /
mW
Tem
per
atu
re /
C
Time / mins
Temperature
DSC
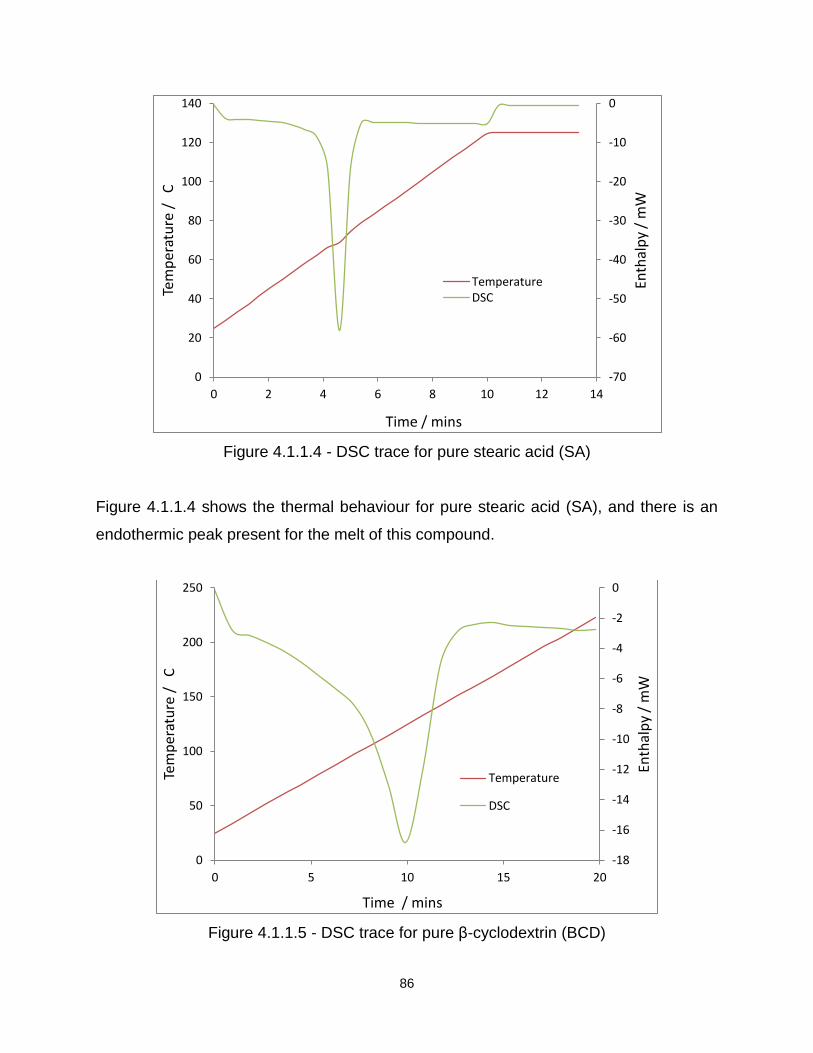
86
Figure 4.1.1.4 - DSC trace for pure stearic acid (SA)
Figure 4.1.1.4 shows the thermal behaviour for pure stearic acid (SA), and there is an
endothermic peak present for the melt of this compound.
Figure 4.1.1.5 - DSC trace for pure β-cyclodextrin (BCD)
-70
-60
-50
-40
-30
-20
-10
0
0
20
40
60
80
100
120
140
0 2 4 6 8 10 12 14
Enth
alp
y /
mW
Tem
per
atu
re /
C
Time / mins
Temperature DSC
-18
-16
-14
-12
-10
-8
-6
-4
-2
0
0
50
100
150
200
250
0 5 10 15 20
Enth
alp
y /
mW
Tem
per
atu
re /
C
Time / mins
Temperature
DSC

87
From Figure 4.1.1.5 it can be seen that a broad endothermic peak is present when BCD
is heated to and above the formulation temperature. This broad endothermic peak
occurs around 120°C, which could correspond to the release of water from the BCD
cavity. The BCD used is a hydrate.
Figure 4.1.1.6 - DSC trace for pure 2-hydroxypropyl-β-cyclodextrin (2HPBCD)
Figure 4.1.1.6 shows the DSC result for 2HPBCD. Again, there is a clear peak around
100°C which again could be the loss of water from the cavity.
-10
-9
-8
-7
-6
-5
-4
-3
-2
-1
0
0
50
100
150
200
250
0 5 10 15 20
Enth
alp
y /
mW
Tem
per
atu
re /
C
Time / mins
Temperature
DSC

88
Figure 4.1.1.7 - DSC trace for pure polyvinylpyrrolidone (PVP)
Figure 4.1.1.7 shows the DSC profile for PVP, It is clear from the trace that this
excipient is not crystalline, and the peak that is seen could be from the loss of water
trapped in the structure of the polymer.
Each of the four drugs were analysed with the four different excipients formulated using
microwaves and the conventional heating method (with and without water present).
-7
-6
-5
-4
-3
-2
-1
0
1
0
50
100
150
200
250
0 5 10 15 20
Enth
alp
y /
mW
Tem
per
atu
re /
C
Time / mins
Temperature
DSC

89
4.1.2 Ibuprofen and SA
A total of four different formulations were analysed for this drug and excipient
combination. Two microwave formulations (with and without water) were investigated
and the same for the conventionally heated. An example of the DSC result is illustrated
in Figure 4.1.2.1.
Figure 4.1.2.1 - DSC trace for microwave ibuprofen and stearic acid (SA) without water
present in the formulation process
Ibuprofen and SA was formulated with and without the presence of water. When these
traces are compared with the pure compounds significant differences can be seen.
Firstly there is only one peak seen for the melting of the drug and excipient which could
suggest an overlap and consequently a possible interaction between the two
compounds after formulation. Another point that may suggest an interaction is the
reduction in the temperature of the peak associated with the melting, for pure ibuprofen
the melting point is around 77°C and for SA it is 70°C. However for the microwave
formulation the melt appears at 65°C, which shows a decrease of 12°C for the drug and
5°C for the excipient. Upon analysis of the formulation prepared using conventional
-30
-25
-20
-15
-10
-5
0
5
0
20
40
60
80
100
120
140
0 5 10 15
Enth
alp
y /
mW
Tem
per
atu
re /
C
Time / mins
Temperature
DSC

90
heating without water present, there is again only one peak present that represents the
melt of the formulation. There is also a decrease in the temperature of the melt (65°C)
when compared with the pure drug and excipient. All of these findings suggest that an
interaction between the drug and excipient has occurred after the formulation method.
When the two formulations with water were compared, no significant differences were
seen between microwave and conventional heating and also no differences were seen
when compared with the formulations prepared without water.
4.1.3 Ibuprofen and BCD
The next formulation analysed was ibuprofen with BCD. Ibuprofen and BCD were
formulated in a 1:1 and 1:9 ratio using microwaves and conventional heating (with and
without water present). An example of a DSC trace for this formulation can be seen in
Figure 4.1.3.1.
Figure 4.1.3.1 - Microwave formulated ibuprofen and BCD, 1:1 without water present in
the formulation process
-12
-10
-8
-6
-4
-2
0
0
20
40
60
80
100
120
140
0 5 10 15 20
Enth
alp
/ m
W
Tem
per
atu
re /
C
Time / Mins
Temperature
DSC

91
Figure 4.1.3.1 is an example of ibuprofen formulated with BCD without water present
and in the 1:1 ratio. The first peak occurs at about 75-80°C which corresponds to the
melt of ibuprofen, the second peak appears around 100°C which corresponds to the
loss of water from the cyclodextrin cavity. After these results were compared with the
pure compounds it appears no significant differences occurred. The melt for ibuprofen
has not been affected by the addition of the excipient and the loss of water from the
cyclodextrin cavity is also unaffected. This is also the case for ibuprofen and BCD
formulated using conventional heating either with or without water present during the
method. Ibuprofen with BCD in a 1:1 ratio either using microwaves or conventional
heating appears to not affect the drug’s behaviour when subjected to thermal analysis.
Upon comparison of all results obtained for ibuprofen and BCD in the 1:1, it
appears that there is little or no significant difference between the two heating methods
and consequently it can be said that the thermal behaviour of this formulation is
unaffected. Ibuprofen and BCD was also formulated in 1:9 ratio with or without the
presence of water, and Figure 4.1.3.2 is an example of a result obtained.
Figure 4.1.3.2 - Microwave formulated ibuprofen and BCD, 1:9 without water present in
the formulation process
-12
-10
-8
-6
-4
-2
0
2
0
20
40
60
80
100
120
140
0 5 10 15
Enth
alp
y /
mW
Tem
per
atu
re /
C
Time / mins
Temperature
DSC
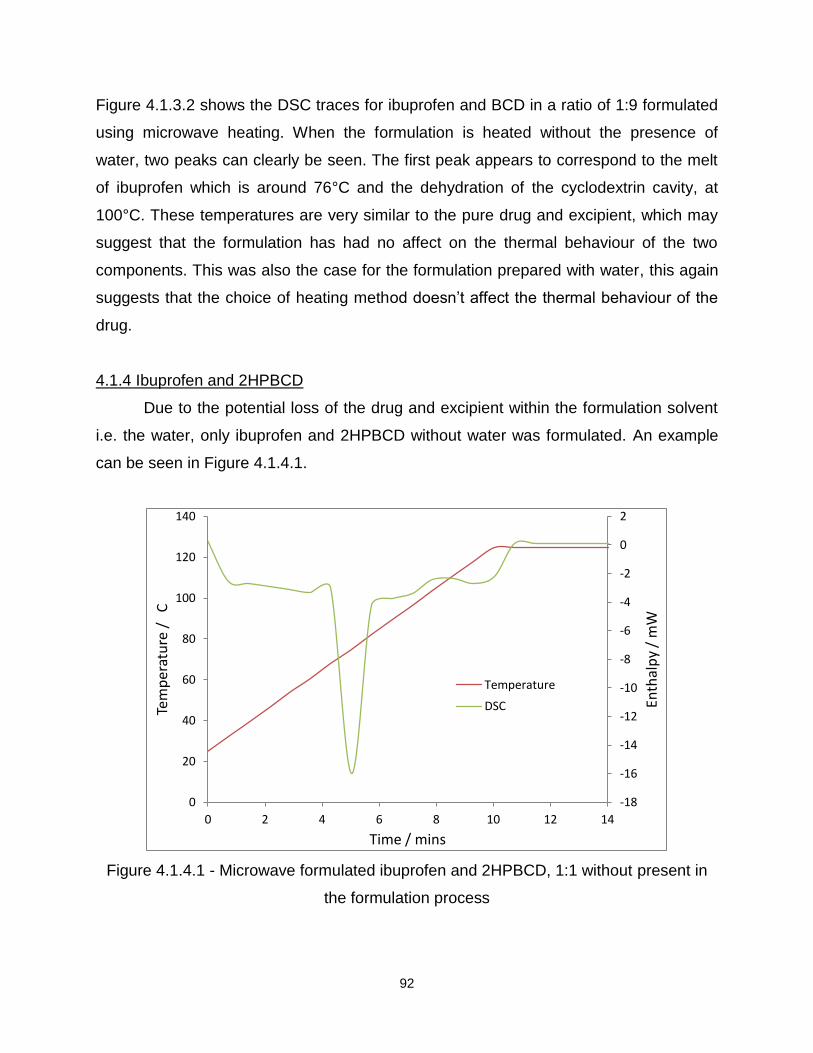
92
Figure 4.1.3.2 shows the DSC traces for ibuprofen and BCD in a ratio of 1:9 formulated
using microwave heating. When the formulation is heated without the presence of
water, two peaks can clearly be seen. The first peak appears to correspond to the melt
of ibuprofen which is around 76°C and the dehydration of the cyclodextrin cavity, at
100°C. These temperatures are very similar to the pure drug and excipient, which may
suggest that the formulation has had no affect on the thermal behaviour of the two
components. This was also the case for the formulation prepared with water, this again
suggests that the choice of heating method doesn’t affect the thermal behaviour of the
drug.
4.1.4 Ibuprofen and 2HPBCD
Due to the potential loss of the drug and excipient within the formulation solvent
i.e. the water, only ibuprofen and 2HPBCD without water was formulated. An example
can be seen in Figure 4.1.4.1.
Figure 4.1.4.1 - Microwave formulated ibuprofen and 2HPBCD, 1:1 without present in
the formulation process
-18
-16
-14
-12
-10
-8
-6
-4
-2
0
2
0
20
40
60
80
100
120
140
0 2 4 6 8 10 12 14
Enth
alp
y /
mW
Tem
per
atu
re /
C
Time / mins
Temperature
DSC
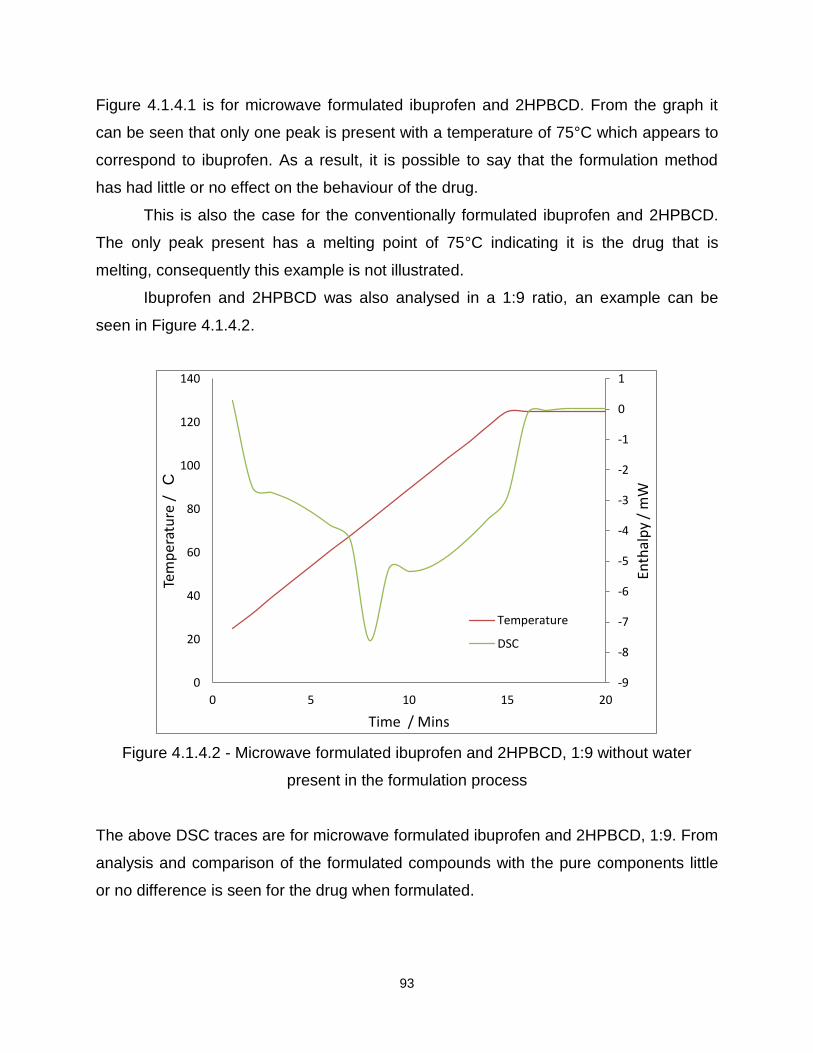
93
Figure 4.1.4.1 is for microwave formulated ibuprofen and 2HPBCD. From the graph it
can be seen that only one peak is present with a temperature of 75°C which appears to
correspond to ibuprofen. As a result, it is possible to say that the formulation method
has had little or no effect on the behaviour of the drug.
This is also the case for the conventionally formulated ibuprofen and 2HPBCD.
The only peak present has a melting point of 75°C indicating it is the drug that is
melting, consequently this example is not illustrated.
Ibuprofen and 2HPBCD was also analysed in a 1:9 ratio, an example can be
seen in Figure 4.1.4.2.
Figure 4.1.4.2 - Microwave formulated ibuprofen and 2HPBCD, 1:9 without water
present in the formulation process
The above DSC traces are for microwave formulated ibuprofen and 2HPBCD, 1:9. From
analysis and comparison of the formulated compounds with the pure components little
or no difference is seen for the drug when formulated.
-9
-8
-7
-6
-5
-4
-3
-2
-1
0
1
0
20
40
60
80
100
120
140
0 5 10 15 20
Enth
alp
y /
mW
Tem
per
atu
re /
C
Time / Mins
Temperature
DSC
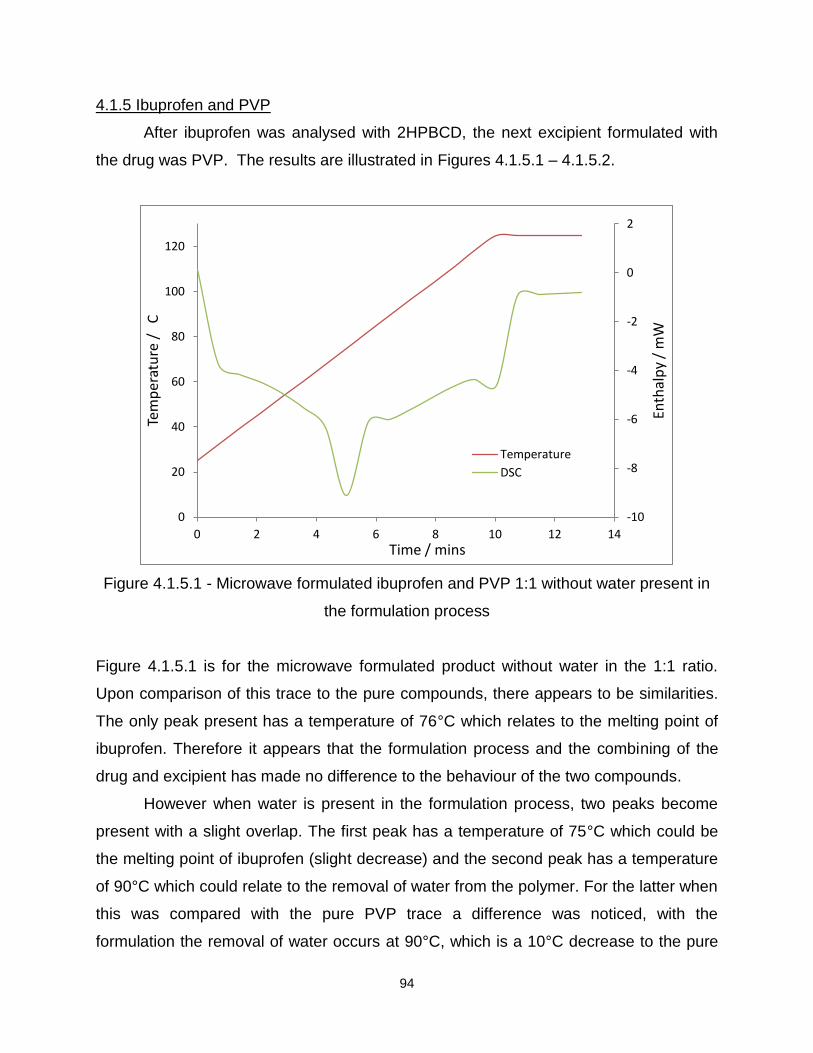
94
4.1.5 Ibuprofen and PVP
After ibuprofen was analysed with 2HPBCD, the next excipient formulated with
the drug was PVP. The results are illustrated in Figures 4.1.5.1 – 4.1.5.2.
Figure 4.1.5.1 - Microwave formulated ibuprofen and PVP 1:1 without water present in
the formulation process
Figure 4.1.5.1 is for the microwave formulated product without water in the 1:1 ratio.
Upon comparison of this trace to the pure compounds, there appears to be similarities.
The only peak present has a temperature of 76°C which relates to the melting point of
ibuprofen. Therefore it appears that the formulation process and the combining of the
drug and excipient has made no difference to the behaviour of the two compounds.
However when water is present in the formulation process, two peaks become
present with a slight overlap. The first peak has a temperature of 75°C which could be
the melting point of ibuprofen (slight decrease) and the second peak has a temperature
of 90°C which could relate to the removal of water from the polymer. For the latter when
this was compared with the pure PVP trace a difference was noticed, with the
formulation the removal of water occurs at 90°C, which is a 10°C decrease to the pure
-10
-8
-6
-4
-2
0
2
0
20
40
60
80
100
120
0 2 4 6 8 10 12 14
Enth
alp
y /
mW
Tem
per
atu
re /
C
Time / mins
Temperature
DSC

95
compound (100°C). It is possible that because ibuprofen is poorly water soluble, when
water is present it is more likely to bond to the polymer chain. This would then be seen
by an easier removal of water from the polymer and as a result a reduction in the
temperature of the excipient peak.
Figure 4.1.5.2 - Conventional formulated ibuprofen and PVP 1:1 with water present in
the formulation process
Figure 4.1.5.2 is for ibuprofen and PVP heated conventionally with water, and it can be
seen that a single peak is present. From analysis of the temperature at which this
occurs, around 75-80°C, it can be said that this peak corresponds to the melt of the
drug. This was also seen when ibuprofen and PVP was conventionally formulated
without water and consequently this is not illustrated.
After ibuprofen and PVP were analysed in a 1:1 ratio, this drug and PVP were
also investigated in a 1:9 ratio. Figures 4.1.5.3 - 4.1.5.4 are examples of the DSC
traces for ibuprofen and PVP, in a ratio of 1:9.
-25
-20
-15
-10
-5
0
0
20
40
60
80
100
120
140
0 2 4 6 8 10 12 14 16 18
Enth
alp
y /
mW
Tem
per
atu
re /
C
Time / mins
Temperature
DSC

96
Figure 4.1.5.3 - Microwave formulated ibuprofen and PVP, 1:9 with water present in the
formulation process
Figure 4.1.5.3 is an example of microwave formulated ibuprofen and PVP in a ratio of
1:9. For the formulation prepared with water, a clear overlap of the two peaks has
occurred with a significant reduction in the melting point of ibuprofen. For pure ibuprofen
this melts around 77°C, but in Figure 4.1.5.3 the melt is 60°C which shows a difference
of 17°C (illustrated by circle). There is also an increase in the second peak temperature
from around 100°C to 116°C. This is again a difference of 16°C, and these results show
that after formulation a difference in the behaviour of ibuprofen and PVP has occurred.
The overlapping peaks and the decrease in the melt for ibuprofen suggest an interaction
has occurred.
-60
-50
-40
-30
-20
-10
0
0
20
40
60
80
100
120
140
0 5 10 15
Enth
alp
y /
mW
Tem
per
atu
re /
C
Time / mins
Temperature
DSC
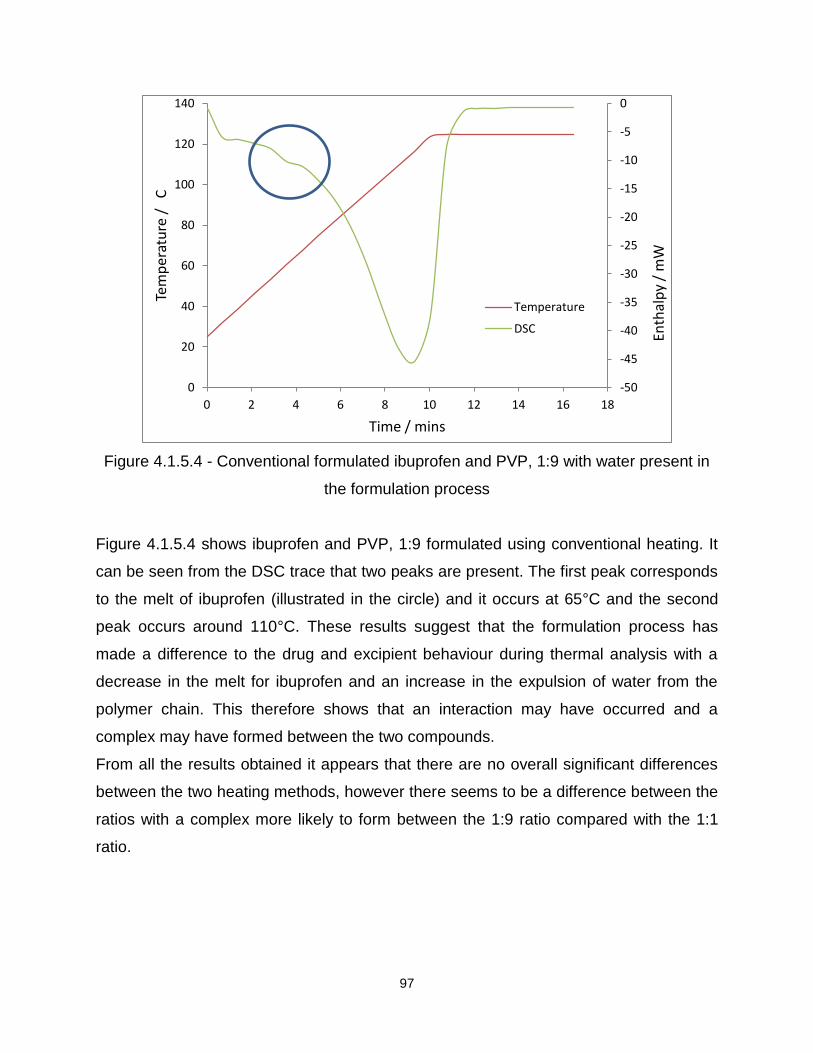
97
Figure 4.1.5.4 - Conventional formulated ibuprofen and PVP, 1:9 with water present in
the formulation process
Figure 4.1.5.4 shows ibuprofen and PVP, 1:9 formulated using conventional heating. It
can be seen from the DSC trace that two peaks are present. The first peak corresponds
to the melt of ibuprofen (illustrated in the circle) and it occurs at 65°C and the second
peak occurs around 110°C. These results suggest that the formulation process has
made a difference to the drug and excipient behaviour during thermal analysis with a
decrease in the melt for ibuprofen and an increase in the expulsion of water from the
polymer chain. This therefore shows that an interaction may have occurred and a
complex may have formed between the two compounds.
From all the results obtained it appears that there are no overall significant differences
between the two heating methods, however there seems to be a difference between the
ratios with a complex more likely to form between the 1:9 ratio compared with the 1:1
ratio.
-50
-45
-40
-35
-30
-25
-20
-15
-10
-5
0
0
20
40
60
80
100
120
140
0 2 4 6 8 10 12 14 16 18
Enth
alp
y /
mW
Tem
per
atu
re /
C
Time / mins
Temperature
DSC

98
4.1.6 Ketoprofen and SA
Figure 4.1.6.1 and Figure 4.1.6.2 show the DSC profiles for ketoprofen and SA
formulated using microwave and conventional heating. From analysis of the four
different formulations, in all cases only one peak is present (see illustrated examples).
Figure 4.1.6.1- Microwave formulated ketoprofen and SA, with water present in the
formulation process
-50
-45
-40
-35
-30
-25
-20
-15
-10
-5
0
0
20
40
60
80
100
120
140
160
0 5 10 15
Enth
alp
y /
mW
Tem
per
atu
re /
C
Time / mins
Temperature
DSC
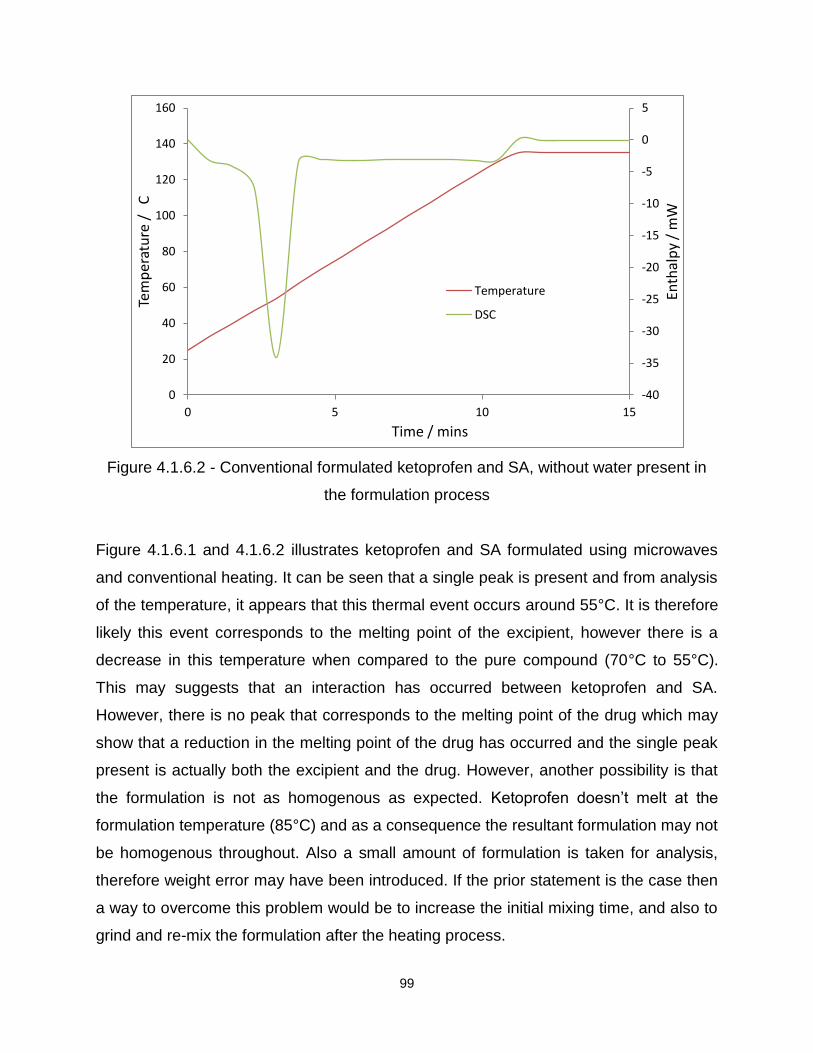
99
Figure 4.1.6.2 - Conventional formulated ketoprofen and SA, without water present in
the formulation process
Figure 4.1.6.1 and 4.1.6.2 illustrates ketoprofen and SA formulated using microwaves
and conventional heating. It can be seen that a single peak is present and from analysis
of the temperature, it appears that this thermal event occurs around 55°C. It is therefore
likely this event corresponds to the melting point of the excipient, however there is a
decrease in this temperature when compared to the pure compound (70°C to 55°C).
This may suggests that an interaction has occurred between ketoprofen and SA.
However, there is no peak that corresponds to the melting point of the drug which may
show that a reduction in the melting point of the drug has occurred and the single peak
present is actually both the excipient and the drug. However, another possibility is that
the formulation is not as homogenous as expected. Ketoprofen doesn’t melt at the
formulation temperature (85°C) and as a consequence the resultant formulation may not
be homogenous throughout. Also a small amount of formulation is taken for analysis,
therefore weight error may have been introduced. If the prior statement is the case then
a way to overcome this problem would be to increase the initial mixing time, and also to
grind and re-mix the formulation after the heating process.
-40
-35
-30
-25
-20
-15
-10
-5
0
5
0
20
40
60
80
100
120
140
160
0 5 10 15
Enth
alp
y /
mW
Tem
per
atu
re /
C
Time / mins
Temperature
DSC
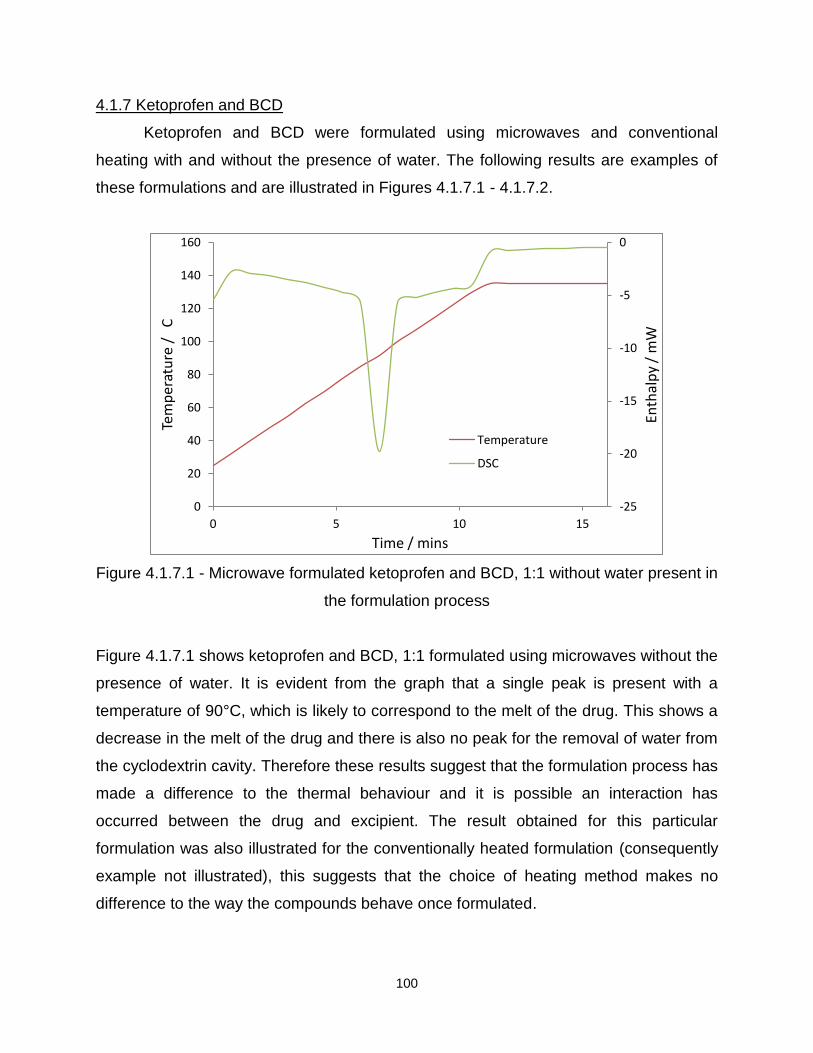
100
4.1.7 Ketoprofen and BCD
Ketoprofen and BCD were formulated using microwaves and conventional
heating with and without the presence of water. The following results are examples of
these formulations and are illustrated in Figures 4.1.7.1 - 4.1.7.2.
Figure 4.1.7.1 - Microwave formulated ketoprofen and BCD, 1:1 without water present in
the formulation process
Figure 4.1.7.1 shows ketoprofen and BCD, 1:1 formulated using microwaves without the
presence of water. It is evident from the graph that a single peak is present with a
temperature of 90°C, which is likely to correspond to the melt of the drug. This shows a
decrease in the melt of the drug and there is also no peak for the removal of water from
the cyclodextrin cavity. Therefore these results suggest that the formulation process has
made a difference to the thermal behaviour and it is possible an interaction has
occurred between the drug and excipient. The result obtained for this particular
formulation was also illustrated for the conventionally heated formulation (consequently
example not illustrated), this suggests that the choice of heating method makes no
difference to the way the compounds behave once formulated.
-25
-20
-15
-10
-5
0
0
20
40
60
80
100
120
140
160
0 5 10 15
Enth
alp
y /
mW
Tem
per
atu
re /
C
Time / mins
Temperature
DSC

101
Figure 4.1.7.2 – Microwave formulated ketoprofen and BCD, 1:9 without water present
in the formulation process
Figure 4.1.7.2 displays the thermal analysis for ketoprofen and BCD, 1:9 formulated
using microwaves, and without the presence of water. It is clear from the graph that two
peaks are present, with the first having a corresponding temperature of 85°C and the
second peak temperature of 110°C. This shows a decrease for the melt of the drug and
an increase for the removal of water from the cyclodextrin cavity, therefore it is possible
an interaction occurred between the two compounds. This is justified by a change in the
thermal behaviour of the drug and excipient after the formulation process. This was also
seen for the conventional formulation and is consequently not illustrated.
-14
-12
-10
-8
-6
-4
-2
0
2
0
20
40
60
80
100
120
140
160
0 5 10 15
Enth
alp
y /
mW
Tem
per
atu
re /
C
Time / mins
Temperature
DSC

102
4.1.8 Ketoprofen and 2HPBCD
Ketoprofen and 2HPBCD was formulated using microwave and conventional
heating, without the presence of water. The results are illustrated in Figures 4.1.8.1 to
4.1.8.2.
Figure 4.1.8.1 - Microwave formulated ketoprofen and 2HPBCD 1:1, without water
present in the formulation process
Figure 4.1.8.1 displays the DSC traces for ketoprofen and 2HPBCD in the 1:1 ratio
formulated using microwave heating, and without the presence of water. It can be seen
that a single peak can be seen with a temperature of 90°C. This is likely to correspond
to the melt of the drug, and as a result it is possible to say that the formulation process
has had little or no effect on the thermal behaviour of the drug. It is also a possibility that
a single peak is present because the dehydration of the cyclodextrin cavity occurred
during the heating method and no water was present to prevent this from happening.
This occurred for both formulations and therefore there is no significant difference
between the two heating methods.
After ketoprofen and 2HPBCD were analysed in the 1:1 ratio, it was also
investigated in the 1:9 ratio and the results are illustrated in Figure 4.1.8.2.
-8
-7
-6
-5
-4
-3
-2
-1
0
1
2
0
20
40
60
80
100
120
140
160
0 2 4 6 8 10 12 14
Enth
alp
y /
mW
Tem
per
atu
re /
C
Time / mins
Temperature
DSC
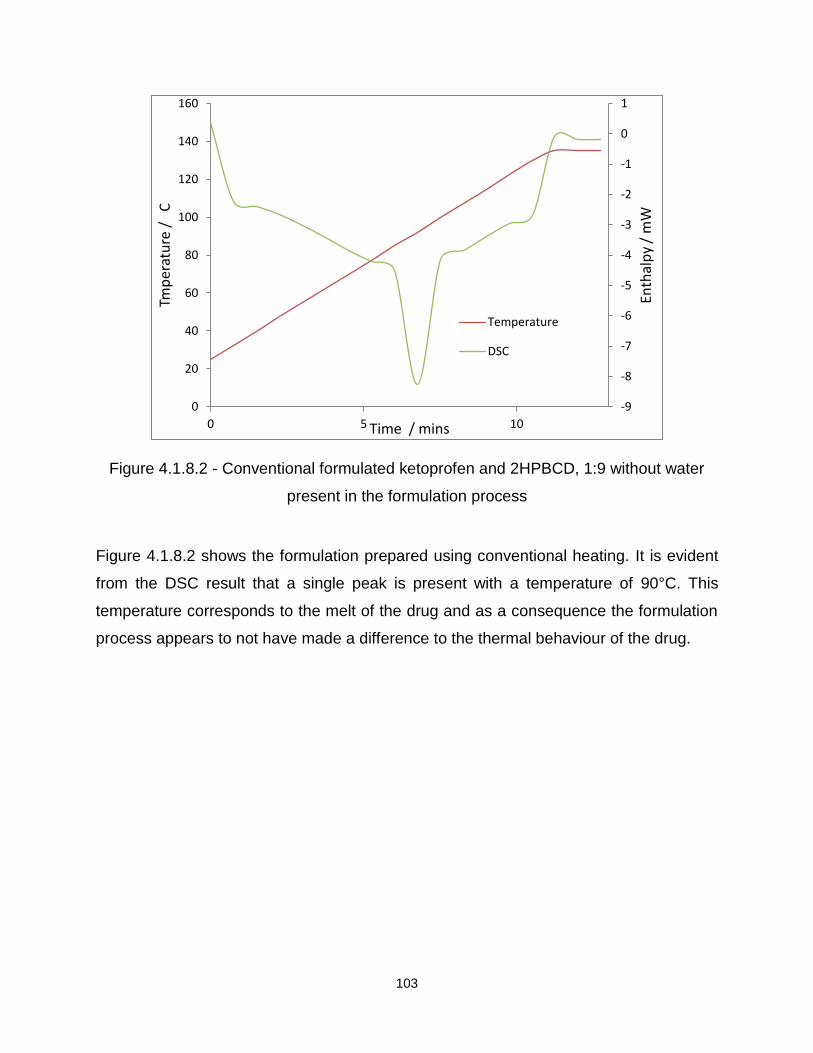
103
Figure 4.1.8.2 - Conventional formulated ketoprofen and 2HPBCD, 1:9 without water
present in the formulation process
Figure 4.1.8.2 shows the formulation prepared using conventional heating. It is evident
from the DSC result that a single peak is present with a temperature of 90°C. This
temperature corresponds to the melt of the drug and as a consequence the formulation
process appears to not have made a difference to the thermal behaviour of the drug.
-9
-8
-7
-6
-5
-4
-3
-2
-1
0
1
0
20
40
60
80
100
120
140
160
0 5 10
Enth
alp
y /
mW
Tmp
erat
ure
/
C
Time / mins
Temperature
DSC

104
4.1.9 Ketoprofen and PVP
Ketoprofen was formulated with PVP in the 1:1 and 1:9 ratios, using microwave
and conventional heating, with or without the presence of water. Figures 4.1.9.1 and
4.1.9.2 displays ketoprofen and PVP in the 1:1 and 1:9 ratios.
Figure 4.1.9.1 – Microwave formulated ketoprofen and PVP, 1:1 without water present
in the formulation process
Figure 4.1.9.1 shows the microwave formulation prepared without water present, it can
be seen that the peak is sharp and has a temperature of 90°C. This is likely to
correspond to the melt of the drug and for that reason it seems that the formulation
process has not affected the thermal behaviour of the drug. The absence of the
polymer dehydration peak may be because the heating method has already removed
any moisture and as a result it will not be present in the DSC trace.
-14
-12
-10
-8
-6
-4
-2
0
0
20
40
60
80
100
120
140
160
0 5 10 15
Enth
alp
y /
mW
Tem
per
atu
re /
C
Time / mins
Temperature
DSC

105
Figure 4.1.9.2 - Microwave formulated ketoprofen and PVP, 1:9 with water present in
the formulation process
Figure 4.1.9.2 is an example of microwave formulated ketoprofen and PVP with water
present during the formulation method. It is evident from the graph that only a single
peak is present, with a temperature of around 90°C which is likely to correspond to the
melt of ketoprofen. This may suggest that no significant difference has occurred to the
thermal behaviour of the drug once formulated.
4.1.10 Flurbiprofen and SA
Flurbiprofen and SA were analysed in a 1:3 ratio. A total of four different
formulations were prepared and analysed. However as previously seen only a few
examples are illustrated unless significant differences occurred between the
formulations.
-40
-35
-30
-25
-20
-15
-10
-5
0
0
20
40
60
80
100
120
140
160
0 2 4 6 8 10 12 14
Enth
alp
y /
mW
Tem
per
atu
re /
C
Time / mins
Temperature
DSC

106
Figure 4.1.10.1- Microwave formulated flurbiprofen and SA, 1:3 without water present in
the formulation process
Figure 4.1.10.2 - Conventional formulated flurbiprofen and SA, 1:3 with water present in
the formulation process
-45
-40
-35
-30
-25
-20
-15
-10
-5
0
5
0
20
40
60
80
100
120
140
160
0 5 10
Enth
alp
y /
mW
Tem
per
atu
re /
C
Time / mins
Temperature
DSC
-40
-35
-30
-25
-20
-15
-10
-5
0
5
0
20
40
60
80
100
120
140
160
0 5 10 15
Enth
alp
y /
mW
Tem
per
atu
re /
C
Time / mins
Temperature
DSC

107
It can be seen from Figure 4.1.10.1 and 4.1.10.2 that only a single melting peak is
present. In both cases a peak temperature of 55°C was seen. This shows a clear
decrease in the temperature when compared with the pure components. This could
signify an interaction between the drug and excipient has occurred and an overlap of
two melting points is evident. However, for flurbiprofen to overlap with the melt for the
excipient, the melt for the drug would have to decrease by over 60°C. Other possibilities
therefore include that the formulation is not as homogenous as expected and as a result
when a small amount of the formulation is taken for analysis it may not contain any of
the drug. Nevertheless, there is still an apparent decrease in the melt for the peak that
is present. Another possibility could be that at the formulation temperature of 85°C, only
the SA melts, this could cover the drug, encapsulate it and it may then hide it and
prevent it from showing up on the DSC trace.
4.1.11 Flurbiprofen and PVP, 1:1 and 1:9
Flurbiprofen and PVP were formulated in the 1:1 and 1:9 ratios, using microwave
and conventional heating, with and without the presence of water.
Figure 4.1.11.1 - Microwave formulated flurbiprofen and PVP, 1:1 without water present
in the formulation process
-12
-10
-8
-6
-4
-2
0
2
0
20
40
60
80
100
120
140
160
0 2 4 6 8 10 12 14
Enth
alp
y /
mW
Tem
per
atu
re /
C
Time /mins
Temperature DSC

108
Figure 4.1.11.1 is for flurbiprofen and PVP, in the 1:1 ratio formulated using microwaves
and without water present. It is evident from the DSC trace that a single peak is present,
with a temperature of 115°C which corresponds to the melting point of the drug. This
shows that the formulation process has not affected the thermal behaviour of the drug,
but it may have dehydrated the excipient and that is why only a single peak is present.
The results obtained for the microwave formulations were also observed in the
formulations prepared using conventional heating, and this shows that there is little or
no significant difference between heating methods.
After the 1:1 formulations were analysed, flurbiprofen and PVP were investigated in the
1:9 ratio, illustrated in Figure 4.1.11.2.
Figure 4.1.11.2 - Microwave formulated flurbiprofen and PVP, 1:9 with water present in
the formulation process
-25
-20
-15
-10
-5
0
0
20
40
60
80
100
120
140
160
0 5 10
Enth
alp
y /
mW
Tem
per
atu
re /
C
Time / mins
Temperature
DSC
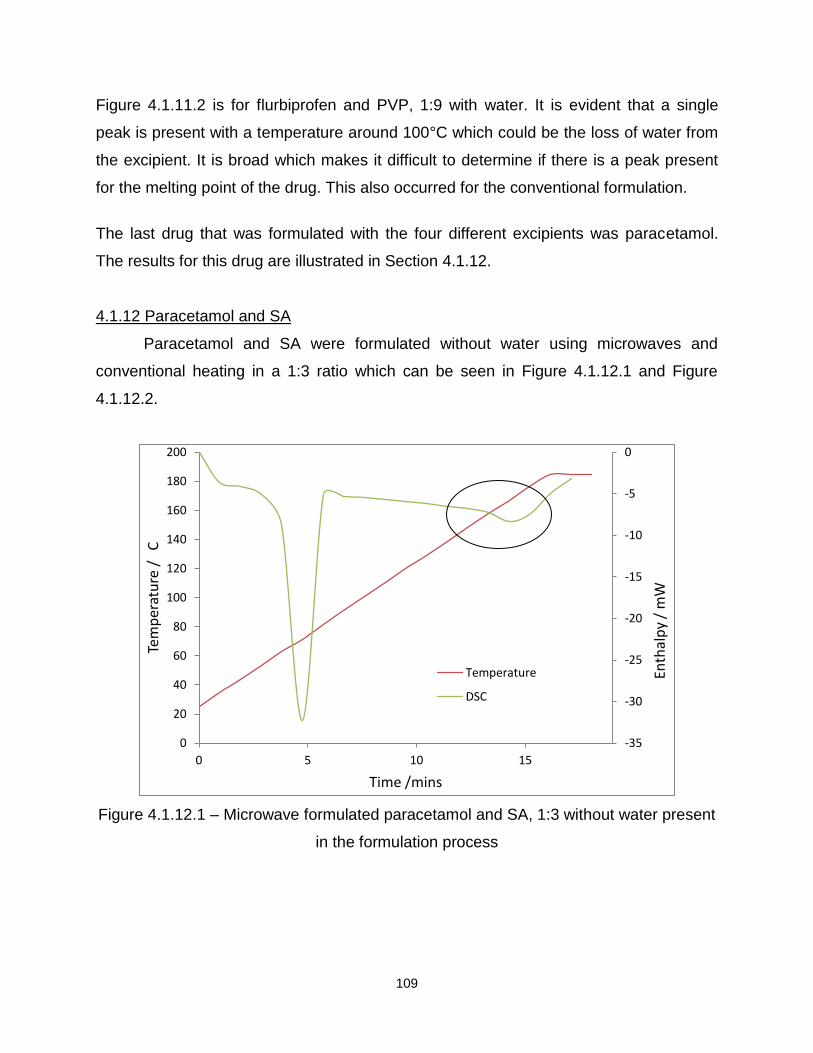
109
Figure 4.1.11.2 is for flurbiprofen and PVP, 1:9 with water. It is evident that a single
peak is present with a temperature around 100°C which could be the loss of water from
the excipient. It is broad which makes it difficult to determine if there is a peak present
for the melting point of the drug. This also occurred for the conventional formulation.
The last drug that was formulated with the four different excipients was paracetamol.
The results for this drug are illustrated in Section 4.1.12.
4.1.12 Paracetamol and SA
Paracetamol and SA were formulated without water using microwaves and
conventional heating in a 1:3 ratio which can be seen in Figure 4.1.12.1 and Figure
4.1.12.2.
Figure 4.1.12.1 – Microwave formulated paracetamol and SA, 1:3 without water present
in the formulation process
-35
-30
-25
-20
-15
-10
-5
0
0
20
40
60
80
100
120
140
160
180
200
0 5 10 15
Enth
alp
y /
mW
Tem
per
atu
re /
C
Time /mins
Temperature
DSC

110
Figure 4.1.12.2-Conventional formulated paracetamol and SA, 1:3 without water present
in the formulation process
Figure 4.1.12.1 is for paracetamol and SA formulated using microwaves, and it can be
seen from the DSC trace that the first peak has a temperature of 70°C which
corresponds to the melt of the excipient, SA. The second peak has a temperature of
170°C, and this corresponds to the melt of the drug (illustrated by the circle). From
these results it is apparent that the formulation process has made no significant
difference to the thermal behaviour of the drug and excipient. This result was also
obtained for the formulation prepared using conventional heating, seen in Figure
4.1.12.2. No significant difference may have occurred in the thermal behaviour because
only the excipient melts and may not encapsulate the drug to a maximum extent. This
result also indicates that the choice of heating method makes no difference to the
overall formulation after the heating process.
-60
-50
-40
-30
-20
-10
0
10
0
20
40
60
80
100
120
140
160
180
200
0 5 10 15
Enth
alp
y /
mW
Tem
per
atu
re /
C
Time / mins
Temperature
DSC

111
4.1.13 Paracetamol and BCD, 1:1 and 1:9
Paracetamol was formulated with BCD in the 1:1 and 1:9 ratios using
microwaves and conventional heating, without the presence of water.
Figure 4.1.13.1 - Paracetamol and BCD, 1:1 formulated using microwave heating
without the presence of water
Figure 4.1.13.1 illustrates paracetamol and BCD formulated in the 1:1 ratio using
microwave heating, without the presence of water. It can be seen from both DSC traces
that two peaks are present, the first has a peak temperature of 110°C which
corresponds to the dehydration of the cyclodextrin cavity, a result seen throughout. The
second peak has a temperature of 170°C which illustrates the melt of the drug. The
about result was also seen for the conventional formulation and consequently this is not
illustrated.
Paracetamol and BCD were also formulated in the 1:9 ratio, and the results are
illustrated in Figure 4.1.13.2.
-10
-8
-6
-4
-2
0
2
0
20
40
60
80
100
120
140
160
180
200
0 5 10 15
Enth
alp
y /
mW
Tem
per
atu
re /
C
Time / mins
Temperature
DSC

112
Figure 4.1.13.2 - Paracetamol and BCD, 1:9 formulated using microwave heating
without the presence of water
Figure 4.1.13.2 displays paracetamol and BCD formulated using microwave heating.
Two peaks are illustrated within this DSC trace, and the first has a peak temperature of
110°C which shows the dehydration of the cyclodextrin cavity. The second peak has a
temperature of 170°C which is the melt of the drug.
4.1.14 Paracetamol and 2HPBCD, 1:1 and 1:9
Paracetamol was formulated with 2HPBCD in the 1:1 and 1:9 ratios using
microwave or conventional heating without the presence of water.
-10
-8
-6
-4
-2
0
2
0
20
40
60
80
100
120
140
160
180
200
0 5 10 15
Enth
alp
y /
mW
Tem
per
atu
re /
C
Time / mins
Temperature
DSC
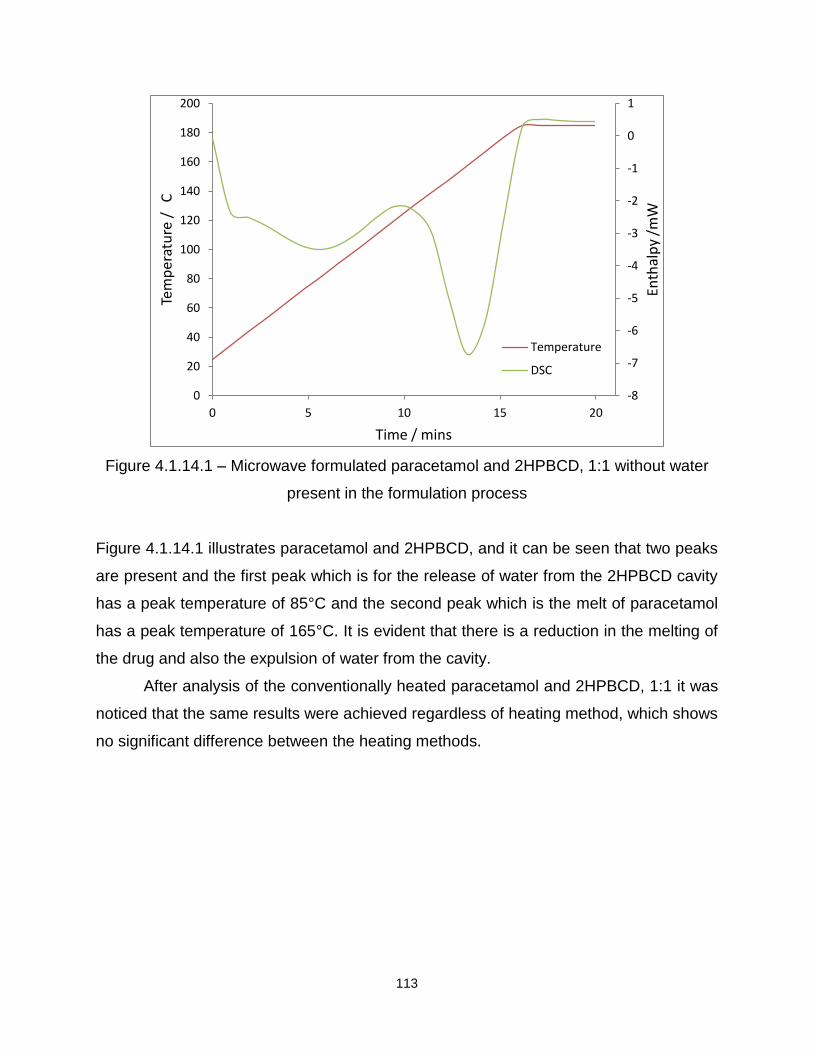
113
Figure 4.1.14.1 – Microwave formulated paracetamol and 2HPBCD, 1:1 without water
present in the formulation process
Figure 4.1.14.1 illustrates paracetamol and 2HPBCD, and it can be seen that two peaks
are present and the first peak which is for the release of water from the 2HPBCD cavity
has a peak temperature of 85°C and the second peak which is the melt of paracetamol
has a peak temperature of 165°C. It is evident that there is a reduction in the melting of
the drug and also the expulsion of water from the cavity.
After analysis of the conventionally heated paracetamol and 2HPBCD, 1:1 it was
noticed that the same results were achieved regardless of heating method, which shows
no significant difference between the heating methods.
-8
-7
-6
-5
-4
-3
-2
-1
0
1
0
20
40
60
80
100
120
140
160
180
200
0 5 10 15 20
Enth
alp
y /m
W
Tem
pe
ratu
re /
C
Time / mins
Temperature
DSC
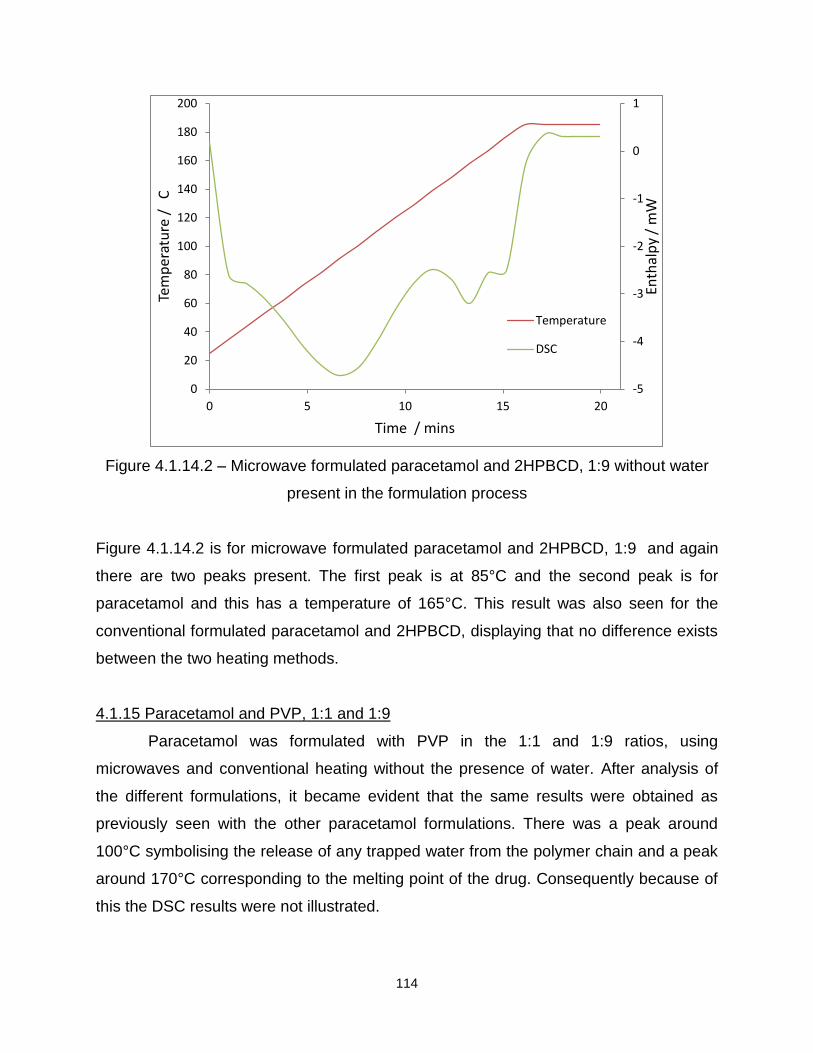
114
Figure 4.1.14.2 – Microwave formulated paracetamol and 2HPBCD, 1:9 without water
present in the formulation process
Figure 4.1.14.2 is for microwave formulated paracetamol and 2HPBCD, 1:9 and again
there are two peaks present. The first peak is at 85°C and the second peak is for
paracetamol and this has a temperature of 165°C. This result was also seen for the
conventional formulated paracetamol and 2HPBCD, displaying that no difference exists
between the two heating methods.
4.1.15 Paracetamol and PVP, 1:1 and 1:9
Paracetamol was formulated with PVP in the 1:1 and 1:9 ratios, using
microwaves and conventional heating without the presence of water. After analysis of
the different formulations, it became evident that the same results were obtained as
previously seen with the other paracetamol formulations. There was a peak around
100°C symbolising the release of any trapped water from the polymer chain and a peak
around 170°C corresponding to the melting point of the drug. Consequently because of
this the DSC results were not illustrated.
-5
-4
-3
-2
-1
0
1
0
20
40
60
80
100
120
140
160
180
200
0 5 10 15 20
Enth
alp
y /
mW
Tem
per
atu
re /
C
Time / mins
Temperature
DSC

115
After DSC was employed to determine if any differences occurred between formulations
on a molecular level, it was important to see if any differences can be seen visually and
therefore on a physical level. SEM was used to investigate the physical properties of
each of the different formulations.
14.2 Scanning Electron Microscope (SEM)
The scanning electron microscope was used to determine if any structural
differences could be seen between the different formulations. First the pure compounds
were analysed at three different magnifications (X33, X85 and X300) to gain a
representative image of the samples. Each formulation prepared, i.e. with or without the
presence of water and using the two different heating methods was analysed. Figures
4.2.1 - 4.2.8 illustrate the pure compounds and these were used for comparison with the
formulations.
4.2.1 Comparison of pure drug and excipients
Figure 4.2.1 -SEM image for pure ibuprofen, magnification x300

116
Figure 4.2.2 – SEM image for pure ketoprofen, magnification x300
Figure 4.2.3 – SEM image for pure flurbiprofen, magnification x300
Figure 4.2.4 – SEM image for pure paracetamol, magnification x300

117
Figures 4.2.1 - 4.2.4 display the SEM images for the four pure drugs. Figure 4.2.1
illustrates pure ibuprofen. From the image it is possible to conclude that the drug has a
regular elongated particle shape. Figure 4.2.2 is for ketoprofen and from the image it is
possible to conclude that the drug has a spherical particle shape. Figure 4.2.3 is for
flurbiprofen, and for this particular drug the particle shape is rectangular, and the final
image, Figure 4.2.4, is for paracetamol and the particles appear to be needle-like in
shape.
Figure 4.2.5 - SEM image for pure stearic acid (SA), magnification x300
Figure 4.2.6 - SEM image for pure β-cyclodextrin (BCD), magnification x300
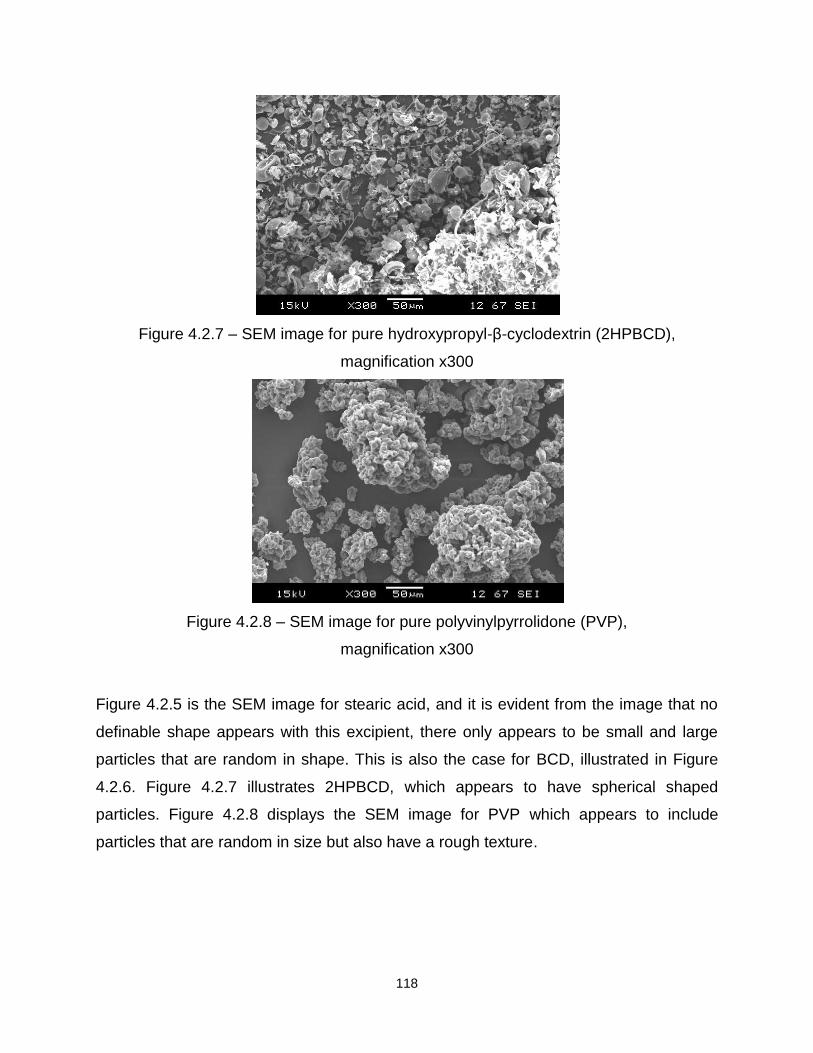
118
Figure 4.2.7 – SEM image for pure hydroxypropyl-β-cyclodextrin (2HPBCD),
magnification x300
Figure 4.2.8 – SEM image for pure polyvinylpyrrolidone (PVP),
magnification x300
Figure 4.2.5 is the SEM image for stearic acid, and it is evident from the image that no
definable shape appears with this excipient, there only appears to be small and large
particles that are random in shape. This is also the case for BCD, illustrated in Figure
4.2.6. Figure 4.2.7 illustrates 2HPBCD, which appears to have spherical shaped
particles. Figure 4.2.8 displays the SEM image for PVP which appears to include
particles that are random in size but also have a rough texture.

119
4.2.2 Comparison of the different formulations
Ibuprofen was the first drug to be investigated with the four different excipients.
Figures 4.2.2.1 to 4.2.2.3 illustrates a few examples of the different ibuprofen
formulations, and Table 4.2.2.1 summarises all the results obtained from the SEM for
this particular drug.
Figure 4.2.2.1 - Microwave formulated ibuprofen and BCD, 1:1 ratio, with water present
during formulation, magnification x85
Figure 4.2.2.2 - Microwave formulated ibuprofen and 2HPBCD 1:1 ratio, without water
present during formulation, magnification x85

120
Figure 4.2.2.3 - Microwave formulated ibuprofen and PVP 1:9 ratio, without water
present during formulation, magnification x85
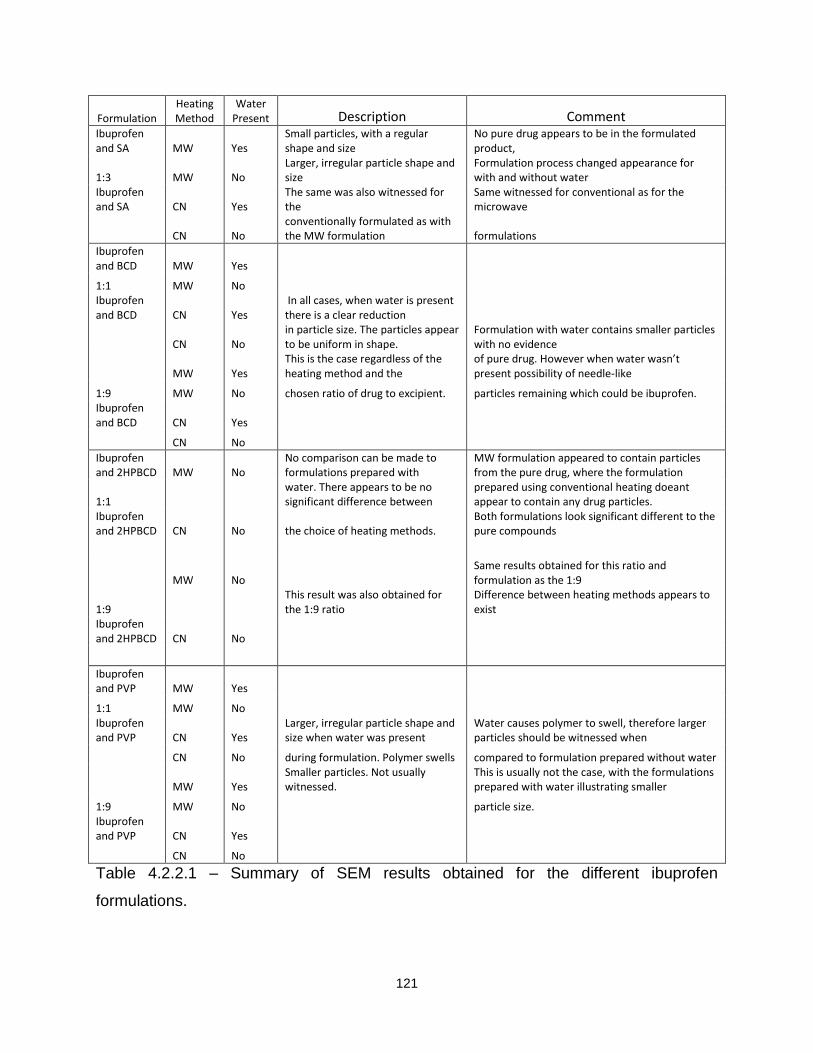
121
Formulation Heating Method
Water Present Description Comment
Ibuprofen and SA MW Yes
Small particles, with a regular shape and size
No pure drug appears to be in the formulated product,
1:3 MW No Larger, irregular particle shape and size
Formulation process changed appearance for with and without water
Ibuprofen and SA CN Yes
The same was also witnessed for the
Same witnessed for conventional as for the microwave
CN No
conventionally formulated as with the MW formulation formulations
Ibuprofen and BCD MW Yes
1:1 MW No Ibuprofen and BCD CN Yes
In all cases, when water is present there is a clear reduction
CN No
in particle size. The particles appear to be uniform in shape.
Formulation with water contains smaller particles with no evidence
MW Yes
This is the case regardless of the heating method and the
of pure drug. However when water wasn’t present possibility of needle-like
1:9 MW No chosen ratio of drug to excipient. particles remaining which could be ibuprofen. Ibuprofen and BCD CN Yes
CN No
Ibuprofen and 2HPBCD MW No
No comparison can be made to formulations prepared with
MW formulation appeared to contain particles from the pure drug, where the formulation
1:1
water. There appears to be no significant difference between
prepared using conventional heating doeant appear to contain any drug particles.
Ibuprofen and 2HPBCD CN No the choice of heating methods.
Both formulations look significant different to the pure compounds
MW No
Same results obtained for this ratio and formulation as the 1:9
1:9
This result was also obtained for the 1:9 ratio
Difference between heating methods appears to exist
Ibuprofen and 2HPBCD CN No
Ibuprofen and PVP MW Yes
1:1 MW No
Ibuprofen and PVP CN Yes
Larger, irregular particle shape and size when water was present
Water causes polymer to swell, therefore larger particles should be witnessed when
CN No during formulation. Polymer swells compared to formulation prepared without water
MW Yes
Smaller particles. Not usually witnessed.
This is usually not the case, with the formulations prepared with water illustrating smaller
1:9 MW No
particle size.
Ibuprofen and PVP CN Yes
CN No
Table 4.2.2.1 – Summary of SEM results obtained for the different ibuprofen
formulations.

122
After all the different ibuprofen formulations were analysed using SEM, the different
ketoprofen formulations were also investigated. Figures 4.2.2.4 to Figure 4.2.2.7
illustrate a few examples of the SEM micrographs obtained for the different ketoprofen
formulations, and Table 4.2.2.2 is an overall summary of all the results obtained with
SEM.
Figure 4.2.2.4 - Microwave formulated ketoprofen and BCD 1:1 ratio, with water present
during formulation, magnification x85
Figure 4.2.2.5 - Microwave formulated ketoprofen and BCD 1:9 ratio, without water
present during formulation, magnification x85

123
Figure 4.2.2.6 - Microwave formulated ketoprofen and PVP 1:1 ratio, with water present
during formulation, magnification x85
Figure 4.2.2.7 - Microwave formulated ketoprofen and PVP 1:1 ratio, without water
present during formulation, magnification x85
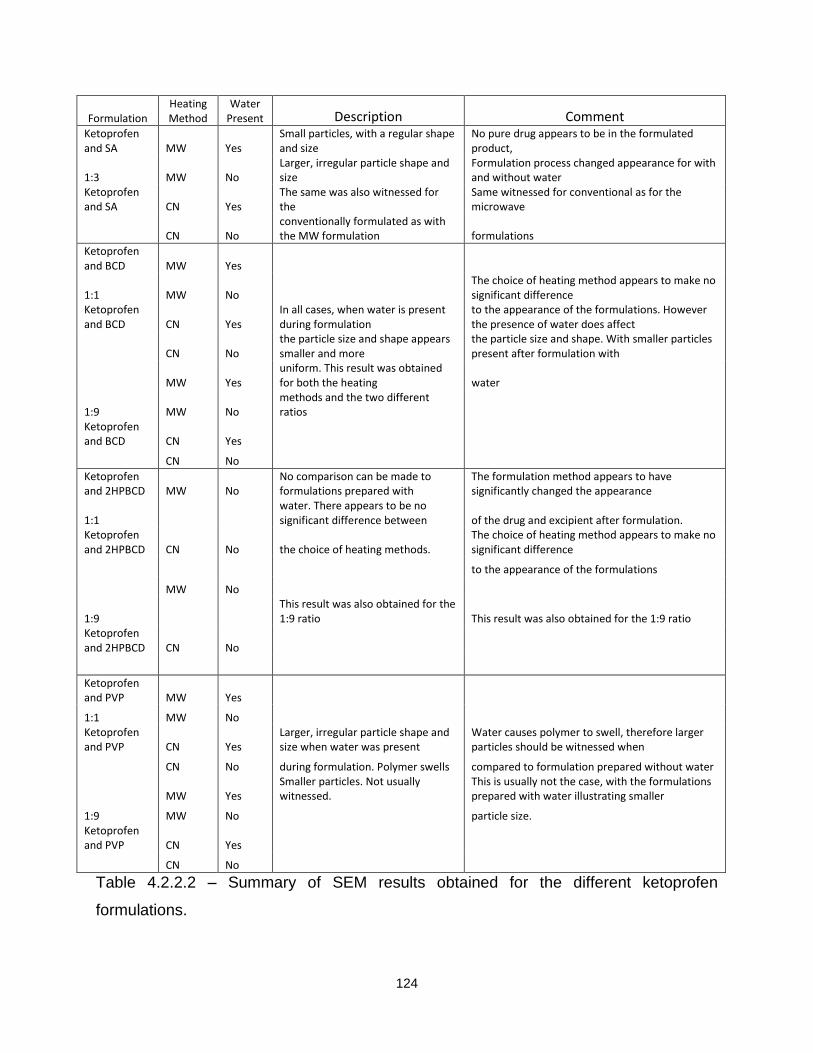
124
Formulation Heating Method
Water Present Description Comment
Ketoprofen and SA MW Yes
Small particles, with a regular shape and size
No pure drug appears to be in the formulated product,
1:3 MW No Larger, irregular particle shape and size
Formulation process changed appearance for with and without water
Ketoprofen and SA CN Yes
The same was also witnessed for the
Same witnessed for conventional as for the microwave
CN No
conventionally formulated as with the MW formulation formulations
Ketoprofen and BCD MW Yes
1:1 MW No The choice of heating method appears to make no significant difference
Ketoprofen and BCD CN Yes
In all cases, when water is present during formulation
to the appearance of the formulations. However the presence of water does affect
CN No
the particle size and shape appears smaller and more
the particle size and shape. With smaller particles present after formulation with
MW Yes
uniform. This result was obtained for both the heating water
1:9 MW No methods and the two different ratios
Ketoprofen and BCD CN Yes
CN No
Ketoprofen and 2HPBCD MW No
No comparison can be made to formulations prepared with
The formulation method appears to have significantly changed the appearance
1:1
water. There appears to be no significant difference between of the drug and excipient after formulation.
Ketoprofen and 2HPBCD CN No the choice of heating methods.
The choice of heating method appears to make no significant difference
to the appearance of the formulations
MW No
1:9
This result was also obtained for the 1:9 ratio This result was also obtained for the 1:9 ratio
Ketoprofen and 2HPBCD CN No
Ketoprofen and PVP MW Yes
1:1 MW No
Ketoprofen and PVP CN Yes
Larger, irregular particle shape and size when water was present
Water causes polymer to swell, therefore larger particles should be witnessed when
CN No during formulation. Polymer swells compared to formulation prepared without water
MW Yes
Smaller particles. Not usually witnessed.
This is usually not the case, with the formulations prepared with water illustrating smaller
1:9 MW No
particle size.
Ketoprofen and PVP CN Yes
CN No
Table 4.2.2.2 – Summary of SEM results obtained for the different ketoprofen
formulations.

125
Flurbiprofen was the next drug investigated using SEM, Figure 4.2.2.8 and Figure
4.2.2.9 are a few examples of the SEM micrographs obtained. Table 4.2.2.3
summarises all the results obtained for this drug and the two different excipients.
Figure 4.2.2.8 - Microwave formulated flurbiprofen and PVP 1:1, without water present
during formulation, magnification x85
Figure 4.2.2.9 - Microwave formulated flurbiprofen and PVP 1:9, with water present
during formulation, magnification x85

126
Formulation Heating Method
Water Present Description Comment
Flurbiprofen and SA MW Yes
Small particles, with a regular shape and size
No pure drug appears to be in the formulated product,
1:3 MW No Larger, irregular particle shape and size
Formulation process changed appearance for with and without water
Flurbiprofen and SA CN Yes
The same was also witnessed for the
Same witnessed for conventional as for the microwave
CN No
conventionally formulated as with the MW formulation formulations
Flurbiprofen and PVP MW Yes
1:1 MW No
Flurbiprofen and PVP CN Yes
Larger, irregular particle shape and size when water was present
Water causes polymer to swell, therefore larger particles should be witnessed when
CN No during formulation. Polymer swells compared to formulation prepared without water
MW Yes
Smaller particles. Not usually witnessed.
This is usually not the case, with the formulations prepared with water illustrating smaller
1:9 MW No
particle size.
Flurbiprofen and PVP CN Yes
CN No
Table 4.2.2.3 – Summary of SEM results obtained for the different flurbiprofen
formulations.
The last drug analysed using SEM was paracetamol with the four different excipients.
Figure 4.2.2.10 to Figure 4.2.2.12 display a few examples of these formulations and
Table 4.2.2.4 summarises all the results obtained from the SEM for this drug.
Figure 4.2.2.10 - Conventionally formulated paracetamol and BCD 1:1 ratio,
without water present during formulation, magnification x85

127
Figure 4.2.2.11 - Microwave formulated paracetamol and 2HPBCD 1:9 ratio, without
water present during formulation, magnification x85
Figure 4.2.2.12 - Microwave formulated paracetamol and PVP 1:9 ratio, without water
present during formulation, magnification x85
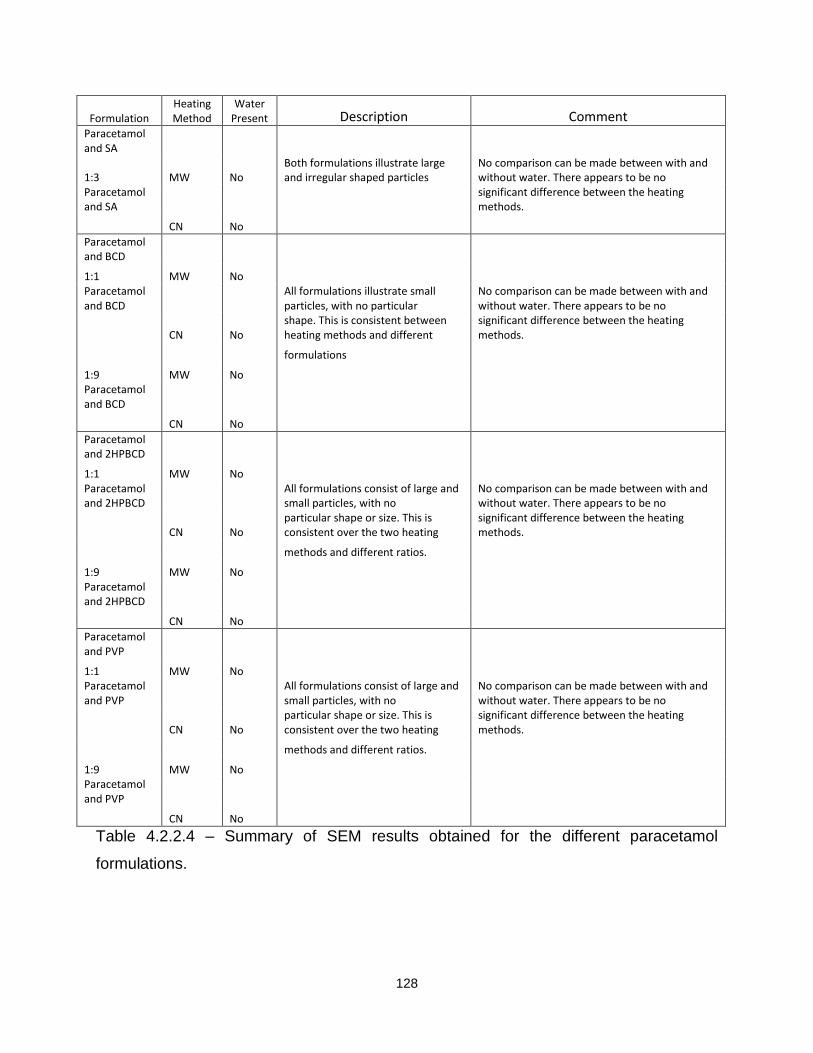
128
Formulation Heating Method
Water Present Description Comment
Paracetamol and SA
1:3 MW No Both formulations illustrate large and irregular shaped particles
No comparison can be made between with and without water. There appears to be no
Paracetamol and SA
significant difference between the heating methods.
CN No
Paracetamol and BCD
1:1 MW No Paracetamol and BCD
All formulations illustrate small particles, with no particular
No comparison can be made between with and without water. There appears to be no
CN No
shape. This is consistent between heating methods and different
significant difference between the heating methods.
formulations
1:9 MW No Paracetamol and BCD
CN No
Paracetamol and 2HPBCD
1:1 MW No
Paracetamol and 2HPBCD
All formulations consist of large and small particles, with no
No comparison can be made between with and without water. There appears to be no
CN No
particular shape or size. This is consistent over the two heating
significant difference between the heating methods.
methods and different ratios.
1:9 MW No
Paracetamol and 2HPBCD
CN No
Paracetamol and PVP
1:1 MW No
Paracetamol and PVP
All formulations consist of large and small particles, with no
No comparison can be made between with and without water. There appears to be no
CN No
particular shape or size. This is consistent over the two heating
significant difference between the heating methods.
methods and different ratios.
1:9 MW No
Paracetamol and PVP
CN No
Table 4.2.2.4 – Summary of SEM results obtained for the different paracetamol
formulations.

129
4.2.3 SEM summary
From all the results obtained, it appears that little or no significant difference
exists between the two different heating methods. However, in cases where water was
present during formulation the particle size seemed to be reduced. This was seen
throughout the analysis until PVP was used as the excipient and when water was
present. Here, the formulation with water illustrated a larger particle size and this may
be because of the polymer swelling when exposed to the water in the formulation
method.
All the different formulations were analysed and compared using DSC and SEM. It was
noted from the DSC that the formulation method did affect the thermal behaviour of the
drug and excipient and these differences were seen visually by using the SEM. Despite
the usefulness of DSC and SEM, these techniques do not determine the stability of the
drug once it has undergone the heating process, an instrument that will allow this to be
calculated is the thermal activity monitor (TAM). Out of all the drugs that were
formulated with the different excipients, ibuprofen was the only one that melted at the
chosen formulation temperature. It was therefore important to ensure that this didn’t
affect the stability of the drug once formulated.
4.3 Thermal Activity Monitor (TAM)
A thermal activity monitor (TAM) was used to investigate the stability of different
formulations at 30°C for a period of four days. The TAM has two sample cells so each
formulation was analysed in duplicate.
4.3.1 Pure ibuprofen
Three separate experiments were performed to determine the stability of
ibuprofen. These included:
A) Under 0% humidity
B) Under 51% humidity ((Mg(NO3)2)
C) Dissolved in buffer (pH8)

130
In all cases, there appears to be 0μW/g of heat flow. This indicated that no thermal
processes occurred over the four day period under any conditions used. Consequently it
can be said ibuprofen was stable under all conditions, and an example can be seen in
Figure 4.3.1.1
Figure 4.3.1 - Pure Ibuprofen, held at 30°C, 0% relative humidity
After pure ibuprofen was investigated, each of the different formulations was analysed
using TAM over a four day period. In all cases an output of 0μW/g was evident for all
the different formulations indicating no thermal processes occurred, consequently all the
formulations appeared stable after the formulation process. Two examples are
illustrated in Figure 4.3.2 and Figure 4.3.3.

131
Figure 4.3.2 Ibuprofen with SA, held at 30°C, 0% relative humidity, formulated using the
microwave method with water present during formulation
Figure 4.3.3 - Ibuprofen with BCD, 1:1 ratio, held at 30°C, 0% relative humidity,
formulated using the conventional method with water present during formulation
-100
-50
0
50
0 1 2 3 4
HE
AT
FL
OW
/ µ
W g
-1
TIME / DAYS

132
In total there were four drugs and four different excipients formulated. However other
than ibuprofen, the other three drugs (ketoprofen, flurbiprofen, and paracetamol) did not
melt at the formulation temperature (85°C). Consequently ibuprofen was studied in
detail, with the other three drugs to be carried on in the future work programme.
However after analysis of a few formulations for the other three drugs, the same
results seen for ibuprofen were also witnessed for ketoprofen, flurbiprofen and
paracetamol. Figure 4.3.4 – Figure 4.3.6 illustrate a few examples of the graphs
obtained from the TAM, in all cases 0μw/g heat flow can be seen and therefore no
thermal processes occurred over the four days.
Figure 4.3.4 - Ketoprofen with PVP, 1:1 ratio, held at 30°C, 0% relative humidity,
formulated using the microwave method with water present during formulation

133
Figure 4.3.5 - Flurbiprofen with PVP, 1:1 ratio, held at 30°C, 0% relative humidity,
formulated using the microwave method without water present during formulation
Figure 4.3.6 - Paracetamol with BCD, 1:1 ratio, held at 30°C, 0% relative humidity,
formulated using the microwave method without water present during formulation

134
From all the results illustrated, the output signal is zero for all the ibuprofen formulations
and for the few examples illustrated for ketoprofen, flurbiprofen and paracetamol. It can
be said that the formulation process and the presence of water has made no difference
to the stability of the drug. It is difficult to determine if all the formulations show the same
results for ketoprofen, flurbiprofen and paracetamol but because of time restrictions
these drugs could not be studied further. Therefore these formulations can be continued
and analysed within a programme of future work. However to hypothesise, from the
results previously seen it is likely that the other formulations will again show no adverse
effects, i.e. show a signal output on or around zero and consequently will be stable
within the four different excipients.

135
References
1. Experimental design aids the development of a differential scanning calorimetry
standard test procedure for pharmaceuticals, S Roy, AT Riga, KS Alexander,
Thermochimica Acta, Vol 392-393, 399-404, 2002
2. Application of differential scanning calorimetry to the study of solid drug
dispersions, KH Kim, MJ Frank, NL Henderson, Journal of Pharmaceutical
Sciences, 3, Vol 74, 283-289, 1985
3. Ampicillin-direct compression excipients: Pre-formulation stability screening using
differential scanning calorimetry, HH El-Shattawy, Drug development and
industrial pharmacy, 6, Vol 8, 819-831, 1982
4. Differential scanning calorimetry of ampicillin-aspartame mixture, HH El-
Shattawy, DO Kildsig, GE Peck, Drug development and industrial pharmacy, 6,
Vol 8, 857-868, 1982
5. Phase diagram for the mixture of ibuprofen and stearic acid, S
Lerdkanchanaporn, D Dollimore, SJ Evans, Thermochimica Acta, Vol 367-368, 1-
8, 2001

Chapter 5
Drug Release
137
Chapter 5 – Drug Release: Dissolution Analysis 5.1 Introduction
Dissolution analysis is an important analytical technique in the pharmaceutical
industry. It provides drug release profiles which can then be used to determine any
differences between any two or more products under consideration1-4. A detailed
discussion on the theoretical aspects of the analytical technique itself can be found in
Chapter One.
The percentage of drug release was measured over four hours, however only the
first ninety minutes will be illustrated as this period is where the majority of the observed
differences occurred.
Each graph presented in this section indicates which heating method was used,
microwave heating (MW) or conventional heating (CN), and identifies the presence
(with), or the absence (without), of water where appropriate. Each curve is the average
of three repeat runs with error bars equal to one standard deviation. Where differences
between the dissolution profiles were observed the initial rate of dissolution was
calculated by dividing the slope by the horizontal distance between any two points (rate
of change).

138
Figure 5.1.1 –A drug release profile for Ibuprofen and BCD, 1:1 ratio, displaying the full
four hours of data
5.2 Ibuprofen, Ketoprofen and Flurbiprofen Drug Release in Water
Previous research has suggested that microwaves can increase the solubility
and rate of drug release of certain drugs5-10, that are classified within the BCS Class
Two, without the necessity of increasing the pH of the dissolution media.
To further investigate these findings, all the formulations that were prepared
using microwave or conventional heating were analysed using dissolution analysis with
a media of water. The two different heating methods were also compared to determine if
microwave heating produced any differences in dissolution when compared with
conventional heating.
The first formulations analysed were ibuprofen with the four different excipients.
In all cases there was an improvement in the dissolution of the drug once formulated
with the various excipients. Another observed trend was that the microwave
formulations seemed to improve the extent of dissolution of ibuprofen when compared
with formulations prepared using conventional heating (Figures 5.2.1 and 5.2.2 are
0
20
40
60
80
100
120
0 50 100 150 200 250
% D
rug
Re
leas
e
Time / mins Microwave With Microwave Without Conventional With Conventional Without

139
examples of ibuprofen with two of the excipients), although the difference is relatively
small.
Figure 5.2.1 – A drug release profile for Ibuprofen and BCD, 1:9 ratio, highlighting the
improved release in the presence of the excipient
Figure 5.2.2 – A drug release profile for Ibuprofen and 2HPBCD 1:9 ratio highlighting
the improved release in the presence of the excipient
0
10
20
30
40
50
60
70
80
90
0 20 40 60 80
% D
rug
Rel
ease
Time / mins
Pure Ibuprofen Microwave formulated Conventional formulated
0
10
20
30
40
50
60
0 20 40 60 80
% D
rug
Rel
ease
Time / mins
Pure Ibuprofen Microwave formulated Conventional formulated

140
Figure 5.2.1 and Figure 5.2.2 are examples of ibuprofen formulations. Formulating
ibuprofen with the different excipients seems to increase the extent of the dissolution for
the drug. Figure 5.2.1 is for ibuprofen with BCD in a 9:1 ratio, the maximum amount of
pure drug released over the ninety minute time period is 6% (±1%), and when this is
compared with formulated ibuprofen with BCD, 1:9 ratio an increase up to 60-70%
(±10%) is seen. This shows an approximate 10-12 fold increase in the extent of
dissolution after the formulation process. Along with this increase, the release profile for
ibuprofen formulated using microwave heating appears to improve the dissolution of the
drug to a greater extent than conventional heating. The first five minutes of analysis
shows little difference between the two heating methods but after this time period the %
drug release profiles separate and visually appear to be different. However, when the
percentage error is calculated a 10% error can be associated with the majority of the
measurements. This consequently makes it difficult to determine if there are significant
differences between the release profiles and therefore the two heating methods.
Figure 5.2.2 displayes ibuprofen with a second excipient, 2HPBCD. When the
dissolution for the pure drug was compared with the dissolution of the formulation an
improvement is again evident. The release profile for the pure drug shows only 6%
(±1%) of the drug in solution compared with 40-49% (±5%) for the formulated product.
This illustrates an approximate 7-8-fold increase in the dissolution. There is also a slight
difference between the release profiles for microwave and conventional heating with the
microwave formulation releasing a higher percentage of the drug over the ninety minute
time period. For the first thirty minutes, both profiles appear to release the same amount
of ibuprofen (35% ± 3%) After this time period, the two release profiles begin to
separate with the microwave heating releasing over 45% (± 7%) of the drug compared
with 39-40%(± 2%) for conventional heating.
Both profiles show how pure ibuprofen behaves in water, only 6-7% of the drug
dissolves and this illustrates how limiting the rate of dissolution is which will ultimately
limit bioavailability. The two examples illustrated demonstrate that by adding an
excipient and heating ibuprofen a great improvement in the degree of drug release can
be obtained. For all the formulations that were prepared, an improvement in the extent
of ibuprofen released was obtained. In addition, microwave heating tends to show a

141
greater improvement in the extent of drug release of ibuprofen when compared with
conventional heating.
The highest increase in drug release for ibuprofen was observed when
formulated with BCD in a 1:9 ratio (Figure 5.2.1), with the next significant increase
2HPBCD (Figure 5.2.2). The SA and PVP formulations provided an increase in the
extent of drug release but not as significant as the two formulations illustrated.
A similar pattern of improved dissolution after formulation was also observed with
ketoprofen. Figure 5.2.3 is an example of ketoprofen with PVP, 1:9, Figure 5.2.4 shows
ketoprofen formulated with SA, 1:3.
Figure 5.2.3 – A drug release profile for ketopofen and PVP, ratio 1:9 using both
microwave and conventional heating methods compared with ketoprofen alone
0
10
20
30
40
50
60
70
80
90
100
0 10 20 30 40 50 60 70 80 90
% D
rug
Re
leas
e
Time / mins
Pure Ketoprofen Microwave formulated Conventional formulated

142
Figure 5.2.4 – A drug release profile for ketopofen and SA, ratio 1:3 using both
microwave and conventional heating methods compared with ketoprofen alone
Figure 5.2.3 is an example of ketoprofen formulated with PVP in a 1:9 ratio using
microwaves and conventional heating. From analysis of the dissolution curves, it
appears that a slight increase in the release of the drug occurred over the ninety
minutes. However, when the percentage error was calculated a 10% error can be
associated with the measurements. This consequently makes it difficult to determine
any significant differences, but over the last twenty minutes of the dissolution the
percentage drug release continues to increase for the formulated drug. This may help to
illustrate that after formulation there is an improvement in the dissolution for ketoprofen.
There also appears to be little or no difference between the two heating methods with
both releasing over 90% (±7%) of ketoprofen towards the end of the ninety minutes time
period.
Figure 5.2.4 illustrates ketoprofen and SA formulated using microwaves and
conventional heating. It is evident from the release profiles that adding the excipient SA
to ketoprofen has decreased the release of the drug. This result shows an approximate
2-fold decrease for the microwave formulation and a decrease of 4-fold for the
0
10
20
30
40
50
60
70
0 20 40 60 80
% D
rug
Rel
ease
Time / mins
Pure Ketoprofen Microwave formulated Conventional formulated
143
conventional formulation. It is probable the result has been obtained because SA is a
waxy compound that doesn’t dissolve in this solvent and unlike ibuprofen, ketoprofen
doesn’t melt at a similar temperature to SA. It is therefore likely that during the
formulation process the SA coated the drug making it difficult for any dissolution media
to penetrate into the matrix once formulated. Also, when the release profiles for both the
heating methods were compared, it can be seen that the microwave formulation
released a slight higher percentage of ketoprofen. After the ninety minutes period the
microwave formulation attained a drug release of 31% (±3%) compared with 18% (±5%)
using the conventional method. This result may have occurred because of the uniform
heating that microwaves provide, resulting in a formulation that had the drug and
excipient evenly mixed throughout the matrix.
From analysis of all the different formulations, it is evident that an improvement
in the extent of release of ketoprofen occurred with the inclusion of excipients, other
than SA. There is also little or no significant difference between the two heating
methods other than in the ketoprofen and SA example illustrated (Figure 5.2.4). The
highest increase in drug release was observed when the drug was formulated with PVP
in a 1:9 ratio (Figure 5.2.3), with the lowest improvement in the release of ketoprofen
when SA is present in the formulation, illustrated by Figure 5.2.4.
After ketoprofen was analysed, a third drug was investigated, namely
fluribiprofen. Flurbiprofen was formulated with SA and PVP only. It was not formulated
using BCD and HPBCD because of difficulties experienced when monitoring the drug
release as a consequence of a possible shift in absorbance. Despite not investigating
this drug with all four excipients, some trends were seen. These include an
improvement in the release of flurbiprofen when PVP was added. Also when SA was
added to flurbiprofen, a similar trend to that seen for ketoprofen and SA was observed
(Figure 5.2.5).
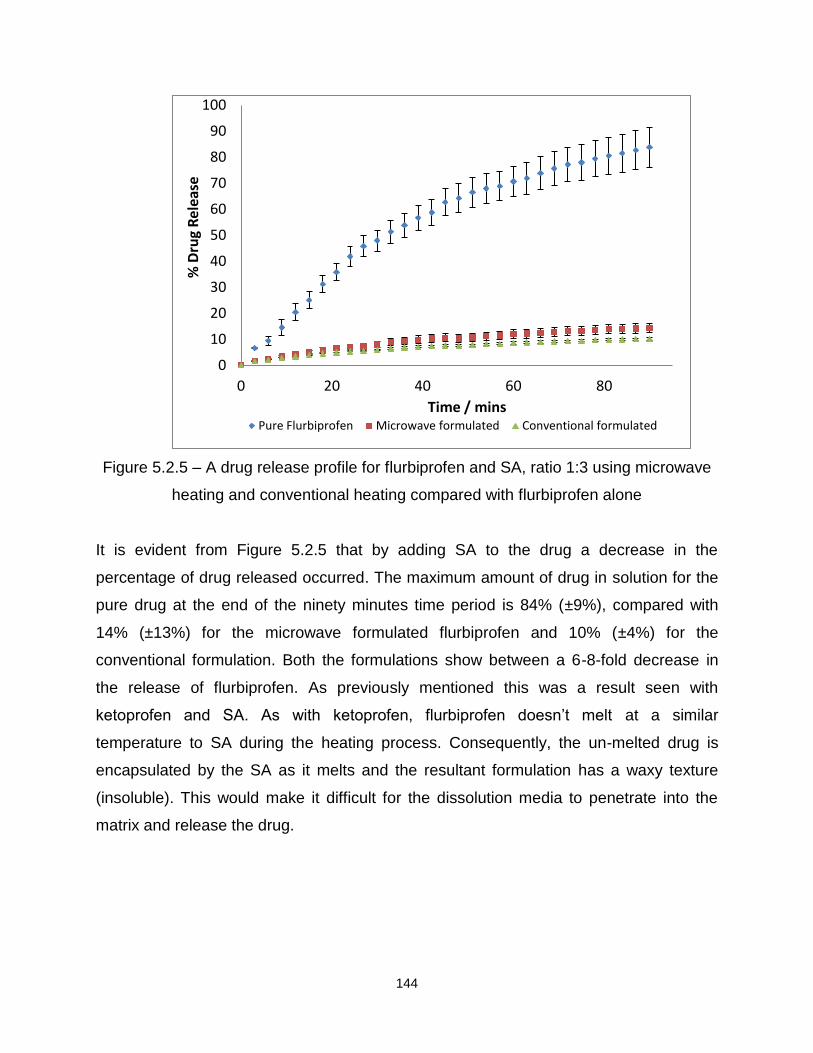
144
Figure 5.2.5 – A drug release profile for flurbiprofen and SA, ratio 1:3 using microwave
heating and conventional heating compared with flurbiprofen alone
It is evident from Figure 5.2.5 that by adding SA to the drug a decrease in the
percentage of drug released occurred. The maximum amount of drug in solution for the
pure drug at the end of the ninety minutes time period is 84% (±9%), compared with
14% (±13%) for the microwave formulated flurbiprofen and 10% (±4%) for the
conventional formulation. Both the formulations show between a 6-8-fold decrease in
the release of flurbiprofen. As previously mentioned this was a result seen with
ketoprofen and SA. As with ketoprofen, flurbiprofen doesn’t melt at a similar
temperature to SA during the heating process. Consequently, the un-melted drug is
encapsulated by the SA as it melts and the resultant formulation has a waxy texture
(insoluble). This would make it difficult for the dissolution media to penetrate into the
matrix and release the drug.
0
10
20
30
40
50
60
70
80
90
100
0 20 40 60 80
% D
rug
Rel
ease
Time / mins Pure Flurbiprofen Microwave formulated Conventional formulated

145
The previous section shows the ‘dry melts’ of the drug and excipient can have a
significant impact on the dissolution profiles and that, in some cases, microwave heating
showed small but observable differences to conventional heating. The next section
describes results of experiments investigating the effect of water on the formulation
process.
5.3 Ibuprofen
5.3.1 The effect of the presence of water during formulation
It was decided to incorporate water into the formulation process to determine
how the presence of a liquid affected the release profiles of a drug with poor aqueous
solubility.
Ibuprofen was formulated with three different excipients (2HPBCD not formulated
with water present) with the resultant formulations analysed to establish drug release
profiles. A summary of all the results are illustrated at the end of this section in Table
5.3.1.8. Figures 5.3.1.1 to 5.3.1.7 are examples of some of the results obtained from the
dissolution of ibuprofen with SA, BCD and PVP. Where significant differences occurred
in the dissolution profiles, the rate was calculated to support the visual data seen on the
presented graphs.
Figure 5.3.1.1 and Figure 5.3.1.2 are examples of where the presence of water
during formulation did not significantly affect the release of the drug.

146
Figure 5.3.1.1 – A drug release profile for Ibuprofen and SA (ratio 1:3), formulated using
microwave heating both with and without the presence of water during the formulation
process
Figure 5.3.1.1 is an illustration of ibuprofen and SA formulated using microwave
heating. After the first fifteen minutes, it is evident that the two profiles are the same.
Over the ninety minutes both formulations are seen to release 70% (±5%) of the drug.
Therefore it can be said that the presence of water in this particular example did not
affect the release of ibuprofen from SA. However, the first fifteen minutes of the
dissolution profile are different and consequently the rate was calculated to support this
visual difference. After calculation of the rate it becomes evident that the formulation
with water releases ibuprofen at a rate of 18.7% per minute compared with 7.8% per
minute over a three minute time period. As a result, it can be said that the first fifteen
minutes of the dissolution are different, with the formulation prepared with water present
releasing the drug at a faster rate. From fifteen minutes onwards it can be seen that
both rates become similar and the same amount of ibuprofen was released. Table
5.3.1.1 illustrates the rates for each formulation over a thirty minute time period.
0
10
20
30
40
50
60
70
0 20 40 60 80
% D
rug
Rel
ease
Time / mins
Microwave heated With water Microwave heated Without water

147
Rate (% released per minute)
Time(min) With Without
0-3 18.71 7.76
3-15 0.16 2.38
15-30 0.36 0.37
Table 5.3.1.1 – Rate of release of ibuprofen from SA when prepared with or without the
presence of water during microwave formulation
Table 5.3.1.1 illustrates the difference between the formulations for the first fifteen
minutes of the dissolution experiment, after this time period the rate becomes similar
(0.36% for the formulation in the presence of water compared with 0.37% for
formulation without water).
Figure 5.3.1.2 is another example of an ibuprofen formulation that was not
affected by the presence of water. The example illustrated is for ibuprofen and PVP, 1:9
ratio and conventionally heated.
Figure 5.3.1.2 – A drug release profile for Ibuprofen and PVP (ratio 1:9), formulated
using conventional heating both with and without the presence of water during the
formulation process
0
10
20
30
40
50
60
70
0 20 40 60 80
% D
rug
Re
leas
e
Time / mins
Conventional heated with water Conventional heated without water

148
Figure 5.3.1.2 displays no overall difference in total drug release with 60% of ibuprofen
released over ninety minutes in both cases. However for the first three minutes there is
a significant difference in the rate of release for ibuprofen. The formulation prepared
without water present releases the drug at a rate of 19% per minute compared with 15%
for the formulation prepared with water. After this time period the rate slows for both
formulations. The calculated rate confirms what is visually seen in Figure 5.3.1.2, where
a difference can be seen for the first fifteen minutes only, illustrated in Table 5.3.1.2.
Rate (% release per minute)
Time (mins) With Without
0-3 14.62 19.00
3-15 1.15 0.06
15-30 0.11 0.13
Table 5.3.1.2 – Rate of release of ibuprofen from PVP, 1:9 when prepared with or
without the presence of water during formulation
Figure 5.3.1.1 and Figure 5.3.1.2 illustrates the two formulations where the presence of
water did not have an overall effect on the release of ibuprofen. However for the
majority of the ibuprofen formulations prepared with or without water a significant
difference occurred. From analysis of these formulations it becomes evident that when
water was present in the formulation method a higher percentage of ibuprofen was
released.
Figures 5.3.1.3 to Figure 5.3.1.5 illustrate a few examples of where the presence
of water had affected ibuprofen release from the excipient.

149
Figure 5.3.1.3 – A drug release profile for Ibuprofen and SA (ratio 1:3), formulated using
conventional heating both with and without the presence of water during the formulation
process
Figure 5.3.1.3 confirms that the presence of water facilitated a higher percentage of
drug to be released, with 70-75% (±1%) of ibuprofen released after forty minutes. This
is in comparison with 60% (±0.5%) released after forty minutes, which gives an overall
15% difference between the two formulations. The rate also agrees with this statement,
i.e. the formulation with water present released ibuprofen at a faster rate than the
formulation without water present (Table 5.3.1.3).
Rate (% release per minute)
Time(Mins) CN With CN Without
0-3 2.42 2.22
3-15 3.34 1.75
15-30 0.93 1.52
Table 5.3.1.3 – Rate of release of ibuprofen from SA, when prepared with or without the
presence of water during conventional formulating
0
10
20
30
40
50
60
70
80
0 20 40 60 80
% D
rug
Rel
ease
Time / mins
Conventional heated with water Conventional heated without water

150
Figure 5.3.1.4 – A drug release profile for Ibuprofen and BCD (ratio 1:1), formulated
using microwave heating both with and without the presence of water during the
formulation process
Figure 5.3.1.4 shows that for ibuprofen and BCD 1:1 formulated with and without water
there is a significant effect on the release of ibuprofen. In the presence of water more
drug molecules are free to dissolve, with 85% (±9%) of the drug released in the first
fifteen minutes. This is significantly different when compared with the formulations
prepared without water where only 67% (±3%) of ibuprofen was released in a fifteen
minute time period. When the rate was calculated for the different formulations, it
became apparent that the formulation prepared with water released ibuprofen at a faster
rate than the formulation prepared without water. It is also evident that the rate of
release for both formulations also decreased as the dissolution progressed which can
be seen in Figure 5.3.1.4.
0
20
40
60
80
100
0 20 40 60 80
% D
rug
Rel
ease
Time / mins
Microwave heated wth water Microwave heated without water
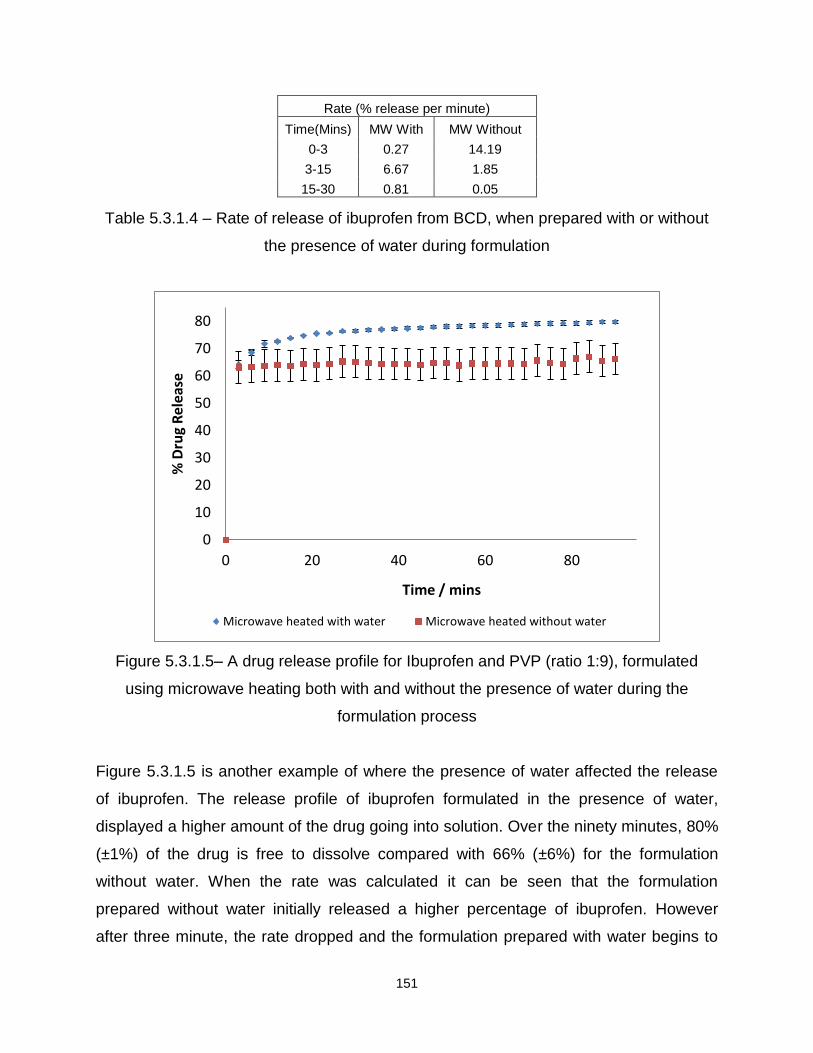
151
Rate (% release per minute)
Time(Mins) MW With MW Without
0-3 0.27 14.19
3-15 6.67 1.85
15-30 0.81 0.05
Table 5.3.1.4 – Rate of release of ibuprofen from BCD, when prepared with or without
the presence of water during formulation
Figure 5.3.1.5– A drug release profile for Ibuprofen and PVP (ratio 1:9), formulated
using microwave heating both with and without the presence of water during the
formulation process
Figure 5.3.1.5 is another example of where the presence of water affected the release
of ibuprofen. The release profile of ibuprofen formulated in the presence of water,
displayed a higher amount of the drug going into solution. Over the ninety minutes, 80%
(±1%) of the drug is free to dissolve compared with 66% (±6%) for the formulation
without water. When the rate was calculated it can be seen that the formulation
prepared without water initially released a higher percentage of ibuprofen. However
after three minute, the rate dropped and the formulation prepared with water begins to
0
10
20
30
40
50
60
70
80
0 20 40 60 80
% D
rug
Rel
ease
Time / mins
Microwave heated with water Microwave heated without water

152
release more of the drug and this continued for the rest of the dissolution, seen in Table
5.3.1.5.
Rate (% release per minute)
Time(Mins) MW With MW Without
0-3 21.42 21.03
3-15 0.78 0.05
15-30 0.17 0.11
Table 5.3.1.5 – Rate of release of ibuprofen from PVP, when prepared with or without
the presence of water during formulation
In the majority of cases, a higher release of ibuprofen from the different excipients was
observed when water had been present in the formulation process. This may occur for
the following reasons: Water may aid the mixing process of the drug and excipient when
drug or both are molten, and as a result a homogenous formulation occurs. This would
improve dissolution because all drug molecules will be surrounded by the excipient
improving overall solubility. Secondly, because of the presence of water, this may
interfere with the interaction between the drug and excipient and as a result, a loosely
bound complex was formed.
Alongside this hypothesis, another possible factor for ibuprofen and BCD (1:1)
without water present can be considered. A decrease in the rate of dissolution was
apparent and this could be occurring because the drug and excipient were in the same
ratio (1:1) and consequently close to the saturation point of the excipient11-12.
In the case of ibuprofen and SA, the difference in the release profiles may have
occurred because of a loosely packed matrix. SA is a waxy fatty acid and when this
excipient was formulated without water, there was no water to interfere with the
interaction and full encapsulation occurs. This then made it difficult for the dissolution
medium to penetrate into the formulation and slowed the release down (this is evident
from all release profiles of ibuprofen and SA).
For ibuprofen and PVP, again the presence of water during formulation allowed
more of the drug to be released over the time period. PVP has cross-linked chains and
this gives it a pocket like structure which swells when exposed to moisture13-14. This
may therefore cause an enlargement of these pockets allowing ibuprofen to fit better
onto the structure, removing the drug from the water and improving dissolution. It is also

153
clear from the dissolution graphs that in most cases, ibuprofen was not released to a
maximum of 100% when formulated with SA and PVP. A possible explanation for these
results is because SA and PVP are insoluble in the chosen buffer and may have
retained a certain percentage of the drug. It was previously mentioned that in the
majority of cases when water is present in the formulation method, a higher percentage
of the drug was released. However the following formulation (ibuprofen and BCD, 1:9)
does not fit this trend.
Figure 5.3.1.6 – A drug release profile for Ibuprofen and BCD (ratio 1:9),
formulated using microwave heating both with and without the presence of water during
the formulation process
Figure 5.3.1.6 displays ibuprofen and BCD (1:9) formulated using microwave heating. It
can be seen that the presence of water has made no significant difference to the overall
percentage drug release. The first twenty minutes of the dissolution profile indicates the
formulation without water released a higher percentage of the drug (97% ±1%
compared with 94% ±3%), and this is also reflected in the rate, Table 5.3.1.6. This was
a result not previously seen with any other ibuprofen formulation, the usual trend
0
20
40
60
80
100
0 20 40 60 80
% D
rug
Rel
ease
Time / mins
Microwave heated with water Microwave eated without water
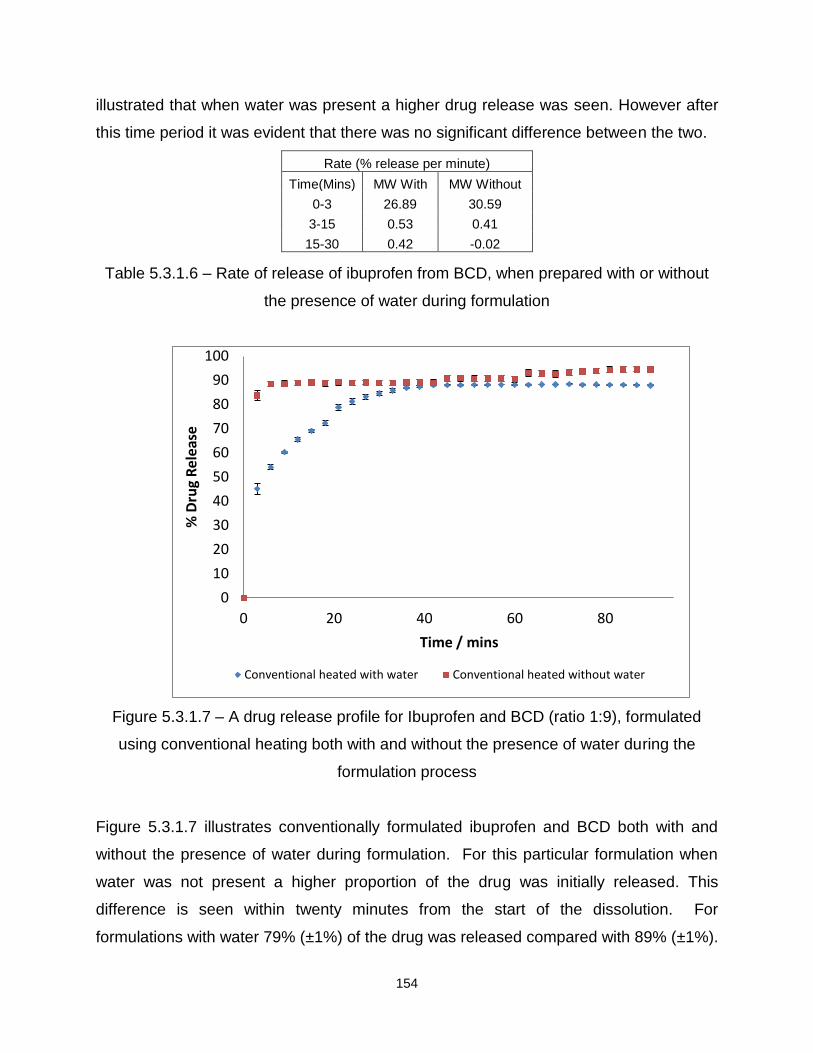
154
illustrated that when water was present a higher drug release was seen. However after
this time period it was evident that there was no significant difference between the two.
Rate (% release per minute)
Time(Mins) MW With MW Without
0-3 26.89 30.59
3-15 0.53 0.41
15-30 0.42 -0.02
Table 5.3.1.6 – Rate of release of ibuprofen from BCD, when prepared with or without
the presence of water during formulation
Figure 5.3.1.7 – A drug release profile for Ibuprofen and BCD (ratio 1:9), formulated
using conventional heating both with and without the presence of water during the
formulation process
Figure 5.3.1.7 illustrates conventionally formulated ibuprofen and BCD both with and
without the presence of water during formulation. For this particular formulation when
water was not present a higher proportion of the drug was initially released. This
difference is seen within twenty minutes from the start of the dissolution. For
formulations with water 79% (±1%) of the drug was released compared with 89% (±1%).
0
10
20
30
40
50
60
70
80
90
100
0 20 40 60 80
% D
rug
Rel
ease
Time / mins
Conventional heated with water Conventional heated without water

155
This difference is also illustrated by the rate of release of the drug (Table 5.3.1.7).
Within the first three minutes ibuprofen was released from the formulation without water
at 27.9% per minute with the majority of the drug released in this time period. The rate
decreased after this, and this is also seen in Figure 5.3.1.7.
Rate (% release per minute)
Time(Mins) CN With CN Without
0-3 15.01 27.87
3-15 1.99 0.38
15-30 1.07 0.00
Table 5.3.1.7 – Rate of release of ibuprofen from BCD, when prepared with or without
the presence of water during formulation
Table 5.3.1.8 illustrates all the results obtained for ibuprofen and the four different
excipients. In some cases no differences occurred, which is illustrated by the statement
of ‘no difference’ in the table. When formulation with water resulted in a higher
percentage drug release this is illustrated by the statement ‘with’ in the table, and
conversely, when formulation without water resulted in a higher release it is identified as
‘without’. For ibuprofen and 2HPBCD no comparison could be made between
formulations prepared with and without water, as this was only prepared without water,
and this is consequently illustrated by the statement ‘N/A’.

156
Drug/Excipient Microwave Heating Conventional Heating
Difference for formulations
With/Without water
Difference for formulations
With/Without water
Ibuprofen/SA 1:3 No Difference With
Ibuprofen/BCD 1:1 With With
Ibuprofen/BCD 1:9 Without Without
Ibuprofen/PVP 1:1 With No Difference
Ibuprofen/PVP 1:9 With With
Ibuprofen/2HPBCD 1:1 N/A N/A
Ibuprofen/2HPBCD 1:9 N/A N/A
Table 5.3.1.8 –A summary to indicate conditions that created the greatest drug
release for ibuprofen with the four different excipients formulated with and without the
presence of water over a ninety minute time period.
5.3.2 The influence of microwave heating compared with conventional heating on
subsequent drug release
Microwaves provide a quicker and more uniform technique of heating which
could allow an advanced method for formulation of drugs and excipients. Consequently
if a direct change over to microwave heating can be achieved without causing a
reduction in drug release and bioavailability this would be advantageous to the
pharmaceutical industry. In this section ibuprofen and the four different excipients were
compared and analysed to determine if there were any differences between the two
heating methods.
From all the results obtained, it appeared that the majority of formulations gave a
higher percentage drug release when formulated using microwave heating. However
there are some exceptions to this and the following graphs (Figure 5.3.2.1-5.3.2.4)
illustrate this. A summary of all the results can be seen at the end of this section (Table
5.3.2.9).

157
Figure 5.3.2.1 – A drug release profile for Ibuprofen and SA (ratio 1:3), formulated using
microwave heating and conventional heating, in both cases with water present as a
solvent
Figure 5.3.2.1 displays ibuprofen and SA, 1:3 ratio and from this graph it can be seen
that the conventional heating method gave a controlled and higher percentage release.
In the first twenty minutes 60% (±4%) of the drug was released when microwave is the
chosen heating method compared with 50% (±1%) for conventional heating. However,
after the first twenty minutes it is evident that the formulation prepared using
conventional heating begins to release the drug to a greater extent. This occurred until a
total of 72% (±0.2%) was released from the conventional formulation compared with
66% (±1%). From calculation of the rate, this was also evident, Table 5.3.2.1. For the
first three minutes the microwave formulation released ibuprofen at a rate of 19% per
minute, compared with 2% per second. This then dramatically decreased for the
microwave formulation as the conventional formulation continues to increase and
release a higher percentage of the drug.
0
10
20
30
40
50
60
70
80
0 20 40 60 80
% D
rug
Re
leas
e
Time / mins
Microwave heated with water Conventional heated with water
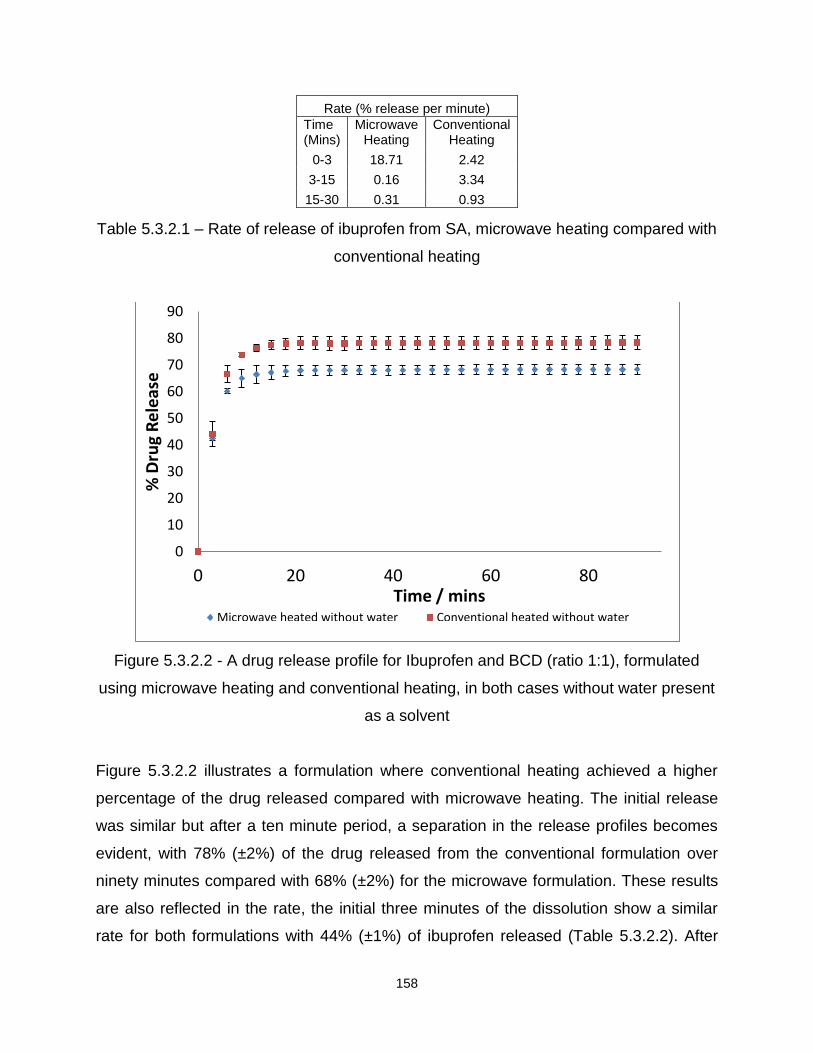
158
Rate (% release per minute)
Time (Mins)
Microwave Heating
Conventional Heating
0-3 18.71 2.42
3-15 0.16 3.34
15-30 0.31 0.93
Table 5.3.2.1 – Rate of release of ibuprofen from SA, microwave heating compared with
conventional heating
Figure 5.3.2.2 - A drug release profile for Ibuprofen and BCD (ratio 1:1), formulated
using microwave heating and conventional heating, in both cases without water present
as a solvent
Figure 5.3.2.2 illustrates a formulation where conventional heating achieved a higher
percentage of the drug released compared with microwave heating. The initial release
was similar but after a ten minute period, a separation in the release profiles becomes
evident, with 78% (±2%) of the drug released from the conventional formulation over
ninety minutes compared with 68% (±2%) for the microwave formulation. These results
are also reflected in the rate, the initial three minutes of the dissolution show a similar
rate for both formulations with 44% (±1%) of ibuprofen released (Table 5.3.2.2). After
0
10
20
30
40
50
60
70
80
90
0 20 40 60 80
% D
rug
Re
leas
e
Time / mins Microwave heated without water Conventional heated without water

159
this time period a decrease in the rate was seen (again for both formulations) but the
rate of release for ibuprofen from the conventional formulations remained higher and
consequently more of the drug was released.
Rate (% release per minute)
Time (Mins)
Microwave Heating
Conventional Heating
0-3 14.19 14.72
3-15 1.85 2.55
15-30 0.05 0.03
Table 5.3.2.2 – Rate of release of ibuprofen from BCD 1:1, microwave heating
compared with conventional heating
Figure 5.3.2.3 – A drug release profile for Ibuprofen and BCD (ratio 1:1), formulated
using microwave heating and conventional heating, in both cases with water present as
a solvent
0
20
40
60
80
100
0 20 40 60 80
% D
rug
Re
leas
e
Time / mins Microwave heated with water Conventional heated with water

160
Figure 5.3.2.3 displays no significant difference between microwave and conventional
heating. In both cases 100% (±4%) of ibuprofen was released over the ninety minutes.
When the rate of release was calculated it was noted at the beginning of the
experiment, the formulation prepared using microwave heating released the drug at a
higher rate. However this rate decreased and at the end of the experiment both
formulations have a similar rate of release and as a result the same amount of the drug
was released.
Rate (% release per minute)
Time (Mins)
Microwave heating
Conventional heating
0-3 0.27 14.20
3-15 6.67 3.41
15-30 0.81 0.76
Table 5.3.2.3 – Rate of release of ibuprofen from BCD 1:1, microwave heating
compared with conventional heating
Figure 5.3.2.4 – A drug release profile for Ibuprofen and PVP (ratio 1:1), formulated
using microwave heating and conventional heating, in both cases without water present
as a solvent
0
10
20
30
40
50
60
70
80
90
0 20 40 60 80
% D
rug
Re
leas
e
Time / mins
Microwave heated wiithout water Conventional heated without water

161
Figure 5.3.2.4 illustrates no significant difference in the release of the drug from either
heating methods. A higher release of ibuprofen from PVP was seen for the microwave
formulation in the initial three minutes (69% ±6% compared with 65% ±1%). However
after this time period, both formulations released approximately the same amount of the
drug.
Rate (% release per minute)
Time (Mins)
Microwave Heating
Conventional Heating
0-3 23.15 21.62
3-15 0.31 0.35
15-30 0.04 0.06
Table 5.3.2.4 – Rate of release of ibuprofen from PVP 1:1, microwave heating
compared with conventional heating
For other ibuprofen based formulations, microwave heating appeared to show a higher
percentage drug release when compared with conventional heating. Figures 5.3.2.5 to
5.3.2.9 illustrate a few examples of where this applies.
Figure 5.3.2.5 - A drug release profile for Ibuprofen and SA, formulated using
microwave heating and conventional heating, in both cases without water present as a
solvent
0
10
20
30
40
50
60
70
80
0 20 40 60 80
% D
rug
Re
leas
e
Time / mins Microwave heated without water Conventional heated without water

162
Figure 5.3.2.5 illustrates ibuprofen and SA formulated using microwave and
conventional heating. It is evident from the dissolution profile that when this particular
formulation was heated using microwaves, a higher percentage drug release occurred
initially but after the ninety minutes both formulations released the same amount of the
drug. After fifty minutes, the microwave formulation released 67% (±2%) and the
conventional formulation released 59% (±3%). After ninety minutes, both formulations
were seen to release approximately 70% of the drug (MW 69% ±2%, CN 68% ±4%).
This result can also be seen in the rate of release, Table 5.3.2.5.
Rate (% release per minute)
Time (Mins)
Microwave Heating
Conventional Heating
0-3 8.80 2.22
3-15 2.60 1.75
15-30 0.29 1.52
Table 5.3.2.5 – Rate of release of ibuprofen from SA, microwave heating compared with
conventional heating
Figure 5.3.2.6 – A drug release profile for Ibuprofen and HPBCD, formulated using
microwave heating and conventional heating, in both cases without water present as a
solvent
0
10
20
30
40
50
60
70
80
90
100
0 20 40 60 80
% D
rug
Re
leas
e
Time / mins
Microwave heated without water Conventional heated without water

163
Figure 5.3.2.6 illustrates that for ibuprofen and 2HPBCD, microwave heating released
90% (±4%) of the drug over the ninety minute period compared with 80% (±1%) for
conventional heating. Upon calculation of the rate of release, Table 5.3.2.6 it can be
seen that the microwave formulation releases the drug at a faster rate when compared
with conventional heating. Consequently more of the drug is released from the
microwave formulation over the time period.
Rate (% release per minute)
Time (Mins)
Microwave Heating
Conventional Heating
0-3 13.53 11.45
3-15 3.43 3.24
15-30 0.03 0.02
Table 5.3.2.6 – Rate of release of ibuprofen from HPBCD, microwave heating compared
with conventional heating
Figure 5.3.2.7 – A drug release profile for Ibuprofen and PVP (ratio 1:9), formulated
using microwave heating and conventional heating, in both cases with water present as
a solvent
0
10
20
30
40
50
60
70
80
90
0 20 40 60 80
% D
rug
Re
leas
e
Time / mins
Microwave heated with water Conventional heated with water
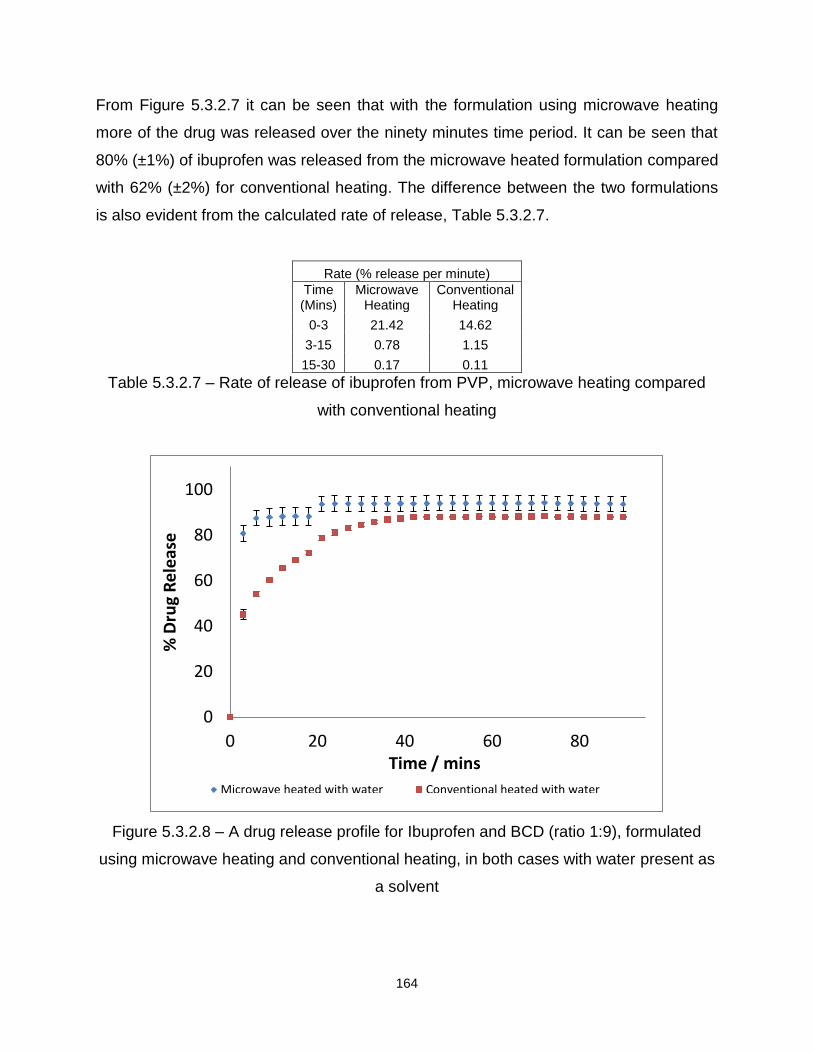
164
From Figure 5.3.2.7 it can be seen that with the formulation using microwave heating
more of the drug was released over the ninety minutes time period. It can be seen that
80% (±1%) of ibuprofen was released from the microwave heated formulation compared
with 62% (±2%) for conventional heating. The difference between the two formulations
is also evident from the calculated rate of release, Table 5.3.2.7.
Rate (% release per minute)
Time (Mins)
Microwave Heating
Conventional Heating
0-3 21.42 14.62
3-15 0.78 1.15
15-30 0.17 0.11
Table 5.3.2.7 – Rate of release of ibuprofen from PVP, microwave heating compared
with conventional heating
Figure 5.3.2.8 – A drug release profile for Ibuprofen and BCD (ratio 1:9), formulated
using microwave heating and conventional heating, in both cases with water present as
a solvent
0
20
40
60
80
100
0 20 40 60 80
% D
rug
Re
leas
e
Time / mins
Microwave heated with water Conventional heated with water

165
From Figure 5.3.2.8 it can be seen that microwave heating not only released more of
the drug over the time period, but the maximum amount was achieved at a faster rate.
For the microwave heated formulation in the first twenty minutes 90% (±3%) of the drug
was released compared with 79% (±1%). However, towards the end of the analysis, the
profiles began to level with the microwave formulation releasing 94% (±3%) compared
with 79% (±1%) for conventional. This finding is also reflected in the rate of release of
ibuprofen, Table 5.3.2.8.
Rate (% release per minute)
Time (Mins)
Microwave Heating
Conventional Heating
0-3 26.89 15.01
3-15 0.53 1.99
15-30 0.42 1.07
Table 5.3.2.8 – Rate of release of ibuprofen from PVP, microwave heating compared
with conventional heating
To determine why these differences occurred, the way the two different methods heat
the formulations must be considered. Firstly conventional heating is a slower method of
heating which works over a temperature gradient, and may illustrate uneven heating
(Section 1.5.1 Conventional heating). Microwave heating is rapid and by directly
interacting with the drug and excipient molecules (causing them to flip in alignment with
the wave of energy, generating heat) no temperature gradient may be observed
(Section 1.5.2 microwave heating). As a result a more homogenous formulation may be
evident, and consequently illustrate an improved dissolution.
Table 5.3.2.9 illustrates all the results obtained for ibuprofen and the four different
excipients prepared using microwave and conventional heating. In some cases no
differences occurred, which is illustrated by the statement of ‘no difference’ in the table.
When microwave heating showed a higher percentage drug release this is illustrated by
the statement ‘MW’ in the table. When conventional heating illustrated a higher
percentage drug release this is indicated by the statement ‘CN’ in the table.

166
Drug/Excipient
With water Differences between MW/CN
Without water Differences between
MW/CN
Ibuprofen/SA 1:3 CN MW
Ibuprofen/BCD 1:1 No Difference CN
Ibuprofen/BCD 1:9 MW MW
Ibuprofen/PVP 1:1 MW No Difference
Ibuprofen/PVP 1:9 MW MW
Ibuprofen/2HPBCD 1:1 N/A MW
Ibuprofen/2HPBCD 1:9 N/A MW
Table 5.3.2.9 –A summary to indicate conditions that created the greatest drug
release for ibuprofen and the different excipients analysed for differences between
microwave and conventional heating over a ninety minute time period.
5.3.3 Excipients
Formulation method parameters, such as the heating method and presence of
solvent, are not the only factors that affect drug release, excipient selection can also
play a vital role. In particular, it was found that the excipient which released the greatest
amount of ibuprofen (formulated in the presence of water) was BCD in the 1:1 ratio
using both heating methods. Whilst the excipient that released the smallest amount of
ibuprofen (formulated using conventional heating in the presence of water) was PVP in
the 1:9 ratio.
When water was not used in the formulation process, the excipient that released
the greatest amount of ibuprofen was BCD in the 1:9 ratio (formulated using both
heating methods). The excipient that slowed the release of ibuprofen most dramatically
was 2HPBCD in the 1:9 ratio (formulated using conventional heating).
In summary, based on these results, if formulating ibuprofen to enhance drug
release it would be advisable to use BCD either with or without water present using
either heating method.
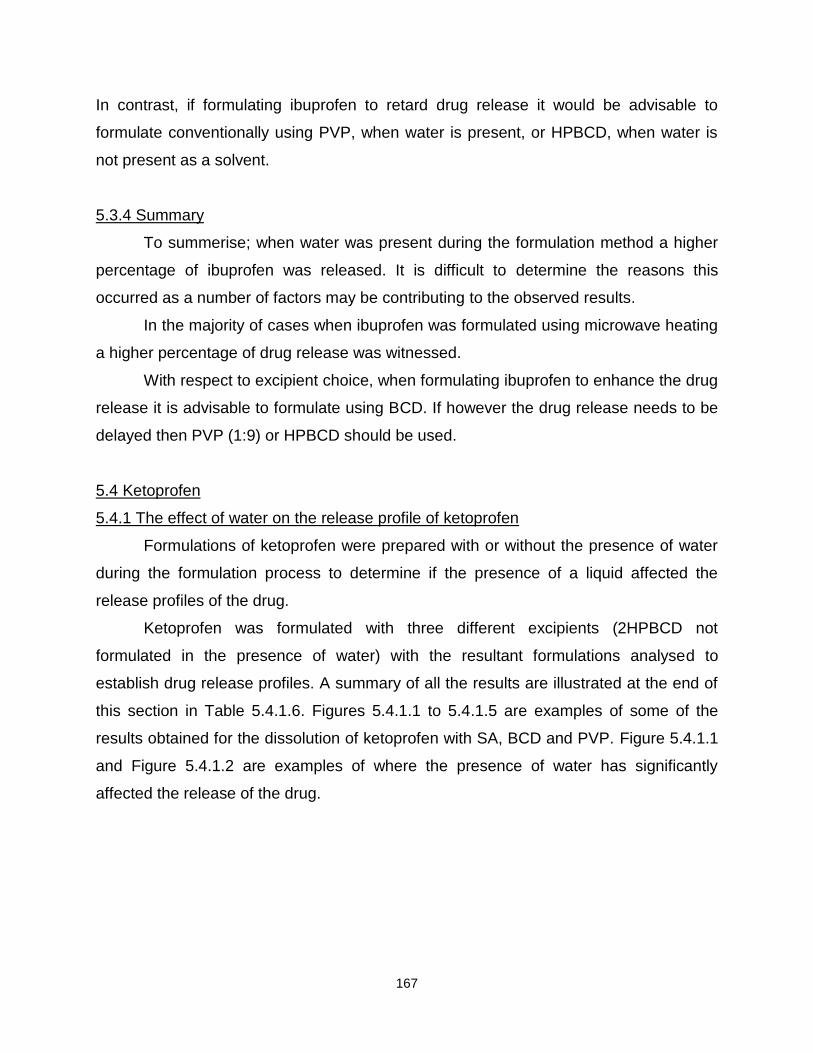
167
In contrast, if formulating ibuprofen to retard drug release it would be advisable to
formulate conventionally using PVP, when water is present, or HPBCD, when water is
not present as a solvent.
5.3.4 Summary
To summerise; when water was present during the formulation method a higher
percentage of ibuprofen was released. It is difficult to determine the reasons this
occurred as a number of factors may be contributing to the observed results.
In the majority of cases when ibuprofen was formulated using microwave heating
a higher percentage of drug release was witnessed.
With respect to excipient choice, when formulating ibuprofen to enhance the drug
release it is advisable to formulate using BCD. If however the drug release needs to be
delayed then PVP (1:9) or HPBCD should be used.
5.4 Ketoprofen
5.4.1 The effect of water on the release profile of ketoprofen
Formulations of ketoprofen were prepared with or without the presence of water
during the formulation process to determine if the presence of a liquid affected the
release profiles of the drug.
Ketoprofen was formulated with three different excipients (2HPBCD not
formulated in the presence of water) with the resultant formulations analysed to
establish drug release profiles. A summary of all the results are illustrated at the end of
this section in Table 5.4.1.6. Figures 5.4.1.1 to 5.4.1.5 are examples of some of the
results obtained for the dissolution of ketoprofen with SA, BCD and PVP. Figure 5.4.1.1
and Figure 5.4.1.2 are examples of where the presence of water has significantly
affected the release of the drug.

168
Figure 5.4.1.1 – A drug release profile for ketoprofen and SA (ratio 1:3), formulated
using microwave heating both with and without the presence of water during the
formulation process
Figure 5.4.1.1 is an illustration of ketoprofen and SA formulated using microwave
heating. It can be seen from the graph that the presence of water has decreased the
release of the drug. After fifteen minutes the formulation prepared with water only
released 20% (±1%) compared with 50% (±1%). After the ninety minutes the
formulation prepared with water released 47% (±2%) compared with 88% (±1%).
The result visually seen in Figure 5.4.1.1 is also reflected in the rate, Table
5.4.1.1.
Rate (% release per minute)
Time (Mins) MW With MW Without
0-3 1.33 8.88
3-15 1.51 1.92
15-30 0.62 0.69
Table 5.4.1.1 Rate of release of ketoprofen from SA, when prepared with or without the
presence of water during microwave formulation
0
20
40
60
80
100
0 20 40 60 80
% D
rug
Re
leas
e
Time / mins
Microwave heated with water Microwave heated without water

169
Figure 5.4.1.2 – A drug release profile for ketoprofen and SA (ratio 1:3), formulated
using conventional heating both with and without the presence of water during the
formulation process
Figure 5.4.1.2 displays that the formulation prepared without water has released a
higher percentage of the drug. The formulation prepared without water released 41%
(±1%) compared with 38 (±1%), and after the ninety minutes 66% (±5%) of the drug was
released from the formulation prepared without water compared with 59% (±1%). The
results obtained in Figure 5.4.1.2 are also illustrated by the rate, Table 5.4.1.2. For the
first fifteen minutes of the dissolution the formulation without water released ketoprofen
at a faster rate, which would explain why more of the drug is detected in solution from
the formulation prepared without water.
0
10
20
30
40
50
60
70
80
0 20 40 60 80
% D
rug
Re
leas
e
Time / mins
Conventional heated with water Conventional heated without water
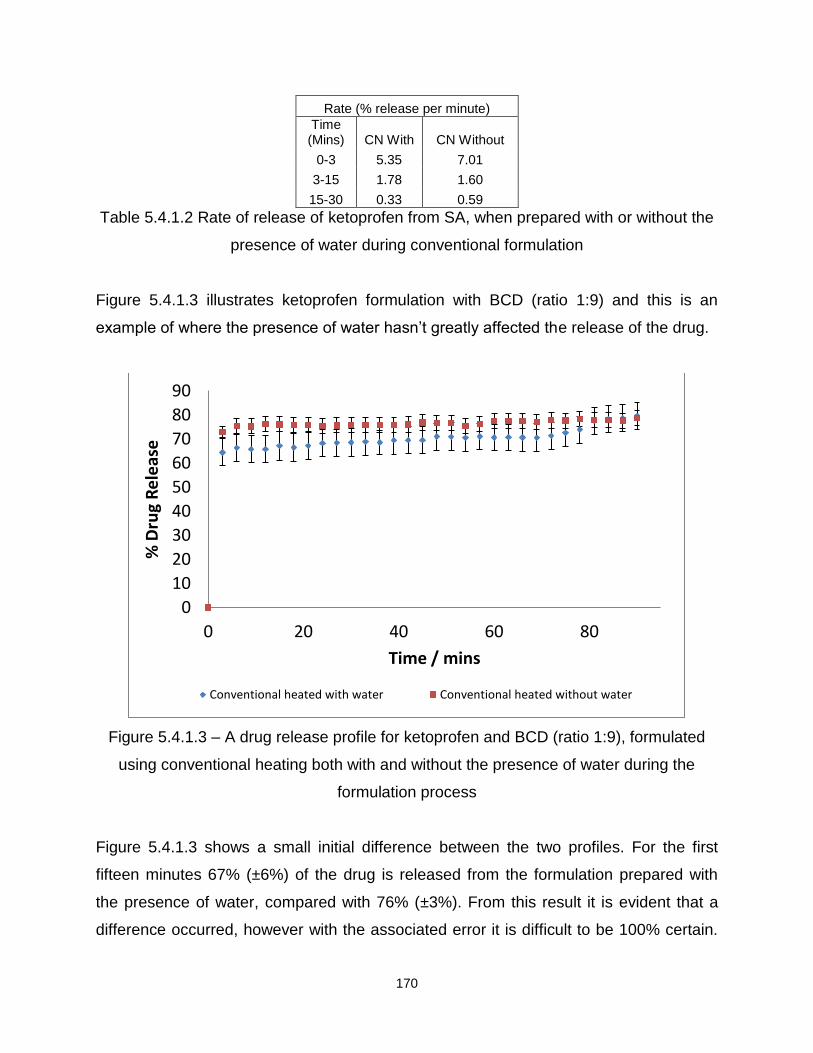
170
Rate (% release per minute)
Time (Mins) CN With CN Without
0-3 5.35 7.01
3-15 1.78 1.60
15-30 0.33 0.59
Table 5.4.1.2 Rate of release of ketoprofen from SA, when prepared with or without the
presence of water during conventional formulation
Figure 5.4.1.3 illustrates ketoprofen formulation with BCD (ratio 1:9) and this is an
example of where the presence of water hasn’t greatly affected the release of the drug.
Figure 5.4.1.3 – A drug release profile for ketoprofen and BCD (ratio 1:9), formulated
using conventional heating both with and without the presence of water during the
formulation process
Figure 5.4.1.3 shows a small initial difference between the two profiles. For the first
fifteen minutes 67% (±6%) of the drug is released from the formulation prepared with
the presence of water, compared with 76% (±3%). From this result it is evident that a
difference occurred, however with the associated error it is difficult to be 100% certain.
0
10
20
30
40
50
60
70
80
90
0 20 40 60 80
% D
rug
Re
leas
e
Time / mins
Conventional heated with water Conventional heated without water

171
Also after this initial time period, the release profiles become very similar, with 80%
(±6%) compared with 79% (±3%) of the drug released in total. This is also seen when
the rate is calculated, Table 5.4.1.3.
Rate (% release per minute)
Time (Mins) CN With CN Without
0-3 21.49 24.28
3-15 0.16 0.25
15-30 0.14 -0.02
Table 5.4.1.3 Rate of release of ketoprofen from BCD, 1:9 when prepared with or
without the presence of water during conventional formulation
Figures 5.4.1.3 to 5.4.1.5 illustrate formulations where water shows a higher percentage
drug release.
Figure 5.4.1.4 – A drug release profile for ketoprofen and BCD (ratio 1:1), formulated
using microwave heating both with and without the presence of water during the
formulation process
0
20
40
60
80
100
0 20 40 60 80
% D
rug
Re
leas
e
Time / mins
Microwave heated with water Microwave heated without water

172
Figure 5.4.1.3 illustrates the release profile for ketoprofen and BCD, (ratio 1:1). It is
evident that the presence of water has increased the percentage drug release. For the
formulation prepared with water a drug release of 88% (±8%) is seen, and this is
compared with 80% (±2%) for the formulation prepared without water. From these
results it is evident that the initial part of the dissolution is similar, however, after this
time period a separation between the release profiles occurs. After the ninety minutes a
drug release of 90% (±9%) is seen for the formulation with water which is compared
with 75% (±2%). This result is also demonstrated in the rate, Table 5.4.1.4.
Rate (% release per minute)
Time (Mins) MW With MW Without
0-3 21.72 22.83
3-15 1.68 0.79
15-30 0.01 -0.10
Table 5.4.1.4 Rate of release of ketoprofen from BCD, 1:1 when prepared with or
without the presence of water during microwave formulation
Figure 5.4.1.5 – A drug release profile for ketoprofen and BCD (ratio 1:9), formulated
using microwave heating both with and without the presence of water during the
formulation process
0
20
40
60
80
100
0 20 40 60 80
% D
rug
Re
leas
e
Time / mins Microwave heated with water Microwave heated without water

173
Figure 5.4.1.5 displays ketoprofen and BCD 1:1 ratio formulated using microwave
heating. It can be seen from the release profiles that the presence of water has had a
significant effect to the way the drug is released. After the first fifteen minutes of the
dissolution 90% (±6%) of ketoprofen is released which is compared with 69% (±7%),
and after the ninety minutes 100% (±6%) of ketoprofen is released when water is
present, compared with 70% (±7%). The difference in the release profiles was also
illustrated in the rate calculation, Table 5.4.1.5. For the initial three minutes of the
dissolution the formulation prepared without water present illustrates a faster drug
release, 20.83% per minute compared with 16.2%. However after this time period both
rates drop but the formulation prepared with water has a higher rate of release which
continues over thirty minutes and consequently more ketoprofen is released.
Rate (% release per minute)
Time (Mins) MW With MW Without
0-3 16.21 20.83
3-15 2.83 0.49
15-30 0.35 -0.11
Table 5.4.1.5 Rate of release of ketoprofen from BCD, 1:9 when prepared with or
without the presence of water during microwave formulation
The above results illustrate the different formulations and how the presence of water
during formulation has affected the percentage drug release. Some formulations (SA
and BCD 1:1) illustrate that when water is present during the formulation process, a
decrease in the percentage drug release is demonstrated. However in the majority of
cases, when water is present during the formulation process a higher percentage drug
release is apparent.

174
Table 5.4.1.6 illustrates all the results obtained for ketoprofen and the four different
excipients. In some cases no differences occurred, which is illustrated by the statement
of ‘no difference’ in the table. When formulation with water resulted in a higher
percentage drug release this is illustrated by the statement ‘with’ in the table, and
conversely, when formulation without water resulted in a higher percentage drug
release it is identified as ‘without’. For ketoprofen and 2HPBCD no comparison could
be made between formulations prepared with and without water, as this was only
prepared without water, and this is consequently illustrated by the statement ‘N/A’.
Drug/Excipient MW CN
With/Without With/Without
Ketoprofen/SA 1:3 Without No Difference
Ketoprofen/BCD 1:1 With With
Ketoprofen/BCD 1:9 With No Difference
Ketoprofen/PVP 1:1 With With
Ketoprofen/PVP 1:9 With With
Ketoprofen/2HPBCD 1:1 N/A N/A
Ketoprofen/2HPBCD 1:9 N/A N/A
Table 5.4.1.6- A summary to indicate conditions that created the greatest drug
release for ketoprofen with the four different excipients formulated with and without the
presence of water over a ninety minute time period
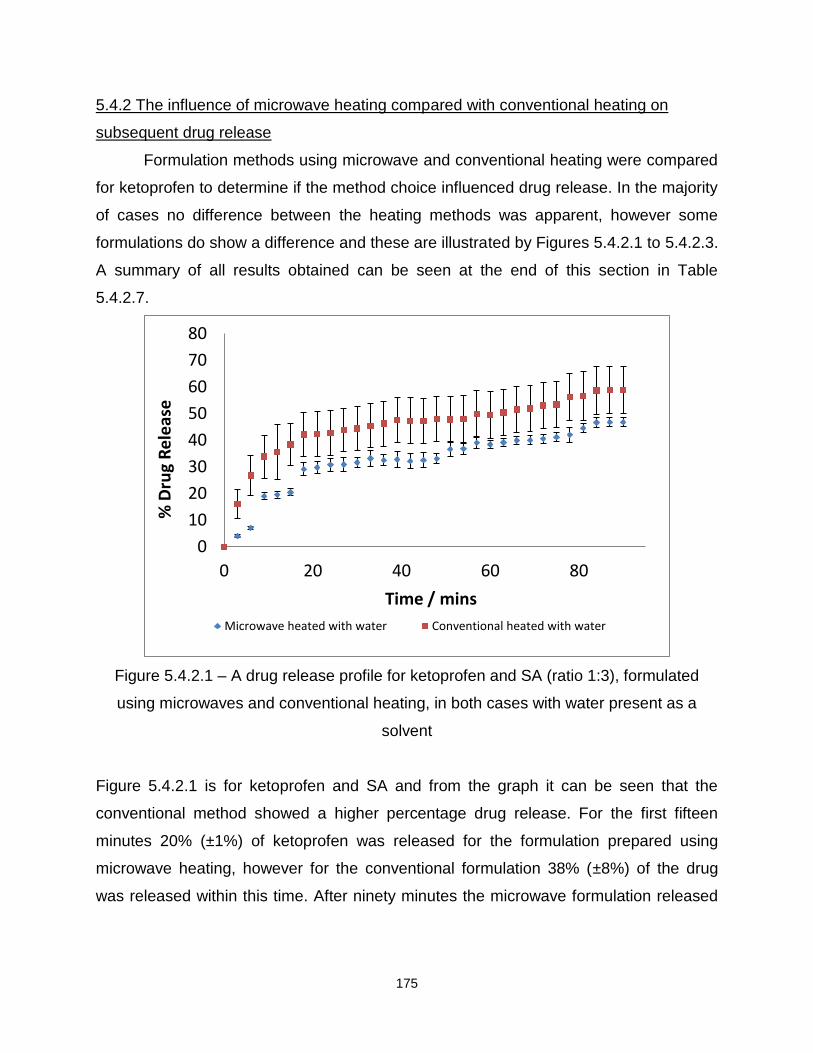
175
5.4.2 The influence of microwave heating compared with conventional heating on
subsequent drug release
Formulation methods using microwave and conventional heating were compared
for ketoprofen to determine if the method choice influenced drug release. In the majority
of cases no difference between the heating methods was apparent, however some
formulations do show a difference and these are illustrated by Figures 5.4.2.1 to 5.4.2.3.
A summary of all results obtained can be seen at the end of this section in Table
5.4.2.7.
Figure 5.4.2.1 – A drug release profile for ketoprofen and SA (ratio 1:3), formulated
using microwaves and conventional heating, in both cases with water present as a
solvent
Figure 5.4.2.1 is for ketoprofen and SA and from the graph it can be seen that the
conventional method showed a higher percentage drug release. For the first fifteen
minutes 20% (±1%) of ketoprofen was released for the formulation prepared using
microwave heating, however for the conventional formulation 38% (±8%) of the drug
was released within this time. After ninety minutes the microwave formulation released
0
10
20
30
40
50
60
70
80
0 20 40 60 80
% D
rug
Re
leas
e
Time / mins
Microwave heated with water Conventional heated with water

176
47% (±2%) compared with 59% (±9%). This is also reflected in the rate of release,
Table 5.4.2.1.
Rate (% release per minute)
Time (Mins)
Microwave heating
Conventional Heating
0-3 1.33 5.34
3-15 1.51 1.78
15-30 0.59 0.34
Table 5.4.2.1- Rate of release of ketoprofen from SA, microwave heating compared with
conventional heating
Figure 5.4.2.2 – A drug release profile for ketoprofen and SA (ratio 1:3), formulated
using microwaves and conventional heating, in both cases without water present as a
solvent
Figure 5.4.2.2 illustrates a formulation where microwave heating achieved a higher
percentage drug release when compared with conventional heating. For the first fifteen
minutes 50% (±3%) of ketoprofen was released from the formulation prepared using
microwave heating compared with 41% (±1%) for the conventional formulation. After
ninety minutes 88% (±1%) of the drug was released for the microwave formulation, and
0
20
40
60
80
100
0 20 40 60 80
% D
rug
Re
leas
e
Time / mins
Microwave heated without water Conventional heated without water

177
only 66% (±5%) of ketoprofen was released for the conventional method. This result is
also demonstrated in the rate, with the microwave formulation showing a faster rate of
release of ketoprofen illustrated in Table 5.4.2.2.
Rate (% release per minute)
Time (Mins)
Microwave Heating
Conventional Heating
0-3 8.88 7.01
3-15 1.92 1.60
15-30 0.69 0.59
Table 5.4.2.2- Rate of release of ketoprofen from SA, microwave heating compared with
conventional heating
Figure 5.4.2.3 – A drug release profile for ketoprofen and BCD (ratio 1:9), formulated
using microwaves and conventional heating, in both cases with water present as a
solvent
Figure 5.4.2.3 illustrates ketoprofen and BCD, 1:9 and it can be seen from the two
release profiles that the formulation prepared using microwaves released a higher
percentage of the drug. After fifteen minutes 90% (±6%) of the drug is released from the
formulation prepared using microwave heating which is in comparison with 67% (±6%).
0
20
40
60
80
100
0 20 40 60 80
% D
rug
Re
leas
e
Time / mins Microwave heated with water Conventional heated with water

178
After ninety minutes over 100% (±6%) of ketoprofen is released from the microwave
formulation compared with 80% (±6%), this is also illustrated in the rate, Table 5.4.2.3.
Rate (% release per minute)
Time (Mins)
Microwave Heating
Conventional Heating
0-3 16.21 21.49
3-15 2.83 0.16
15-30 0.35 0.14
Table 5.4.2.3- Rate of release of ketoprofen from BCD 1:9, microwave heating
compared with conventional heating
The previous graphs have illustrated where the choice of heating method has made a
significant difference to the release of ketoprofen. However in the majority of cases the
choice of heating method doesn’t have an overall affect on the release of ketoprofen. A
few examples are illustrated in Figures 5.4.2.4 – 5.4.2.6.
Figure 5.4.2.4 – A drug release profile for ketoprofen and 2HPBCD (ratio 1:9),
formulated using microwaves and conventional heating, in both cases without water
present as a solvent
0
10
20
30
40
50
60
70
80
0 20 40 60 80
% D
rug
Re
leas
e
Time / mins Microwave heated without water Conventional heated without water

179
Figure 5.4.2.4 displays the release profiles for ketoprofen and 2HPBCD formulated
using microwaves and conventional heating. After the experimental error was calculated
it can be said that no significant difference occurred between the two heating methods.
However, after analysis of the percentage drug release, it may be possible to speculate
that a slight difference does exist. For the first fifteen minutes 53% (±5%) of ketoprofen
was released from the microwave formulation which is compared with 58% (±8%). After
the ninety minutes 54% (±6%) of the drug was released from the microwave formulation
compared with 62% (±8%). However because of the error associated with these results
it is difficult to be completely sure whether a significant difference does occur. Upon
calculation of the rate, a difference can be seen between the two heating methods, but
again the experimental error makes it difficult to be definitive.
Rate (% release per minute)
Time (Mins)
Microwave Heating
Conventional Heating
0-3 16.04 18.98
3-15 0.31 0.07
15-30 -0.15 -0.01
Table 5.4.2.4- Rate of release of ketoprofen from 2HPBCD 1:9, microwave heating
compared with conventional heating
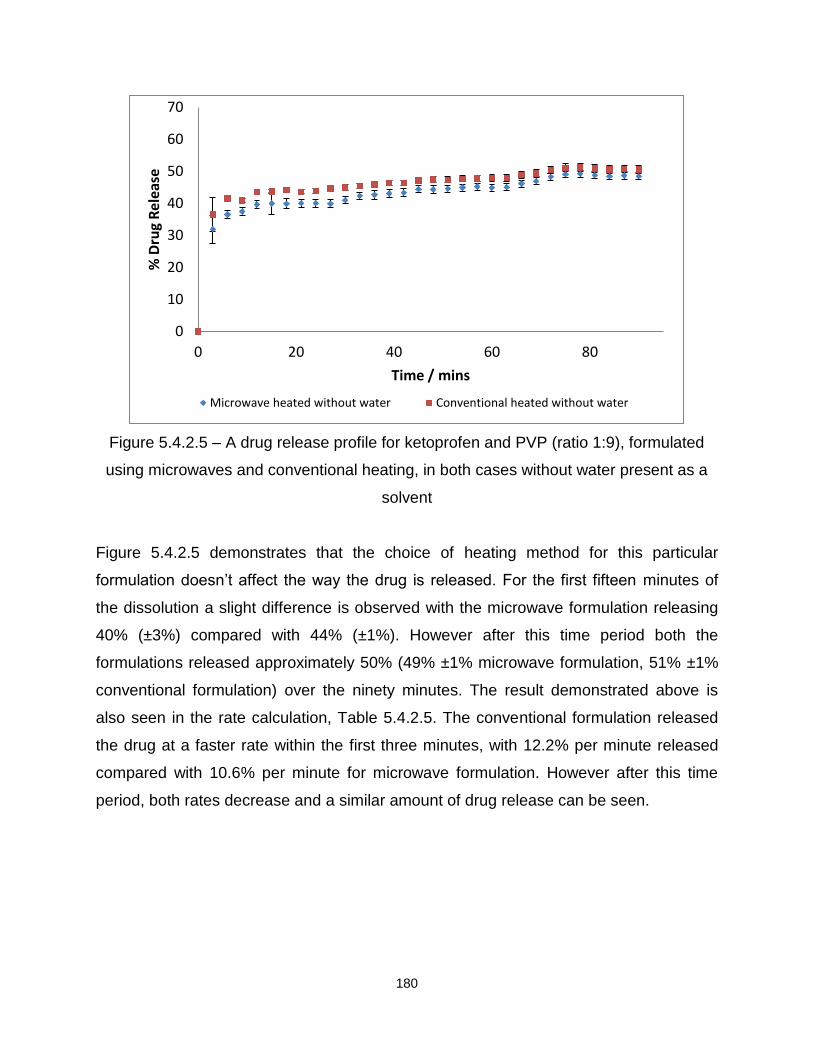
180
Figure 5.4.2.5 – A drug release profile for ketoprofen and PVP (ratio 1:9), formulated
using microwaves and conventional heating, in both cases without water present as a
solvent
Figure 5.4.2.5 demonstrates that the choice of heating method for this particular
formulation doesn’t affect the way the drug is released. For the first fifteen minutes of
the dissolution a slight difference is observed with the microwave formulation releasing
40% (±3%) compared with 44% (±1%). However after this time period both the
formulations released approximately 50% (49% ±1% microwave formulation, 51% ±1%
conventional formulation) over the ninety minutes. The result demonstrated above is
also seen in the rate calculation, Table 5.4.2.5. The conventional formulation released
the drug at a faster rate within the first three minutes, with 12.2% per minute released
compared with 10.6% per minute for microwave formulation. However after this time
period, both rates decrease and a similar amount of drug release can be seen.
0
10
20
30
40
50
60
70
0 20 40 60 80
% D
rug
Rel
ease
Time / mins
Microwave heated without water Conventional heated without water
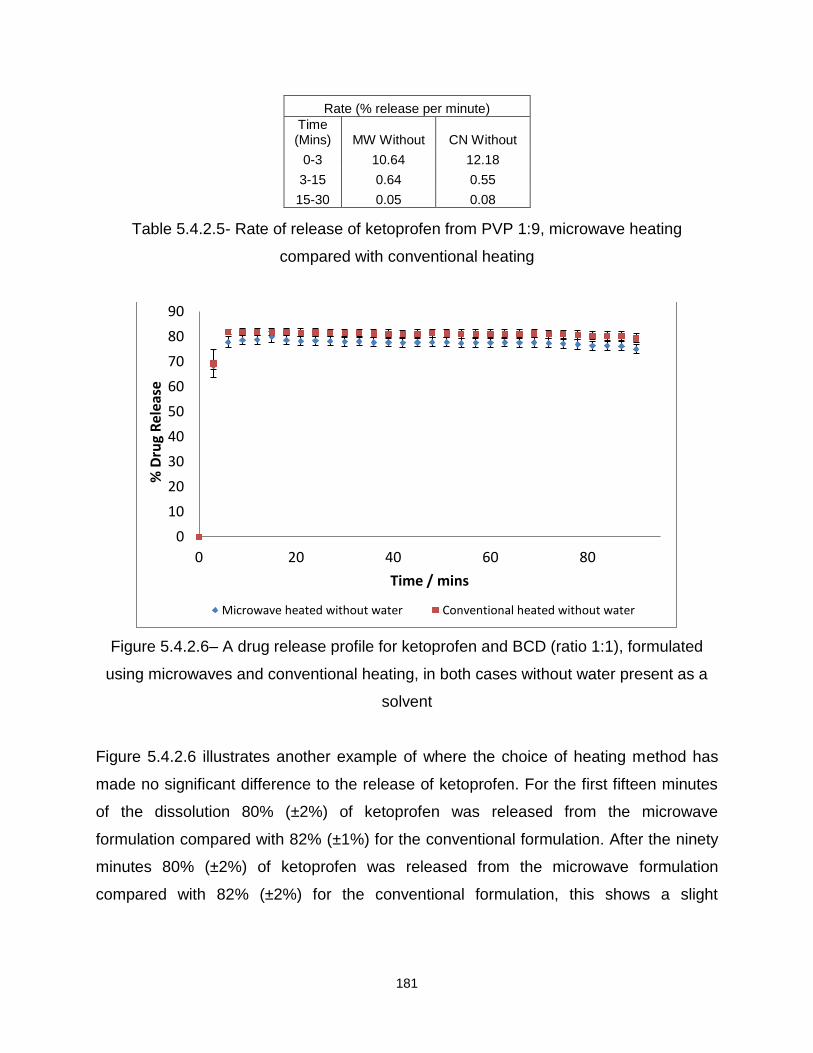
181
Rate (% release per minute)
Time (Mins) MW Without CN Without
0-3 10.64 12.18
3-15 0.64 0.55
15-30 0.05 0.08
Table 5.4.2.5- Rate of release of ketoprofen from PVP 1:9, microwave heating
compared with conventional heating
Figure 5.4.2.6– A drug release profile for ketoprofen and BCD (ratio 1:1), formulated
using microwaves and conventional heating, in both cases without water present as a
solvent
Figure 5.4.2.6 illustrates another example of where the choice of heating method has
made no significant difference to the release of ketoprofen. For the first fifteen minutes
of the dissolution 80% (±2%) of ketoprofen was released from the microwave
formulation compared with 82% (±1%) for the conventional formulation. After the ninety
minutes 80% (±2%) of ketoprofen was released from the microwave formulation
compared with 82% (±2%) for the conventional formulation, this shows a slight
0
10
20
30
40
50
60
70
80
90
0 20 40 60 80
% D
rug
Rel
ease
Time / mins
Microwave heated without water Conventional heated without water

182
difference between the two formulations but nothing significant. Upon calculation of the
rate it can also been seen that both formulations release ketoprofen at the same rate.
Rate (% release per minute)
Time (Mins) MW Without CN Without
0-3 22.83 23.09
3-15 0.79 0.83
15-30 -0.10 -0.03
Table 5.4.2.6- Rate of release of ketoprofen from BCD 1:1, microwave heating
compared with conventional heating
All the formulations illustrated in this section are examples of ketoprofen with the four
different excipients. It can be seen that in the majority of cases the choice of heating
method doesn’t affect the way ketoprofen is released. However there are a few
exceptions which are also illustrated. Table 5.4.2.7 summarises all the different
ketoprofen formulations prepared using microwaves or conventional heating. In some
cases no differences occurred, which is illustrated by the statement of ‘no difference’ in
the table. When microwave heating showed a higher percentage drug release this is
illustrated by the statement ‘MW’ in the table. When conventional heating released a
higher percentage of the drug this is illustrated by ‘CN’ in the table. For ketoprofen and
2HPBCD only the formulation prepared without water present could be analysed for any
differences between the two heating methods, consequently N/A is seen for this
formulation prepared with water present during formulation.
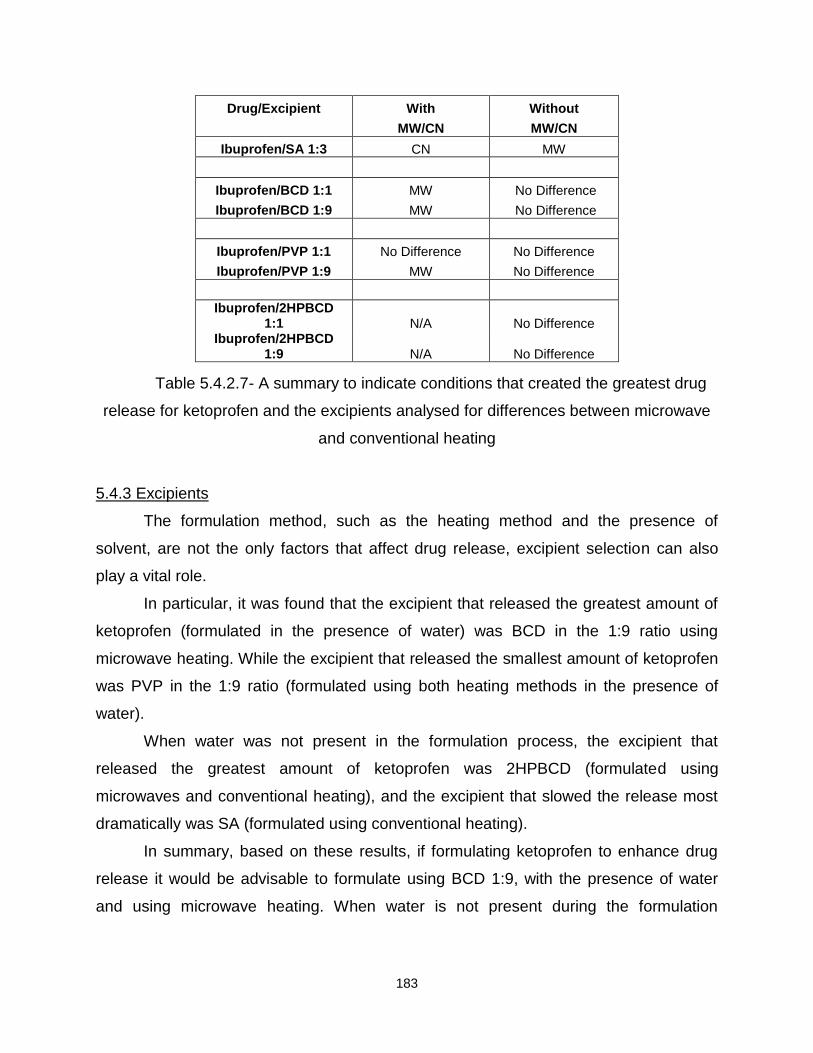
183
Drug/Excipient With Without
MW/CN MW/CN
Ibuprofen/SA 1:3 CN MW
Ibuprofen/BCD 1:1 MW No Difference
Ibuprofen/BCD 1:9 MW No Difference
Ibuprofen/PVP 1:1 No Difference No Difference
Ibuprofen/PVP 1:9 MW No Difference
Ibuprofen/2HPBCD 1:1 N/A No Difference
Ibuprofen/2HPBCD 1:9 N/A No Difference
Table 5.4.2.7- A summary to indicate conditions that created the greatest drug
release for ketoprofen and the excipients analysed for differences between microwave
and conventional heating
5.4.3 Excipients
The formulation method, such as the heating method and the presence of
solvent, are not the only factors that affect drug release, excipient selection can also
play a vital role.
In particular, it was found that the excipient that released the greatest amount of
ketoprofen (formulated in the presence of water) was BCD in the 1:9 ratio using
microwave heating. While the excipient that released the smallest amount of ketoprofen
was PVP in the 1:9 ratio (formulated using both heating methods in the presence of
water).
When water was not present in the formulation process, the excipient that
released the greatest amount of ketoprofen was 2HPBCD (formulated using
microwaves and conventional heating), and the excipient that slowed the release most
dramatically was SA (formulated using conventional heating).
In summary, based on these results, if formulating ketoprofen to enhance drug
release it would be advisable to formulate using BCD 1:9, with the presence of water
and using microwave heating. When water is not present during the formulation
184
process, it would be advisable to formulate using 2HPBCD (formulated with microwaves
or conventional heating) to enhance drug release.
In contrast, if formulating ketoprofen to retard drug release it would be advisable
to formulate using conventionally heated PVP in the 1:9 ratio (formulated in the
presence of water). When water is not present during the formulation process, it would
be advisable to formulate using SA (formulated using microwaves and conventional
heating).
5.4.4 Summary
To summarise, when water was present during the formulation method, a higher
percentage of ketoprofen was released. It is difficult to determine the reasons why this
occurred, as a number of factors may be contributing to the observed results. When the
two different heating methods were compared, it was noted that no significant difference
was seen in the majority of cases. However there were some exceptions to that result.
With respect to the excipient choice, when formulating ketoprofen to enhance
drug release it is advisable to formulate using BCD or 2HPBCD. If however the drug
release needs to be delayed then PVP (1:9) or SA should be used.
5.5 Flurbiprofen
After an investigation into flurbiprofen and the different excipients began, it
became evident that a problem was occurring with the absorbance for the drug in
formulations based on BCD and 2HPBCD. Upon comparison of the Beer-Lambert plot
for pure flurbiprofen it was noted that the formulations were illustrating a higher
absorbance and consequently a possible shift may have occurred15. As a result it was
difficult to measure and report the percentage drug release, a trend only witnessed with
flurbiprofen and the two excipients. It is difficult to determine why this has occurred and
only in this case. However a possibility, is that flurbiprofen has fluorine group attached
which the other drugs do not possess. This therefore may be affecting the way the drug
and excipients interact. Consequently, flurbiprofen was formulated with SA and PVP
only and the results are illustrated below.

185
5.5.1 The effect of water on the release profile of flurbiprofen
It was decided to incorporate water into the formulation process to determine
how the presence of a liquid affected the release profiles of a drug with poor aqueous
solubility. Flurbiprofen was formulated with two excipients with the resultant formulations
analysed to establish drug release profiles. A summary of all results are illustrated at the
end of this section in Table 5.5.1.6. Figures 5.5.1.1 to 5.5.1.5 are examples of some of
the results obtained from the dissolution of flurbiprofen with SA and PVP.
Figure 5.5.1.1 – A drug release profile for flurbiprofen and SA (ratio 1:3), formulated
using conventional heating both with and without the presence of water during the
formulation process
Figure 5.5.1.1 displays the release profile for flurbiprofen formulated with SA using
conventional heating with and without the presence of water. It is apparent from the
graph that there is no significant difference between the two formulations, therefore it
can be said that the presence of water has made no difference to the release of
flurbiprofen from SA. For the first fifteen minutes of the dissolution the formulation
prepared with water released 42% (±7%) compared with 36% (±5%), this shows a
possible difference during the early stages of the dissolution. However after the ninety
0
10
20
30
40
50
60
70
0 20 40 60 80
% D
rug
Re
leas
e
Time / mins
Conventional heated with water Conventional heated without water

186
minutes 55% (±6%) of flurbiprofen was released from the formulation prepared with
water compared with 56% (±5%) for the formulation prepared without water. This trend
is also shown when the rate was calculated, Table 5.5.1.1. It can be seen that the
formulation prepared with water releases flurbiprofen at a slightly higher rate of 8.95%
per minute compared with 6.01% per minute for the formulation prepared without water.
Rate (% release per minute)
Time (Mins) CN With CN Without
0-3 8.95 6.01
3-15 1.23 1.43
15-30 0.26 0.59
Table 5.5.1.1 Rate of release of flurbiprofen from SA when prepared with or without the
presence of water during formulation
Figure 5.5.1.2 – A drug release profile for flurbiprofen and SA (ratio 1:3), formulated
using microwave heating both with and without the presence of water during the
formulation process
0
10
20
30
40
50
60
70
0 20 40 60 80
% D
rug
Rel
ease
Time / mins
Microwave heated with water Microwave heated without water

187
Figure 5.5.1.2 displays no overall difference in total drug release, with 45% (±1%) of
flurbiprofen released when water is present during the formulation process. This is in
comparison with 44% (±6%) for the formulation prepared without water present. After
ninety minutes, both formulation release 58% (with water 58% ±1% and without water
58% ±3%). Upon calculation of the rate, Table 5.5.1.2, it appears that the formulation
prepared with water may release a slightly higher percentage of flurbiprofen, 9.64% per
minute compared with 7.07%. However after this time period both rates decrease and
the same amount of the drug is released.
Rate (% release per minute)
Time (Mins) MW With MW Without
0-3 9.64 7.07
3-15 1.28 1.81
15-30 0.37 0.64
Table 5.5.1.2 Rate of release of flurbiprofen from SA when prepared with or without the
presence of water during formulation
Figure 5.5.1.3 – A drug release profile for flurbiprofen and PVP (ratio 1:1), formulated
using microwave heating both with and without the presence of water during the
formulation process
0
20
40
60
80
100
0 20 40 60 80
% D
rug
Rel
ease
Time / mins Microwave heated with water Microwave heated without water
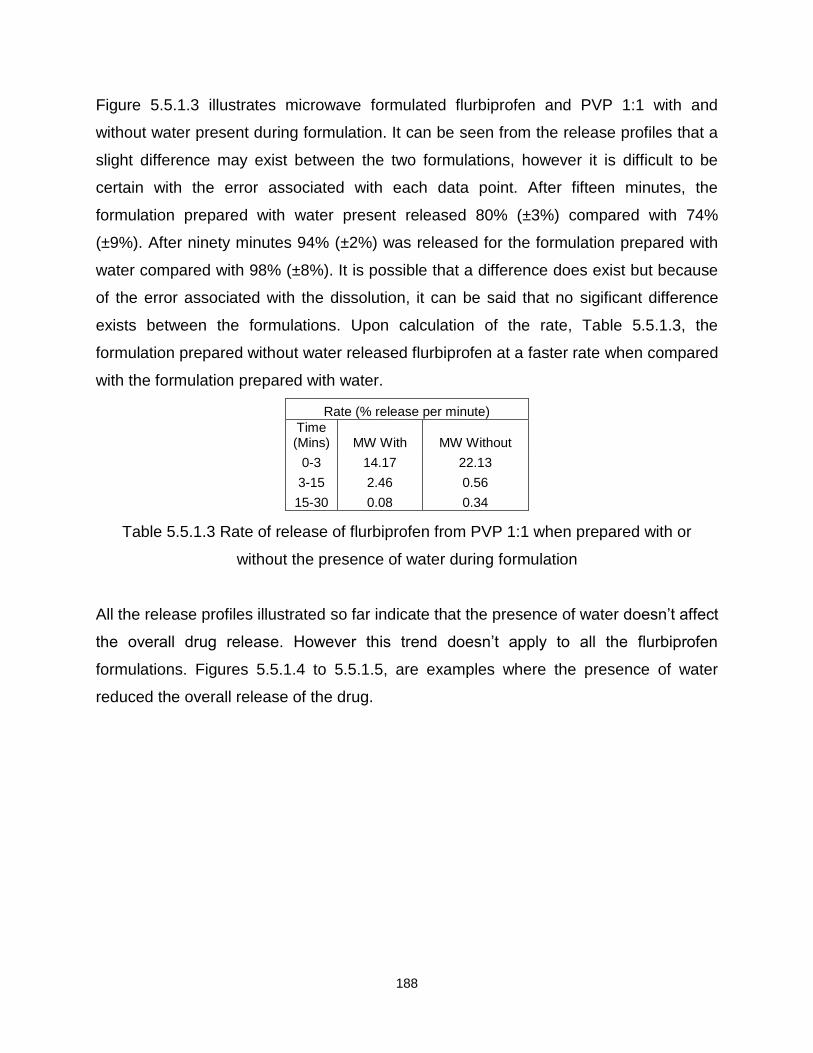
188
Figure 5.5.1.3 illustrates microwave formulated flurbiprofen and PVP 1:1 with and
without water present during formulation. It can be seen from the release profiles that a
slight difference may exist between the two formulations, however it is difficult to be
certain with the error associated with each data point. After fifteen minutes, the
formulation prepared with water present released 80% (±3%) compared with 74%
(±9%). After ninety minutes 94% (±2%) was released for the formulation prepared with
water compared with 98% (±8%). It is possible that a difference does exist but because
of the error associated with the dissolution, it can be said that no sigificant difference
exists between the formulations. Upon calculation of the rate, Table 5.5.1.3, the
formulation prepared without water released flurbiprofen at a faster rate when compared
with the formulation prepared with water.
Rate (% release per minute)
Time (Mins) MW With MW Without
0-3 14.17 22.13
3-15 2.46 0.56
15-30 0.08 0.34
Table 5.5.1.3 Rate of release of flurbiprofen from PVP 1:1 when prepared with or
without the presence of water during formulation
All the release profiles illustrated so far indicate that the presence of water doesn’t affect
the overall drug release. However this trend doesn’t apply to all the flurbiprofen
formulations. Figures 5.5.1.4 to 5.5.1.5, are examples where the presence of water
reduced the overall release of the drug.
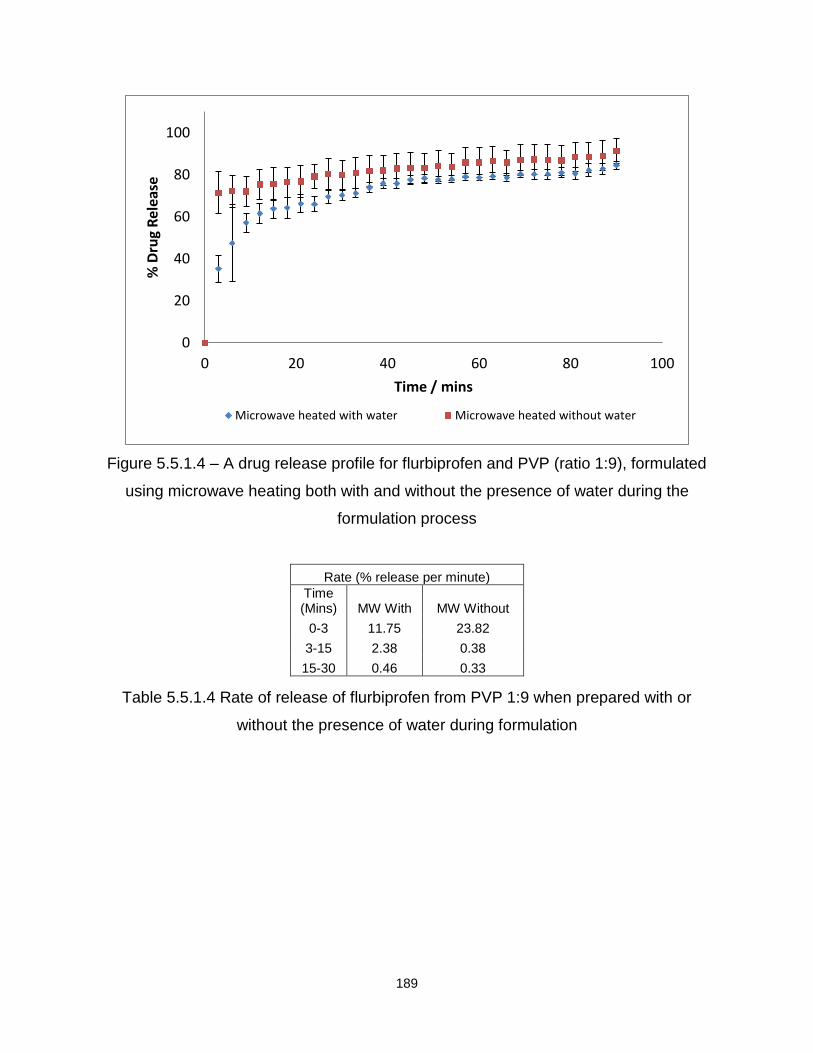
189
Figure 5.5.1.4 – A drug release profile for flurbiprofen and PVP (ratio 1:9), formulated
using microwave heating both with and without the presence of water during the
formulation process
Rate (% release per minute)
Time (Mins) MW With MW Without
0-3 11.75 23.82
3-15 2.38 0.38
15-30 0.46 0.33
Table 5.5.1.4 Rate of release of flurbiprofen from PVP 1:9 when prepared with or
without the presence of water during formulation
0
20
40
60
80
100
0 20 40 60 80 100
% D
rug
Rel
ease
Time / mins
Microwave heated with water Microwave heated without water
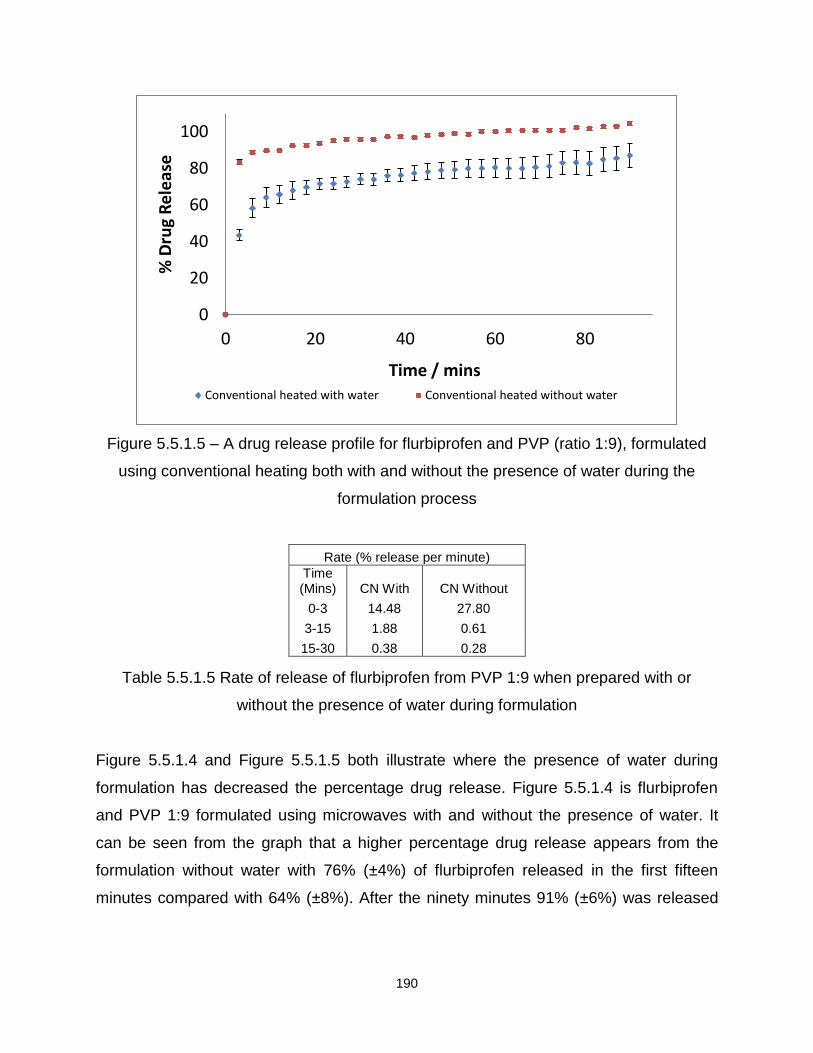
190
Figure 5.5.1.5 – A drug release profile for flurbiprofen and PVP (ratio 1:9), formulated
using conventional heating both with and without the presence of water during the
formulation process
Rate (% release per minute)
Time (Mins) CN With CN Without
0-3 14.48 27.80
3-15 1.88 0.61
15-30 0.38 0.28
Table 5.5.1.5 Rate of release of flurbiprofen from PVP 1:9 when prepared with or
without the presence of water during formulation
Figure 5.5.1.4 and Figure 5.5.1.5 both illustrate where the presence of water during
formulation has decreased the percentage drug release. Figure 5.5.1.4 is flurbiprofen
and PVP 1:9 formulated using microwaves with and without the presence of water. It
can be seen from the graph that a higher percentage drug release appears from the
formulation without water with 76% (±4%) of flurbiprofen released in the first fifteen
minutes compared with 64% (±8%). After the ninety minutes 91% (±6%) was released
0
20
40
60
80
100
0 20 40 60 80
% D
rug
Re
leas
e
Time / mins Conventional heated with water Conventional heated without water

191
for the formulation without water present compared with 85% (±2%). This is also
illustrated in the rate calculation, Table 5.5.1.4.
Figure 5.5.1.5 also illustrates a significant difference between the two
formulations, 68% (±5%) was released from the formulation prepared with water and
92% (±1%) for the formulation prepared without water present during formulation. After
ninety minutes 87% (±7%) was released for the formulation with water compared with
100% (±1%) for the formulation prepared without water. This is also seen in the rate
calculation, Table 5.5.1.5.
Table 5.5.1.6 demonstrates all the results obtained for flurbiprofen and the two different
excipients. In some cases no difference occurred, which is illustrated by the statement
of ‘no difference’ in the table. When the formulation with water resulted in a higher
percentage drug release this is illustrated by the statement ‘with’ in the table, and
conversely, when the formulation without water resulted in a higher release it is
identified as ‘without’.
Drug/Excipient MW CN
With/Without With/Without
Flurbiprofen/SA 1:3 No Difference No Difference
Flurbiprofen/PVP 1:1 No Difference No Difference
Flurbiprofen/PVP 1:9 Without Without
Table 5.5.1.6 – A summary to indicate conditions that created the greatest drug
release for flurbiprofen with the two different excipients formulated with and without the
presence of water over a ninety minute time period
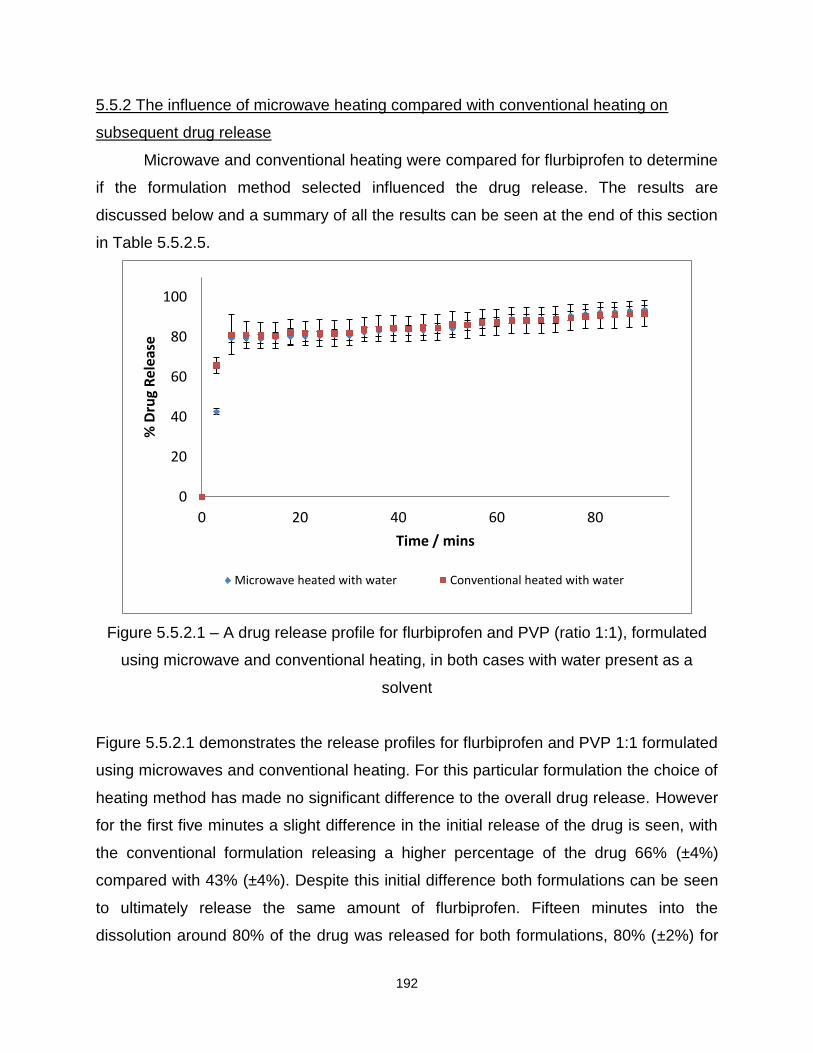
192
5.5.2 The influence of microwave heating compared with conventional heating on
subsequent drug release
Microwave and conventional heating were compared for flurbiprofen to determine
if the formulation method selected influenced the drug release. The results are
discussed below and a summary of all the results can be seen at the end of this section
in Table 5.5.2.5.
Figure 5.5.2.1 – A drug release profile for flurbiprofen and PVP (ratio 1:1), formulated
using microwave and conventional heating, in both cases with water present as a
solvent
Figure 5.5.2.1 demonstrates the release profiles for flurbiprofen and PVP 1:1 formulated
using microwaves and conventional heating. For this particular formulation the choice of
heating method has made no significant difference to the overall drug release. However
for the first five minutes a slight difference in the initial release of the drug is seen, with
the conventional formulation releasing a higher percentage of the drug 66% (±4%)
compared with 43% (±4%). Despite this initial difference both formulations can be seen
to ultimately release the same amount of flurbiprofen. Fifteen minutes into the
dissolution around 80% of the drug was released for both formulations, 80% (±2%) for
0
20
40
60
80
100
0 20 40 60 80
% D
rug
Rel
ease
Time / mins
Microwave heated with water Conventional heated with water

193
conventional heating compared with 81% (±6%). After ninety minutes both formulations
released over 90% of the drug, 94% (±2%) for conventional heating compared with 92%
(±6%). The initial difference in the percentage drug release is also evident from the rate
calculation, Table 5.5.2.1.
Rate (% release per minute)
Time (Mins)
Microwave Heating
Conventional Heating
0-3 14.17 21.92
3-15 2.46 0.98
15-30 0.08 0.05
Table 5.5.2.1- Rate of release of flurbiprofen from PVP 1:1, microwave heating
compared to conventional heating
Figure 5.5.2.2– A drug release profile for flurbiprofen and PVP (ratio 1:1), formulated
using microwave and conventional heating, in both cases without water present as a
solvent
0
20
40
60
80
100
0 20 40 60 80
% D
rug
Re
leas
e
Time / mins
Microwave heated without water Conventional heated without water

194
Figure 5.5.2.2 demonstrates flurbiprofen and PVP 1:1 formulated without water present
using microwave and conventional heating. It can be seen from the graph that the
conventional heating method may release more of the drug but because of the errors
that are associated with this dissolution it is difficult to be certain. However for the first
fifteen minutes of the dissolution 84% (±6%) of flurbiprofen was released from the
conventional formulation. This is compared with 74% (±9%) for the microwave
formulation, and from these results it is apparent that a possible difference may be
present. After ninety minutes 98% (±8%) of flurbiprofen was released from the
formulation prepared using microwave heating compared with around 100% (±8%).
There is also a difference in the rate between the two formulations, Table 5.5.2.2.
Rate (% release per minute)
Time (Mins)
Microwave Heating
Conventional Heating
0-3 22.13 27.01
3-15 0.56 0.27
15-30 0.34 0.29
Table 5.5.2.2- Rate of release of flurbiprofen from PVP 1:1, microwave heating
compared with conventional heating

195
Figure 5.5.2.3 – A drug release profile for flurbiprofen and SA (ratio 1:3), formulated
using microwave and conventional heating, in both cases without water present as a
solvent
Figure 5.5.2.3 illustrates flurbiprofen and SA formulated using microwaves and
conventional heating. It is possible from the graph that a difference has occurred
between the two different formulations, with the microwave formulation releasing 44%
(±6%) compared with 36% (±5%) for the conventional formulation. However it is difficult
to be certain because of the error associated with the results, and at the end of the
ninety minutes both formulations released over 50% (58% ±3% compared with 56%
±5% for the conventional formulation). Upon calculation of the rate, Table 5.5.2.3, there
is a slight difference for the first three minutes of the dissolution with the microwave
formulation releasing the drug at a faster rate.
0
10
20
30
40
50
60
70
0 20 40 60 80
% D
rug
Re
leas
e
Time / mins
Microwave heated without water Conventional heated without water

196
Rate (% release per minute)
Time (Mins) MW Without CN Without
0-3 7.07 6.01
3-15 1.28 1.43
15-30 0.37 0.59
Table 5.5.2.3- Rate of release of flurbiprofen from PVP 1:1, microwave heating
compared with conventional heating
Figure 5.5.2.4 – A drug release profile for flurbiprofen and PVP (ratio 1:9), formulated
using microwave and conventional heating, in both cases without water present as a
solvent
Figure 5.5.2.4 displays a formulation where the choice of heating method has affected
the percentage drug release. From the release profiles it is clear that the conventional
method gave a higher percentage drug release. Within fifteen minutes 92% (±1%) of
flurbiprofen was released from the conventional formulation compared with 76% (±8%).
After ninety minutes approximately 100% (±1%) of flurbiprofen was released from the
conventional formulation compared with 91% (±6%). Once the rate, Table 5.5.2.4, for
each formulation was calculated a difference was also seen, with the conventional
0
20
40
60
80
100
0 20 40 60 80
% D
rug
Re
leas
e
Time / mins
Microwave heated without water Conventional heated without water
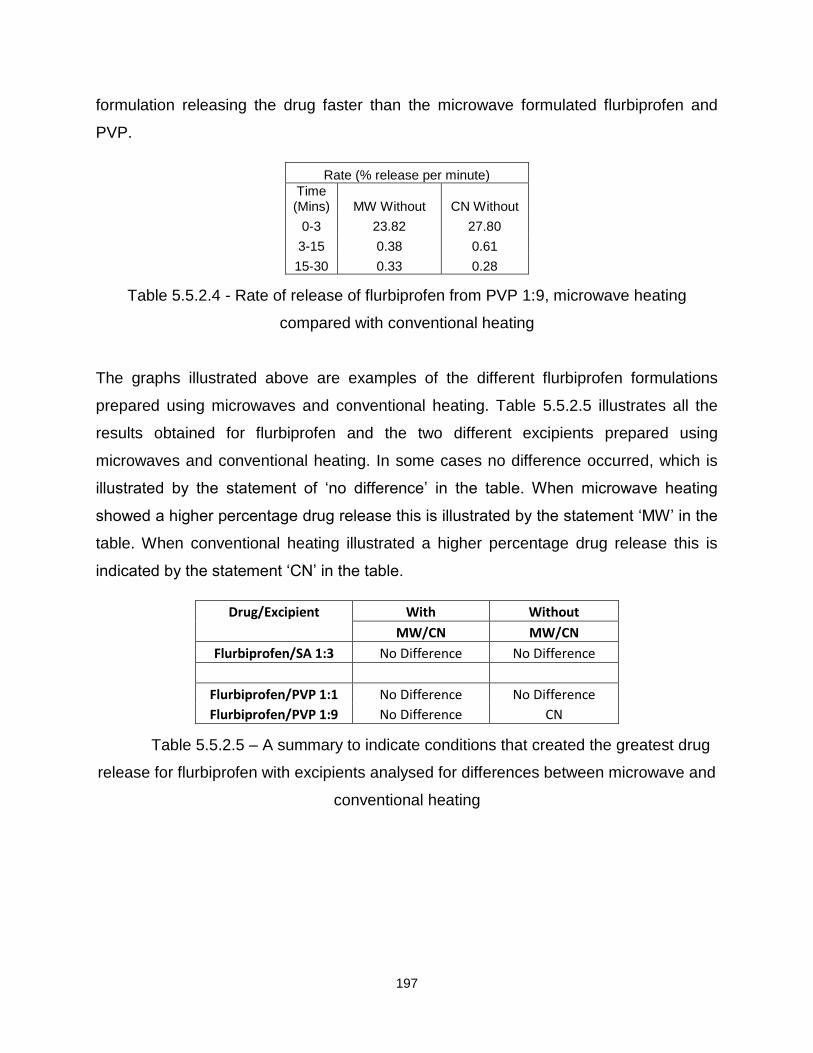
197
formulation releasing the drug faster than the microwave formulated flurbiprofen and
PVP.
Rate (% release per minute)
Time (Mins) MW Without CN Without
0-3 23.82 27.80
3-15 0.38 0.61
15-30 0.33 0.28
Table 5.5.2.4 - Rate of release of flurbiprofen from PVP 1:9, microwave heating
compared with conventional heating
The graphs illustrated above are examples of the different flurbiprofen formulations
prepared using microwaves and conventional heating. Table 5.5.2.5 illustrates all the
results obtained for flurbiprofen and the two different excipients prepared using
microwaves and conventional heating. In some cases no difference occurred, which is
illustrated by the statement of ‘no difference’ in the table. When microwave heating
showed a higher percentage drug release this is illustrated by the statement ‘MW’ in the
table. When conventional heating illustrated a higher percentage drug release this is
indicated by the statement ‘CN’ in the table.
Drug/Excipient With Without
MW/CN MW/CN
Flurbiprofen/SA 1:3 No Difference No Difference
Flurbiprofen/PVP 1:1 No Difference No Difference
Flurbiprofen/PVP 1:9 No Difference CN
Table 5.5.2.5 – A summary to indicate conditions that created the greatest drug
release for flurbiprofen with excipients analysed for differences between microwave and
conventional heating
198
5.5.3 Excipients
Formulation method parameters, such as the heating method and presence of a
solvent, are not the only factors that affect drug release, excipient selection can also
play a vital role.
In particular, it was found that the excipient which released the greatest amount
of flurbiprofen was PVP in the 1:1 and 1:9 ratio using both microwaves and conventional
heating and in the presence of water. Whilst the excipient that released the smallest
amount of flurbiprofen was SA formulated using microwaves and conventional heating,
with and without the presence of water.
In summary, based on these results, if formulating flurbiprofen to enhance drug
release it would be advisable to formulate using PVP, 1:1 and 1:9, either with or without
water using microwaves or conventional heating. In contrast, if formulating flurbiprofen
to retard drug release it would be advisable to formulate with SA, with or without water,
and using microwaves or conventional heating.
5.5.4 Summary
To summarise, in the majority of cases water has little or no effect on the release
of the drug. However when a difference was seen, a higher percentage drug release
occurred when water was not present during formulation.
Upon analysis of the flurbiprofen formulations when subjected to microwaves and
conventional heating, it became apparent that the choice of the method made no
significant difference to the release of the drug in the majority of cases. The only
difference occurred with flurbiprofen and PVP 1:9 and the highest drug release was
seen when the drug and excipient were formulated using conventional heating.
Also to increase the release of flurbiprofen, PVP seems to be advantageous but
to slow the rate down for the drug then SA could be used.
199
Ibuprofen, ketoprofen and flurbiprofen are in Group two of the Biopharmaceutical
Classification System (BCS). These have high permeability but low solubility, however
to extend this research further it was decided to formulate a drug within a different
group, one where the solubility is not an issue. From this, it was decided to use
paracetamol (BCS group 1), and to formulate the drug without water using the
microwave and conventional methods.
5.6 Paracetamol
5.6.1 The influence of microwave heating compared with conventional heating on
subsequent drug release
Paracetamol was formulated with the four different excipients using microwave
and conventional heating and therefore the following results are a comparison between
the two different heating methods. A summary of all the results can be seen at the end
of this section in Table 5.6.1.7.
From all of the results obtained, it appears that the choice of heating method
made no significant difference to the release of paracetamol in the majority of cases.
However the following graphs illustrate the different formulations that do not fit into this
trend, Figures 5.6.1.1 to 5.6.1.3.

200
Figure 5.6.1.1 – A drug release profile for paracetamol and SA (ratio 1:3), formulated
using microwave and conventional heating, in both cases without water present as a
solvent
Figure 5.6.1.1 illustrates paracetamol formulated with SA using microwaves and
conventional heating. From the graph it can be seen that the conventional heating
method gave a higher percentage drug release. For the microwave formulation within
the first fifteen minutes 20% (±2%) of the drug was released compared with 26% (±2%)
for the conventional formulation and after ninety minutes the microwave formulation
released 21% (±1%) compared with 28% (±2%). The result obtained in Figure 5.6.1.1
was also evident when the rate was calculated, Table 5.6.1.1.
Upon comparison of the release of paracetamol from SA it was noted that the
release seemed to be lower than the previous formulations. As a result, it was decided
to establish if any problems (degradation or evaporation) were present with paracetamol
after the formulation method. Microwave thermogravimetry was employed, illustrating
the same conditions for microwave heating but also a way of measuring the weight
during the heating process. The results obtained determined that the drug was stable at
the formulation temperature (85°C). Consequently no degradation or evaporation was
0
5
10
15
20
25
30
35
0 20 40 60 80
% D
rug
Re
leas
e
Time / mins
Microwave heated without water Conventional heated without water

201
occurring that would show a decrease in weight but also a decrease in the amount of
drug present in the SA formulations.
Rate (% release per minute)
Time (Mins)
Microwave Heating
Conventional Heating
0-3 4.77 5.60
3-15 0.47 0.71
15-30 0.03 0.06
Table 5.6.1.1 - Rate of release of Paracetamol from SA, microwave heating compared
with conventional heating
Figure 5.6.1.2 – A drug release profile for paracetamol and PVP (ratio 1:1), formulated
using microwave and conventional heating, in both cases without water present as a
solvent
Figure 5.6.1.2 displays paracetamol and PVP 1:1 formulated using microwaves and
conventional heating. This graph is another example of where conventional heating
shows a higher percentage drug release when compared with microwave heating. For
the first fifteen minutes, the conventional formulation released 78% (±2%) compared
0
20
40
60
80
100
0 20 40 60 80
% D
rug
Rel
ease
Time / mins
Microwave heated without water Conventional heated without water

202
with 65% (±5%) for the microwave formulation. After ninety minutes approximately
100% (±6%) of the drug was released for the formulation prepared using conventional
heating. This again is a higher percentage release when compared with the microwave
formulation (87% ±3%). When the rate was calculated, Table 5.6.1.2, it was also evident
that the formulation prepared by conventional heating released paracetamol at a faster
rate.
Rate (% release per minute)
Time (Mins)
Microwave Heating
Conventional Heating
0-3 20.83 25.42
3-15 0.16 0.19
15-30 0.29 0.50
Table 5.6.1.2 - Rate of release of Paracetamol from PVP 1:1, microwave heating
compared with conventional heating
Figure 5.6.1.3 – A drug release profile for paracetamol and 2HPBCD (ratio 1:9),
formulated using microwave and conventional heating, in both cases without water
present as a solvent
0
10
20
30
40
50
60
70
80
90
100
0 20 40 60 80
% D
rug
Rel
ease
Time / mins
Microwave heated without water Conventional heated without water
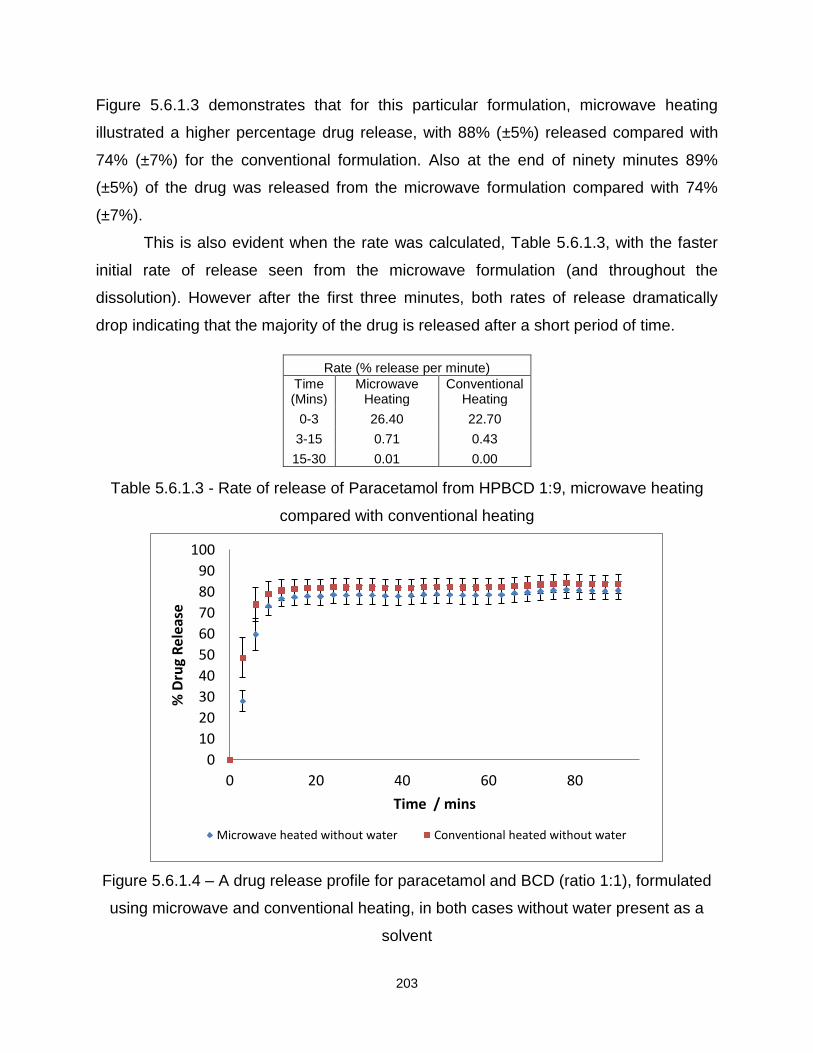
203
Figure 5.6.1.3 demonstrates that for this particular formulation, microwave heating
illustrated a higher percentage drug release, with 88% (±5%) released compared with
74% (±7%) for the conventional formulation. Also at the end of ninety minutes 89%
(±5%) of the drug was released from the microwave formulation compared with 74%
(±7%).
This is also evident when the rate was calculated, Table 5.6.1.3, with the faster
initial rate of release seen from the microwave formulation (and throughout the
dissolution). However after the first three minutes, both rates of release dramatically
drop indicating that the majority of the drug is released after a short period of time.
Rate (% release per minute)
Time (Mins)
Microwave Heating
Conventional Heating
0-3 26.40 22.70
3-15 0.71 0.43
15-30 0.01 0.00
Table 5.6.1.3 - Rate of release of Paracetamol from HPBCD 1:9, microwave heating
compared with conventional heating
Figure 5.6.1.4 – A drug release profile for paracetamol and BCD (ratio 1:1), formulated
using microwave and conventional heating, in both cases without water present as a
solvent
0
10
20
30
40
50
60
70
80
90
100
0 20 40 60 80
% D
rug
Rel
ease
Time / mins
Microwave heated without water Conventional heated without water
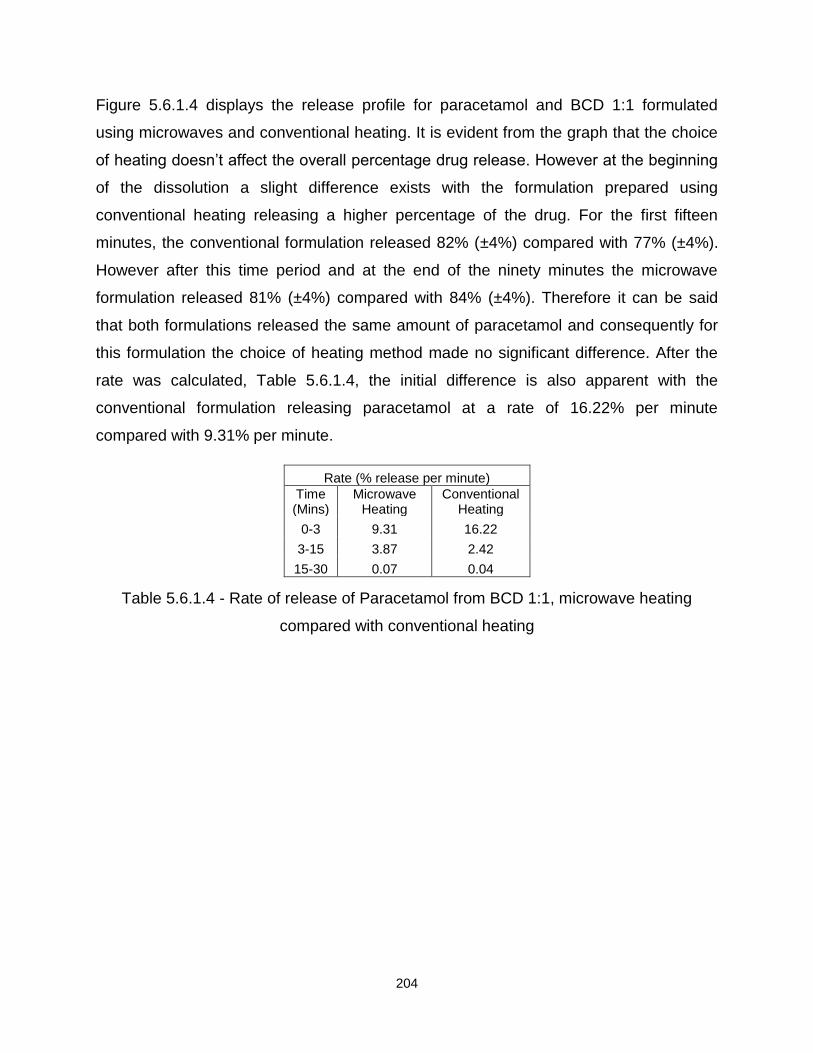
204
Figure 5.6.1.4 displays the release profile for paracetamol and BCD 1:1 formulated
using microwaves and conventional heating. It is evident from the graph that the choice
of heating doesn’t affect the overall percentage drug release. However at the beginning
of the dissolution a slight difference exists with the formulation prepared using
conventional heating releasing a higher percentage of the drug. For the first fifteen
minutes, the conventional formulation released 82% (±4%) compared with 77% (±4%).
However after this time period and at the end of the ninety minutes the microwave
formulation released 81% (±4%) compared with 84% (±4%). Therefore it can be said
that both formulations released the same amount of paracetamol and consequently for
this formulation the choice of heating method made no significant difference. After the
rate was calculated, Table 5.6.1.4, the initial difference is also apparent with the
conventional formulation releasing paracetamol at a rate of 16.22% per minute
compared with 9.31% per minute.
Rate (% release per minute)
Time (Mins)
Microwave Heating
Conventional Heating
0-3 9.31 16.22
3-15 3.87 2.42
15-30 0.07 0.04
Table 5.6.1.4 - Rate of release of Paracetamol from BCD 1:1, microwave heating
compared with conventional heating

205
Figure 5.6.1.5 – A drug release profile for paracetamol and BCD (ratio 1:9), formulated
using microwave and conventional heating, in both cases without water present as a
solvent
Figure 5.6.1.5 demonstrates that the choice of heating method has made no difference
to the overall drug release. It is a possibility that for the initial three minutes of the
dissolution the conventional formulation releases paracetamol slightly faster than the
microwave formulation, however after and for the rest of the dissolution both
formulations released the same amount of the drug. For the first fifteen minutes the
microwave formulation released 78% (±6%) compared with 80% (±4%) and after ninety
minutes 92% (±7%) of paracetamol was released from the microwave formulation
compared with 83% (±4%). When the rate was calculated, the observed results from the
graph were confirmed, Table 5.6.1.5.
0
10
20
30
40
50
60
70
80
90
100
0 20 40 60 80
% D
rug
Rel
ease
Time / mins
Microwave heated without water Conventional heated without water
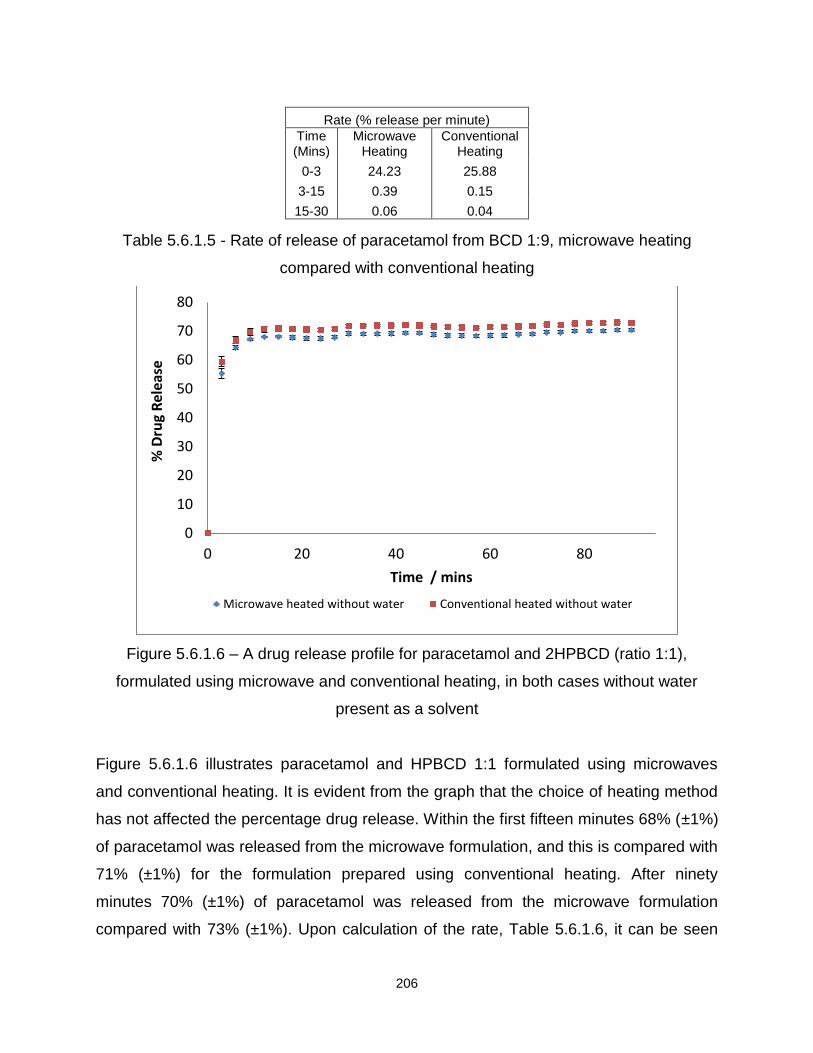
206
Rate (% release per minute)
Time (Mins)
Microwave Heating
Conventional Heating
0-3 24.23 25.88
3-15 0.39 0.15
15-30 0.06 0.04
Table 5.6.1.5 - Rate of release of paracetamol from BCD 1:9, microwave heating
compared with conventional heating
Figure 5.6.1.6 – A drug release profile for paracetamol and 2HPBCD (ratio 1:1),
formulated using microwave and conventional heating, in both cases without water
present as a solvent
Figure 5.6.1.6 illustrates paracetamol and HPBCD 1:1 formulated using microwaves
and conventional heating. It is evident from the graph that the choice of heating method
has not affected the percentage drug release. Within the first fifteen minutes 68% (±1%)
of paracetamol was released from the microwave formulation, and this is compared with
71% (±1%) for the formulation prepared using conventional heating. After ninety
minutes 70% (±1%) of paracetamol was released from the microwave formulation
compared with 73% (±1%). Upon calculation of the rate, Table 5.6.1.6, it can be seen
0
10
20
30
40
50
60
70
80
0 20 40 60 80
% D
rug
Rel
ease
Time / mins
Microwave heated without water Conventional heated without water

207
that the conventional formulation released paracetamol faster with 19.78% released in
the first three minutes compared with 18.44% per minute for the microwave formulation.
However after the initial three minutes the rates drop and both formulations can be seen
to release the same amount of the drug (0.90% compared with 0.97% per minute).
Rate (% release per minute)
Time (Mins)
Microwave Heating
Conventional Heating
0-3 18.44 19.78
3-15 0.97 0.90
15-30 0.05 0.05
Table 5.6.1.6 - Rate of release of paracetamol from BCD 1:9, microwave heating
compared with conventional heating
Table 5.6.1.7 illustrates all the results obtained for paracetamol and the four different
excipients prepared using microwaves and conventional heating. In some cases no
differences occurred, which is illustrated by the statement ‘no difference’ in the table.
When microwave heating showed a higher percentage drug release this is illustrated by
the statement ‘MW’ in the table. When conventional heating illustrated a higher
percentage drug release this is indicated by the statement ‘CN’ in the table.
Drug/Excipient Without
MW/CN
Paracetamol/SA 1:3 CN
Paracetamol/BCD 1:1 No Difference
Paracetamol/BCD 1:9 No Difference
Paracetamol/PVP 1:1 CN
Paracetamol/PVP 1:9 CN
Paracetamol/2HPBCD 1:1 No Difference
Paracetamol/2HPBCD 1:9 MW
Table 5.6.1.7 – Summary to indicate conditions that created the greatest drug
release for paracetamol and excipients analysed for differences between microwave
and conventional heating

208
5.6.2 Excipient
In particular, it was found that the excipient which released the greatest amount
of paracetamol was PVP, in the 1:1 ratio formulated using microwave heating. While the
smallest amount of paracetamol was released from SA formulated using microwave
heating.
In summary, based on these results, if formulating paracetamol to enhance drug
release it would be advisable to formulate using PVP and the microwave heating
method.
In contrast, if formulating paracetamol to retard drug release it would be
advisable to formulate using SA, and using the microwave heating method.
5.6.3 Summary
Paracetamol does not have poor aqueous solubility and therefore it was decided
to formulate without the presence of water. Consequently the choice of heating method
was investigated and the results obtained showed that in the majority of cases no
significant difference was observed between the two heating methods. However when a
difference was seen the conventional method of heating showed a higher percentage
drug release.
With respect to excipient choice, when formulating paracetamol to enhance drug
release it is advisable to formulate using PVP in the 1:1 ratio and with microwave
heating. If however the drug release needs to be delayed then SA should be used.
From all results obtained, it is clear that the choice of heating method and the presence
of water can illustrate differences in the percentage drug release. However when the
formulation temperature becomes further away from the melting point of the drug, these
differences become less apparent. Therefore without the range of drugs and excipients
investigated, and a comparison between the heating methods this information would not
have been noticed.
209
References
1. Dissolution testing of immediate release solid oral dosage forms, US Department
of Health and Human Services, Vol 1, 1-13, 1997
2. Use of adsorbents in enhancement of drug dissolution II, DC Monkhouse, JL
Lach, Journal of Pharmaceutical Sciences, 9, Vol 61, 1435-1441, 1972
3. Fully-automated system for dissolution rate of solid oral dosage forms according
to the paddle method, E Lamparter, D Riedl, Journal of Automatic Chemistry, 5,
Vol 15, 171-176, 1993
4. In Vitro-In Vivo correlations, E Demirturk, L Oner, Journal of Pharmaceutical
Science, Vol 28, 215-224, 2003
5. Microwave generated nanocomposites for making insoluble drugs soluble, P
Bergese, I Colombo, D Gervasoni, LE Depero, Materials Science and
Engineering C, 23, 791-795, 2003
6. Melting of nanostructured drugs embedded into a polymeric matrix, P Bergese, I
Colombo, D Gervasoni, LE Depero, Journal of Physical Chemistry B, 108,
15488-15493, 2004
7. Microwave generated solid dispersions containing ibuprofen, M Moneghini, B
Bellich, P Baxa, F Princivalle, International Journal of Pharmaceutics, 1-6, 2008
8. Sustained-released solid dispersions of ibuprofen prepared by microwave
irradiation, M Moneghini, N De Zordi, M Grassi, G Zingone, Journal of Drug
Delivery Science and Technology, 5, Vol 18, 327-333, 2008
9. Influence of the Microwave Technology on the Physical-Chemical Properties of
Solid Dispersions with Nimesulide, M Moneghini, G Zingone, N De Zordi, Powder
Technology, 195, 259-263, 2009
10. GCSE.com, conduction, Available [online] at: http://www.gcse.com/energy.htm,
2011, Accessed on the 26th January 2011.
11. Pharmaceutical Applications of Cyclodextrins. 1. Drug Solubilization and
Stabilization, T. Loftsson, M.E. Brewster, Journal of Pharmaceutical Sciences,
10, Vol 85, 1017-1025, 1996.

210
12. Cyclodextrins in Drug Delivery: An Updated Review, R. Challa, A. Ahuja, J. Ali,
and R.K Khar, An Official Journal of the American Association of Pharmaceutical
Scientists, 2, Vol 6, 329-357, 2005.
13. Disorder and dissolution enhancement : Deposition of ibuprofen on to insoluble
polymers, AC Williams, P Timmins, M Lu, RT Forbes, European Journal of
Pharmaceutical Sciences, 26, 288-294, 2005
14. Improving drug solubility for oral delivery using solid dispersions, C Leuner, J
Dressman, European Journal of Pharmaceutics and Biopharmaceutics, Vol 50,
47-60, 2000
15. Introduction and General Overview of Cyclodextrin Chemistry, J. Szejtli,
Chemical Review, Vol 98, 1743-1753, 1998.
Chapter 6
Conclusions and Future Work

209
6.1 Conclusion
The first aspect of this research was to investigate the thermodynamic
parameters associated with the binding between three different drugs, namely
ibuprofen, ketoprofen and flurbiprofen and two excipients, over a temperature range
(Objective One). The second aspect was to investigate the compatibility between the
different drugs and excipients to ensure the formulation process was a success and had
no adverse effects on the drugs themselves (Objective Two). The final part of this
research was to analyse and determine how the chosen drugs and excipients behaved
after being exposed to the varying formulation parameters by considering the resultant
drug dissolution (Objective Three).
6.1.1 Objective One: Drug-Excipient Binding
The first objective of this research was to determine the thermodynamic
parameters associated with the binding of ibuprofen, ketoprofen, and flurbiprofen with
two excipients, BCD and 2HPBCD. This was investigated using ITC and completed
over a temperature range to see if the parameters were temperature dependent. In all
cases, information was obtained on the binding constants, stoichiometry, enthalpy,
entropy and Gibb’s free energy. This information was then used to determine and
understand the complexation process including the strength of the interaction between
the drug and cyclodextrin and whether the interaction was favourable. This was
successfully carried out and in all cases the drug interacted with the BCD and 2HPBCD
in a 1:1 ratio, which was unaffected by an increase in the temperature. For ibuprofen,
BCD and 2HPBCD, it was concluded that the binding and therefore the interaction
between these compounds was favourable and likely to happen. As the temperature
increased, there was an increase in the enthalpy of the reaction showing the bonding
becomes more exothermic and illustrating an increase in the strength of bonds between
the drug and cyclodextrin cavity. The change in Gibbs free energy also indicated a slight
increase to a more negative value with an increase in temperature, and a small positive
contribution by ΔS (entropy). The negative values for ΔG indicate that the complex has
less free energy than the free drug and cyclodextrin, and consequently the negative
value for enthalpy, negative values for Gibb’s free energy and a slightly positive entropy

210
suggests binding was favoured and a complex formation was promoted. However when
both the binding constants and therefore the enthalpy, Gibb’s free energy and entropy
were compared for ibuprofen binding to BCD and ibuprofen to 2HPBCD it can be seen
that ibuprofen does form a complex with 2HPBCD but it is a relatively weak process
(ibuprofen and BCD show significantly more negative values when compared with
2HPBCD). This is because 2HPBCD is a more sterically hindered compound, making it
harder for a drug to bind and form a tight complex with this compound. It can also be
said that the drug-excipient interactions are temperature dependant as expected.
Ketoprofen was also investigated with BCD and 2HPBCD, and it was seen that
as the temperature increases there is a change in the enthalpy, and consequently
Gibb’s free energy, therefore this reaction is also temperature dependant. As the
temperature increases, the enthalpy change for the reaction increased and became
more negative showing that the strength of the interaction between ketoprofen and the
cyclodextrin cavity increased. Along with this increase in enthalpy, there was an
increase in negativity in the Gibb’s free energy with a small positive contribution by
entropy (ΔS) which would suggest that as the temperature increases, the interaction
between the drug and cyclodextrin cavity increases. Consequently the resultant
complex has less free energy than the free drug and BCD molecules and therefore
binding is favoured. It is apparent from the results that the interaction seen between
ketoprofen and 2HPBCD is weaker when compared with ketoprofen and BCD. This
therefore may suggest that the substituted groups seen in the structure of 2HPBCD
make it difficult for the drug to interact and bind to the cavity of the cyclodextrin, a result
previously obtained with ibuprofen.
In the case of flurbiprofen with BCD, the binding constant decreased with
increasing temperature which was not witnessed previously. When the enthalpy for
each reaction was calculated it was seen to remain constant over the temperature
range studied suggesting that the binding mechanism was unchanged. There was also
a slight decrease in the Gibb’s free energy as the temperature for the reaction
increased, with positive entropy that remained the same. These results suggested that a
complex was formed and favoured but the strength of it was reduced as the
temperature was elevated. For the binding between flurbiprofen and 2HPBCD, the

211
binding constant, enthalpy and Gibb’s free energy all increased with increasing
temperature which is a trend previously seen with ibuprofen and ketoprofen. This result
therefore suggested that the bond between the flurbiprofen drug molecule and the
cyclodextrin cavity increased in strength with increasing temperature. It also showed
that the reaction was more exothermic at higher temperatures. There was an increase
in ΔG which indicated that at higher temperatures, there was less free energy in the
complex than the free drug and cyclodextrin. Therefore because of this and the negative
enthalpy of binding and the positive entropy, the complex was favourable and more of
the drug was in the complex instead of free state. When the two different excipients
were compared, it was noted that the interaction between flurbiprofen and BCD was
less favourable as the temperature increased, however the opposite was witnessed for
the interaction of the drug and 2HPBCD. Upon comparison of the three different drugs,
it was concluded that the more lipophilic the drug, the stronger the interaction between
the drug molecule and the cyclodextrin. This was a reflection of the greater affinity of the
lipophilic compound towards the less polar internal cavity of the cyclodextrin when
compared with water. However, this was not observed for flurbiprofen and BCD. Here
there was a decrease in the binding constant, ΔH and ΔG at 310K. This consequently
suggests another factor was influential, i.e. the structural differences present for
flurbiprofen when compared with ibuprofen and ketoprofen. This may have a
subsequent impact on the hydrogen bonding potential with the cyclodextrin cavity
causing a decrease in bond strength as the temperature increased. This finding implied
that at the highest temperature investigated less of the drug was in a complex with the
cyclodextrin because of the loss in strength of the hydrogen bonding.
6.1.2 Objective Two: Formulation Stability
After the first objective was successfully carried out, the second objective was to
determine if the chosen drugs, namely, ibuprofen, ketoprofen, flurbiprofen and
paracetamol were compatible with the four excipients (SA, BCD, 2HPBCD and PVP).
This was determined from the analysis of DSC, SEM and TAM data. In all cases it
appeared that the drug and excipient were compatible with no adverse effects observed
following the formulation process. DSC was used to determine if the formulation method

212
made any significant differences to the thermal behaviour of the drug and excipient.
Firstly, each of the pure compounds were analysed to illustrate the thermal behaviour
before the formulation process was undertaken. After the pure compounds were
investigated, each of the formulations were analysed. Any differences in the thermal
behaviour were recorded and included a decrease in the melting points of the drugs or a
change in the behaviour of the excipients. In the case of ibuprofen, it was found that the
choice of heating method made no significant difference to the thermal behaviour of the
drug and excipient, with an exception for PVP in the 1:1 ratio. Also in the majority of
cases, having water present during the formulation method, made no difference to the
thermal behaviour. However there was an exception for BCD (1:9) and PVP in both
ratios. When water was present for the ibuprofen and BCD formulation prepared in the
1:9 ratio it can be seen that a clear overlap of the peaks had occurred with an increase
in the melting point for the drug. This indicated that the presence of water may have
aided the encapsulation of the drug and pushed it towards the cyclodextrin cavity. Also
for ibuprofen and PVP a clear decrease of the melting point for the drug was seen, with
a difference in the behaviour of the excipient after formulation. These results indicate
that an interaction had occurred because of the formulation process.
After ibuprofen was investigated, ketoprofen was also analysed. Firstly,
ketoprofen was formulated with SA which caused a change in the thermal behaviour of
the drug and excipient, indicated by a decrease in the melt temperature for both.
However for this result to be reliable, there would have to be a decrease by a
substantial amount of 40ºC. Therefore it may be possible that the formulation was not
homogenous throughout and because of the small amount taken for DSC analysis
weight errors may have been introduced. To overcome this problem with future
formulations it may be advisable to initially mix for a longer period of time, formulate,
then grind and re-mix. For the other formulations, it appeared that the choice of heating
method did not affect the thermal behaviour of the drug and excipient, other than when
ketoprofen was formulated with PVP in the 1:9 ratio using conventional heating. This
was a result also obtained for ibuprofen and PVP, although in a different ratio. A logical
explanation for this is the fact that during conventional heating the drug and excipient
were exposed to heat and moisture for longer periods of time which may enable the

213
excipient to have swelled to a greater extent. It was also evident from the results that in
the majority of cases water affected the thermal behaviour of the drug and excipient
when ketoprofen was formulated with BCD and PVP. In both cases, when water was
present a broad peak was witnessed with a decrease in the temperature associated
with that peak.
Flurbiprofen was investigated with two excipients, namely SA and PVP. This was
because of difficulties during formulation of the drug with the remaining two excipients.
However from analysis of the drug with the two excipients it appeared that the
formulation method made no significant difference to the thermal behaviour of the drug
either using microwaves or conventional heating, and with or without the presence of
water.
The last drug investigated using DSC was paracetamol, with the four excipients,
and without the presence of water. In the majority of cases the choice of heating method
made no significant difference to the thermal behaviour of the drug and excipient.
DSC was utilised to investigate the compatibility of the drugs and excipients and
also to ensure no adverse effects occurred to the formulation after the heating process.
In the majority of cases, it can be said that the choice of excipients were compatible with
the different drugs and this was illustrated by a change in the thermal behaviour of the
formulation. In some cases no differences were illustrated, this however only became
more prominent when the formulation temperature of 85ºC was significantly different
from the melting point of the drug, for example paracetamol at 169 ºC. Also there was
no evidence that any adverse effects occurred to either the drug or excipient after the
formulation process.
Each of the drugs and excipients were analysed using SEM, followed by each of
the formulations prepared using microwaves and conventional heating, with and without
the presence of water. In the case of ibuprofen, it was apparent that the formulation
process did affect the overall physical appearance of both drug and excipient. This was
illustrated by a change in the particle shape and size. Choice of heating method did not
affect the appearance. Also it was apparent that when water was present during the
formulation process, a smaller particle size was observed. This may have occurred
because during formulation with water, the mixture was continuously stirred which may
214
give a smaller particle size. This was a trend seen throughout the different formulations,
until PVP was analysed. This drug and excipient formulation showed a larger particle
size when exposed to the moisture, and this occurred because PVP swelled upon
exposure to moisture.
Ketoprofen was also analysed using SEM, and for this drug and excipients it
became evident that there was no significant difference between the two different
heating methods. When water was present during formulation, it became apparent that
a reduction in the particle size occurred. This indicated that the continuous stirring of
any of the ketoprofen formulations during heating helped to reduce particle size,
however this was not the case for PVP. This excipient once again showed a larger
particle size when water was present.
Flurbiprofen was the next drug analysed with SA and PVP only. However,
despite only having two excipients to investigate, the results obtained showed that in the
presence of water the resultant formulation had a smaller particle size (apart from PVP).
It was also noted that the choice of heating method made no overall difference to the
physical appearance.
Lastly, paracetamol was analysed using SEM, this drug was formulated using
microwave and conventional heating without the presence of water. Therefore this drug
was investigated to determine if any differences were apparent between the two heating
methods. From all the different formulations analysed it was evident that the choice of
heating method made no significant difference to the final appearance of the drug and
excipient.
DSC and SEM have been utilised to determine compatibility of the drugs and excipients
and to visually see if the formulation method illustrated any differences in appearance of
the resultant formulations. Experiments were then conducted using a TAM to determine
the stability of these formulations. However, because of time restrictions it was decided
to analyse ibuprofen only. This was because at the formulation temperature, ibuprofen
is the only drug that melts.

215
Firstly, pure ibuprofen was subjected to three different parameters, namely dry 30ºC,
30ºC and 51% RH, and ibuprofen dissolved in phosphate buffer. From these different
conditions it was concluded that pure ibuprofen was stable for the four day period. As a
result, each of the different formulations were analysed at 30ºC over four days. The
results obtained indicated that after the formulation process, ibuprofen appeared stable
and as a consequence no adverse effects were seen when the drug was heated and
formulated with the four chosen excipients. In all cases, the signal during the
experiment remained close to or on 0μW/g indicating no degradation.
6.1.3 Objective Three: Formulation parameters investigated. The influence
of formulation solvent on subsequent dissolution and choice of heating
method
The third objective was to determine if the presence of water during the
formulation process affected subsequent drug release. This was analysed using drug
dissolution and ibuprofen, ketoprofen and flurbiprofen were all investigated with the
excipients. When ibuprofen was formulated with the excipients and in the presence of
water, it was evident that a higher drug release occurred in the majority of cases. It is
difficult to determine why these results were obtained but it may be because of the
following three reasons. Firstly, ibuprofen is a poorly water soluble drug and when
formulated in the presence of water the drug may be forced towards the excipient,
aiding complex formation and therefore showing an improvement in dissolution.
Secondly, because of the presence of water, ibuprofen may bind to the excipient, but
not as efficiently as formulations without water and as a result, a loosely bound complex
was formed. Lastly, it was noticed from analysis of the images obtained from the SEM
that a smaller particle size was evident when water was present during formulation. As
a result, the formulation would dissolve at a faster rate and therefore an improved
dissolution rate was seen.
When ketoprofen was formulated with the four excipients and in the presence of
water, an improved dissolution was seen.

216
Flurbiprofen was formulated with SA and PVP, and it was apparent that formulating this
drug in the presence of water made no significant difference to the dissolution profile.
Both these excipients and the drug are insoluble in aqueous solutions and therefore
water was not likely to change the particle size, and as a result the dissolution rate was
not enhanced. In addition, flurbiprofen did not melt at the formulation temperature.
Paracetamol was not formulated in the presence of water therefore no comparison
between the different formulations was made.
From analysis of all the different formulations it can be concluded that the
presence of water did make a significant difference to the overall release of the drug. In
the majority of cases, it appeared that when water was present an enhanced dissolution
rate was expected. This could be because of a reduction in particle size, or as a result
of continuous stirring during the heating method.
Finally, dissolution experiments were conducted to determine if the choice of
heating method affects the dissolution profile for a chosen drug. Each of the four drugs
were investigated with the excipients either with or without the presence of water during
formulation. When ibuprofen was formulated using microwave heating, it was seen that
a higher percentage drug release occurred when compared with conventional heating.
This result could have occured because of the way microwaves heat, which is by direct
interaction with the molecules in contrast to a temperature gradient. Also ibuprofen
melts at this temperature which may be beneficial to aid encapsulation.
The next drug analysed was ketoprofen with the four different excipients. From
the results obtained it became evident that when this drug was formulated using
microwave heating a higher percentage drug release was seen. However, in some
cases no difference was seen between the two heating methods. This result suggests
for these formulations that the choice of heating method makes no overall difference to
the drug release. When microwaves illustrated a higher percentage drug release, this
may have occurred because of a more uniform method of heating which may aid
encapsulation, which in turn improves the release from the formulation.
Flurbiprofen formulations were also analysed and it can be seen from the results
that the choice of heating does not affect the release of the drug in the majority of
cases. When a significant difference was observed, the conventionally heated

217
formulation was seen to release a higher amount of the drug. This may have occurred
because the conventional method takes longer to heat the formulation and because the
drug doesn’t melt it may require this extra time to encapsulate the drug and show an
improvement in the dissolution.
For paracetamol in the majority of cases, no significant difference occurred
between the two heating methods. This again indicated that the further away the
formulation temperature is to the melting point of the drug, the less difference appeared
between the two methods. When a difference did occur, the formulation that displayed a
higher percentage drug release was the conventional formulation. This may indicate
that the further away the formulation temperature is from the melting point of the drug,
the longer it may require to encapsulate and show an improvement in the drug release.
From all the results obtained it appeared that when ibuprofen and ketoprofen
were formulated using microwaves a higher percentage drug release was evident yet
for flurbiprofen and paracetamol this was not the case. Also in some cases, no
difference was seen between the two heating methods. This suggests that the choice of
method will not necessarily affect the the dissolution profile. Conseqeuntly microwave
heating could still be used to formulate in these instances, for example, to reduce
energy costs associated with conventional methods. Microwaves also provide a more
uniform way of heating reducing any implications associated with uneven heating.
In summary, the chosen analytical techniques allowed all three objectives to be
investigated. The different thermodynamic parameters were investigated and
determined for the interactions between ibuprofen, ketoprofen and flurbiprofen with the
two different cyclodextrins (BCD and 2HPBCD). The formulation method did not appear
to cause any adverse effects on the drug and excipients, and all seemed compatible
with a change in thermal behaviour and appearance for the majority of the different
formulations. From the dissolution profiles, it does appear that the choice of heating
method will influence the release profiles for drugs close to the formulation temperature
of 85°C, with microwave based formulations displaying a greater extent of drug release.
Also drug release appears further enhanced when water is present during the heating
stage, which may be the result of a decrease in the particle size.
218
6.2 Future Work
To extend this work further, some areas that could be investigated are described below.
1. Extend the selection of drugs and excipients studied using ITC
ITC was utilised to analyse the binding interactions between a comparatively small
selection of drugs with increasing partition coefficients and two excipients. To extend
this further it would be possible to analyse other drugs with different partition
coefficients with BCD and 2HPBCD to see if the positive correlation between
temperature and lipophilicity continues. It may also be possible to increase the
number of excipients to see if similar trends are obtained. Other excipients that could
be investigated include α and γ-cyclodextrins, and possibly a few derivatives of the
cyclodextrins, including Hydroxyethyl-β-CD, or Methyl-β-CD.
2. Extend the study of the application of microwave heating
The controlled power microwave method to produce pharmaceutical formulations is
novel and therefore there are many parameters that could be varied within this
aspect of the research area. This could be achieved by varying the amount of the
time that each formulation is subjected to the microwave energy. Also by varying the
formulation temperature, this may help to determine the optimum conditions for the
microwave method. It was also noted that the further away the formulation
temperature was from the melting point of the drug the less variation was present
between the parameters. Therefore, to investigate further more drugs that have a
melting point around the formulation temperature need to be investigated. Also
drugs with a melting point considerably different to the formulation temperature need
to be investigated to determine if the same trends are witnessed. This method can
also be extended to the conventional method so a direct comparison can still be
made.
3. Explore alternative analytical techniques
DSC, SEM and a TAM were used to determine any changes to the drug and
excipient as a result of the formulation process. Other analytical techniques that may
help to illustrate and understand any changes may include XRD (x-ray diffraction)
and FT-IR (fourier-transform infra-red). XRD can be used to determine if the

219
formulation method reduced crystallinity, which may also help to explain the
resultant variations in dissolution profiles. As a consequence of formulation,
hydrogen bonding occurs between the two components and this could be
investigated using FT-IR, which is illustrated by a shift in certain peaks.
During analysis of the DSC profiles it was evident that some changes occurred in
the thermal behaviour of the resultant formulations, however for ketoprofen and
flurbiprofen no peak was seen for the melt of the drug. This may indicate that the
formulation was not homogenous throughout, and to eradicate this problem the initial
mixing time can be increased from five minutes to ten or fifteen minutes. Also after
the heating method, the formulation can be milled and re-mixed to ensure a
homogenous mixture. Again, further analysis may help confirm this theory.
Rather than using a further technique, more work could be conducted using a
TAM. For example, the stability of the ibuprofen formulations was investigated using
a TAM, to extend this section of work further the amount of time each formulation
was analysed could be increased from four days to weeks or months to be certain
no problematic instability exists. Also all formulations could to be investigated for
stability and therefore ketoprofen, flurbiprofen and paracetamol could be analysed
using a TAM.
In addition, MWTG was used to investigate if any degradation or evaporation of
the drugs occurred at the formulation temperature. To ensure that no adverse effects
occur at the chosen temperature, MWTG can be utilised and used as a screening
method to ensure that the drugs can withstand the thermal stress presented during
heating.
In summary, the research presented in this thesis has confirmed the potential
application of microwave heating for pharmaceutical formulations with
accompanying analytical techniques. However, there is far more work that can be
undertaken in this area to fully explore all of the possible uses of this novel method
of formulation.