download ppt
TRANSCRIPT

BRUNS-PAK PresentsBRUNS-PAK PresentsMARK S. EVANKO, PrincipalMARK S. EVANKO, Principal
Data Centers of the Future and the Impact of High Density Computing on Facility Infrastructures - Trends, Air-Flow,
“Green/LEED”, Cost, and Schedule Considerations
Friday, July 13, 2007 Friday, July 13, 2007
2
Agenda
I High Density Computing Equipment and the Thermodynamic Evolution
II High Density Impacts to Data Center Costs
III Thermodynamic Model Impacts to the Data Center Designs/Retrofits
IV Questions and Answers
3
High Density Computing Equipment and the Thermodynamic Evolution
Part I
4
The Data Center Solution Components (chant!)A. Computer HardwareB. Computer SoftwareC. Telecommunications (Data/Tele)D. Facility Infrastructure
The Recent Data Center “History of the World” The Early on “Watts per sq. ft.” Metric 1980/1990 The High Density “Discussion/Announcement”
Associated with Blade Server Technology 2000
High Density Computing Equipment and the Thermodynamic Evolution

5
The Data Center Facility Infrastructure Transformation Discussion/Evolution from Capacity (watts per sq. ft.) to Distribution (cfm/static)
The “Retraction” of Uptime Institute ® – Spring 2006 – Tier Ratings
The Evolution of Facility Infrastructure Reliability vs. Data Processing Uptime
The Role of Thermodynamic (CFD) Modeling One “Size/Standard” Facility Infrastructure Metric Does
“Not” Fit All! GREEN/LEED Considerations:
A) EPA Draft April 23, 2007 – Server and Data Center Efficiencies
High Density Computing Equipment and the Thermodynamic Evolution

6
Numerical Rankings Terminology Summary Definition
(1) Unreliable Shared building power and cooling; no generator
(2) Partially Isolated, Unreliable
Dedicated power system; shared cooling system; unconditioned power; non-redundant air conditioning; no generator
(3) Isolated Unreliable Dedicated power and cooling systems; unconditioned power; non-redundant dedicated air conditioning units; no generator
(4) Isolated Conditioned Dedicated power and cooling systems; conditioned power; non-redundant dedicated A/C units; no generator
(5) Isolated Improved Dedicated power and cooling systems; uninterruptible power system; non-redundant dedicated A/C units; no generator
(6) Isolated, Mostly Reliable
Dedicated power and cooling systems; uninterruptible power system; redundant dedicated A/C units; no generator
(7) Reliable Dedicated power and cooling systems; uninterruptible power system; redundant dedicated A/C units; generator
(8) Reliable Redundant Dedicated power and cooling systems; redundant UPS systems; redundant dedicated A/C units; redundant generators
(9) Ultra-Reliable Redundant power train; redundant cooling system; redundant UPS systems; redundant dedicated A/C units; redundant generator systems; redundant fuel system
(10) State of the Art
Redundant power train; redundant cooling system, redundant UPS systems, redundant dedicated A/C units; redundant generator systems; redundant fuel system; site hardened for weather and geographic exposures; location minimizes exposure to jurisdictional closure from hazardous spill, terrorism, or similar risks.
Data center facility infrastructure summary “reliability” rankings:
High Density Computing Equipment and the Thermodynamic Evolution
7
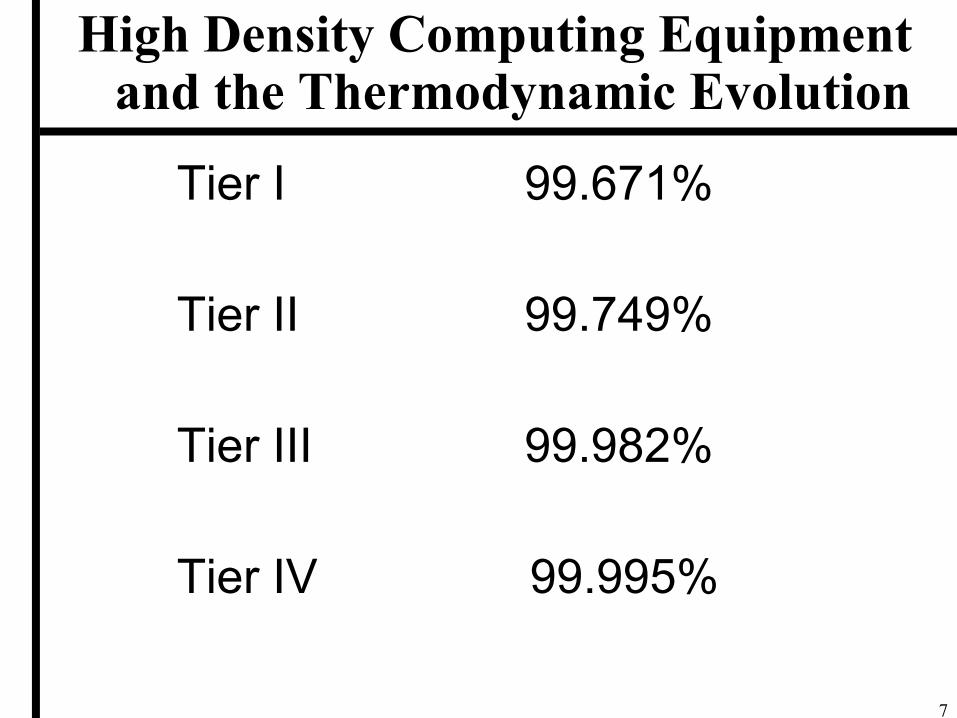
Tier I 99.671%
Tier II 99.749%
Tier III 99.982%
Tier IV 99.995%
High Density Computing Equipment and the Thermodynamic Evolution
8
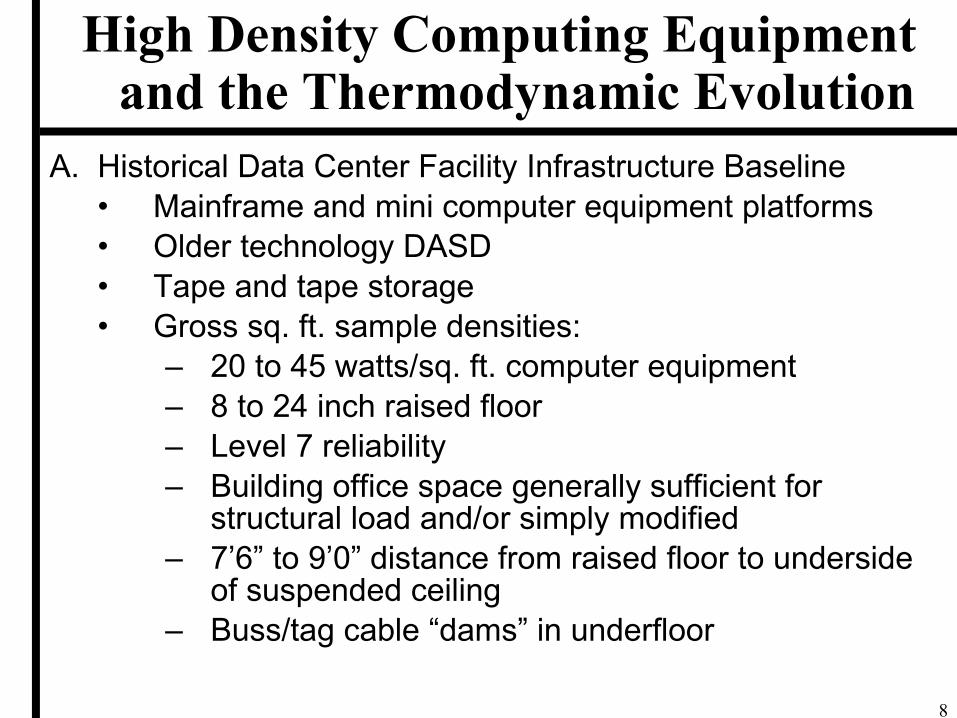
A. Historical Data Center Facility Infrastructure Baseline• Mainframe and mini computer equipment platforms• Older technology DASD• Tape and tape storage• Gross sq. ft. sample densities:
– 20 to 45 watts/sq. ft. computer equipment– 8 to 24 inch raised floor– Level 7 reliability– Building office space generally sufficient for
structural load and/or simply modified– 7’6” to 9’0” distance from raised floor to underside
of suspended ceiling– Buss/tag cable “dams” in underfloor
High Density Computing Equipment and the Thermodynamic Evolution

9
B. The Evolution of the Server, the Blade Server, and the Super Server• Stand alone• Rack mounted• Population growth• U vs. 2U v. 3U• Blade servers• The density of servers per rack – 1 kW to 24/41/72++ kW• The super server solution – announced
– 3000 lb. devices over a footprint of approximately 11 sq. ft. with a 30 kW demand and 67kBTU of heat rejection!
• Chilled water• Potential announcements of computer equipment
manufacturers of 50/60/70+ kw stand alone computer equipment devices. Announced 2007.
High Density Computing Equipment and the Thermodynamic Evolution
10
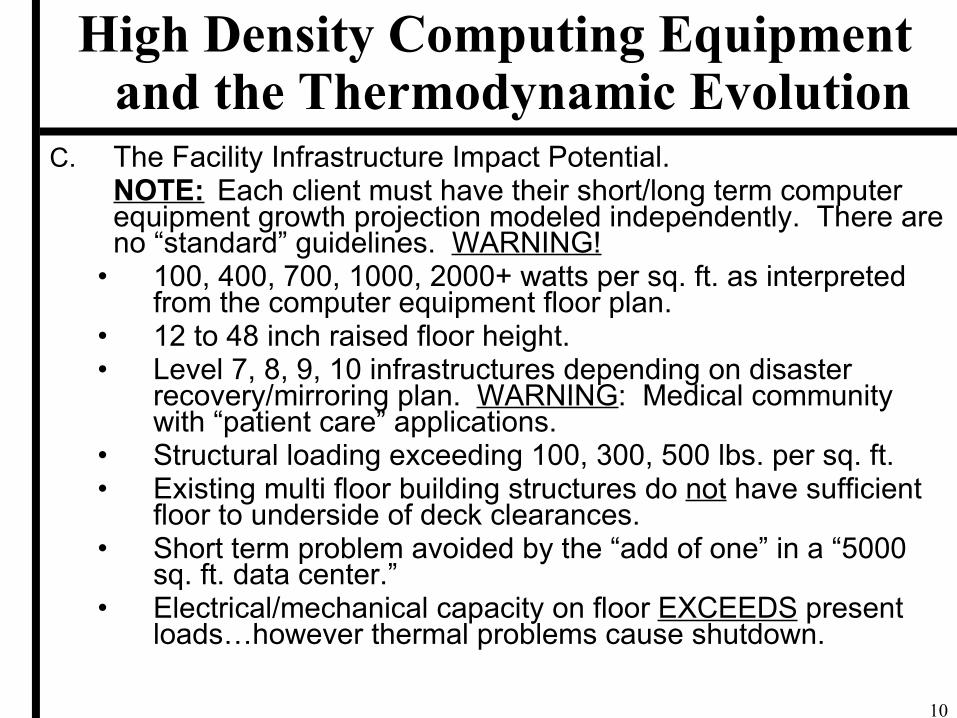
C. The Facility Infrastructure Impact Potential. NOTE: Each client must have their short/long term computer equipment growth projection modeled independently. There are no “standard” guidelines. WARNING!
• 100, 400, 700, 1000, 2000+ watts per sq. ft. as interpreted from the computer equipment floor plan.
• 12 to 48 inch raised floor height.• Level 7, 8, 9, 10 infrastructures depending on disaster
recovery/mirroring plan. WARNING: Medical community with “patient care” applications.
• Structural loading exceeding 100, 300, 500 lbs. per sq. ft.• Existing multi floor building structures do not have sufficient
floor to underside of deck clearances.• Short term problem avoided by the “add of one” in a “5000
sq. ft. data center.”• Electrical/mechanical capacity on floor EXCEEDS present
loads…however thermal problems cause shutdown.
High Density Computing Equipment and the Thermodynamic Evolution

11
– Rack Dissipation Air Side 7/12kW Nominal
– Impact Hot/Cold Aisles
– Impact Double Hot/Cold Aisles
– Air Side Stretch 4 – 22+ kW (cfd)
– Water Cooling
– Recirculation
– Warning: No Standard CFD Models Strongly
Recommended
High Density Computing Equipment and the Thermodynamic Evolution

12
Part II
High Density Impacts to Data Center Costs

13
One of the Most Dangerous/Variable Factors in Design/Building a Data Center in 2006 and Beyond
1980/1990 “Rules of Thumb” in “cost per sq. ft.” Danger
Same sq. ft. Data Center – ie: 5,000 sq. ft. – vary density, reliability, location, long term growth projection, scalability…$416 sq. ft. - $2,140 sq. ft.
The “Throw Away” Data Center The Gartner Mission The Scheduled Delivery?
High Density Impacts to Data Center Costs

14
The Blade Server Summit Conference Discussions of Manufacturers – Hardware (4/3/2/1)…..Facilities?
High Density Impacts to Data Center Costs
15
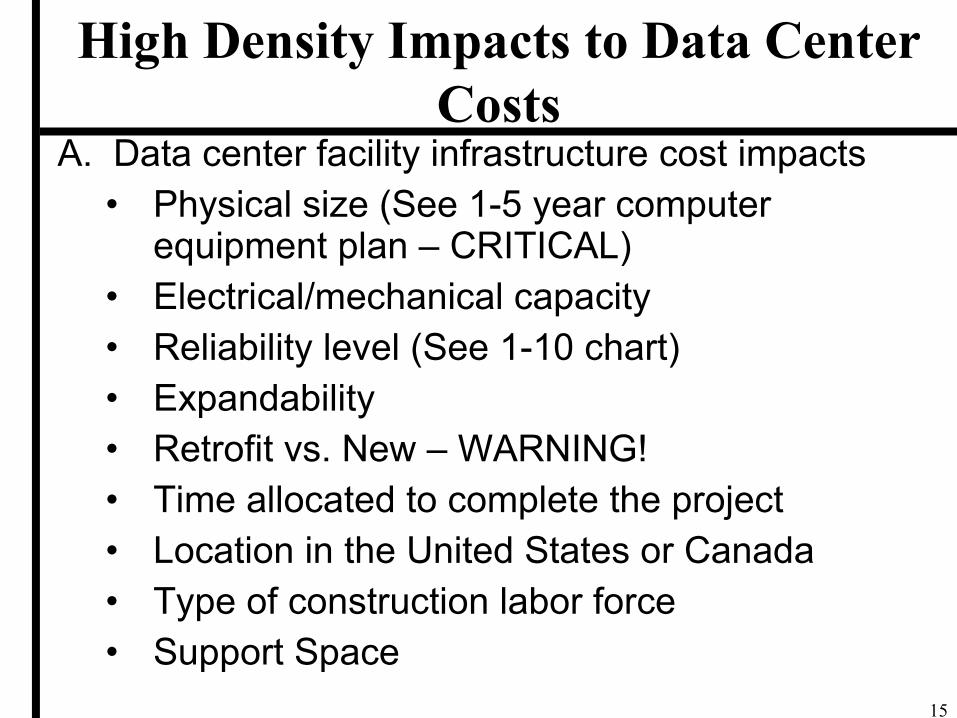
A. Data center facility infrastructure cost impacts• Physical size (See 1-5 year computer
equipment plan – CRITICAL)• Electrical/mechanical capacity• Reliability level (See 1-10 chart)• Expandability• Retrofit vs. New – WARNING!• Time allocated to complete the project• Location in the United States or Canada• Type of construction labor force• Support Space
High Density Impacts to Data Center Costs

16
Numerical Ranking Size (sq.ft.) Cost/sq.ft.10 15,000 $
1,000 $
7-9 15,000 $1,000 $
5-7 15,000 $1,000 $
1-5 15,000 $1,000 $
Office --------- $
B. Summary data center facility infrastructure cost experiences:
NOTE: These cost experiences are not intended to be used as detailed budgets * Electrical Density Cost differences per mw.
High Density Impacts to Data Center Costs
17
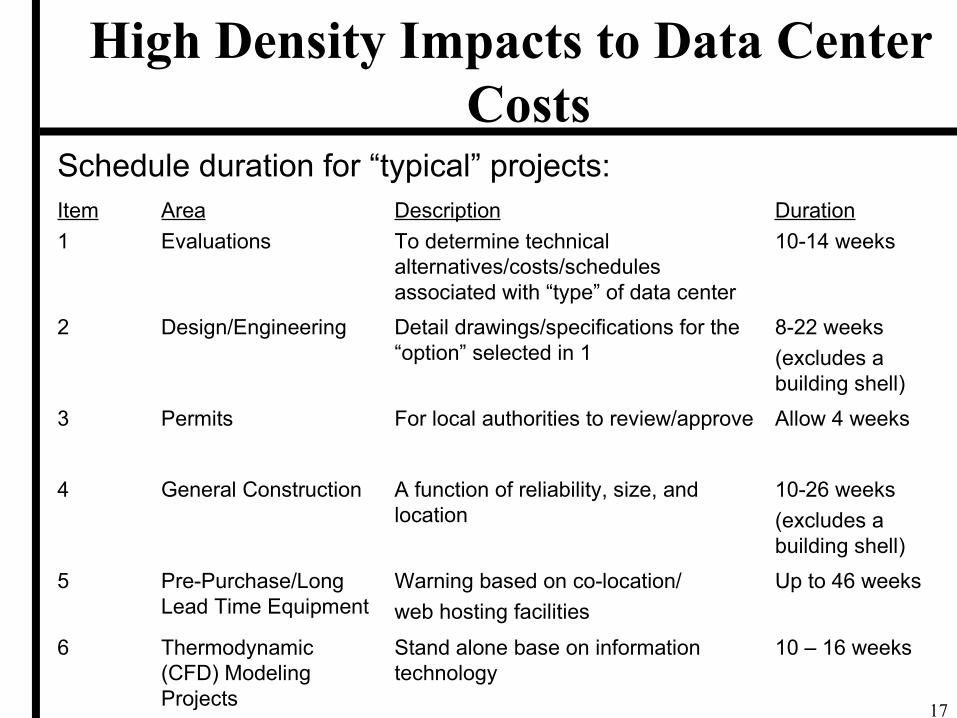
Item
1
Area
Evaluations
Description
To determine technical alternatives/costs/schedules associated with “type” of data center
Duration
10-14 weeks
2 Design/Engineering Detail drawings/specifications for the “option” selected in 1
8-22 weeks
(excludes a building shell)
3 Permits For local authorities to review/approve Allow 4 weeks
4 General Construction A function of reliability, size, and location
10-26 weeks
(excludes a building shell)
5 Pre-Purchase/Long Lead Time Equipment
Warning based on co-location/
web hosting facilities
Up to 46 weeks
6 Thermodynamic (CFD) Modeling Projects
Stand alone base on information technology
10 – 16 weeks
Schedule duration for “typical” projects:
High Density Impacts to Data Center Costs

18
Project Team
Client
Client Project Team
Project Director OEM Availability
Installation Planning Hardware/Software
Project Manager Design/Engineering
Project Manager Construction
Project Manager Communications
OEM Hardware Support
Computer Equipment Planning
Computer Equipment Migration
Software Planning CADD Manager
Civil/Structural
Electrical
Architectural
Mechanical/Fire Protection
Electrical/Mechanical
General
Disaster Recovery
Relocation/Move
Voice
Data
High Density Impacts to Data Center Costs
19
Part IIIThermodynamic Model Impacts
to the Data Center Designs/Retrofits
20
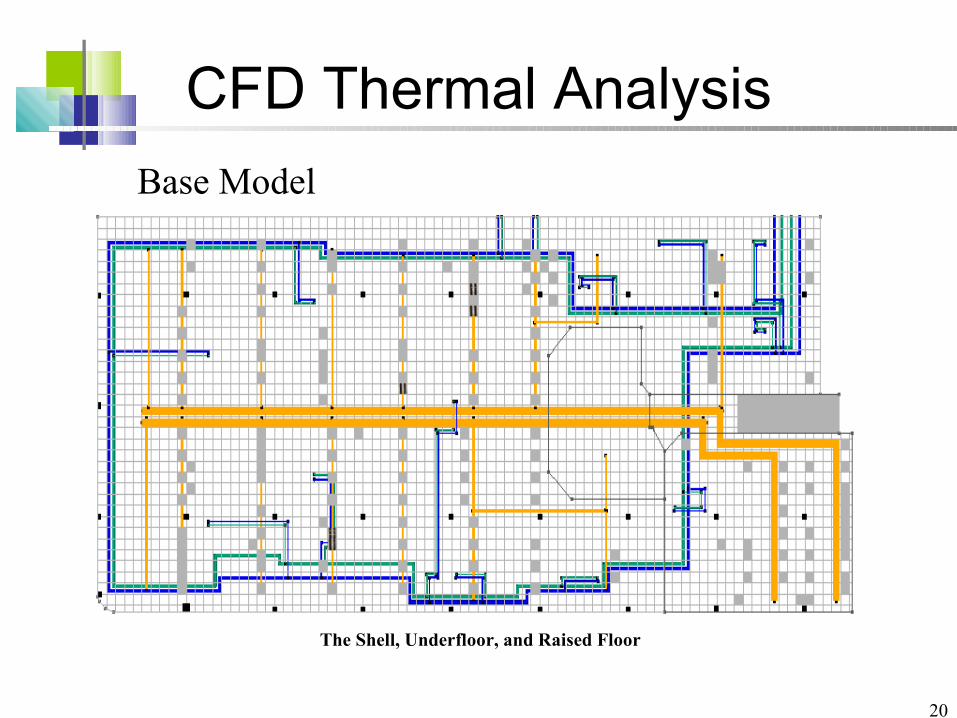
CFD Thermal Analysis
Base Model
The Shell, Underfloor, and Raised Floor

21
CFD Thermal Analysis
Base Model
The Shell, Floor, CRAC's, PDU's, and Equipment

22
CFD Thermal AnalysisBase Model
Equipment OrientationThe equipment orientation is shown as the intake side of the units being blue and the exhaust side being red. It can be seen that not all equipment is orientated in a hot and cold aisle configuration, and not all equipment within the same row is oriented in the same direction. There are some front to back oriented equipment racks as noted earlier. These racks will have a tendency to pull in hot exhaust air from the rack in front them.

23
CFD Thermal AnalysisBase Model
Equipment Powers
The equipment demand can be seen here in kW.

24
CFD Thermal AnalysisBase Model
Floor Void Pressures
The static pressure below the floor seems to be lacking in the majority of the data center. This is most likely resultant from the large unsealed cable cutouts throughout the raised floor area. The highest static pressure is seen in the corner of the data center with two (2) CRAC units operating with little load on them, and very few perforated tiles or cable cutouts.
25
CFD Thermal AnalysisBase Model
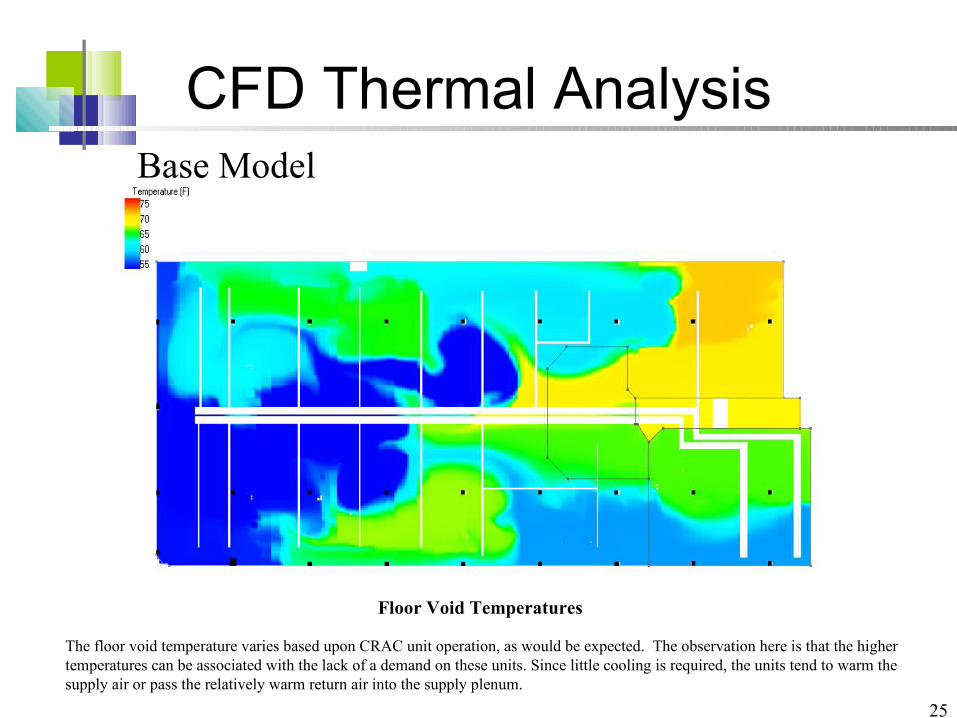
Floor Void Temperatures
The floor void temperature varies based upon CRAC unit operation, as would be expected. The observation here is that the higher temperatures can be associated with the lack of a demand on these units. Since little cooling is required, the units tend to warm the supply air or pass the relatively warm return air into the supply plenum.

26
CFD Thermal AnalysisBase Model
Perforated Tile Flow Rates
The airflow through most of the perforated tiles is relatively low though uniform. This can be attributed to the majority of the air escaping through the cable cutouts.

27
CFD Thermal AnalysisBase Model
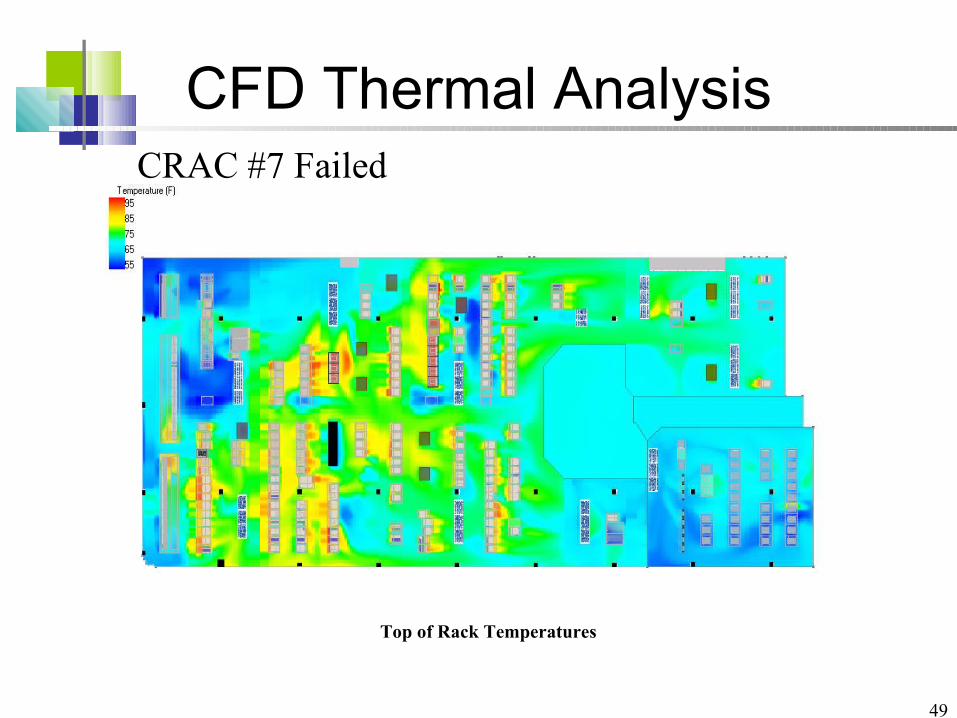
Top of Rack Temperatures
The top of the equipment rack is typically where the highest intake temperatures are seen in the data center. This is a result of this part of the rack receiving less supply air from the underfloor plenum, the higher ambient temperatures at this level of the room, or the recirculation of hot air due to low ceiling heights. It can also be seen that some cold air is being returned to the CRAC units while warm air is being exhausted into the intake of other equipment. Some short cycling is occurring where perforated tile placement allows colder air to return to the CRAC units.

28
CFD Thermal AnalysisBase Model
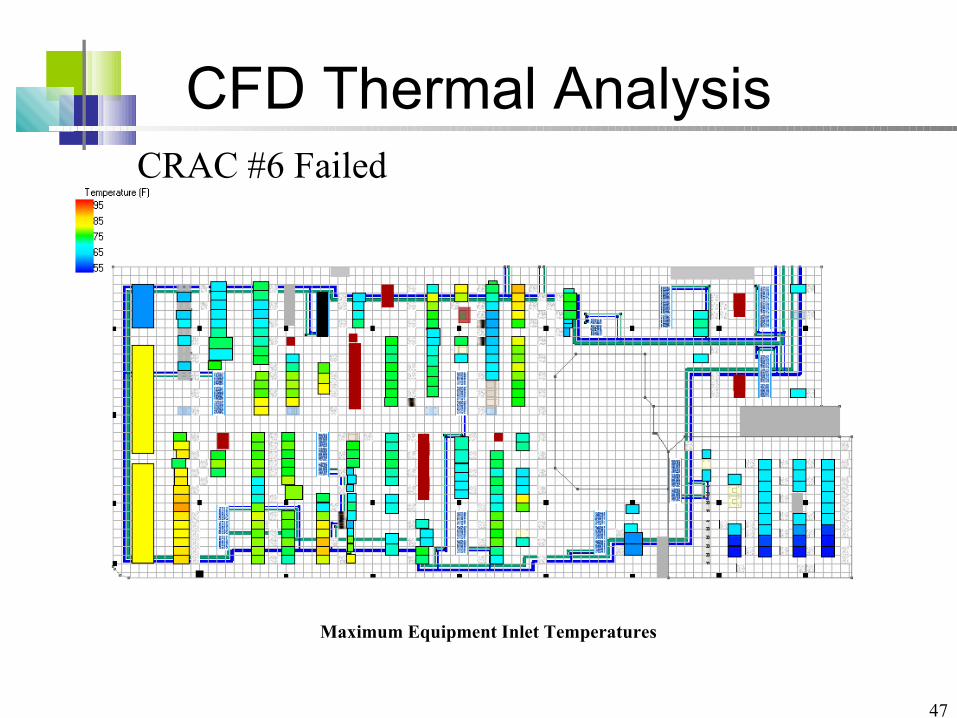
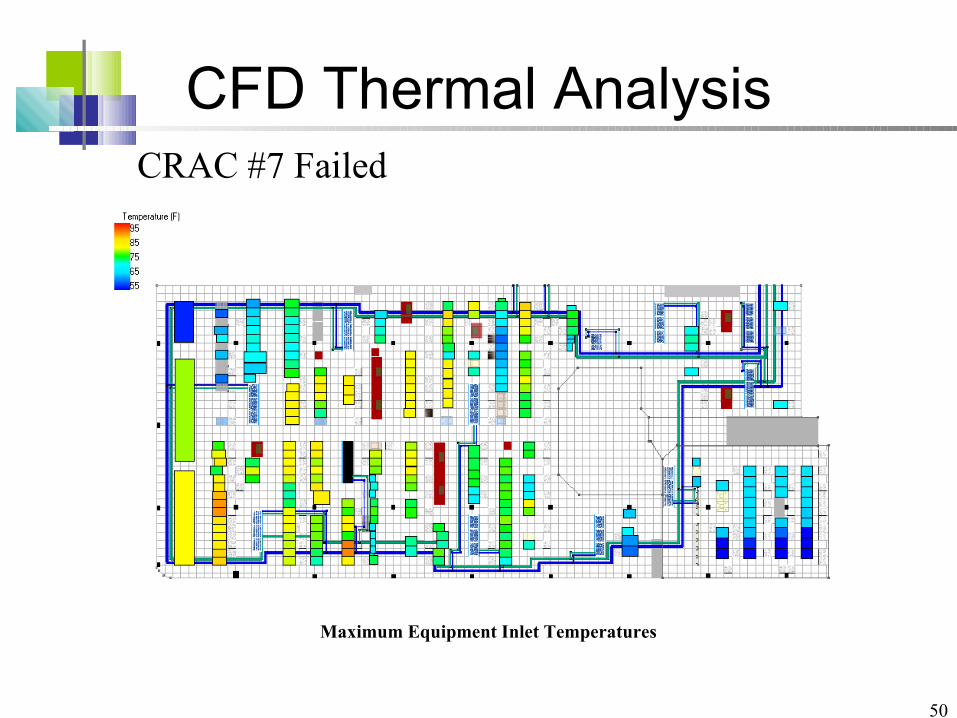
Maximum Equipment Inlet Temperatures
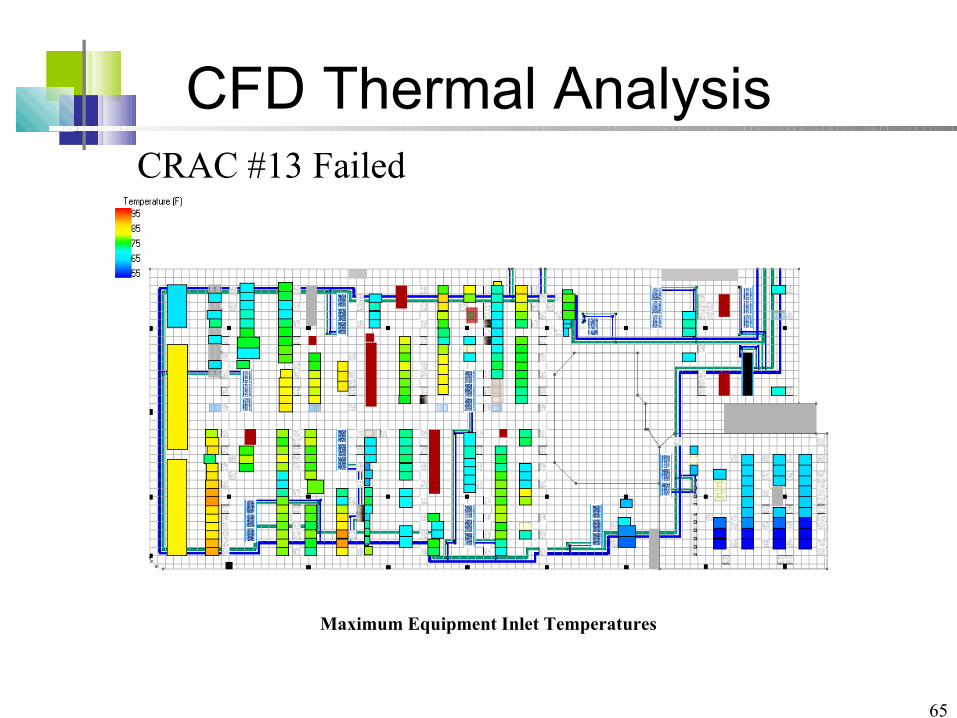
The ASHRAE recommended inlet temperature for computer equipment is between 68 and 77 deg F. This temperature is exceeded in several areas shown as green and yellow. These temperatures however are still within the allowable ASHRAE range of 59 to 90 deg F.

29
CFD Thermal AnalysisBase Model
Potential Equipment Overheat
This indicates which racks may be at risk of thermal failures due to high intake temperatures. The specific rack configurations may negate such risk if no devices are installed in the top of the rack or if devices such as patch panels are installed at the top of the racks.
30
CFD Thermal AnalysisBase Model
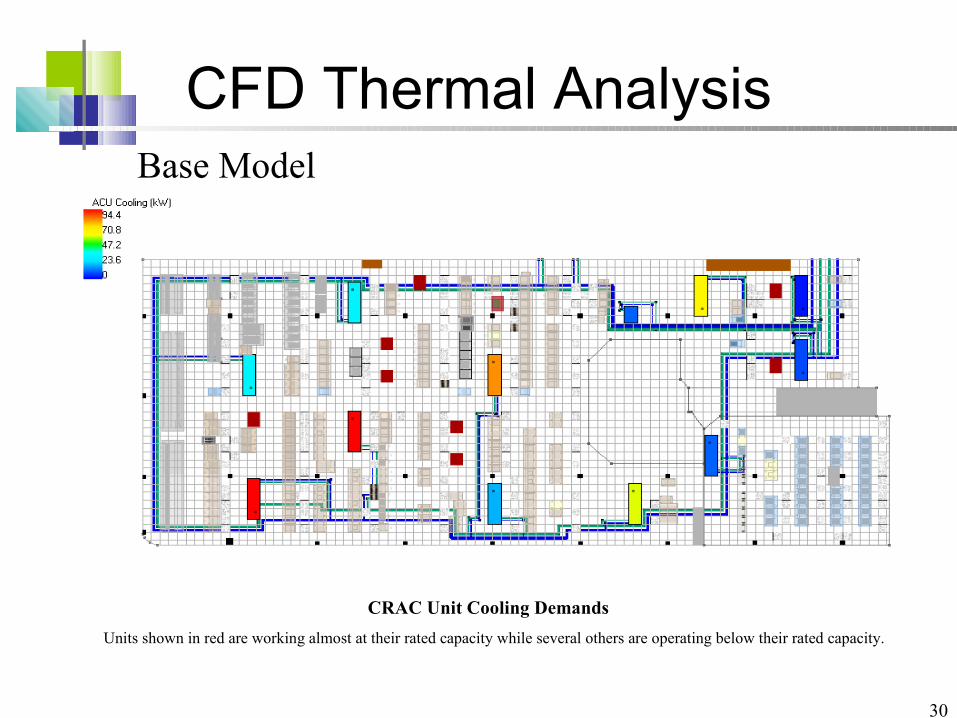
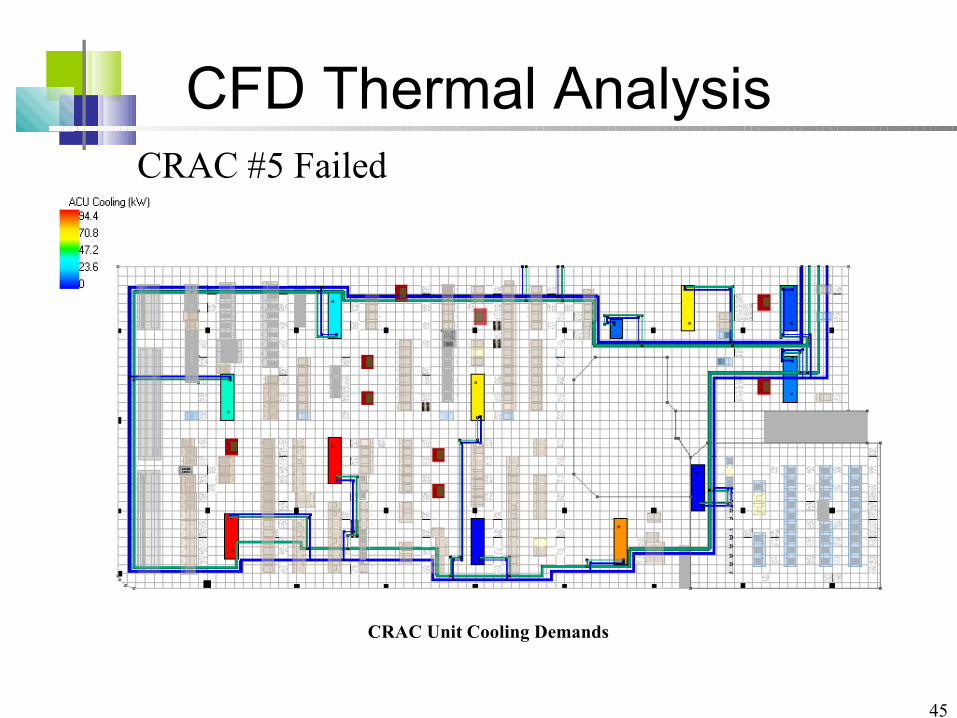
CRAC Unit Cooling Demands
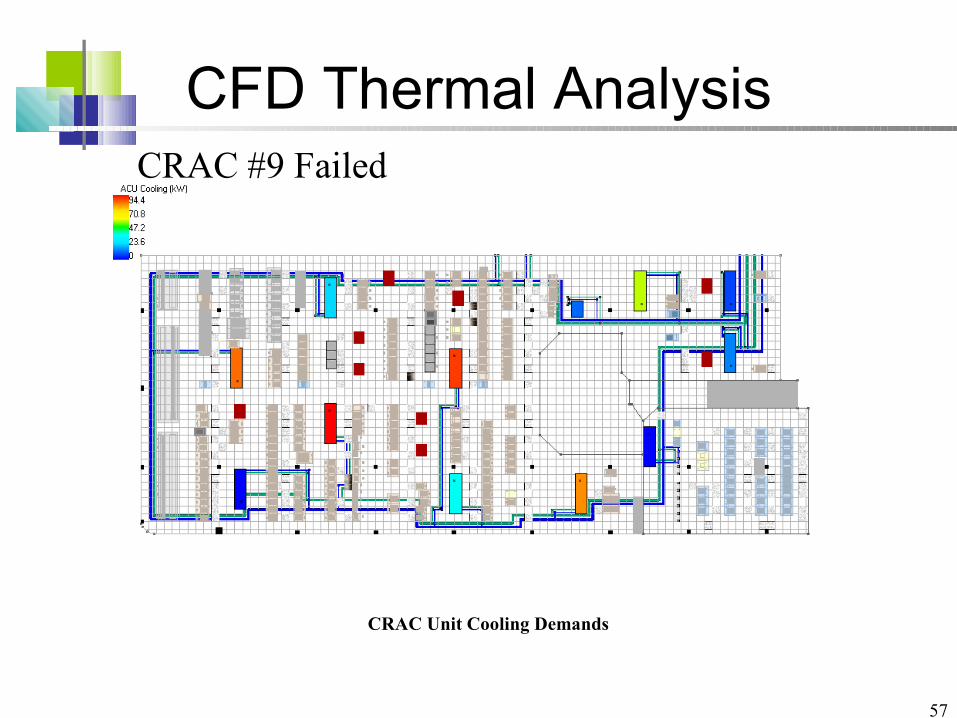
Units shown in red are working almost at their rated capacity while several others are operating below their rated capacity.

31
CFD Thermal AnalysisCRAC #1 Failed
Top of Rack Temperatures
The overall temperature does not change significantly from the failure of CRAC #1. This unit is located in the Network Room and the installed transfer fans adequately support the ventilation needs of the space.

32
CFD Thermal AnalysisCRAC #1 Failed
Maximum Equipment Inlet Temperatures
The inlet temperatures actually decrease during this failure. This is because the CRAC units in the data center work harder to compensate for the additional heat being transferred from the Network Room.
33
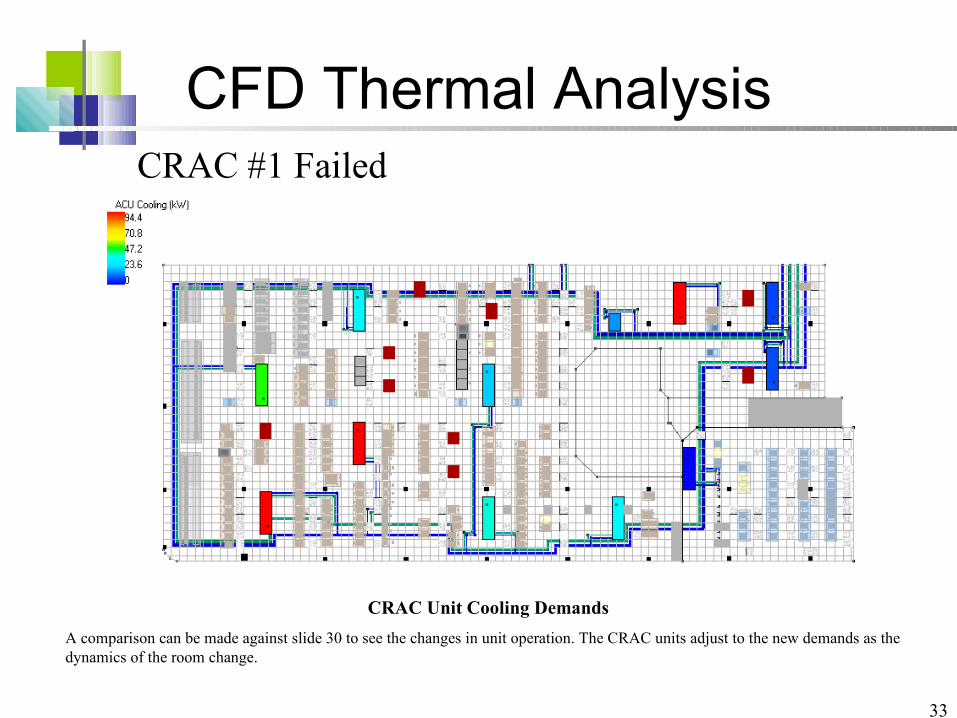
CFD Thermal AnalysisCRAC #1 Failed
CRAC Unit Cooling Demands
A comparison can be made against slide 30 to see the changes in unit operation. The CRAC units adjust to the new demands as the dynamics of the room change.

34
CFD Thermal AnalysisCRAC #2 Failed
Top of Rack Temperatures

35
CFD Thermal AnalysisCRAC #2 Failed
Maximum Equipment Inlet Temperatures

36
CFD Thermal AnalysisCRAC #2 Failed
CRAC Unit Cooling Demands

37
CFD Thermal AnalysisCRAC #3 Failed
Top of Rack Temperatures
38
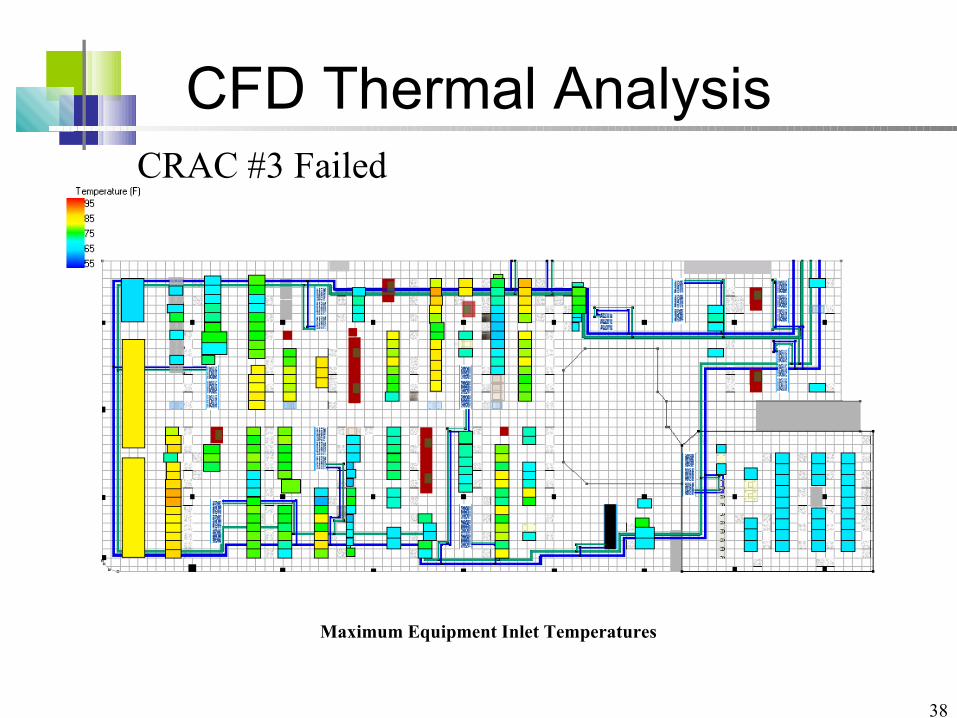
CFD Thermal AnalysisCRAC #3 Failed
Maximum Equipment Inlet Temperatures

39
CFD Thermal AnalysisCRAC #3 Failed
CRAC Unit Cooling Demands

40
CFD Thermal AnalysisCRAC #4 Failed
Top of Rack Temperatures
41
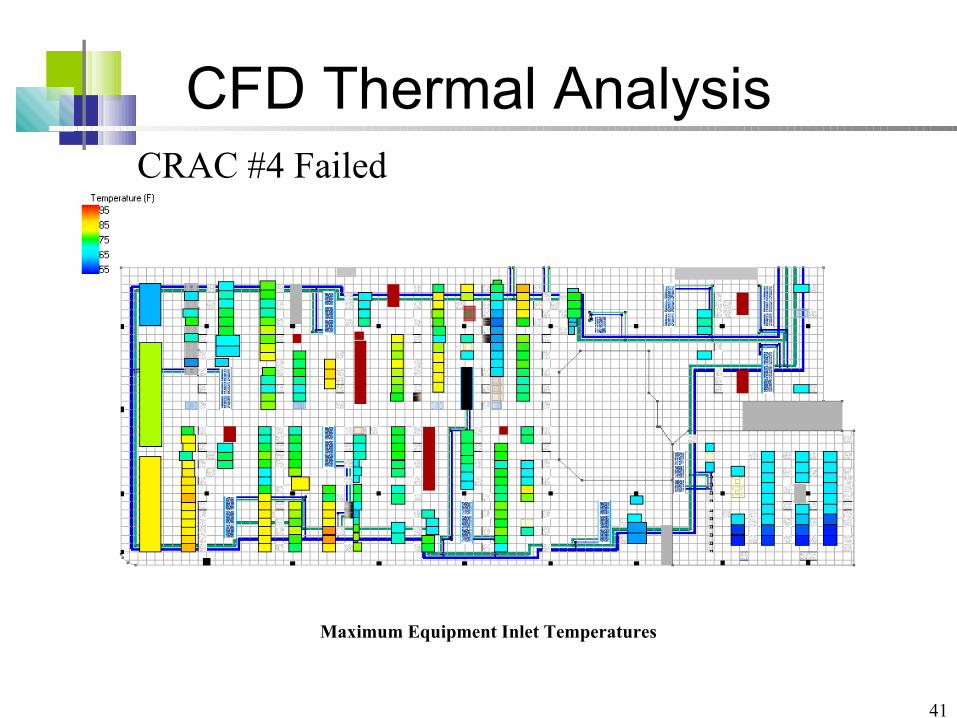
CFD Thermal AnalysisCRAC #4 Failed
Maximum Equipment Inlet Temperatures

42
CFD Thermal AnalysisCRAC #4 Failed
CRAC Unit Cooling Demands

43
CFD Thermal AnalysisCRAC #5 Failed
Top of Rack Temperatures
44
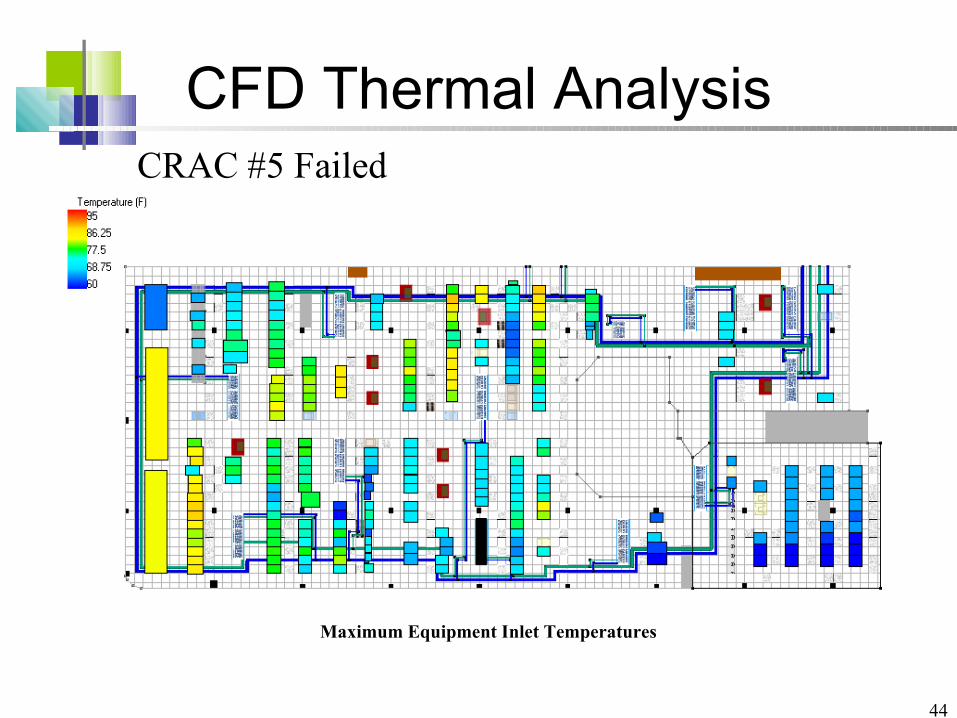
CFD Thermal AnalysisCRAC #5 Failed
Maximum Equipment Inlet Temperatures
45
CFD Thermal AnalysisCRAC #5 Failed
CRAC Unit Cooling Demands

46
CFD Thermal AnalysisCRAC #6 Failed
Top of Rack Temperatures
47
CFD Thermal AnalysisCRAC #6 Failed
Maximum Equipment Inlet Temperatures

48
CFD Thermal AnalysisCRAC #6 Failed
CRAC Unit Cooling Demands
49
CFD Thermal AnalysisCRAC #7 Failed
Top of Rack Temperatures
50
CFD Thermal AnalysisCRAC #7 Failed
Maximum Equipment Inlet Temperatures

51
CFD Thermal AnalysisCRAC #7 Failed
CRAC Unit Cooling Demands

52
CFD Thermal AnalysisCRAC #8 Failed
Top of Rack Temperatures

53
CFD Thermal AnalysisCRAC #8 Failed
Maximum Equipment Inlet Temperatures

54
CFD Thermal AnalysisCRAC #8 Failed
CRAC Unit Cooling Demands

55
CFD Thermal AnalysisCRAC #9 Failed
Top of Rack Temperatures
The failure of this unit has the most significant effect in the data center. Several equipment racks have exceeded the recommended maximum intake temperatures due to the elevated ambient temperatures in this area of the room. Due to the air patterns in the room the adjacent CRAC units cannot compensate for the loss of this unit.

56
CFD Thermal AnalysisCRAC #9 Failed
Maximum Equipment Inlet Temperatures
57
CFD Thermal AnalysisCRAC #9 Failed
CRAC Unit Cooling Demands
58
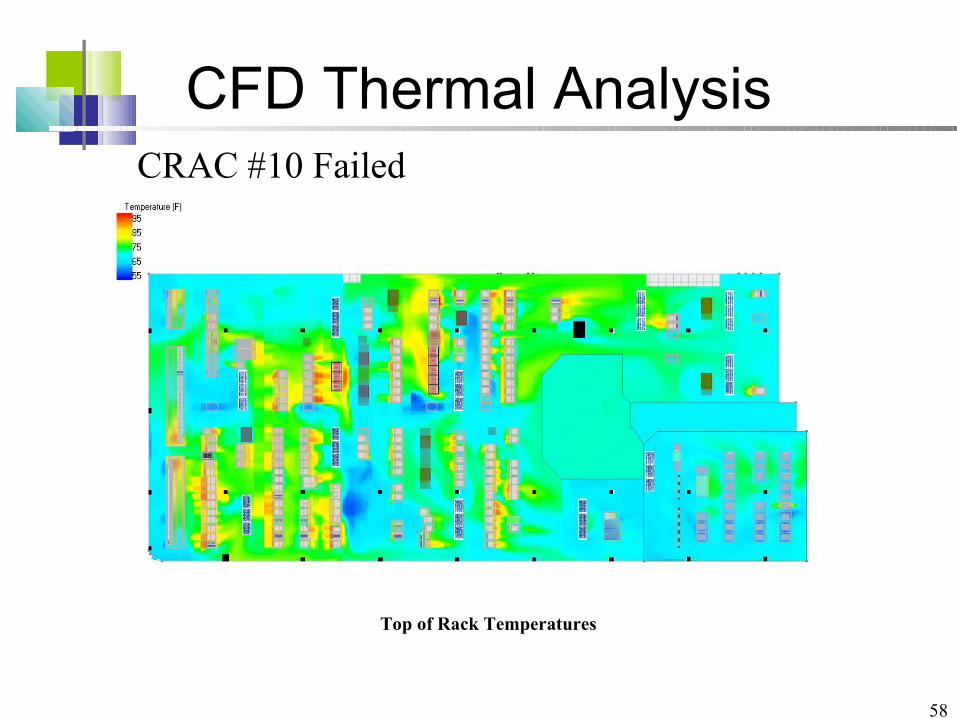
CFD Thermal AnalysisCRAC #10 Failed
Top of Rack Temperatures

59
CFD Thermal AnalysisCRAC #10 Failed
Maximum Equipment Inlet Temperatures

60
CFD Thermal AnalysisCRAC #10 Failed
CRAC Unit Cooling Demands

61
CFD Thermal AnalysisCRAC #12 Failed
Top of Rack Temperatures

62
CFD Thermal AnalysisCRAC #12 Failed
Maximum Equipment Inlet Temperatures

63
CFD Thermal AnalysisCRAC #12 Failed
CRAC Unit Cooling Demands

64
CFD Thermal AnalysisCRAC #13 Failed
Top of Rack Temperatures
65
CFD Thermal AnalysisCRAC #13 Failed
Maximum Equipment Inlet Temperatures

66
CFD Thermal AnalysisCRAC #13 Failed
CRAC Unit Cooling Demands

67
CFD Thermal AnalysisCRAC #9 Supplement
Top of Rack Temperatures
A supplemental unit is added in the area of CRAC #9 to compensate for the loss of that unit. While the new unit does help it does not alleviate all of the potential problems. Plenum extensions were added to selected units to help reduce the short cycling that was encountered due to perforated tiles being located in the hot aisles replacement to CRAC placement.
68
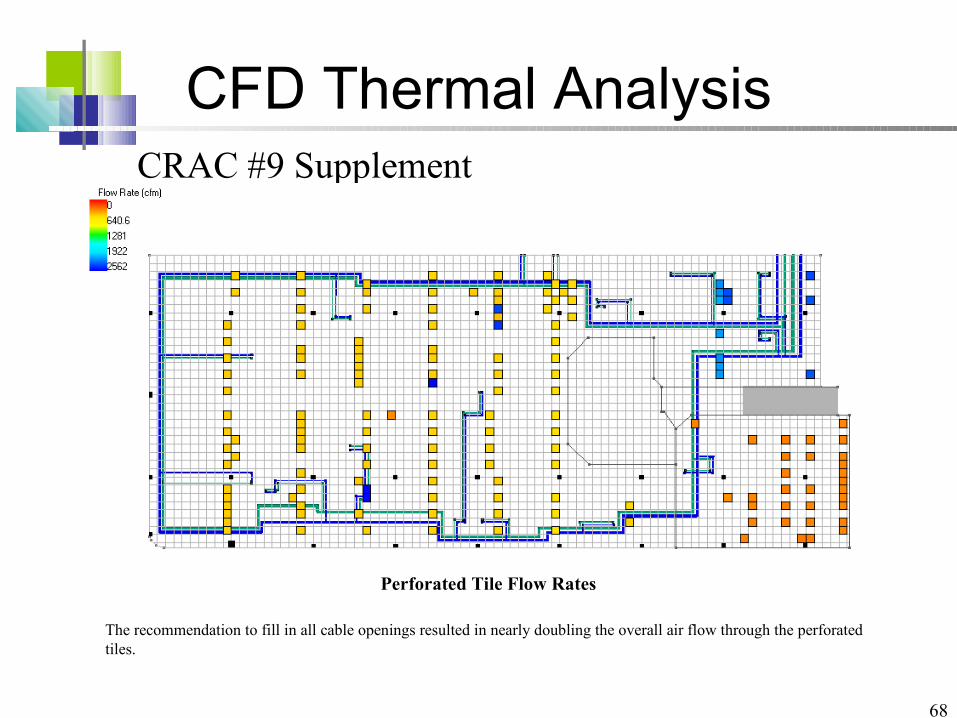
CFD Thermal AnalysisCRAC #9 Supplement
Perforated Tile Flow Rates
The recommendation to fill in all cable openings resulted in nearly doubling the overall air flow through the perforated tiles.
69
CFD Thermal AnalysisCRAC #9 Supplement
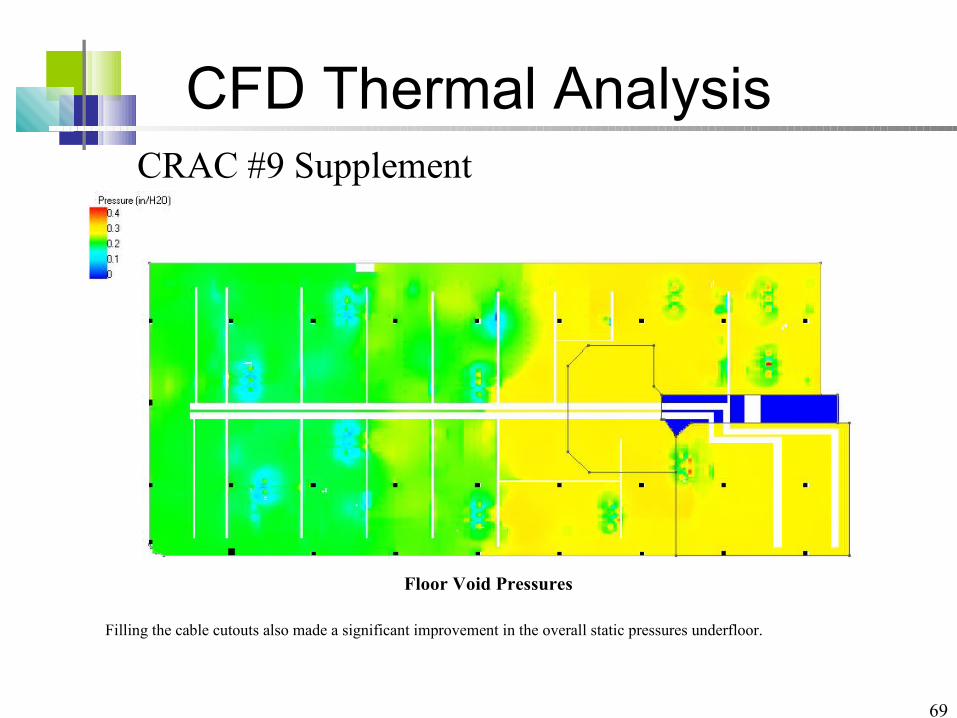
Floor Void Pressures
Filling the cable cutouts also made a significant improvement in the overall static pressures underfloor.
70
CFD Thermal AnalysisCRAC #9 Supplement
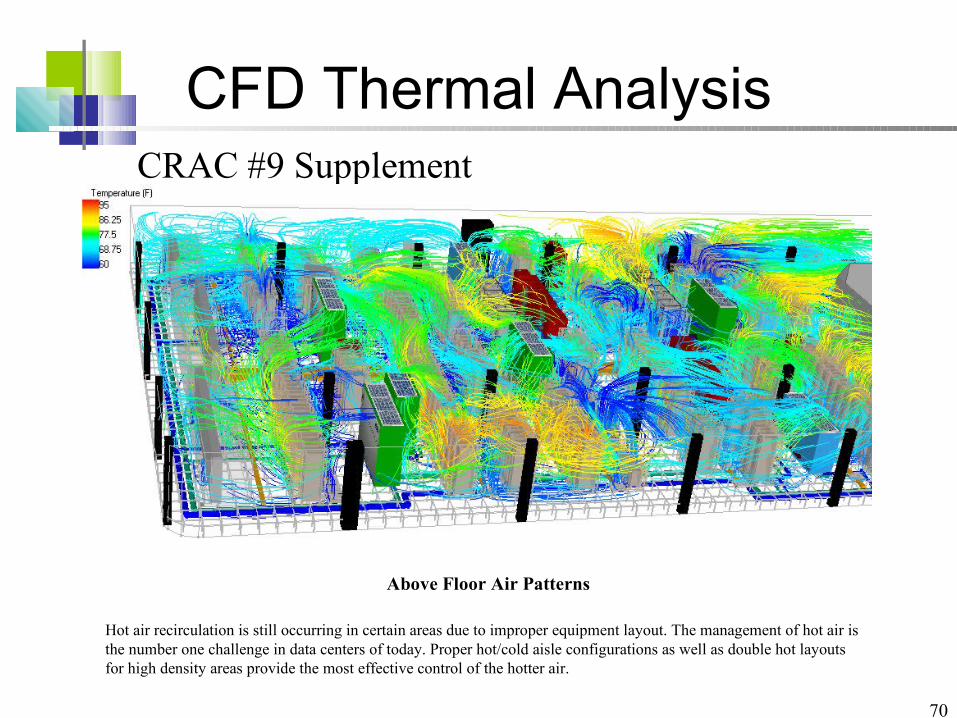
Above Floor Air Patterns
Hot air recirculation is still occurring in certain areas due to improper equipment layout. The management of hot air is the number one challenge in data centers of today. Proper hot/cold aisle configurations as well as double hot layouts for high density areas provide the most effective control of the hotter air.

71
Questions and AnswersGeneral Discussion
Mark S. Evanko888-704-1400
www.bruns-pak.com
Part IV