download working paper pdf - institute for policy research
TRANSCRIPT
2040 Sheridan Rd. w Evanston, IL 60208-4100 w Tel: 847-491-3395 Fax: 847-491-9916 www.ipr.northwestern.edu w [email protected]
Institute for Policy Research Northwestern University Working Paper Series
WP-13-03
Political Participation by Wealthy Americans
Fay Lomax Cook
Professor of Human Development and Social Policy Faculty Fellow, Institute for Policy Research
Northwestern University
Benjamin I. Page
Gordon S. Fulcher Professor of Decision Making Faculty Associate, Institute for Policy Research
Northwestern University
Rachel Moskowitz PhD Candidate, Political Science
Graduate Research Assistant, Institute for Policy Research Northwestern University
Version: April 2013
DRAFT
Please do not quote or distribute without permission.
Abstract
Although we know that Americans with higher incomes tend to participate more actively
in politics, little is known about the really wealthy. Data from a special survey of the top
1 percent of U.S. wealth holders and from a general population survey indicate that
wealthy Americans are far more active in politics than average citizens. In most respects
they are also substantially more active than the merely “affluent” people (with incomes of
$150,000 and above) found at the upper end of general population surveys. The
frequency with which wealthy Americans attend meetings, pay attention to politics, and
volunteer for political organizations is about twice as high as the frequency among the
merely affluent. Many contribute large amounts of money to politics. One-fifth reported
“bundling” others’ contributions. Many initiate contacts with public officials, especially
their own and others’ Senators and Representatives. Implications for democratic
policymaking are briefly discussed.
1
As is well known, Americans with higher incomes tend to participate more actively in
politics than lower-income citizens do. They more frequently turn out to vote, engage in
political discussions, attend campaign events, contribute money, contact public officials, and the
like (Verba, Schlozman, and Brady 1995; Schlozman, Verba, and Brady, 2012).1
But research to date has only examined the moderately affluent respondents reached by
surveys of the general public. What about really wealthy Americans, with incomes or wealth in
the top 1%? Do they – as resource-based theories would suggest – participate at still higher
levels than the merely affluent? Do they often initiate contacts with high-level government
officials? If so, about what? Do they mostly pursue matters of narrow economic self-interest?
Or do they try to further the common good (as they see it), communicating about issues of broad
public concern? Answers to these questions may have some bearing on the workings or non-
workings of democratic politics.
Standard surveys of the general public cannot provide answers, because a survey of a
random sample of 1000 or 1500 respondents typically reaches no more than 10 or 15 people in
the top 1% of U.S. income earners. One could not infer anything directly from so few cases, and
it is usually impossible even to identify which cases they are, since they are generally lumped
together with somewhat lower-income respondents into a broad “top-coded” income category.2
Specially designed surveys are required. But such surveys have been rare. It is
extremely difficult and expensive to identify, contact, and interview wealthy Americans, who 1 The authors are indebted to Eric Wanner and the Russell Sage Foundation for funding the
2 Thus the income “top coding” problem, which makes it difficult to identify very-high-income
respondents, generally prevents combining small numbers of them from each of several surveys.
But see Page and Hennessy (2011).
2
tend to be very busy, to cherish their privacy, and to employ professional gatekeepers to keep
survey researchers and other intruders at bay. In this article we offer some data based on a small
survey in the Chicago metropolitan area, the first survey to investigate the political behavior of a
representative sample of the top 1% of U.S. wealth-holders. We compare the participation levels
of truly wealthy Americans to those of the public in general as well as to those who can be
classified as “affluent.”3
Data: The SESA Study and the Pew Internet and American Life Project
Our data come from two surveys. The first is a small (n=104), Chicago-area study, the
Survey of Economically Successful Americans and the Common Good (“SESA”), conducted
from February 27 to June 6, 2011, by NORC at the University of Chicago with funding from the
Russell Sage Foundation. The purposes of the survey were both substantive – to learn about the
political attitudes and behavior of really wealthy Americans – and methodological, to see
whether vexing problems of sampling, contacting, and interviewing the wealthy could be dealt
with. The methodological effort was successful (though very difficult and expensive; for details,
see Page, Bartels, and Seawright 2011). The substantive findings are quite suggestive – though
of course not conclusive – of what might be found nationally. These data on top wealth holders
are the best available and are likely to remain so, unless and until a national study (a very major
undertaking) can be conducted. 3 Although some may see the terms “affluent” and “wealthy” as synonymous, economists are
beginning to make distinctions, as David Leonhardt (2010) captured in a New York Times
column titled “Merely Affluent versus Truly Rich.” Swank (2008) writes that “The richest of
Americans are defined as the wealthy. They are the top 1% ...”

3
Identifying who is wealthy is a very difficult task. One needs a list of households
believed to be wealthy, along with contact information, before one can sample potential
respondents from the list. The most reliable lists – based on wealth estimates derived from
income tax returns – are provided by the Internal Revenue Service to the Federal Reserve Board,
in order to carry out the Survey of Consumer Finances (SCF). But these lists are not available to
private researchers. In order to develop a sample for SESA, NORC statisticians used the
imperfect but commercially available WealthFinder “rank A” list of roughly the top 4% of U.S.
wealth-holding households (wealth estimates were based on publicly available data),
supplemented by the ExecuReach list of business executives. Both lists were further refined
using individual-level data on the finances of listed households (home value, income-producing
assets, position in and size of business, and the like), to identify those likely to fall among the
wealthiest 1%.
NORC, along with our academic team, used this sampling frame to randomly draw a
representative sample of wealthy people from four communities in the Chicago metropolitan
area, including the city itself, affluent Western suburbs, and the affluent North Shore. Our over-
all response rate – in the most demanding sense, the proportion of eligible, sampled potential
respondents that actually completed interviews – was 37 percent, a remarkably high figure for
this sort of very elite population. We guarded against self-selection bias, such as a tilt toward the
politically active among those who took part in the survey, by carefully designing promotional
materials to emphasize that we wanted to learn how and why they achieved economic success,
what lessons they might offer to others, and what charitable and philanthropic activities they

4
have engaged in.4 In this paper we present data on the 83 households interviewed using our
refined, most representative sampling scheme.5
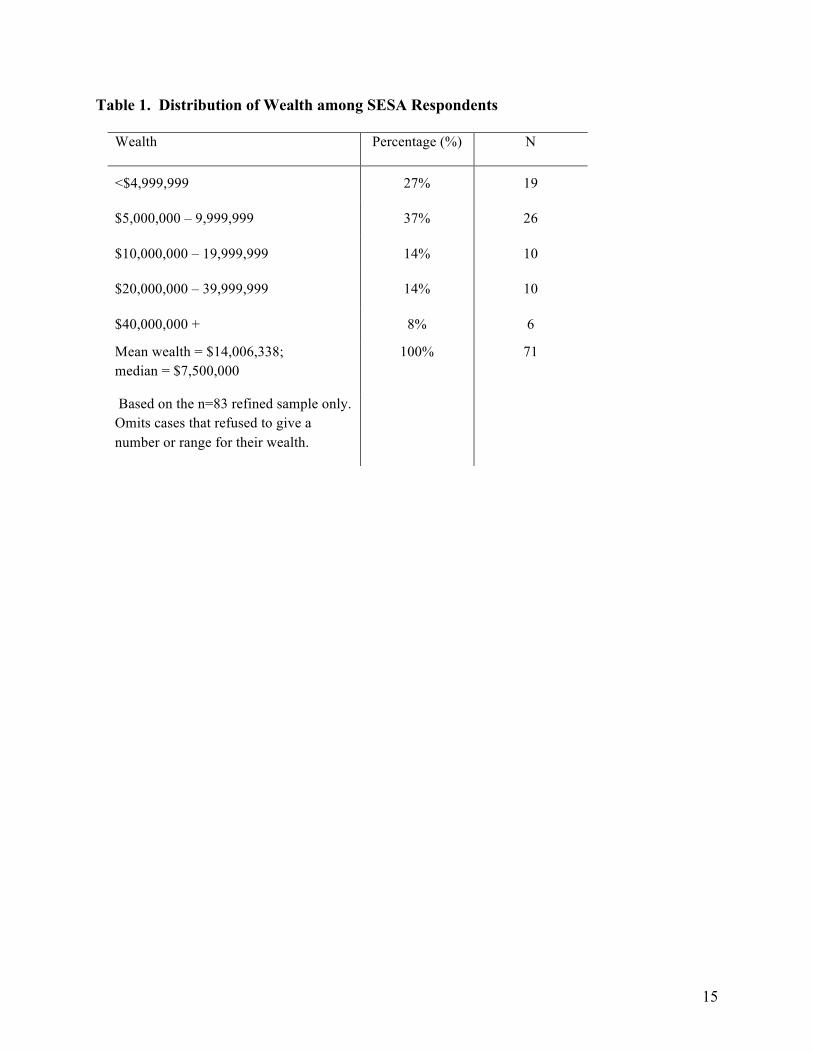
The distribution of wealth among our respondents is given in Table 1. Most respondents
fall in or near the top 1% of U.S. wealth-holders, and a fair number are in the top 0.5%. The
average (mean) wealth is about $14 million, with a median of $7.5 million.6 The people in our
sample are not ultra-rich; that is, their net worth falls far below the more than $1 billion
necessary to make the Forbes 400 list of the very wealthiest Americans in 2011. But to our
knowledge ours is the wealthiest representative sample whose political behavior has yet been
studied.
[Insert Table 1 about here]
4 In promotional materials and the survey itself, questions about respondents’ economic
successes and their philanthropic activities were emphasized and were placed before any
discussion of politics. For example, the first two question batteries asked how important each of
a list of factors was – for themselves and for others – in achieving economic success (e.g., hard
work, luck, sacrifice, planning, etc.).
5 A total of 104 respondents were interviewed for SESA. Many of the first 21, however, who
were selected from the WealthFinder “rank A” list by an early, unrefined sampling scheme, fell
below our target of the top 1% of wealth holders. They are useful for comparative and
correlational purposes but would distort the representativeness of results if they were included in
the computation of marginal frequencies.
6 Despite our best efforts, twelve respondents refused to give even a rough range for their
household wealth. They are excluded from Table 1.
5
In order to compare the political participation and civic engagement of the wealthy to that
of the general public, especially the affluent among the general public, we present data from a
second survey – the Pew Internet and American Life Project (Smith, Schlozman, Verba and
Brady 2009). This is a followup to the 1990 Citizen Participation Study (Verba, Schlozman,
Brady, and Nie 1990); it includes many of the same questions plus new questions about political
uses of the Internet.7 The Pew survey was conducted by telephone between August 12 and
August 31, 2008, based on a sample of landline telephones. It included 2,251 adult respondents
aged 18 and over, of whom 1,655 were Internet users. The final response rate was 22%.
Findings: Voting, campaigning, and contributing by the wealthy
According to our data, wealthy Americans tend to be very active in politics: far more so
than the average citizen, and considerably more so than the merely affluent people found at the
upper end of general-population surveys. As Table 2 shows, nearly all our wealthy respondents
said they voted in the 2008 presidential election. A very large majority (84%) said they pay
attention to politics “most of the time,” and two fifths said they talk politics every day. (Several
commented, “all the time!”) Their attendance at a campaign speech or meeting (41%), and the
7 These same data are used in Schlozman, Verba, and Brady (2012), where income and education
are combined to divide respondents into SES quintiles. We reanalyzed the Pew data and divided
the higher-income respondents into those with incomes of $75,000 to $149,000, and the quite
affluent with incomes of $150,000 and above (roughly the top 7 or 8 % of the U.S. population in
2008 when the survey was conducted; $150,000 and above was the top income category from
which respondents could choose).
6
frequency with which they have contributed money to a political party or candidate or other
political cause in the last three or four years (60%), are high as well.
(Table 2 about here)
How different are these levels of participation from those of the general public?
Comparing the wealthy SESA respondents to members of the general public interviewed in the
Pew Internet and American Life Survey (column 2), the differences are dramatic. By several
measures, wealthy Americans participate politically at two or three times the rate of members of
the general public. For example, whereas 60% of wealthy Americans contributed money
politically, only 18% of the public at large contributed. And while 84% of wealthy Americans
said they attend to politics most of the time, only 26% of the general public did.8 By every
measure we examined – including attending political meetings, belonging to political
organizations, and volunteering for political organizations – much higher proportions of wealthy
Americans than of ordinary citizens are politically engaged.
The last five columns in Table 2 break down the participation levels of the general public
by income, using five categories that run from under $30,000 to over $150,000. The $150,000+
top-coded category (the top 5% of income-earners in the Pew sample, representing the top 7 or
8% in the population as a whole) is quite high by the usual standards of general-population
surveys. Yet by contrast our wealthy respondents reported a median income of $500,000 and a
mean of $1,040,000. Just as found by Scholzman, Verba, and Brady (2012), political
participation increases with income for almost every type of political activity, from voting to
volunteering for political organizations. What we add to this picture is the finding that even 8 As indicated in Table 2, all the data for the general public come from the Pew survey except
“voted in 2008” and “attend to politics most of the time” which we took from the ANES.

7
higher percentages of truly wealthy Americans participate politically than do those who are just
affluent. (Compare the first and last columns of Table 2.) In several cases – attending meetings,
paying attention to politics, and volunteering for political organizations – the wealthy are about
twice as active as the merely affluent. According to only one measure – belonging to a political
organization – do affluent Americans reach the same level of political activity as our wealthy
respondents.
Especially notable is the role of the wealthy in giving political money. On average, our
wealthy respondents each reported giving a very substantial $4,633 to political campaigns and
organizations in the past twelve months. Remarkably, one fifth (20%) of them reported
soliciting or “bundling” contributions from other people to a party or candidate or political cause.
As we know from media reports, since the Supreme Court’s Citizens United decision a handful
of extremely wealthy individuals have each invested many millions of dollars in political
campaigns.9 Money giving – which is easiest for people with a lot of money – may be the area
of political activity in which wealthy Americans have the biggest comparative advantage over
their fellow citizens.
High-level political contacts. We asked our SESA interviewees whether or not they
had initiated a contact with each of six types of federal government officials or their staffs in the
past six months. As can be seen in Table 3, about half said they had contacted at least one type
9 Data collected by Richard L. Hasen (2012) show that total outside spending on electoral
campaigns exploded after the Citizens United decision. In 2010, outside spending totaled $15.9
million, compared with $1.8 million in the previous (2006) midterm cycle. At the time of Hansen’s
research early in 2012, campaign spending was $88 million in comparison to $37.5 million at the same
point in 2008.
8
of official. This contrasts with fewer than 30 percent of the general public.10 As with other
political activities, Americans with low incomes (under $30,000) are the least likely to initiate
political contacts (only 21% did so), and the percentage rises as income rises. Note that in this
case, however, the affluent (with incomes over $150,000) were just about as active as the
wealthy.
Presumably what counts a lot about contacts with officials is the result: whether or not
one receives a response and is satisfied. Sixty five percent of wealthy Americans reported being
satisfied with their contacts. Pew asked members of the general public who made contacts
whether they received a response and, if so, whether they were satisfied with it. Although
relatively small percentages of Americans made contacts, a high proportion (70%) of those who
made contacts received a response, and most (69%) of those receiving a response were satisfied.
As can be seen in Table 3, these high rates of receiving responses and being satisfied with those
responses hold across all income groups. Of course the wealthy may have been asking for a lot
more – perhaps a $1 million tax break, rather than a position paper for their child’s school
project. We don’t know.
[Insert Table 3 about here]
10 The Pew questions asked respondents whether they had contacted a national, state or local
government official. This makes comparison with the SESA question on contacting only federal
government officials inexact. We can be almost certain that not all of the 30% of the general
public that answered the Pew questions affirmatively contacted federal officials. So the 30%
figure probably over-estimates federal contacts for the public, under-stating the true contrast
between them and the wealthy.

9
Our wealthy SESA respondents were particularly likely to initiate contacts with members
of Congress. Forty percent reported that they had contacted their own senator, and 37%
contacted their own representative; remarkably, 28% contacted a representative or senator from
another district or state (see Table 4). In total, nearly half of our respondents – 47% of them –
made at least one contact with a congressional office. Contacts with executive department
officials (12%), White House officials (11%), and officials at a regulatory agency (21%), though
less frequent, were also substantial. Overall, a bit more than half of our respondents (53%) made
at least one political contact; 41% made two or more.
[Insert Table 4 about here]
Most of our respondents supplied the title or position of the federal government official
with whom they had their most important recent contact. Several offered the officials’ names,
occasionally indicating that they were on a first-name basis with “Rahm” Emmanuel (then
President Obama’s Chief of Staff) or “David” Axelrod (his chief political counsel.) The
frequency of such close ties to the Chicago-linked Obama administration may be unique to our
Chicago-area respondents, but we see no particular reason why their high frequency of contacts
with congressional representatives should be atypical of wealthy Americans elsewhere in the
country. For that matter, we suspect that very wealthy people anywhere in the country can
probably get the attention of high-level executive branch officials, too, when they wish to do so.
Only a representative national study could tell us for sure.
Purpose of contacts: narrow self interest? When we asked an open-ended question
about the main purpose of a respondent’s most important recent contact, most reported a specific
topic. Many gave a fair amount of detail about what they discussed. As best we could, we coded
these responses as reflecting either narrow economic self interest or broad collective concerns.
10
Of course some responses were too vague to code: “[to] try to influence legislation...”;
“trying to get him to pass or veto some pending legislation”; “to make recommendations on
policy issues.” And some involved ambiguous mixtures of personal and societal concerns (“A
relative works for a non-profit that trains foreign police officers to investigate alleged war
crimes, e.g. in Africa....I found the correct person to contact to obtain money for this group”; “I
met with both [the] congressman and the senator...on why government must not cut the worker
training budget, as a representative of the Alliance of Manufacturing...[this] is an important
investment that will return the benefits many times over.”)
But many contacts could be coded as fairly clearly concerning a matter of economic self
interest (“to try to get the Treasury to honor their commitment to extend TARP funds to a
particular bank in Chicago”; “to better understand the new regulations of the Dodd-Frank Act
and how it will affect my business [banking/ finance]”; “Fish and Wildlife. Business; permitting
on development land”; “on behalf of clients, seeking regulatory approvals”; “I own stock in
several banks. I was concerned about legislation he was drafting that I think could be harmful for
the banks.”) Many other contacts involved matters of broad public policy (“concern about...
deficit spending too much”; “we don’t like...defunding public broadcasting, ending funding to
NOAA, decrease funding to the IRS....It’s crazy to end Head Start and they want to give away oil
rights....”; “[as an advisory committee member] I provided my input to the issues associated with
migrant worker health”; “My congresswoman is also a friend so we met over dinner and
discussed...health care issues”; “to support government fiscal responsibility.”)
According to our coding there were many contacts of both types, but somewhat more of
them concerned collective matters (56% of those coded one way or the other) than concerned
narrow economic self interests (44%). See Table 5, which also summarizes a few examples of

11
topics or purposes of contacts. Contacts about health care policy were particularly frequent,
constituting 20% of all issue-specific contacts.
(Insert Table 5 about here)
Can we believe these responses? For the most part, subject to certain caveats, we think
we can. Most of the reported topics and arguments seem too detailed and too plausible to have
been made up on the spot for our interviewers. Spur-of-the-moment inventions would take effort
to concoct and could be harmful to the self-esteem of people who like to think of themselves as
honest. On the other hand, we suspect that the frequency of self-interested discussions with
officials may have been somewhat understated. This could happen, for example, because some
respondents chose to focus on a genuinely public-regarding contact as the “most important” one
(ignoring an equally important but more selfish contact), or because some of the 4% who
acknowledged the fact of a contact but refused to state its purpose – and/or some of those whose
responses were too vague to judge – were actually pursuing a narrow self interest but felt
uncomfortable telling us about it.
Moreover, even when our respondents communicated their views on broad rather than
narrow policy matters, we cannot be sure that they were always correct about what would benefit
their fellow citizens, or that their views were untainted by individual- or group-related economic
self interest. Indeed, the specific policy preferences expressed by SESA respondents often
differed markedly from those of average citizens, sometime in ways that could be self-interested
(Page, Bartels and Seawright 2013).
In any case, some might interpret our glass as “half empty” (the 44% of contacts that
admittedly involved matters of narrow self interest) rather than “half full” (the 56% that claimed
a collective focus.) Still, our evidence suggests that when wealthy Americans contact high-level

12
public officials, they may often address the common good as they see it, not solely their own
parochial concerns.
Discussion
Our survey was small and confined to a single geographical area. Unless and until
someone can do a national study we cannot be sure about the behavior of all wealthy Americans
around the country. On the other hand, the Chicago metropolitan area – in the heartland of the
Midwest – may not have been a bad place to start. In political terms the Chicago-area wealthy
may fall somewhere in between wealthy people in such diverse places as New York City, Dallas,
and Silicon Valley.
To the extent that our survey is representative of the nation as a whole, it is clear that
wealthy Americans – the top 1% or so of wealth holders – are exceptionally active in politics.
They vote, talk politics, campaign, and (especially) give money to political causes at much
higher rates than average citizens do. They are significantly more active than the merely
affluent, as well. Particularly notable are the findings that our respondents averaged a substantial
$4,600 in annual political contributions; that 20% of our respondents reported “bundling” others’
political contributions; and that 40% reported initiating a contact with their own U.S. senators.
Many also contacted their own representatives, others’ senators or representatives, executive
branch officials, and/or members of the White House staff.
In her book How Policies Make Citizens: Senior Citizens and the American Welfare
State, Andrea Campbell (2005, p.2) refers to the elderly as “the Über-citizens of the American
polity, voting and making campaign contributions at rates higher than any other age group.” Our

13
findings point to the fact that it may be the wealthy who are the real Über-citizens of the
American polity. Their participation levels far exceed any others that scholars have found.
What implications does this have for democratic policy making? Others have found
evidence indicating that moderately “affluent” Americans in the top third or top fifth of the
income distribution have much more influence than other citizens over the roll call votes of their
senators (Bartels 2008) and over changes in national policy (Gilens 2005, 2012). If a high level
of political participation by the affluent is one important mechanism by which they exert such
influence, then the truly wealthy – with their still more vigorous participation – may exert
particularly high levels of political influence. This would presumably violate the norm of
political equality (central to “populistic” democratic theories), which calls for every citizen to
have an equal voice (see Dahl 1989).
Soroka and Wlezien (2008) point out that unequal influence by the affluent would not
make much difference if the affluent generally shared the same policy preferences as the
citizenry as a whole. But Gilens (2009, 2012) presents compelling evidence that on many
important issues the affluent in fact tend to disagree with other Americans. SESA data (not
presented here) indicate that the truly wealthy – the top 1% -- differ even more sharply. They
express much more enthusiasm for cutting domestic programs in order to balance the budget.
They prefer lower, less progressive taxes; less economic regulation; and fewer federal
government programs related to jobs, incomes, health care, and retirement pensions than others
do (Page, Bartels, and Seawright 2013). If the intensive political participation revealed by the
SESA data enables wealthy Americans to have their voices heard by policymakers more clearly
than the voice of the general public – and perhaps sometimes get their way over opposition by
popular majorities – this would seem to be troubling for democracy.

14
A full assessment of the normative implications of our findings, however, would depend
upon precisely what sort of democratic theory one embraces (relatively populistic or pluralistic).
It might also depend on learning more about the nature of wealthy Americans’ higher levels of
political participation. To what extent do wealthy Americans in fact pursue narrow economic
self-interest, and to what extent do they pursue the common good as they see it? Is their vision
of the common good informed by superior knowledge, so that they should be seen as enlightened
leaders – pushing for policies that would serve their fellow citizens better than those citizens
themselves realize? Or do the unusual standpoints and experiences of the wealthy produce
biases in their world-views (perhaps hyper-awareness of tax burdens, for example, but little
understanding of the benefits of social welfare policies) that lead them to act against the best
interests of their fellow citizens? In this article we have barely been able to touch upon such
issues, which we consider important matters for future inquiry.
15
Table 1. Distribution of Wealth among SESA Respondents
Wealth Percentage (%) N
<$4,999,999 27% 19
$5,000,000 – 9,999,999 37% 26
$10,000,000 – 19,999,999 14% 10
$20,000,000 – 39,999,999 14% 10
$40,000,000 + 8% 6
Mean wealth = $14,006,338; median = $7,500,000
100% 71
Based on the n=83 refined sample only. Omits cases that refused to give a number or range for their wealth.

16
Table 2. Percentages of Wealthy Americans and the General Public Engaged in Political Activities
a Survey of general public asked only about attending a political rally or speech. b Number of respondents provided for the general public from the Pew survey. All general public questions come from the Pew survey except “Voted in 2008” and “Attend to politics most of the time” which are taken from the ANES.
Political Activity Percentage (%) Participating
Wealthy Total Public
Public by Income
(SESA) (Pew & ANES)
<$30,000 $30,000-$49,999
$50,000-$74,999
$75,000-$149,000
$150,000+
Voted in 2008 99% 78 73 73 84 83 84
Talk politics every day 42 19 14 19 19 26 32
Attended political meetings, rallies, speeches, or dinnersa
42 12 8 10 15 14 22
Contributed money 60 18 10 14 19 27 44
Helped solicit or bundle contributions
20
Attend to politics “most of the time” 84 26 21 24 26 31 38
Belong to political organization 23 15 10 12 20 24 26
Volunteer for political organization
29 8 6 6 9 10 15
Nb 83 2,251 509 337 296 488 127

17
Table 3. Percentages of Wealthy Americans and of the General Public who Contacted Officials and Percentages Satisfied with Contacts
a The general public survey asked separately about online (email) and offline (letter, phone call, etc.) contacts; results are combined here. Pew, national, state, or local officials; SESA, federal only. b Question only asked of those who contacted a public official. An interviewee who made contacts both online and offline was coded as receiving a response if received from at least one of his/her contacts. c Question only asked of respondents who contacted a public official and received a response. An interviewee receiving a response from both online and offline contacts was coded as satisfied if satisfied with at least one of his/her responses.
Political Activity Percentage (%)
Wealthy Total Public
Public by Income
(SESA) (Pew) <$30,000 $30,000-$49,999
$50,000-$74,999
$75,000-$149,000
$150,000+
Contacted an officiala 55% 30 21 25 31 39 49
Satisfied with contact 65
Received a response from contactb 70 62 72 73 71 79
Satisfied with contact, if received a responsec
69 66 70 68 75 69

18
Table 4. Percentages of Wealthy Americans who Contacted Specific Officials
Note: 53% made one or more of the above contacts; 41% made two or more.
Type of Political Contact Percentage
(%) Contacted own congressional representative 37%
Contacted own senator 40%
Contacted representative or senator from another district or state 28%
Contacted a White House official 11%
Contacted an executive department official 12%
Contacted a regulatory department official 21%

19
Table 5. Purposes of Wealthy Americans’ High-Level Political Contacts*
*The respondents in this table are limited to those who both made a contact and discussed its purpose (N=43).
Purpose of Contact Percentage (%) Percentage (%)
(including cases not categorized)
(omitting cases not categorized)
Collective Concerns 35% 56%
Examples: health care policy; save the Everglades; support fiscal responsibility; cut military spending; oppose abortion funding limits; less government; cancer prevention and cures.
Narrowly Self-Interested Concerns 28% 44%
Examples: Dodd-Frank effects on R’s bank stocks; development project in R’s House district; disclosure issues; get FDA approval for a product; private equity tax change.
Could not categorize 37% --

References
Bartels, Larry M. 2008 Unequal Democracy: The Political Economy of the New Gilded
Age. New York: Russell Sage Foundation and Princeton University Press.
Campbell, Andrea. 2005. How Policies Make Citizens: Senior Citizens and the
American Welfare State. Princeton: Princeton University Press.
Dahl, Robert A. 1989. Democracy and its Critics. Yale University Press: New Haven,
CT.
Gilens, Martin. 2005. “Inequality and Democratic Responsiveness.” Public Opinion
Quarterly 69: 778-796.
____________. 2009. “Preference Gaps and Inequality in Representation.”
PS: April, pp. 335-341.
____________. 2012. Affluence and Influence: Economic Inequality and Political Power
in America. Princeton, NJ: Russell Sage Foundation and Princeton University Press.
Hasen, Richard L. 2012. “The Numbers Don’t Lie.” Slate, March 9.
Jacobs, Lawrence R., and Benjamin I. Page. 2005. “Who Influences U.S. Foreign
Policy?” American Political Science Review 99:1, 107-123.
Page, Benjamin I., Larry M. Bartels, and Jason Seawright. 2011. “Interviewing Wealthy
Americans.” WP-11-07, Institute for Policy Research, Northwestern University.
______________________________________________. 2013. “Democracy and the
Policy Preferences of Wealthy Americans.” Perspectives on Politics 11 (1), 51-73.
Page, Benjamin I., Fay Lomax Cook, and Rachel Moskowitz. 2011. “Wealthy
Americans, Philanthropy, and the Common Good.” WP-11-13, Institute for Policy Research,
Northwestern University.

21
Page, Benjamin I., and Cari Lynn Hennessy. 2011. “What Affluent Americans Want
from Politics.” WP 11-08, Institute for Policy Research, Northwestern University.
Schlozman, Kay Lehman, Sidney Verba, and Henry E. Brady. 2012. The Unheavenly
Chorus: Unequal Political Voice and the Broken Promise of American Democracy. Princeton
University Press. Princeton, NJ.
Smith, Aaron, Kay Lehman Schlozman, Sidney Verba, and Henry Brady. 2009, “The
Internet and Civic Engagement.” Pew Internet & American Life Project, September
2009.http://pewinternet.org/~/media//Files/Reports/2009/TheInternetandCivicEngagement.pdf.
Soroka, Stuart N., and Christopher Wlezien. 2008. “On the Limits to Inequality in
Representation. PS, April, pp. 319-327.
Verba, Sidney, Kay Lehman Schlozman, and Henry E. Brady. 1995. Voice and
Equality: Civic Volunteerism in American Politics. Harvard University Press: Cambridge, MA.
Verba, Sidney, Kay Lehman Schlozman, Henry E. Brady, and Norman Nie. American
Citizen Participation Study, 1990. ICPSR06635-v1. Ann Arbor, MI: Inter-university Consortium
for Political and Social Research [distributor], 1995.