
Abstract.-Growth and mortalityrates ofO· English sole were estimatedfrom field data collected from estuarineand nearshore nursery areas off Washington during 1985-88. Growth of O·English sole was approximately linearover time and was estimated with thelength modal progression method.Point estimates ofgrowth rates duringMay through September were in therange of 0.33 to 0.49 mm/day. Statistical analysis with a general linear modelshowed significant year and settlementtime effects on growth ofO· English solebut failed to detect any density or temperature effect. Instantaneous mortality rate varied significantly with season, declining from 0.0175 per day inJuly and August to 0.0075 per day inSeptember. Changes in population density appeared to playa minor role incausing this decline.
161
Growth and survival of 0+ English sole,Pleuronectes vetulus, in estuaries andadjacent nearshore waters offWashington
Yunbing Shi *Donald R. GundersonSchool of Fisheries. 357980. University of WashingtonSeattle. Washington 98195
E-mail address:yshi®HARZA.com
Patrick J. SullivanInternational Pacific Halibut CommissionP.O. Box 95009, Seattle. Washington 98145
Manuscript accepted 30 July 1996.Fishery Bulletin 95:161-173 (1997).
Fish growth depends on numerousfactors, e.g. supply of suitable preyitems, ambient temperatures, andoxygen concentration. Laboratorystudies have shown that growth ofjuvenile plaice (Pleuronectes platessa) , sole (8olea solea.J, and English sole (Pleuronectes vetulus) depends strongly on ambient temperature (Williams and Caldwell, 1978;Fonds, 1979; Yoklavich, 1981).
Field observations also show thatgrowth of flatfishes is regulated byambient temperature. Applying amodel based on Fonds's (1979) laboratory experiment and observedtemperature data for predictingmonthly growth of North Sea plaice, van der Veer et a1. (1990)showed a close overall agreementbetween predicted growth increments and those observed in thefield. Simulated growth rates, however, were consistently lower thanfield-observed growth rates in June,and this tendency was reversed inAugust (Fig. 7 in van der Veer etaI., 1990). This finding suggeststhat in addition to temperaturethere are other factors that also affect the growth of plaice.
Laboratory studies of juvenileEnglish sole (Williams and Caldwell, 1978; Yoklavich, 1981) have
shown that food limitation can significantly reduce growth. Edwardsand Steele (1968) suggested thatfood limitation was the controllingfactor for the growth of North Seaplaice in Loch Ewe. Bergman et a1(1988) reported thatgrowth reductionof O-group plaice occurred in specificareas ofthe Wadden Sea where therewas low food abundance, althoughthis phenomenon was restricted toonly a small part of the population.
Isolating the effects of fish density, food supply, and ambient temperature on growth is difficult withfield data. Within a certain rangeof population density or food abundance, growth may be regulatedprimarily by temperature and,within a certain range of temperature, population density may havea dominant influence.
Survival is the key element indetermining success ofrecruitment.Early research was largely focusedon the "critical period" theory(Hjort, 1913), Le. survival of smallfirst-feeding larvae is critical to subsequent year-class strength. Morerecent studies have shown that low
*Present address: HARZA Consulting Engineers and Scientists, 2353 130th AvenueN.E., Suite 200. Bellevue, WA 98005.

162 Fishery Bulletin 95(1), 1997
Figure 1The study area along the southern Washington coast. Shown are subsystemboundaries, nearshore transect lines, trawl stations (filled circles>, andstratum numbers (open circles). Dashed lines indicate survey stratumboundaries.
Study area and field methods
Grays Harbor (8,545 hal and Willapa Bay (11,200ha) are two major Washington coastal estuaries characterized by numerous channels, sandflats, and eelgrass beds that provide excellent habitat for 0+ English sole. The nearshore portion ofthe study area isbounded to the north at 47°15'N, and to the south atabout 46°30'N, and extends from the shoreline seaward to 60 m. It encompasses an area of nearly146,600 ha.
A stratified random trawl survey was performedto estimate population sizes for English sole in bothestuaries (Fig. 1) with the area-swept method: P =Ad,where P = population size, A = area of survey stratum (ha), and d = mean density (no. offish caughtl
46°30'N
47"OO'N
124°00'W
,," ,
II
I,,,\ ,
I,.","J
I,
,,I,
I,
(,,,,,I
",.
IIIIII,
I• I
,,.,..1 ," I
'.... ",J \, I, 'Ie. , ...
• •\,\,"II
I, .
Methods
lOKMt----i
124°30'W
larval abundance may indicate poor yearclass strength, but high larval abundance willnot guarantee a strong year class (Bailey andSpring, 1992; Bradford, 1992). Survival during the juvenile stage is critical to year-classsuccess. On the basis ofsimulation, Bradford(1992) concluded that correlation betweenrecruitment and abundance at early lifestages increases monotonically with age, especially during the first 100 days of life, because variation in survival weakens the relationship between recruitment and abundance of early life stages. Although monthlyor annual instantaneous mortality is usuallyhigher during the larval stage than that atthe juvenile stage, the cumulative mortalitymight be higher, and more variable, duringthe juvenile stage because it usually lastsmuch longer. Therefore any variation in mortality at this stage would induce much greatervariation in recruitment.
English sole spawn in offshore areas. Timing ofspawning is variable and duration ofthespawning period is protracted (August to May,Shi, 1994). The egg and larval stages last fromtwo to two-and-a-halfmonths, and survival andtransport ofeggs and larvae are dependent onoceanographic conditions CBoehlert and Mundy,1987, 1988; Shi, 1994). Once metamorphosisand benthic settlement have occurred, Englishsole actively seek out estuarine nursery areas,and oceanographic influence becomes less important. Analyses oftagging data, distributionofadults, available spawning habitat, and eggdistribution (Shi, 1994Isuggest that the GraysHarbor and Willapa Bay estuaries serve asnursery areas for English sole that spawn asfar south as central Oregon.
This study summarizes results from a series oftrawl surveys ofGrays Harbor, Willapa Bay, and theadjacent nearshore, 1985-88. Previous work (Gunderson et aI., 1990; Shi et aI., 19951 has shown thatthese estuaries provide critical nursery habitat for juvenile English sole during their first year of life.
The abundance of0+ English sole in our study area(Fig. 1) was relatively stable during September, showing only a threefold difference during 1985-88, despite great variation in settlement in May (Shi etaI., 1995). Ifsurvival is density dependent, then density could function to stabilize recruitment. In thispaper, growth and survival rates will be estimatedby using data from field surveys, and we will investigate statistically the effects of population size andambient temperature on the growth and survival ofjuvenile English sole.

Shi et al.: Growth and sUNival of Pleuronectes vetulus
ha) (Shi et al., 1995). Within each stratum, stationswere randomly selected from sampling units superimposed on nautical charts, with the constraint thatno two stations were immediately adjacent to oneanother. The effort (number of stations) allocated toeach stratum was proportional to the abundance ofEnglish sole in that stratum (Shi et al., 1995).
The nearshore area was sampled along fixedtransects oriented east-west and trawl stations werelocated at discrete depths (Fig. 1>. Five transects wereestablished, and sampling stations were located atdepths of 5, 9. 18, 27. 36, 46, and 55 m. The 55-mstation was not sampled on the northernmosttransect because of frequent gear damage at this location. Additional effort was allocated to the intermediate stratum; two trawl samples were taken atall 27- and 36-m depths. Sampling stations werestratified according to depth to obtain populationestimates. The outer boundary for the nearshorestudy area was the 59-m (32.5-fm) isobath, and themean low low water (MLLW) mark was the innerboundary. The boundary sepal"ating the inner andmiddle strata followed the 14-m (7.5-fm) isobath,whereas the boundary between the middle and outerstrata was located at 41 m (22.5 fm). The northernand southern limits of the survey area were positioned 5 km beyond the northernmost and southernmost transects.
Each of the three areas was visited once a month.Sampling in estuaries was planned during low springtides of the month (April or May through September) so that we could navigate among unmarkedchannels, which otherwise are difficult to see. Stations in close proximity to intertidal areas weresampled preferentially at low tide to minimize biasassociated with fish movement onto the tideflats athigher stages of tide. More exposed sites were typically sampled at high water. Trawling operationsceased when tidal currents were judged sufficientlystrong that the trawl gear would not tend the oceanbottom properly. Nearshore sampling trips were usually made between the two estuary trips in thatmonth.
Survey samples throughout the study area werecollected with a 3-m beam trawl specifically developed for this study (Gunderson and Ellis, 1986). Effective width of the net was 2.3 m, whereas the estimated vertical opening was 0.6 m. The body of thenet was composed of 7-9 mm (lumen) knotless nylon, and the codend was lined with 4-mm stretchmesh. A double tickler chain array was attached to a9.5-kg wingtip weight at each corner of the net. Thetickler chain an"ay, together with the turbulent zoneit creates. dislodges small animals from the substrate, thus promoting capture by the net.
163
Nearshore sampling was conducted from the 17m stern trawler FN Karelia. Tows in the nearshorewere taken parallel to isobaths. Scope was routinely5:1, except at the 5 and 9 m stations where it was 8:1and 9:1, respectively. Time on the ocean bottom wasestimated by using a trigonometric relationship between water depth and wire out, whereas the lineardistance towed (mean: 750 m) was determined fromLORAN-C readings. Tow duration was routinely 20minutes at a mean towing speed of 2.6 kmlhr (1.4knots), except at the 5- and 9-m stations, which often yielded excessive quantities of sand dollars(Dendraster excentricus) and gravel; tows in theseareas were limited to 5 or 10 minutes.
A 6.4-m Boston whaler with a 150-hp outboardengine was used for estuarine trawling. Buoys weredeployed at the points where the net first contactedthe bottom and subsequently left bottom upon retrieval. The distance towed (mean: 260 m) was estimated with an optical rangefinder. Mean towingspeed was 2.8 kmlhr (1.5 knots), comparable to thatused in the nearshore area.
Data analysis
Length Growth rate estimates were obtained byregressing the mean length of a recruitment influx(indicated by a mode in the length-frequency distribution [Shi et al., 1995]) against the time whensamples were taken. There was a linear relationshipbetween modal length and time, as was the case inprevious growth studies on juvenile English sole(Ketchen, 1956; Kendall, 1966; Rosenberg, 1982).Because size-dependent migration between nearshore and estuarine systems occurs, with smallestjuveniles migrating into estuaries and larger fishmoving offshore (Gunderson et al., 1990; Shi et al.,1995), separate estimates of growth rates fornearshore and estuarine fish would be inappropriate. To minimize the effect of interregional migrations, the mean lengths at each mode (defined on thebasis ofvisual inspection ofmonthly length frequencyplots [Shi et al., 1995]) were calculated from the estimated size composition of the overall population.The length statistic used was the mean modal length(MML), which is defined as the mean length withina mode, weighted by the estimated population sizefor each size group:
(1)

164 Fishery Bulletin 95( J). 1997
Temperature A population-weighted mean bottomtemperature (PWMBT) was developed in this studybecause ofextensive seasonal ontogenetic migrations
a given month more than a half-month apart. Thepopulation-weighted mean date (PWMD) was chosen to standardize the "date" ofmonthly surveys andis the best estimate ofthe average sampling date forthe total population in our study area. The PWMDwas computed from
where, PWMD'm = population-weighted mean datein month j (May, June, July, August, and September) for mode m (lor 2); Pijm = population ofmode min system i (GH, WB, NS), monthj; dateij = meandate of a survey carried out in monthj and system i,i.e. number of days from 1 May.
where, l} = estimated population (millions) of fishin length group 1; lu and llow = length (mm) at upperand lower limits ofthe mode, which are so definedthat lu and l/ow are the length groups at which abundance has declined to halfthat at the modal size (Fig.2). Iflength is normally distributed, l-N<l, 82), thepopulation within the upper and lower limits of themode so defined would account for about 75% of thetotal population of that cohort (Shi, 1994).
Date The dates used in growth and mortality estimation were also population-weighted means. Thedates when the samples were taken cannot be useddirectly in growth and mortality estimation withoutbeing standardized. Estuarine samples had to betaken during low low tide (LLT) periods, and we wereoften forced to take estuarine samples at unequaltime intervals.
We made every effort to carry out the monthlynearshore surveys during the intervals between theGrays Harbor and Willapa Bay surveys, but theysometimes had to be done either before or after theestuarine trips owing to logistic difficulties. Thismade the time between the first and last surveys for
3
L Pijm dateij
PWMD -'-'i==I----;:- _jm = 3
LP;jmi=1
(2)
2000 -y-------------------------------...,
late settlers
o +--+-....Jfr'a,
early settlers
Length (nun)
Figure 2A diagram illustrating how the upper ([up) and lower ([/01.) limits of a mode were determined. Pm is theestimated modal population and Plow' Pup are the estimated population of the lower and upper limits of themode.

Shi et al.: Growth and survival of Pleuroneetes vetulus 165
between estuarine and nearshore areas and becauseofdifferences in mean bottom temperatures betweenestuarine and nearshore systems (2-8°C, Fig. 31.
where, PWMBTjm = population-weighted mean bottom temperature in month) for mode m; P;sjm = p0e..ulation ofmode m in system i, stratum s, month}; T;sj=mean bottom temperature in system i, stratum s,and month}; and s; =number of strata in system i.PWMB1jm is the best estimate ofthe average temperature experienced by the population in our study area.
a Si
LLF}sjm1}sjPWMBT. = -'..:;==...I-::'s""'=I'---__
Jm a Si
LLF}sjmi=1 s=1
(3)
where, lji = mean modal length <MMLI at time t i andyear }; Yj and c are dummy variables for year andsettlement time; t; =population weighted mean date(PWMD); d; = density (nolha), monthly mean density from May through September; Ti = populationweighted mean bottom temperature (PWMBT); ande.; = residual. The d; and T; terms were used to ex~mine whether or not there were density or temperature effects (or both) on the growth of0+ English solein the study areas. The dummy variableYj (year) wasdefined as follows:
Yl ={~1986
Y2 ={~1987
otherwise otherwise
Ya ={~1988
otherwise
Growth rates A linear model was developed to determine competing factors that had significant effects on the growth of 0+ English sole.
Since, settlement time obviously differed betweencohorts (Fig. 4), the dummy variable (c) was used todenote early (1) and the late (0) settlement groups:
lji =a + ale + a2jYj + f3ti + /31ct;
+/32jYA + /3a dA + /34T;ti +Ej;'
25
(4)c ={1 early settlements (1985. 1986 - 1,1988>
o late settlements (1986 - 2.1987).
20
5
0 I
l § '3 oil :i ~ ~ '3 oil... ... ~ ::s .... .¥
1985 1986
---WB-+-- GH
---NSI I I I
Month1987 1988
I I
Figure 3Monthly unweighted mean bottom temperature (OCI by area from years 1985 to 1988. Bars indicate onestandard deviation. WB =Willapa Bay; GH =Grays Harbor; NS =nearshore.

166 Fishery Bulletin 95/1). 1997
120
...-....-...........100
I 80
j60
I~ 40
.. ,':I ..
..............
.. '.' .0••••.. '.. '.. '.. ,.. ,.. ,
.. ,.. '• .0" •.. '.' ... '
••••0.. '.. '.. '
20
---1985 ···0·' 1986 early - ...... - 19861ate _ .... - \987 -· .... ··1988
o 30 60 90
Time (number of days from May 1)
120 150
Figure 4A plot ofmean modal length IMML. mm) against population-weighted mean date (PWMDl to illustrate thegrowth trajectory of 0+ English sole, May through September, 1985-1988.
1) By integrating Equation 5 with JI? = 0, the density-independent mortality model is
3) Integrating Equation 5 with /12 =0, and allowing/11 to vary, the model becomes
(6)
(7)
where t; = time, number of days elapsed since 1 Julyfor surveys conducted in year i (1985--88); ~ = the observed total population size (0+ group) for all areas combined at time t; in year i; and Poi = initial total population size on 1 July in year i. Poi was estimated as aparameter along with the coefficients /11 and Ji2' Ji',/1", and Ji'" are the density-independent mortality
2) Integrating Equation 5 over the time period fromt =0 to t = t; without any constraint on JII or JI2'the full model is
Mortality rates The significance of density and seasoneffects on mortality was examined by using the restatedBeverton-Holt equation <Beverton and Iles, 1992):
dPPdt =-(JII + JI2 1nP), (5)
where P is the population ofjuvenile English sole inour study area; JIl is the density independent coefficient, as defined in Beverton and Iles (1992), and JI2is the density-dependent coefficient.
Population estimates from the surveys were fittedto the following three competing models, by usingnonlinear least-squares regression (Wilkinson, 1989):
Early and late settlement was defined by visualinspection of length frequency (Shi et aI., 1995). Arecruitment influx with mean modal length less than40 mm during the May survey was defined as latesettlement, and that with mean modal length greaterthan 40 mm in May was defined as early settlement.A multiple-partial F-test was used here to test thesignificance ofsettlement time (PIc), year (P2.l)' density (P:fl), and temperature (P4Ti ) effects on growth.The computer program MGLH (SYSTAT [Wilkinson,1989]) was used to carry out all calculations.

Shi et al.: Growth and sUNival of Pleuroneetes vetu/us 167
Table 1Monthly population-weighted mean date (PWMDl. mean modal length CMMLl, population-weighted mean bottom temperatureCPWMBTI and overall mean densities of 0+ English sole. 1985--88.
Year Settlement time Month PWMDldaysl MML(mml PWMBT(OCl Densityl (No./hal
1985 Early May 21.66 60.56 13.07 55.03Jun 55.34 68.08 14.66 130.95Jul 83.75 79.95 12.94 200.60Aug 112.39 84.55 14.34 132.69Sep 135.72 99.96 12.24 96.42
1986 Early May 17.05 67.54 13.61 118.25Jun 44.71 72.97 16.24 77.06Jul 77.54 88.58 14.66 96.75Aug 106.18 99.17 12.07 72.55Sep 141.32 112.98 12.49 65.80
1986 Late May 22.51 25.99 12.33 118.25Jun 48.11 36.09 15.31 77.06Jul 75.63 55.01 15.43 96.75Aug 102.64 66.10 14.63 72.55Sep 144.51 84.67 14.81 65.80
1987 Late May 21.47 25.17 10.48 188.77Jun 45.58 36.64 13.70 219.35Jul 76.00 48.83 15.28 346.38Aug 106.47 63.19 12.48 186.98Sep 130.45 71.49 13.65 200.48
1988 Early May 12.48 45.01 13.21 269.44Jun 57.61 61.24 15.20 193.18Jul 86.10 79.77 14.91 182.15Aug 113.75 91.58 14.78 116.13Sep 149.10 103.72 12.26 90.31
I The estimated densities are combined densities of early and late recruits.
coefficients duringJuly, August, and September, respectively. Model selection was based on the Bayesian Information Criterion CBIC) proposed by Schwarz (1976).
Results
The mean modal length (MML), population-weightedmean date (PWMD), population-weighted mean bottom temperature (PWMBT), and overall mean densities of 0+ English sole from May through September are shown in Table 1.
Growth
Growth of 0+ English sole was linear over time (Fig.4). A general linear model pooled all data togetherand considered the effects ofyear, time ofsettlement,density, and temperature on growth. The final, bestfitted (R2 =0.99, P < 0.001) model was
lji =8.44 + 43.48c +6.76Yl +7.79Y2 -13.06Ya
+0.43ti - O.llcti +0.06y1ti +0.12Yati + Eji'
The results of partial t-tests (used in all comparisons unless specified otherwise), indicated there wasa significant settlement time effect on growth(P<O.Ol), late-settling cohorts growing the fastest.The year effect was also significant (multiple partialF-test P<0.05, Table 2). Multiple-partial F-tests indicated that there were no density (P=0.80) or temperature (P=0.37) effects on the growth of0+ Englishsole.
The date of settlement was estimated by fittingseparate regression equations to each cohort in Figure 4, then by backcalculating to a length of 20 mmTL (Table 3), or by inverse prediction (Neter et al.,1985). We estimated that settlement ofthe 1985 and1986 group-1 cohorts peaked in January, with 95%prediction intervals ranging from 27 November to22 March. Settlement.ofthe 1986 group-2 and 1987cohorts peaked in May (with 95% prediction intervals ranging from 21 April to 29 May), and that ofthe 1988 cohort peaked in March (ranging from 17February to 16 April).
Mortality The following equations were obtainedfrom nonlinear least-square regression:

168 Fishery Bulletin 95( 1). 1997
Intercept
Slope (Growth)
Table 2A summary of effects of year and settlement time on the growth of 0+ English sole.
Variable Parameter Coefficient Partial-t P (2-tail)
Constant U 8.44 3.19 <0.01Settlement Time (c) u l 43.48 17.03 < 0.01Year ly l , Y2' Ya) <0.01'
YI U21 6.76 2.61 < 0.05
Y2 ~2 7.79 3.58 < 0.01
Ya u2a -13.06 -4.19 < 0.01
PWMD(tj ) ~ 0.43 18.45 < 0.01Settlement time Ie) ~I -0.11 -4.04 < 0.01Year (y l , Y2' Ya) < 0.052
YI ~21 0.06 2.13 <0.05
Ya ~2a 0.12 3.66 < 0.01
1 Based on the result of an F-test. Fa.15 = 4.35.2 Based on the result of an F-test. Fa, 15 = 13.25.
{
42'82 1985
p. = 21.02 198601 66.63 1987
40.40 1988
The estimated instantaneous mortality rates of0+English sole in July and August were equal, therefore model 3 was reduced from a three-step to a twostep model. The data fitted model 3 best (Fig. 5) withinstantaneous mortality rates of 0.0175 per day inJuly and August and 0.0075 per day in September.The value of the Bayesian information criterion was3.68 for modell, 4.04 for model 2, and 2.65 for model3. As a result, we concluded that model 3 was thebest for estimating mortality.
Modell: /12 =0, ~. =Po;e ",(),01231, ;
{
43.80
Model 2: P. =e1m(,-<>00,." -1)p'-<>'OO56" •p. = 18.62I, 01' 01 73.33
40.46
t i =0 to 62 (July and August)
t i > 62 (September)
{
49.60
p. = 23.2301 74.33
47.28
1985
1986
19871988
1985
1986
1987
1988
Table 3Back-calculated settlement dates with their ranges, assuming average length at settling, lsetlling =20 mm TL.
Settlement Date of 95%Year cohort settlement prediction interval
1985 1 24 Jan 27 Nov-22 Mar1986 1 16 Jan 17 Dec-16 Feb
2 10 May 21 Apr -29 May1987 2 8 May 30 Apr-16 May1988 1 18 Mar 17 Feb-16 Apr
Discussion
Gear efficiency
Our estimates of growth and mortality might be biased ifgear selectivity varied with size. Edwards andSteele (1968) suggested that beam trawl efficiencydepends on a number offactors, such as towing speed,bottom type, and fish size. At a speed of 35 mlmin,the efficiency of their 2-meter beam trawl was 2535%, depending on fish size. They point out that theirresults apply only to their particular gear and thespecial conditions in Loch Ewe. Kuipers (1975) foundthat the efficiency of a 2-m beam trawl in the DutchWadden Sea declined from 100% at lengths below 70mm to 15-30% for plaice larger than 150 mm. Ourgear was a 3-m beam trawl with effective fishingwidth of 2.3 m, wider than the gear used by eitherKuipers or Edwards and Steele, and was towed faster(41-47 mlmin vs. 30-35 mlmin).Also the ratio offish-

Shi et al.: Growth and survival of Pleuronectes vetulus
60".. 1- ..- 1985 . .. ", . 1986 - -. - ---- 1988\1987
...."-
"-50 "-
"-"-
"-
i"-
"--.... -....
:8 40 -....-........ -....
! -...."- -....
! 30•
Il
~..! 20 "-.- "-.-..to ' . •10
.It. .. .to
0
10 20 30 40 50 60 70 80 90Time (days from July l)
Figure 5Population sizes (millions) plotted against time (number of days from 1 July) for 0+ English soleoff Washington during July through September, 1985-88. All lines represent the predicted trajectories with the month-specific, density independent mortality model (model 31; solid symbolsrepresent the observed data.
169
ing line out to bottom depth used in our survey (1015 in shallow waters) was greater than that inKuipers' experiment (4-8), resulting in better bottom contact and reduced vessel avoidance.
During a series of 15 pairs of day-night comparative tows, for which gear and operating procedureswere the same as those described in this paper,Gunderson and Ellis (1986) failed to detect any significant net avoidance by either butter sole (Pleuronectes isolepis) over the length range from 40 to 280mm, or Pacific tomcod (Microgadus proximus) overthe length range from 60 to 220 mm. In the presentstudy, the data for English sole did not show anydecline in estimated growth with size (Fig. 4 l. Weconclude that the efficiency of the gear used in thisstudy does not decrease with fish size over the lengthrange from 20 to 150 mm and has little influence onestimates of growth or mortality.
Growth
It has been shown that English sole juvenile migration in and out of estuaries is size dependent(Gunderson et aI., 1990; Shi et aI., 1995), and ourapproach to the length modal progression method(LMP), namely pooling length data from coastal andestuarine areas to estimate growth, accounts for the
effect ofsuch migrations. Our nearshore survey areacovered the outer limit of 0+ English sole bathymetric distribution; less than 1% ofthe total populationwas found in the deepest nearshore stratum (Shi etal., 1995). To minimize the effects of inter-area migration, we pooled data from all three areas surveyed(Fig. 1), which cover a major portion ofwaters available to English sole juveniles along the Washingtoncoast. The resulting estimates fall between fastergrowth rates estimated from previous LMP analyses (Westrheim, 1955; Smith and Nitsos, 1969;Krygier and Pearcy, 1986) and slower growth ratesestimated from fortnightly ring counts by Rosenberg(1982) (Table 4). Gunderson et al. (1990) and Shi etal. (1995) suggested that the population of Englishsole juveniles in this study may not be closed, however, and that some migrations, especially duringMay and June each year, involve areas outside thestudy area shown in Figure 1. Continuous recruitment ofyoung juveniles from outside the study areawould result in an underestimation ofgrowth rates,as could emigration of larger juveniles. Our data donot show any decline in growth at either the beginning or end of the survey season (Fig. 4); thus theinfluence of continuous recruitment of small fish oremigration of larger fish on growth estimation appeared to be minimal.

170
Table 4A summary of daily growth rate estimates from field studies.
Fishery Bulletin 9Sf J). J997
Location
Willapa Bay, Grays Harbor,and adjacent neashore. WA
Yaquina Bay. ORMonterey Bay, CAYaquina Bay, ORMoolach Beach, ORYaquina Bay. OR
Moolach Beach. OR
Size at age 1-yrImmTLl
~150
130-160130-150100-140100
~150
~150
Daily growth rate(mm/day)
0.33-0.49 (May-Sepl0.49 (May-Oct)0.55 (May-Oct)0.330.340.46--0.49 (Mar-Oct)0.26-0.32 lDec-Aprl0.28--0.42 (Apr-Oct)
Datasource
This study. 1985-88Westrheim. 1955Smith and Nitsos. 1969Rosenberg. 19821.2
Krygier and Pearcy. 19852
I The original daily growth rates were estimated from fortnightly ring counts.2 Length at age 1 and daily growth rates were converted from standard length 18Ll to total length (TLI by using the relationship: SL = -0.205 +
0.848 TL (senior author. unpubl. datal.
Several previous studies with the LMP techniquehave attempted to estimate growth rates for Englishsole juveniles from estuaries and open coast but failedto consider the effect of interarea migration on thegrowth estimates. As a consequence, their resultsoften show significant differences between coastaland estuarine populations (Westrheim, 1955; Smithand Nitsos, 1969; Krygier and Pearcy, 19861. In contrast, growth estimated from fortnightly ring countsshowed no differences between coastal and estuarinepopulations (Rosenberg, 1982).
Previous laboratory studies where ration was heldconstant (Williams and Caldwell, 1978) showed thatambient temperature had no statistically significanteffect on English sole growth rate between 9.5 and15.0°C but significantly reduced growth between 15.0and 18.0°C. The artificial food pellets used in thatstudy may have been nutritionally inadequate, however, making it difficult to extrapolate the results tofield conditions. Laboratory studies by Yoklavich(1981), where live polychaetes were used as food,showed a significant decline in the mean growth rateof0+ English sole (from 1.87% to 1.17% ofbody weightper day) between 13.0 and 17.5°C. Our results donot indicate any statistically significant interannualeffect of temperature on the growth of English solejuveniles over the range ofpopulation-weighted meantemperatures (10.5-16.2°C) observed under field conditions. Higher temperatures presumably result in increased benthic productivity (Johnson and Brinkhurst,1971) and in more food available to juveniles. On theother hand, metabolic requirements increase at hightemperatures. Whether the juveniles grow faster orslower under field conditions probably depends on thebioenergetic balance at higher temperatures.
Peterman and Bradford (1987) found that densityhad a significantly negative effect on the growth of1+English sole off the Oregon and Washington coasts(P=0.024, one-tailed t-test); therefore it would be reasonable to expect that growth of 0+ English sole isalso density dependent. Nevertheless growth rateand mean population size varied over relatively narrow ranges in this study, and we were unable to detect any statistically significant density effect.
The spawning season for English sole can extendfrom September to April (Kruse and Tyler, 1983), andrecruitment processes are also protracted. Multiplepeak recruitments are common (Kendall, 1966;Boehlert and Mundy, 1987; Gunderson et aI., 1990;Shi et a!., 1995), and peak recruitment occurs at different times each year, depending on ocean temperature and transport mechanisms (Ketchen, 1956;Boehlert and Mundy, 1987). Kendall (1966) reportedthat for Puget Sound English sole juveniles that wererecruited earlier, growth was slower than that oflaterrecruits during the same period. Our results led tothe same conclusion, that is, timing of settlementinfluences the growth trajectory (Fig. 4).
Different size groups of English sole have different prey requirements and suffer from different degrees of food limitation (Gunderson et aI., 199m. Offthe Oregon coast, English sole 17-35 mm standardlength (SL) fed primarily on polychaete palps, juvenile bivalves, and harpacticoid copepods, whereas 3582 mm fish fed on larger prey such as amphipodsand cumaceans (Hogue and Carey, 1982). In theHumboldt Bay estuary, English sole smaller than 50mm TL fed almost exclusively on harpacticoid copepods whereas the diet of 66-102 mm fish was dominated by polychaetes (Toole, 1980).
Shi et al.: Growth and survival of Pleuronectes vetulus
Winberg (1956) found that individual metabolicrequirements and food consumption increase as afunction of wl·s (where W=body weight), and Fonds(1979) showed a similar relation for young sole, Soleasolea. The larger sizes attained by the early-settlement cohorts of English sole would probably alsoentail increased food requirements for those fishduring May-September. The lower growth rates observed for early-settlement cohorts in comparisonwith those that settled later probably resulted froma combination of higher metabolic demands and reduced availability of suitable prey. Growth of 0+ English sole does not appear to be strictly linear if asufficiently long period of time is examined.
Mortality
Estimates of mortality rates were subject to some ofthe same sources of error and bias that the growthestimates were. Previous work (Gunderson et al.,1990; Shi et aI., 1995) has shown that migrations of0+ English sole are size dependent. Typically, largerfish emigrate from estuaries and perhaps out of ournearshore survey area, whereas smaller fish immigrate into our survey area. Immigration ofsmall fishwould cause underestimates of mortality. Previousanalysis indicated that most immigration probablyoccurred near the settling period, Le., May and Juneor earlier (Shi et aI., 1995), Therefore, it is unlikelythat immigration had much effect on the mortalityestimates because only population estimates for Julythrough September were used in this analysis.
Emigration of large 0+ fish would cause overestimation of mortality rates. Although we cannot completely ignore the possibility ofemigration, previousanalysis of length increment patterns in estuarineand nearshore areas has indicated that net emigration oflarge fish from the study area is minor duringJuly-September (Shi et aI., 1995), In addition, hadsubstantial emigration occurred during July throughSeptember, estimated mortality rates would be consistently higher during September than during Julyand August, rather than the opposite (0.0075 per dayvs. 0.0175 per day).
Seasonally differentiated daily mortality could berelated to differences in temperature, individual size,or population density. Water temperatures, however,remained relatively stable in the study area duringJuly through September (Fig. 3). Size-dependentmortality may have occurred, because 0+ English solegrow rapidly during the summer, with increases inindividual size of 0+ English sole ranging from 20 to30 mm TL from July to September. Kramer (1991)estimated the mortality rates for each 5-mm sizegroup ofCalifornia halibut, Paralichthys californicus,
171
on the basis of daily production by size group, andfound that mortality was size specific for fish lessthan 70 days old « 30 mm SL), smaller fish suffering higher mortality than larger ones. For older 0+California halibut (70-115 days of age or 31-70 mmSL), mortality varied little <0.011- 0.014 per day, withmean=0.0124 per day and SD=O.OOl per day) and notrend was observed. Beverton and lIes (1992) founda significant density-dependent mortality (112) effectfor North Sea plaice ranging from :S;15 mm to 35 mm,although this effect was not significant for fish largerthan 35 mm. Both Kramer (1991) and Beverton andlIes (1992) found that mortality of juvenile flatfishis highest during and immediately after settlement,and our results for English sole suggest the same.
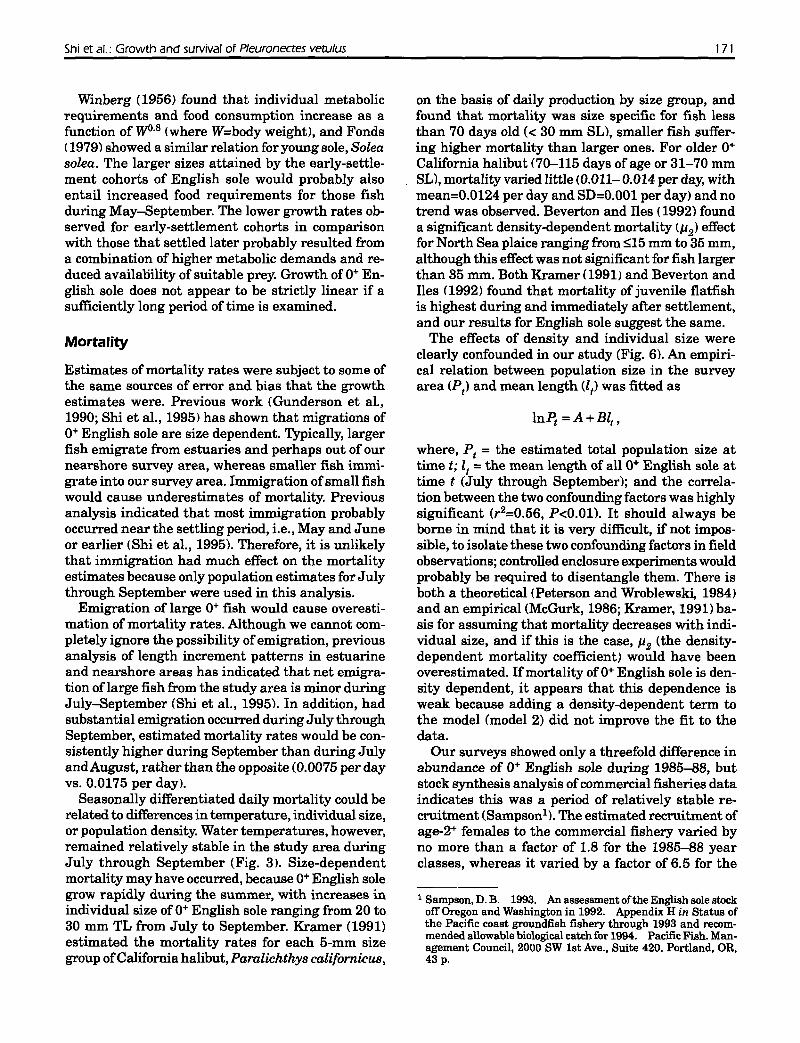
The effects of density and individual size wereclearly confounded in our study (Fig. 6), An empirical relation between population size in the surveyarea (Pt ) and mean length at) was fitted as
ln~ =A+Blt ,
where, Pt = the estimated total population size attime t; It = the mean length of all 0+ English sole attime t (July through September); and the correlation between the two confounding factors was highlysignificant (r2=0.56, P<O.Oll. It should always beborne in mind that it is very difficult, if not impossible, to isolate these two confounding factors in fieldobservations; controlled enclosure experiments wouldprobably be required to disentangle them. There isboth a theoretical (Peterson and Wroblewski, 1984)and an empirical (McGurk, 1986; Kramer, 1991) basis for assuming that mortality decreases with individual size, and if this is the case, 112 (the densitydependent mortality coefficient) wol"ild have beenoverestimated. Ifmortality of0+ English sole is density dependent, it appears that this dependence isweak because adding a density-dependent term tothe model (model 2) did not improve the fit to thedata.
Our surveys showed only a threefold difference inabundance of 0+ English sole during 1985-88, butstock synthesis analysis ofcommercial fisheries dataindicates this was a period of relatively stable recruitment (Sampson1). The estimated recruitment ofage-2+ females to the commercial fishery varied byno more than a factor of 1.8 for the 1985-88 yearclasses, whereas it varied by a factor of 6.5 for the
1 Sampson, D. B. 1993. An assessment ofthe English sole stockoff Oregon and Washington in 1992. Appendix H in Status ofthe Pacific coast groundfish fishery through 1993 and recommended allowable biological catch for 1994. Pacific Fish. Management Council, 2000 SW 1st Ave., Suite 420. Portland, OR,43 p.

172 Fishery Bulletin 95( 1). J997
18
..
o
.. July :lo Augusl
• September
- All Months (Predicted I -'
• •
•
105100959085
Mean Length lmm)
807570
16 +-........-r........-r-,.......,--.--,...--.-..........--.--,...--.-..........--.--,...--.-..........,...........,....-.--r-.,...........,....-.-..,.....,...--T...............-r-,.......,--.-...,65
Figure 6A plot illustrating the correlation (,.2=0.56, P<0.011 between population size and individualsize.
1975-90 year classes. Although our results apparently did not encompass periods ofpoor recruitment,they show that surveys of the nursery areas of 0+English sole have the potential to provide estimatesofyear-class strength several years in advance ofthecommercial fishery, as well as provide insight intothe processes that generate recruitment variability.
Acknowledgments
The senior author is grateful to his graduate committee members and fellow graduate students fortheir support and assistance during this study. Thisresearch was supported by grants from WashingtonSea grant (NA 86AA-D-SG004) and the NationalMarine Fisheries Service (NOAA).
Literature cited
Bailey, K. M., and S. M. Spring.1992. Comparison of larval, age-O juvenile and age-2 re
cruit abundance indices of walleye pollock, Theragrachalcogramma, in the western Gulf of Alaska. ICES J.Mar. Sci. 49:297-304.
Bergman, M. J. N., H. W. van der Veer, and J. J. Zijlstra.1988. Plaice nurseries: effects on recruitment. J. Fish.
BioI. 33 (suppI. A):21Q-218.Beverton, R. J. H., and T. C. lIes.
1992. Mortality rates of O-group plaice (Pleuronectesplatessa L.), dab ILimanda limanda L.) and turbot
(Scophthalmus maximus L.l in European waters. III: Density-dependence ofmortality rates in O-group plaice. and somedemographic implications. Neth. J. Sea Res. 29:61-79.
Boehlert, G. W., and B. C. Mundy.1987. Recruitment dynamics of metamorphosing English
sole. Parophrys t'etulus. to Yaquina Bay, Oregon. Estuarine Coastal Shelf Sci. 25:261-281.
1988. Roles ofbehavioral and physical factors in larval andjuvenile fish recruitment to estuarine nursery areas. Am.Fish. Soc. Symp. 3:51-67.
Bradford, M. J.1992. Precision of recruitment predictions from early life
stages of marine fishes. Fish. Bull. 90:439-453.Edwards, R., and J. B. Steele.
1968. The ecology of O-group plaice and common dabs atLoch Ewe. I. Population and food. J. Exp. Mar. BioI. Ecol.2:215-238.
Fonds,M.1979. A seasonal fluctuation in growth rate ofyoung plaice
(Pleuronectes platessal and sole (Solea solea) in the laboratory at constant temperatures and a natural daylightcycle. In E. Naylor and R. G. Hartnell (eds.), Proceedings of the 13th European marine biology symposium,p.151-156. Pergamon Press. Oxford, 477 p.
Gunderson, D. R., and I. E. Ellis.1986. Development of a plumb staff beam trawl for sam
pling demersal fauna. Fish. Res. 4:35-41.Gunderson, D. R., D. A. Armstrong, Y. B. Shi, and R. A.
McConnaughey.1990. Patterns of estuarine use by juvenile English sole
(Parophrys t'etulusl and Dungeness crab (Cancer magister). Estuaries 13:59-71.
Bjort,J.1913. Fluctuations in the great fisheries of northern Eu
rope viewed in the light of biological research. Rapp. P.V. Reun. Cons. Int. Explor. Mer 19:1-228.

Shi et al.: Growth and sUNival of Pleuronectes vetulus
Bogue, E. W., and A. G. Carey Jr.1982. Feeding ecology of O-age flatfishes at a nursery
ground on the Oregon Coast. Fish. Bull. 80:555-565.Johnson, M. G., and R. O. Brinkhurst.
1971. Production of benthic macroinvertebrates of Bay ofQuinte and Lake Ontario. J. Fish. Res. Board Can.28:1699-1714.
Kendall, A. W., Jr.1966. Sampling juvenile fishes on some sandy beaches of
Puget Sound. Washington. M.S. thesis. Univ. Washington, Seattle, WA. 77 p.
Ketchen, K. S.1956. Factors influencing the survival of the lemon sole
(Parophrys lJetulus) in Hecate Strait. British Columbia. J.Fish. Res. Board Can. 13(5):647-694.
Kramer, S. B.1991. Growth, mortality. and movements of juvenile Cali
fornia halibut, Paralichthys californicus, in shallow coastaland bay habitats of San Diego County, California. Fish.Bull. 89:195-207.
Kruse, G. B., and A. V. Tyler.1983. Simulation of temperature and upwelling effects on
the English sole (Parophrys vetulusl spawning season. Can. J. Fish. Aquat. Sci. 40:230-237.
Krygier, E. E., and W. G. Pearcy.1986. The role of estuarine and offshore nursery areas for
young English sole. Parophrys vetulus Girard. off Oregon. Fish. Bull. 84:119-132.
Kuipers, B. R.1975. On the efficiency ofa two-metre beam trawl for juve
nile plaice IPleuronectes platessai. Neth. J. Sea Res. 9:69-85.
McGurk, M. D.1986. Natural mortality of marine pelagic fish eggs and
larvae: role of spatial patchiness. Mar. Ecol. Prog. Ser.34:227-242.
Neter, J., W. Wasserman, and M. B. Kutner.1985. Applied linear statistical models. Regression, analy
sis of variance and experimental designs. 2nd ed. Irwin,Homewood. IL. 1127 p.
Peterman, R. M., and M. J. Bradford.1987. Density-dependent growth of age 1 English sole
IParophrys vetulus) in Oregon and Washington coastalwaters. Can. J. Fish. Aquat. Sci. 44:48-53.
Peterson, I., and J. S. Wroblewski.1984. Mortality rate of fishes in the pelagic ecosystem.
Can. J. Fish. Aquat. Sci. 41:1117-1120.Rosenberg, A. A.
1982. Growth of juvenile English sole, Parophrys vetulus.
173
in estuarine and open coastal nursey grounds. Fish. Bull.80:245-252.
Schwarz,G.1976. Estimating the dimension ofa model. Ann. Statist.
6:461-464.Shi,Y.
1994. Recruitment of juvenile English sole. Pleuronectesvetulus, in estuaries and nearshore areas of Washington. Ph.D. diss.• Univ. Washington, Seattle. WA. 148 p.
Shi, Y., D. R. Gunderson, and D. A. Armstrong.1995. Population dynamics of0+ English sole. Pleuronectes
vefulus, in estuaries and nearshore areas of Washington. In Proceedings of the international symposiumon North Pacific flatfish, p. 343-365. Alaska Sea GrantCollege Program Report 95-04, Univ. Alaska, Fairbanks.
Smith, J. G., and R. J. Nit80S.1969. Age and growth studies of English sole, Parophrys
lJefulus. in Monterey Bay, California. Pac. Mar. FishComm. Bull. 7:74-79.
Toole, C. L.1980. Intertidal recruitment and feeding in relation to op
timal utilization of nursery areas by juvenile English sole(Parophrys vetulus: Pleuronectidae). Env. BioI. Fish.5(4):383-390.
van der Veer, H. W., L. Pihl, and M. J. N. Bergman.1990. Recruitment mechanism in North Sea plaice,
Pleuronectes platessa. Mar. Ecol. Prog. Ser. 64:1-12.Westrheim, S. J.
1955. Size composition. growth, and seasonal abundanceof juvenile English sole (Parophrys vetulusl in YaquinaBay. Res. Briefs. Fish Comm. Oregon 6(2l:4-9.
Wilkinson, L.1989. SYSTAT: the system for statistics. SYSTAT, Inc.,
Evanston, IL, 822 p.Williams, S. F., and R. S. Caldwell.
1978. Growth, food conversion and survival ofO-group English sole (Parophrys l'efulus Girard) at five temperaturesand five rations. Aquaculture 15:129-139.
Winberg, G. G.1956. Rate of metabolism and food requirements of
fishes. Nauchye Trudy Belorusskogo GosudarstvennogoUniversiteta Imeni. V. I. Lenina, Minsk, 253 p. (Fish. Res.Board Can. Trans. Ser. 194, 202 p.).
Yoklavich, M.1981. Growth, food consumption, and conversion efficiency of
juvenile English sole (Parophrys vetulus l. Proceeding ofthe3rd Pacific workshop on fish food habits studies. p. 97-105.Washington Sea Grant Rep WSG-WO-82-2.


