
TRANSIT RIDERSHIP REPORT
American Public Transportation Association1666 K Street, NW, Suite 1100Washington, DC 20006
First Quarter 2013
Contact: Matthew DickensPolicy Analyst
Telephone: (202) 496-4817
ESTIMATED UNITED STATES UNLINKED TRANSIT PASSENGER TRIPS
Period 2013 2012
JANUARYFEBRUARYMARCH
CALENDAR COMPARISON
JANUARY FEBRUARY MARCH
2013 2012 2013 2012 2013 2012
WeekdaysSaturdaysSundaysHolidaysFirst Quarter
ESTIMATED UNLINKED TRANSIT PASSENGER TRIPS
CURRENT YEAR (a)(b) PRECEDING YEAR (a)(b) % CHANGE (b)
21442
20452
19 2144
5501
44
20
1
22540
% Change2012-2013
Fax: (202) 496-4324E-mail: [email protected]
24-May-13
867,969821,131901,303
2,590,403
844,553861,489934,833
2,640,875
2.77%
-1.91%
-4.68%-3.59%
*
MODE JAN '13 FEB '13 MAR '13JAN '13-MAR '13 JAN '12 FEB '12 MAR '12
JAN '12MAR '12
(000's) (000's) (000's) (000's) (000's) (000's) (000's) (000's)
1st QtrChange
Note: Data may differ from that included in Federal Transit Administration reports due to differences in data calculation procedures and in periods of time covered.
(a) Transit agencies assigned by urbanized areas or urban places of less than 50,000 population outside urbanized areas based on 2000 U.S. Census Population.(b) Year-to-date ridership adjusted for data received after closing dates of previous issues.(c) Includes aerial tramway, automated guideway, cable car, ferryboat, inclined plane, monorail, and vanpool.
Bus Population Group
* Preliminary information based on data from reporting systems.
Bus Total 430,757 457,306 435,297 450,457 477,030 -2.17%445,149 1,333,212 1,362,785
United States Total 821,131 901,303 844,553 861,489 934,833 -1.91%867,969 2,590,403 2,640,875
Heavy Rail 280,334 319,893 294,515 295,976 331,063 -1.69%305,721 905,947 921,554
Light Rail 38,531 43,398 39,369 39,778 44,411 -1.34%39,977 121,906 123,558
Commuter Rail 35,538 40,020 37,517 36,661 40,261 -0.82%37,941 113,499 114,438
Trolleybus 7,074 7,845 7,435 7,517 7,961 -2.25%7,479 22,398 22,913
288,793 316,087 297,083 303,020 330,635 -2.53%302,284 907,163 930,7382,000,000+
80,135 83,595 81,777 84,078 88,013 -2.49%83,828 247,558 253,867500,000 to 1,999,999
41,609 40,112 38,755 42,747 40,830 0.02%40,631 122,352 122,332100,000 to 499,999
20,219 17,512 17,682 20,613 17,552 0.52%18,406 56,138 55,847Below 100,000
Demand Response 15,292 16,708 16,078 16,338 17,568 -3.49%16,240 48,240 49,984
Other (c) 13,606 16,132 14,343 14,761 16,538 -0.97%15,463 45,201 45,643
Canada 177,744 190,656 183,691 188,850 196,745 -2.62%185,997 554,397 569,286

American Public Transportation Association1666 K Street, NW, Suite 1100Washington, DC 20006
Contact: Matthew DickensPolicy Analyst
Telephone: (202) 496-4817
PRECEDING YEAR (a)(b) % CHANGE (b)
Fax: (202) 496-4324
CURRENT YEAR (a)(b)
2
Email: [email protected] RIDERSHIP REPORTFirst Quarter 2013
ESTIMATED UNLINKED TRANSIT PASSENGER TRIPS
HEAVY RAIL
24-May-13
JAN '13 FEB '13 MAR '13 FEB '12 MAR '121st Qtr
Change(000's) (000's) (000's) (000's) (000's) (000's)
JAN '12Transit AgencyState andPrimary City
AVGWKDY(000's)
MAR '13JAN '13-
(000's)MAR '12JAN '12-
(000's)
Los Angeles County MTA 4,248.7 3,838.8 4,198.7 3,825.6 3,751.5 4,062.7 5.55%CA 158.3Los Angeles 12,286.2 11,639.8
San Francisco Bay Area RTD 10,044.6 9,720.8 10,677.8 9,444.9 9,663.4 10,063.1 4.36%CA 410.8San Francisco 30,443.2 29,171.4
Washington Metro Area TA 22,644.1 20,535.4 23,377.9 22,125.5 22,255.8 26,331.2 -5.88%DC 918.1Washington 66,557.4 70,712.5
Miami-Dade Transit Agency 1,760.8 1,683.4 1,903.4 1,571.3 1,566.8 1,704.8 10.42%FL 72.7Miami 5,347.6 4,842.9
Metro Atlanta Rapid Tr Auth 5,945.8 5,300.1 5,627.3 5,888.9 5,658.6 6,229.2 -5.08%GA 218.4Atlanta 16,873.2 17,776.7
Chicago Transit Authority 17,892.6 17,070.4 18,528.8 17,762.3 17,888.1 19,712.8 -3.38%IL 700.4Chicago 53,491.8 55,363.2
Massachusetts Bay Tr Auth 13,268.1 12,046.1 14,369.5 12,562.4 12,789.3 14,428.5 -0.24%MA 534.7Boston 39,683.7 39,780.2
Maryland Transit Admin 1,253.7 1,217.3 1,252.6 1,215.0 1,277.2 1,367.6 -3.53%MD 50.3Baltimore 3,723.6 3,859.8
Port Authority of NY & NJ 5,316.3 5,153.2 5,938.6 6,128.8 6,142.6 6,838.2 -14.14%NJ 228.8Jersey City 16,408.1 19,109.6
Port Authority Transit Corp 903.7 813.9 895.6 882.1 881.3 955.8 -3.90%NJ 36.7Lindenwold 2,613.2 2,719.2
MTA New York City Transit 213,146.2 193,035.8 221,264.8 203,795.4 204,099.9 227,164.4 -1.20%NY 8,302.6New York 627,446.8 635,059.7
MTA Staten Island Railway 366.0 315.8 343.0 385.6 367.2 415.4 -12.28%NY 14.9New York 1,024.8 1,168.2
Greater Cleveland Reg TA 532.8 528.1 554.4 493.5 508.7 566.4 2.98%OH NACleveland 1,615.3 1,568.6
Southeastern Penn TA 7,357.2 8,102.2 10,071.0 7,518.7 8,139.8 10,208.9 -1.30%PA 340.2Philadelphia 25,530.4 25,867.4
Puerto Rico DOT 1,040.0 972.3 889.7 914.6 986.2 1,014.4 -0.45%PR 45.4San Juan 2,902.0 2,915.2
Note: Data may differ from that included in Federal Transit Administration reports due to differences in data calculation procedures and in periods of time covered.(a) Transit agencies assigned by urbanized areas or urban places of less than 50,000 population outside urbanized areas based on 2000 U.S. Census Population.(b) Year-to-date ridership adjusted for data received after closing dates of previous issues.
REPORTED TOTAL 280,333.6 319,893.1 294,514.6 295,976.4 -1.69%
PROJECTED TOTAL
331,063.4305,720.612,032.4 905,947.3 921,554.4
280,333.6 319,893.1 294,514.6 295,976.4 331,063.4 -1.69%305,720.6 905,947.3 921,554.4

American Public Transportation Association1666 K Street, NW, Suite 1100Washington, DC 20006
Contact: Matthew DickensPolicy Analyst
Telephone: (202) 496-4817
PRECEDING YEAR (a)(b) % CHANGE (b)
Fax: (202) 496-4324
CURRENT YEAR (a)(b)
3
Email: [email protected] RIDERSHIP REPORTFirst Quarter 2013
ESTIMATED UNLINKED TRANSIT PASSENGER TRIPS
LIGHT RAIL
24-May-13
JAN '13 FEB '13 MAR '13 FEB '12 MAR '121st Qtr
Change(000's) (000's) (000's) (000's) (000's) (000's)
JAN '12Transit AgencyState andPrimary City
AVGWKDY(000's)
MAR '13JAN '13-
(000's)MAR '12JAN '12-
(000's)
Valley Metro Rail, Inc. 1,218.8 1,190.1 1,256.7 1,172.3 1,139.2 1,221.8 3.74%AZ 46.3Phoenix 3,665.6 3,533.3
Los Angeles County MTA 5,430.0 4,919.5 5,347.6 4,390.3 4,311.8 4,613.8 17.88%CA NALos Angeles 15,697.1 13,315.9
North County Transit District 195.5 213.7 62.5 184.9 169.4 197.1 -14.45%CA 8.5Oceanside 471.7 551.4
Sacramento Reg Tr Dist 1,199.3 1,120.4 1,177.4 1,126.1 1,168.3 1,200.0 0.08%CA 48.4Sacramento 3,497.1 3,494.4
San Diego Metrop Transit Syste 2,089.2 2,240.9 2,326.3 2,480.2 2,472.1 2,878.5 -15.00%CA 80.1San Diego 6,656.4 7,830.8
San Francisco Muni Rwy 3,936.7 3,757.2 4,177.2 4,024.0 3,950.7 4,140.4 -2.01%CA 158.4San Francisco 11,871.1 12,115.1
Santa Clara Valley Trp Auth 837.8 841.0 915.0 796.9 835.0 870.0 3.67%CA 33.6San Jose 2,593.8 2,501.9
Regional Trp District 1,553.6 1,630.6 1,678.3 1,703.1 1,754.7 1,843.1 -8.27%CO 66.1Denver 4,862.5 5,300.9
Hillsborough Area Reg TA 32.4 26.5 32.8 33.4 26.9 39.2 -7.84%FL 0.7Tampa 91.7 99.5
Regional Transit Auth 307.5 516.8 691.3 548.1 448.0 662.4 -8.62%LA NANew Orleans 1,515.6 1,658.5
Massachusetts Bay Tr Auth 5,690.1 5,244.6 6,238.3 5,899.4 6,274.9 6,983.9 -10.36%MA 221.9Boston 17,173.0 19,158.2
Maryland Transit Admin 634.8 603.1 669.7 673.6 691.7 725.2 -8.75%MD 23.5Baltimore 1,907.6 2,090.5
Metro Transit 777.0 684.4 772.4 777.7 687.7 809.7 -1.82%MN 27.9Minneapolis 2,233.8 2,275.1
Bi-State Dev Agency 1,292.1 1,269.6 1,365.4 1,271.8 1,309.9 1,467.1 -3.01%MO 50.1Saint Louis 3,927.1 4,048.8
Charlotte Area Transit 397.3 373.1 423.4 381.3 388.3 458.0 -2.75%NC NACharlotte 1,193.8 1,227.6
New Jersey Transit Corp 1,589.2 1,576.6 1,714.7 1,633.4 1,748.1 1,915.7 -7.87%NJ NANewark 4,880.5 5,297.2
Niagara Frontier Trp Auth 510.2 512.0 535.3 521.5 569.3 617.9 -8.85%NY 21.6Buffalo 1,557.5 1,708.7
Greater Cleveland Reg TA 239.9 218.3 223.9 230.4 217.9 242.6 -1.27%OH NACleveland 682.1 690.9
Tri-County Metro Trp Dist 3,018.9 2,839.2 3,305.9 3,258.9 3,266.4 3,502.2 -8.61%OR 116.0Portland 9,164.0 10,027.5
Southeastern Penn TA 2,504.4 2,732.2 3,404.4 2,426.9 2,571.1 3,077.8 7.00%PA 115.2Philadelphia 8,641.0 8,075.8
Port Auth of Allegheny Co 664.9 614.5 661.5 533.5 548.2 631.3 13.30%PA 27.9Pittsburgh 1,940.9 1,713.0
Memphis Area Transit Auth 80.8 84.8 119.7 74.3 83.7 140.2 -4.33%TN 3.3Memphis 285.3 298.2
Dallas Area Rapid Transit 2,411.5 2,152.0 2,478.0 2,159.1 2,053.5 2,361.6 7.11%TX 93.5Dallas 7,041.5 6,574.2
City of Galveston/Island Tr 0.0 0.0 0.0 0.0 0.0 0.0 NATX NAGalveston 0.0 0.0
Metro Tr Auth of Harris Co 928.0 922.4 1,296.5 902.0 935.3 1,252.4 1.85%TX 41.5Houston 3,146.9 3,089.7

JAN '13 FEB '13 MAR '13 FEB '12 MAR '121st Qtr
Change(000's) (000's) (000's) (000's) (000's) (000's)
JAN '12Transit AgencyState andPrimary City
AVGWKDY(000's)
MAR '13JAN '13-
(000's)MAR '12JAN '12-
(000's)
Utah Transit Authority 1,486.8 1,338.9 1,511.2 1,341.7 1,347.2 1,612.9 0.82%UT 59.7Salt Lake City 4,336.9 4,301.8
Hampton Roads Transit 124.2 134.8 128.2 99.1 89.4 140.7 17.62%VA 5.0Hampton 387.2 329.2
King County Dept of Trp 63.2 57.6 61.6 52.3 53.8 59.1 10.41%WA 2.6Seattle 182.4 165.2
Sound Transit 762.5 716.5 820.8 672.6 665.6 743.8 10.46%WA 29.3Seattle 2,299.8 2,082.0
Note: Data may differ from that included in Federal Transit Administration reports due to differences in data calculation procedures and in periods of time covered.(a) Transit agencies assigned by urbanized areas or urban places of less than 50,000 population outside urbanized areas based on 2000 U.S. Census Population.(b) Year-to-date ridership adjusted for data received after closing dates of previous issues.
REPORTED TOTAL 38,531.3 43,396.0 39,368.8 39,778.1 -1.34%
PROJECTED TOTAL (c)
44,408.439,976.61,280.8 121,903.9 123,555.3
(c) Includes missing agencies (Central Arkansas TA). (e) City of Galveston light rail service suspended starting in September 2008 due to hurricane damage.
38,531.3 43,398.1 39,368.8 39,778.1 44,410.6 -1.34%39,976.6 121,906.0 123,557.5

American Public Transportation Association1666 K Street, NW, Suite 1100Washington, DC 20006
Contact: Matthew DickensPolicy Analyst
Telephone: (202) 496-4817
PRECEDING YEAR (a)(b) % CHANGE (b)
Fax: (202) 496-4324
CURRENT YEAR (a)(b)
5
Email: [email protected] RIDERSHIP REPORTFirst Quarter 2013
ESTIMATED UNLINKED TRANSIT PASSENGER TRIPS
COMMUTER RAIL
24-May-13
JAN '13 FEB '13 MAR '13 FEB '12 MAR '121st Qtr
Change(000's) (000's) (000's) (000's) (000's) (000's)
JAN '12Transit AgencyState andPrimary City
AVGWKDY(000's)
MAR '13JAN '13-
(000's)MAR '12JAN '12-
(000's)
Alaska Railroad CorporationAK Anchorage 0.5 1.1 2.1 0.6 0.6 1.1 60.87%0.1 3.7 2.3
Southern California RRACA Los Angeles 973.1 910.3 999.2 940.0 941.2 1,012.5 -0.38%42.7 2,882.6 2,893.7
Capitol Corridor Joint Powers AuthCA Oakland 134.5 125.4 143.8 138.5 136.4 150.9 -5.19%5.4 403.7 425.8
North County Transit DistrictCA Oceanside 118.1 118.5 130.2 116.9 123.0 136.9 -2.65%5.3 366.8 376.8
CaltrainCA San Carlos 1,232.3 1,167.0 1,311.0 1,111.4 1,088.2 1,176.4 9.90%47.3 3,710.3 3,376.0
San Joaquin Reg Rail CommCA Stockton 81.6 75.2 81.0 63.4 62.8 69.9 21.26%3.8 237.8 196.1
Connecticut DOTCT New Haven 52.4 43.9 55.1 49.6 47.5 51.5 1.88%2.2 151.4 148.6
South Florida RTA (Tri-Rail)FL Pompano Beac 363.3 353.0 380.7 336.4 339.0 364.0 5.54%15.0 1,097.0 1,039.4
MetraIL Chicago 5,751.2 5,648.0 5,990.2 5,982.6 5,719.4 6,145.8 -2.57%287.8 17,389.4 17,847.8
Northern IN Commuter TDIN Chesterton 269.6 272.8 290.6 280.5 295.1 320.8 -7.07%11.5 833.0 896.4
Massachusetts Bay Tr AuthMA Boston 3,041.4 2,557.1 2,981.9 3,017.5 2,897.3 3,137.4 -5.21%127.5 8,580.4 9,052.2
Maryland Transit AdminMD Baltimore 746.6 703.6 746.3 661.0 704.2 758.2 3.44%36.0 2,196.5 2,123.4
Northern NE Passenger RAME Portland 38.9 36.1 45.8 37.9 40.1 44.5 -1.39%1.5 120.8 122.5
Metro TransitMN Minneapolis 55.7 52.9 56.0 48.0 46.5 49.2 14.54%2.5 164.6 143.7
New Jersey Transit CorpNJ Newark 6,211.6 5,930.4 6,712.0 6,367.8 6,287.7 6,762.6 -2.91%NA 18,854.0 19,418.1
New Mexico Dept of TrpNM Albuquerque 82.1 81.3 91.1 86.1 90.5 101.0 -8.32%3.6 254.5 277.6
MTA Long Island Rail RoadNY New York 8,068.7 7,305.0 8,095.6 8,021.5 7,585.6 8,258.1 -1.66%334.1 23,469.3 23,865.2
MTA Metro-North RailroadNY New York 6,684.0 5,996.3 6,997.2 6,527.4 6,383.2 7,124.0 -1.78%280.3 19,677.5 20,034.6
Tri-County Metro Trp DistOR Portland 37.2 34.0 35.1 34.0 34.4 34.5 3.30%1.7 106.3 102.9
Penn DOT (Keystone)PA Harris-Phil 47.9 45.8 55.8 43.1 44.6 51.9 7.09%2.0 149.5 139.6
Southeastern Penn TAPA Philadelphia 2,750.2 2,931.8 3,530.9 2,680.2 2,792.8 3,388.5 3.97%127.8 9,212.9 8,861.5
Regional Transp AuthTN Nashville 20.2 19.5 21.1 21.9 22.3 24.3 -11.24%1.0 60.8 68.5
Capital Metropolitan Trp AuthTX Austin 43.8 51.7 116.3 25.6 32.3 51.3 93.96%2.9 211.8 109.2
Trinity Railway ExpressTX Dallas-Ft Worth 165.6 164.1 189.4 189.2 186.8 214.5 -12.09%7.6 519.1 590.5
Denton County Transportation AutTX Lewisville 40.8 43.3 44.0 28.5 30.9 32.8 38.94%1.9 128.1 92.2
JAN '13 FEB '13 MAR '13 FEB '12 MAR '121st Qtr
Change(000's) (000's) (000's) (000's) (000's) (000's)
JAN '12Transit AgencyState andPrimary City
AVGWKDY(000's)
MAR '13JAN '13-
(000's)MAR '12JAN '12-
(000's)
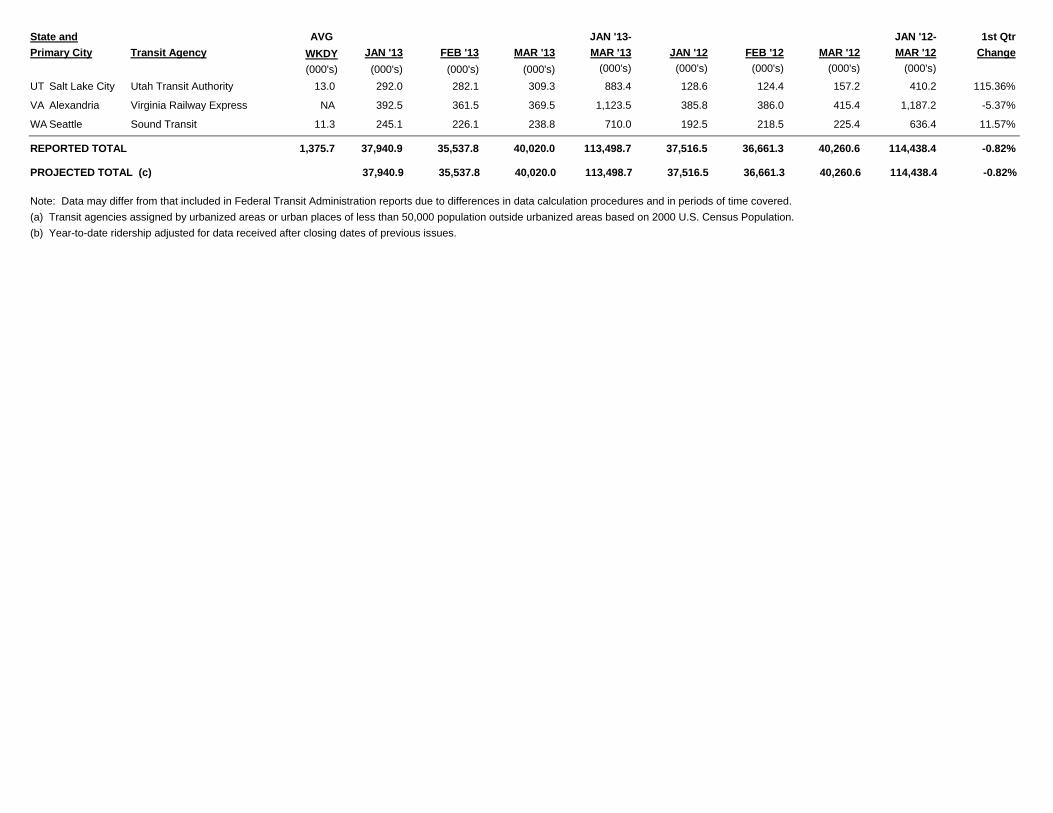
Utah Transit AuthorityUT Salt Lake City 292.0 282.1 309.3 128.6 124.4 157.2 115.36%13.0 883.4 410.2
Virginia Railway ExpressVA Alexandria 392.5 361.5 369.5 385.8 386.0 415.4 -5.37%NA 1,123.5 1,187.2
Sound TransitWA Seattle 245.1 226.1 238.8 192.5 218.5 225.4 11.57%11.3 710.0 636.4
Note: Data may differ from that included in Federal Transit Administration reports due to differences in data calculation procedures and in periods of time covered.(a) Transit agencies assigned by urbanized areas or urban places of less than 50,000 population outside urbanized areas based on 2000 U.S. Census Population.(b) Year-to-date ridership adjusted for data received after closing dates of previous issues.
REPORTED TOTAL
PROJECTED TOTAL (c)
35,537.8 40,020.0 37,516.5 36,661.3 -0.82%40,260.637,940.91,375.7 113,498.7 114,438.4
35,537.8 40,020.0 37,516.5 36,661.3 40,260.6 -0.82%37,940.9 113,498.7 114,438.4

American Public Transportation Association1666 K Street, NW, Suite 1100Washington, DC 20006
Contact: Matthew DickensPolicy Analyst
Telephone: (202) 496-4817
PRECEDING YEAR (a)(b) % CHANGE (b)
Fax: (202) 496-4324
CURRENT YEAR (a)(b)
7
Email: [email protected] RIDERSHIP REPORTFirst Quarter 2013
ESTIMATED UNLINKED TRANSIT PASSENGER TRIPS
TROLLEY BUS
24-May-13
JAN '13 FEB '13 MAR '13 FEB '12 MAR '121st Qtr
Change(000's) (000's) (000's) (000's) (000's) (000's)
JAN '12Transit AgencyState andPrimary City
AVGWKDY(000's)
MAR '13JAN '13-
(000's)MAR '12JAN '12-
(000's)
San Francisco Muni Rwy 5,141.3 4,876.8 5,452.4 5,255.3 5,128.1 5,404.3 -2.01%CA 192.9San Francisco 15,470.5 15,787.7
Massachusetts Bay Tr Auth 260.1 251.2 274.9 258.1 267.5 300.3 -4.81%MA 11.6Boston 786.2 825.9
Southeastern Penn TA 426.5 456.2 570.3 440.1 469.8 585.9 -2.86%PA 19.4Philadelphia 1,453.0 1,495.8
King County Dept of Trp 1,651.3 1,489.6 1,547.7 1,481.6 1,651.5 1,670.7 -2.40%WA 71.5Seattle 4,688.6 4,803.8
Note: Data may differ from that included in Federal Transit Administration reports due to differences in data calculation procedures and in periods of time covered.(a) Transit agencies assigned by urbanized areas or urban places of less than 50,000 population outside urbanized areas based on 2000 U.S. Census Population.(b) Year-to-date ridership adjusted for data received after closing dates of previous issues.
REPORTED TOTAL 7,073.8 7,845.3 7,435.1 7,516.9 -2.25%
PROJECTED TOTAL (c)
7,961.27,479.2295.4 22,398.3 22,913.2
(c) Includes missing agencies (Greater Dayton RTA).
7,073.8 7,845.3 7,435.1 7,516.9 7,961.2 -2.25%7,479.2 22,398.3 22,913.2

American Public Transportation Association1666 K Street, NW, Suite 1100Washington, DC 20006
Contact: Matthew DickensPolicy Analyst
Telephone: (202) 496-4817
PRECEDING YEAR (a)(b) % CHANGE (b)
Fax: (202) 496-4324
CURRENT YEAR (a)(b)
8
Email: [email protected] RIDERSHIP REPORT
First Quarter 2013ESTIMATED UNLINKED TRANSIT PASSENGER TRIPS
LARGEST BUS AGENCIES
24-May-13
(Transit Agencies in Urbanized Areas of 1,000,000 or more population that operate 300 or more peak-hour buses, plus a selection of other large bus operators)
JAN '13 FEB '13 MAR '13 FEB '12 MAR '121st Qtr
Change(000's) (000's) (000's) (000's) (000's) (000's)
JAN '12Transit AgencyState andPrimary City
AVGWKDY(000's)
MAR '13JAN '13-
(000's)MAR '12JAN '12-
(000's)
City of Phoenix PTD 3,364.2 3,290.6 3,350.3 3,316.1 3,350.0 2,928.3 4.28%AZ 138.7Phoenix 10,005.1 9,594.4
Long Beach Transit 2,323.9 2,285.4 2,500.4 2,314.7 2,365.5 2,527.7 -1.36%CA 92.3Long Beach 7,109.7 7,207.9
Los Angeles County MTA 29,386.2 28,514.1 31,025.8 29,124.1 29,497.8 31,467.9 -1.29%CA 1,133.2Los Angeles 88,926.1 90,089.8
Alameda-Contra Costa TD 4,500.3 4,070.6 4,507.6 4,345.7 4,199.1 4,554.6 -0.16%CA NAOakland 13,078.5 13,099.4
Orange County Transp Auth 4,096.9 4,031.0 4,369.8 4,187.5 4,294.7 4,572.8 -4.27%CA 195.9Orange 12,497.7 13,055.0
San Diego Metrop Transit Syst 4,135.9 4,064.2 4,380.9 4,214.5 4,275.4 4,591.7 -3.83%CA 169.2San Diego 12,581.0 13,081.6
San Francisco Muni Rwy 7,261.3 7,234.9 8,042.6 7,422.4 7,607.7 7,971.6 -2.01%CA 290.2San Francisco 22,538.8 23,001.7
Santa Clara Valley Trp Auth 2,717.8 2,579.1 2,857.2 2,626.6 2,636.0 2,808.1 1.03%CA 108.6San Jose 8,154.1 8,070.7
Santa Monica's Big Blue Bus 1,402.2 1,485.2 1,606.3 1,280.0 1,639.4 1,915.8 -7.06%CA 71.5Santa Monica 4,493.7 4,835.2
Regional Trp District 5,235.4 4,958.0 5,346.9 5,205.0 5,114.5 5,487.7 -1.69%CO 205.8Denver 15,540.3 15,807.2
Washington Metro Area TA 10,653.1 10,219.1 11,109.7 10,669.3 10,773.5 11,640.2 -3.33%DC 436.5Washington 31,981.9 33,083.0
Broward County Transit 3,654.9 3,447.3 3,508.5 3,530.4 3,455.6 3,563.0 0.58%FL 141.7Fort Lauderdale 10,610.7 10,549.0
Miami-Dade Transit Agency 6,622.8 6,410.0 6,808.0 6,632.1 6,510.3 7,008.2 -1.54%FL 256.9Miami 19,840.8 20,150.6
Central Florida RTA 2,463.3 2,339.6 2,372.8 2,349.7 2,313.7 2,427.5 1.20%FL 92.2Orlando 7,175.7 7,090.9
Metro Atlanta Rapid Tr Auth 5,162.4 4,602.2 4,941.4 4,959.9 4,944.4 5,183.5 -2.53%GA 190.9Atlanta 14,706.0 15,087.8
PACE Suburban Bus 2,570.8 2,465.0 2,626.8 2,451.4 2,571.3 2,733.1 -1.20%IL 107.3Arlington Heights 7,662.6 7,755.8
Chicago Transit Authority 24,676.6 23,653.9 25,632.6 24,678.9 25,891.8 27,916.6 -5.76%IL 962.5Chicago 73,963.1 78,487.3
Massachusetts Bay Tr Auth 9,476.6 8,247.7 9,884.4 9,383.9 9,580.7 10,524.6 -6.38%MA 381.1Boston 27,608.7 29,489.2
Maryland Transit Admin 5,919.4 5,713.3 5,900.0 6,621.5 6,562.7 7,159.9 -13.82%MD 239.0Baltimore 17,532.7 20,344.1
Montgomery County Ride-On 2,005.8 1,997.7 2,164.4 2,085.9 2,192.5 2,396.7 -7.60%MD 83.1Rockville 6,167.9 6,675.1
City of Detroit Dept of Trp 2,475.1 2,222.0 2,509.0 2,654.1 2,567.3 2,890.6 -11.17%MI 96.3Detroit 7,206.1 8,112.0
Metro Transit 5,568.4 5,527.2 5,931.8 5,592.5 5,794.2 6,087.8 -2.56%MN 229.8Minneapolis 17,027.4 17,474.5
Bi-State Dev Agency 2,366.8 2,233.5 2,336.5 2,297.0 2,349.1 2,500.0 -2.93%MO 90.7Saint Louis 6,936.8 7,146.1
New Jersey Transit Corp 13,194.2 12,164.0 13,518.8 12,657.2 12,924.2 14,224.2 -2.33%NJ NANewark 38,877.0 39,805.6
MTA New York City Transit 67,412.4 63,142.3 68,863.8 64,052.1 64,869.0 73,018.3 -1.25%NY 2,624.0New York 199,418.5 201,939.4

JAN '13 FEB '13 MAR '13 FEB '12 MAR '121st Qtr
Change(000's) (000's) (000's) (000's) (000's) (000's)
JAN '12Transit AgencyState andPrimary City
AVGWKDY(000's)
MAR '13JAN '13-
(000's)MAR '12JAN '12-
(000's)
Southwest Ohio RTA 1,414.8 1,339.1 1,407.3 1,260.9 1,264.7 1,274.1 9.51%OH 57.6Cincinnati 4,161.2 3,799.7
Greater Cleveland Reg TA 3,139.2 3,152.9 3,320.4 3,018.8 3,152.5 3,386.0 0.58%OH NACleveland 9,612.5 9,557.3
Central Ohio Transit Auth 1,552.9 1,485.0 1,534.4 1,553.0 1,568.7 1,607.0 -3.31%OH 62.1Columbus 4,572.3 4,728.7
Tri-County Metro Trp Dist 5,095.6 4,834.0 5,065.9 4,993.6 4,956.6 5,113.2 -0.45%OR 198.0Portland 14,995.5 15,063.4
Southeastern Penn TA 12,190.1 13,104.8 16,463.2 12,720.9 13,622.6 17,141.7 -3.97%PA 556.6Philadelphia 41,758.1 43,485.2
Port Auth of Allegheny Co 4,404.9 4,227.5 4,332.4 4,570.5 4,641.6 5,005.5 -8.81%PA 177.3Pittsburgh 12,964.8 14,217.6
Rhode Island Public TA 1,564.5 1,412.6 1,685.3 1,498.7 1,599.3 1,722.7 -3.28%RI NAProvidence 4,662.4 4,820.7
Dallas Area Rapid Transit 2,996.0 2,987.1 3,083.0 3,204.0 3,190.0 3,244.1 -5.93%TX 124.0Dallas 9,066.1 9,638.1
Metro Tr Auth of Harris Co 5,674.5 5,523.0 5,629.4 5,455.1 5,356.4 5,544.3 2.88%TX 231.3Houston 16,826.9 16,355.8
VIA Metropolitan Transit 3,678.1 3,656.8 3,772.1 3,775.2 3,614.5 3,848.4 -1.17%TX 139.9San Antonio 11,107.0 11,238.1
Hampton Roads Transit 1,334.2 1,255.7 1,312.7 1,307.6 1,302.8 1,361.5 -1.74%VA 53.0Hampton 3,902.6 3,971.9
King County Dept of Trp 8,142.5 7,522.9 8,235.1 7,280.1 7,718.0 8,092.9 3.51%WA 313.5Seattle 23,900.5 23,091.0
Milwaukee County Tr Sys 3,529.9 3,554.9 3,770.0 3,574.1 3,835.3 3,904.2 -4.06%WI 142.4Milwaukee 10,854.8 11,313.6
Note: Data may differ from that included in Federal Transit Administration reports due to differences in data calculation procedures and in periods of time covered.(a) Transit agencies assigned by urbanized areas or urban places of less than 50,000 population outside urbanized areas based on 2000 U.S. Census Population.(b) Year-to-date ridership adjusted for data received after closing dates of previous issues.
REPORTED TOTAL 270,954.2 295,707.5 278,865.0 284,103.4 -2.56%309,346.0283,363.910,393.5 850,025.6 872,314.4

APTA TRANSIT RIDERSHIP REPORT
State and City Transit Agency ModeAverage
Weekday Jan '13Trips for Trips for
Feb '13Trips forMar '13
Trips ThruMar '13
Trips forJan '12
Trips forFeb '12
Trips forMar '12
Trips ThruMar '12 Quarterly
Change(000's) (000's) (000's) (000's) (000's) (000's) (000's) (000's)(000's)
10First Quarter, 2013
1.1 2.1 0.6 0.6 1.10.1 60.87%3.7 2.30.5AK Anchorage Alaska Railroad Corporation TOTALCR 1.1 2.1 0.6 0.6 1.10.1 60.87%3.7 2.30.5Alaska Railroad CorporationAK Anchorage
248.1 246.0 237.2 247.7 244.611.1 2.18%745.4 729.5251.3AL Birmingham Birmingham-Jefferson Co TA TOTAL
DR 10.1 10.4 9.8 10.2 10.70.4 -0.98%30.4 30.79.9Birmingham-Jefferson Co TAAL BirminghamMB 238.0 235.6 227.4 237.5 233.910.7 2.32%715.0 698.8241.4Birmingham-Jefferson Co TAAL Birmingham
NA NA NA NA NANA NANA NANAAR Little Rock Central Arkansas Transit Auth TOTAL
DR NA NA NA NA NANA NANA NANACentral Arkansas Transit AuthAR Little RockLR NA NA NA NA NANA NANA NANACentral Arkansas Transit AuthAR Little RockMB 226.4 230.5 228.6 229.5 235.89.5 0.39%696.6 693.9239.7Central Arkansas Transit AuthAR Little Rock
175.1 166.1 147.1 177.0 158.87.0 5.03%507.2 482.9166.0AZ Flagstaff N. AZ Intergovernmental Public TA TOTAL
DR 1.8 2.0 2.0 2.0 2.10.0 -3.28%5.9 6.12.1N. AZ Intergovernmental Public TAAZ FlagstaffMB 173.3 164.1 145.1 175.0 156.77.0 5.14%501.3 476.8163.9N. AZ Intergovernmental Public TAAZ Flagstaff
16.3 17.6 18.0 18.1 18.90.7 -7.64%50.8 55.016.9AZ Glendale Glendale Transit TOTAL
DR 6.7 7.1 7.1 7.3 8.00.3 -6.25%21.0 22.47.2Glendale TransitAZ GlendaleMB 9.6 10.5 10.9 10.8 10.90.4 -8.59%29.8 32.69.7Glendale TransitAZ Glendale
3,326.5 3,390.3 3,353.2 3,386.7 2,967.8140.4 4.23%10,118.7 9,707.73,401.9AZ Phoenix City of Phoenix PTD TOTAL
DR 35.9 40.0 37.1 36.7 39.51.7 0.26%113.6 113.337.7City of Phoenix PTDAZ PhoenixMB 3,290.6 3,350.3 3,316.1 3,350.0 2,928.3138.7 4.28%10,005.1 9,594.43,364.2City of Phoenix PTDAZ Phoenix
894.3 930.3 860.3 867.3 873.239.4 6.01%2,757.1 2,600.8932.5AZ Phoenix Valley Metro TOTAL
DR 26.8 29.2 20.0 19.9 21.01.2 36.95%83.4 60.927.4Valley MetroAZ PhoenixMB 801.5 825.1 777.8 785.7 785.134.7 4.72%2,459.4 2,348.6832.8Valley MetroAZ PhoenixVP 66.0 76.0 62.5 61.7 67.13.5 12.02%214.3 191.372.3Valley MetroAZ Phoenix
1,190.1 1,256.7 1,172.3 1,139.2 1,221.846.3 3.74%3,665.6 3,533.31,218.8AZ Phoenix Valley Metro Rail, Inc. TOTALLR 1,190.1 1,256.7 1,172.3 1,139.2 1,221.846.3 3.74%3,665.6 3,533.31,218.8Valley Metro Rail, Inc.AZ Phoenix
1,634.5 1,724.1 1,705.0 1,677.6 1,729.869.2 -1.07%5,057.9 5,112.41,699.3AZ Tucson City of Tucson MTS TOTALMB 1,634.5 1,724.1 1,705.0 1,677.6 1,729.869.2 -1.07%5,057.9 5,112.41,699.3City of Tucson MTSAZ Tucson
31.0 34.5 23.9 26.1 34.01.4 15.24%96.8 84.031.3AZ Yuma Yuma County Intergovernmental PT TOTAL
DR 0.2 0.2 0.8 0.6 0.70.0 -76.19%0.5 2.10.1Yuma County Intergovernmental PTAZ YumaMB 30.8 34.3 23.1 25.5 33.31.4 17.58%96.3 81.931.2Yuma County Intergovernmental PTAZ Yuma
8.0 8.1 8.0 7.6 10.70.4 -6.84%24.5 26.38.4CA Alturas Modoc Transportation Agency TOTALMB 8.0 8.1 8.0 7.6 10.70.4 -6.84%24.5 26.38.4Modoc Transportation AgencyCA Alturas
Modes: MB - Bus, DR - Demand Response, CR - Commuter Rail, HR - Heavy Rail, LR - Light Rail, AG - Automated Guideway, CC - Cable Car, FB - Ferry Boat, IP - Inclined Plane, IR - Intermediate Rail, MO - Monorail, TB - Trolleybus, VP - Vanpool

APTA TRANSIT RIDERSHIP REPORT
State and City Transit Agency ModeAverage
Weekday Jan '13Trips for Trips for
Feb '13Trips forMar '13
Trips ThruMar '13
Trips forJan '12
Trips forFeb '12
Trips forMar '12
Trips ThruMar '12 Quarterly
Change(000's) (000's) (000's) (000's) (000's) (000's) (000's) (000's)(000's)
11First Quarter, 2013
221.4 242.0 214.6 216.7 213.27.8 8.05%696.4 644.5233.0CA Antioch Eastern Contra Costa Tr Auth TOTAL
DR 9.8 11.6 8.7 8.9 9.40.4 22.22%33.0 27.011.6Eastern Contra Costa Tr AuthCA AntiochMB 211.6 230.4 205.9 207.8 203.87.4 7.43%663.4 617.5221.4Eastern Contra Costa Tr AuthCA Antioch
489.8 503.6 579.8 604.3 628.619.7 -17.86%1,489.0 1,812.7495.6CA Bakersfield Golden Empire Transit District TOTAL
DR 4.2 4.6 4.1 4.3 4.60.2 1.54%13.2 13.04.4Golden Empire Transit DistrictCA BakersfieldMB 485.6 499.0 575.7 600.0 624.019.5 -18.00%1,475.8 1,799.7491.2Golden Empire Transit DistrictCA Bakersfield
260.1 255.2 270.6 283.6 298.812.2 -10.11%766.8 853.0251.5CA Chula Vista Chula Vista Transit TOTALMB 260.1 255.2 270.6 283.6 298.812.2 -10.11%766.8 853.0251.5Chula Vista TransitCA Chula Vista
280.7 299.8 282.7 282.0 296.812.5 0.85%868.8 861.5288.3CA Concord Central Contra Costa TA TOTAL
DR 12.0 13.2 13.1 13.3 13.80.6 -5.47%38.0 40.212.8Central Contra Costa TACA ConcordMB 268.7 286.6 269.6 268.7 283.011.9 1.16%830.8 821.3275.5Central Contra Costa TACA Concord
436.4 336.2 384.9 440.0 361.719.7 2.54%1,216.7 1,186.6444.1CA Davis Unitrans TOTALMB 436.4 336.2 384.9 440.0 361.719.7 2.54%1,216.7 1,186.6444.1UnitransCA Davis
887.5 919.6 911.5 943.2 993.437.3 -5.04%2,704.5 2,848.1897.4CA Fresno Fresno Area Express TOTAL
DR 15.9 17.0 17.2 17.2 17.80.7 -4.41%49.9 52.217.0Fresno Area ExpressCA FresnoMB 871.6 902.6 894.3 926.0 975.636.6 -5.05%2,654.6 2,795.9880.4Fresno Area ExpressCA Fresno
NA NA NA NA NANA NANA NANACA Livermore Livermore/Amador Valley TA TOTAL
DR 3.7 4.0 3.6 3.7 3.80.2 1.80%11.3 11.13.6Livermore/Amador Valley TACA LivermoreMB 136.7 148.3 136.6 143.4 152.96.1 -1.94%424.5 432.9139.5Livermore/Amador Valley TACA Livermore
2,289.4 2,504.7 2,318.5 2,369.1 2,531.592.5 -1.35%7,122.0 7,219.12,327.9CA Long Beach Long Beach Transit TOTAL
DR 4.0 4.3 3.8 3.6 3.80.2 9.82%12.3 11.24.0Long Beach TransitCA Long BeachFB 0.0 0.0 0.0 0.0 0.00.0 NA0.0 0.00.0Long Beach TransitCA Long BeachMB 2,285.4 2,500.4 2,314.7 2,365.5 2,527.792.3 -1.36%7,109.7 7,207.92,323.9Long Beach TransitCA Long Beach
208.4 231.3 203.9 209.5 223.18.6 2.95%655.3 636.5215.6CA Los Angeles Access Services TOTALDR 208.4 231.3 203.9 209.5 223.18.6 2.95%655.3 636.5215.6Access ServicesCA Los Angeles
37,272.4 40,572.1 37,340.0 37,561.1 40,144.4NA 1.62%116,909.4 115,045.539,064.9CA Los Angeles Los Angeles County MTA TOTAL
HR 3,838.8 4,198.7 3,825.6 3,751.5 4,062.7158.3 5.55%12,286.2 11,639.84,248.7Los Angeles County MTACA Los AngelesLR 4,919.5 5,347.6 4,390.3 4,311.8 4,613.8NA 17.88%15,697.1 13,315.95,430.0Los Angeles County MTACA Los AngelesMB 28,514.1 31,025.8 29,124.1 29,497.8 31,467.91,133.2 -1.29%88,926.1 90,089.829,386.2Los Angeles County MTACA Los Angeles
910.3 999.2 940.0 941.2 1,012.542.7 -0.38%2,882.6 2,893.7973.1CA Los Angeles Southern California RRA TOTALCR 910.3 999.2 940.0 941.2 1,012.542.7 -0.38%2,882.6 2,893.7973.1Southern California RRACA Los Angeles
Modes: MB - Bus, DR - Demand Response, CR - Commuter Rail, HR - Heavy Rail, LR - Light Rail, AG - Automated Guideway, CC - Cable Car, FB - Ferry Boat, IP - Inclined Plane, IR - Intermediate Rail, MO - Monorail, TB - Trolleybus, VP - Vanpool

APTA TRANSIT RIDERSHIP REPORT
State and City Transit Agency ModeAverage
Weekday Jan '13Trips for Trips for
Feb '13Trips forMar '13
Trips ThruMar '13
Trips forJan '12
Trips forFeb '12
Trips forMar '12
Trips ThruMar '12 Quarterly
Change(000's) (000's) (000's) (000's) (000's) (000's) (000's) (000's)(000's)
12First Quarter, 2013
638.1 701.0 706.8 709.6 747.631.7 -8.12%1,988.3 2,164.0649.2CA Montebello Montebello Bus Lines TOTAL
DR 3.7 3.9 6.7 6.3 6.80.2 -41.41%11.6 19.84.0Montebello Bus LinesCA MontebelloMB 634.4 697.1 700.1 703.3 740.831.5 -7.81%1,976.7 2,144.2645.2Montebello Bus LinesCA Montebello
300.5 323.9 308.6 344.7 362.111.9 -9.82%915.7 1,015.4291.3CA Monterey Monterey-Salinas Transit TOTAL
DR 8.0 9.0 9.2 10.0 10.40.4 -15.54%25.0 29.68.0Monterey-Salinas TransitCA MontereyMB 292.5 314.9 299.4 334.7 351.711.6 -9.65%890.7 985.8283.3Monterey-Salinas TransitCA Monterey
151.4 155.1 167.4 173.6 184.36.8 -12.34%460.5 525.3154.0CA Norwalk Norwalk Transit System TOTAL
DR 1.7 1.9 1.6 1.6 1.90.1 5.88%5.4 5.11.8Norwalk Transit SystemCA NorwalkMB 149.7 153.2 165.8 172.0 182.46.7 -12.51%455.1 520.2152.2Norwalk Transit SystemCA Norwalk
4,125.9 4,569.1 4,406.9 4,260.8 4,620.4NA -0.26%13,253.3 13,288.14,558.3CA Oakland Alameda-Contra Costa TD TOTAL
DR 55.3 61.5 61.2 61.7 65.8NA -7.37%174.8 188.758.0Alameda-Contra Costa TDCA OaklandMB 4,070.6 4,507.6 4,345.7 4,199.1 4,554.6NA -0.16%13,078.5 13,099.44,500.3Alameda-Contra Costa TDCA Oakland
125.4 143.8 138.5 136.4 150.95.4 -5.19%403.7 425.8134.5CA Oakland Capitol Corridor Joint Powers Auth TOTALCR 125.4 143.8 138.5 136.4 150.95.4 -5.19%403.7 425.8134.5Capitol Corridor Joint Powers AuthCA Oakland
NA NA 950.2 980.5 1,049.9NA NANA 2,980.6NACA Oceanside North County Transit District TOTAL
CR 118.5 130.2 116.9 123.0 136.95.3 -2.65%366.8 376.8118.1North County Transit DistrictCA OceansideDR 11.2 12.3 10.2 10.6 11.40.5 9.94%35.4 32.211.9North County Transit DistrictCA OceansideLR 213.7 62.5 184.9 169.4 197.18.5 -14.45%471.7 551.4195.5North County Transit DistrictCA OceansideMB 640.9 774.6 638.2 677.5 704.527.2 1.99%2,060.4 2,020.2644.9North County Transit DistrictCA Oceanside
4,256.9 4,611.0 4,403.1 4,509.5 4,800.3207.1 -3.69%13,207.3 13,712.94,339.4CA Orange Orange County Transp Auth TOTAL
DR 126.5 137.1 127.9 129.8 136.26.3 1.90%401.4 393.9137.8Orange County Transp AuthCA OrangeMB 4,031.0 4,369.8 4,187.5 4,294.7 4,572.8195.9 -4.27%12,497.7 13,055.04,096.9Orange County Transp AuthCA OrangeVP 99.4 104.1 87.7 85.0 91.34.9 16.74%308.2 264.0104.7Orange County Transp AuthCA Orange
NA NA 285.2 298.9 301.1NA NANA 885.2NACA Oxnard Gold Coast Transit TOTAL
DR NA NA 5.3 5.5 5.7NA NANA 16.5NAGold Coast TransitCA OxnardMB 279.3 310.8 279.9 293.4 295.411.0 -0.60%863.5 868.7273.4Gold Coast TransitCA Oxnard
71.5 74.6 67.3 66.4 70.93.0 8.16%221.3 204.675.2CA Redding Redding Area Bus Authority TOTAL
DR 4.4 4.9 4.7 4.5 4.70.2 1.44%14.1 13.94.8Redding Area Bus AuthorityCA ReddingMB 67.1 69.7 62.6 61.9 66.22.8 8.65%207.2 190.770.4Redding Area Bus AuthorityCA Redding
32.4 35.8 33.8 34.4 36.8NA -4.19%100.6 105.032.4CA Redondo Beach City of Redondo Beach TOTAL
DR 1.1 1.1 1.3 1.4 1.4NA -17.07%3.4 4.11.2City of Redondo BeachCA Redondo BeachMB 31.3 34.7 32.5 33.0 35.4NA -3.67%97.2 100.931.2City of Redondo BeachCA Redondo Beach
Modes: MB - Bus, DR - Demand Response, CR - Commuter Rail, HR - Heavy Rail, LR - Light Rail, AG - Automated Guideway, CC - Cable Car, FB - Ferry Boat, IP - Inclined Plane, IR - Intermediate Rail, MO - Monorail, TB - Trolleybus, VP - Vanpool

APTA TRANSIT RIDERSHIP REPORT
State and City Transit Agency ModeAverage
Weekday Jan '13Trips for Trips for
Feb '13Trips forMar '13
Trips ThruMar '13
Trips forJan '12
Trips forFeb '12
Trips forMar '12
Trips ThruMar '12 Quarterly
Change(000's) (000's) (000's) (000's) (000's) (000's) (000's) (000's)(000's)
13First Quarter, 2013
768.1 819.0 719.9 757.8 808.731.8 1.68%2,324.7 2,286.4737.6CA Riverside Riverside Transit Agency TOTAL
DR 30.3 33.3 30.8 31.9 33.31.4 -0.73%95.3 96.031.7Riverside Transit AgencyCA RiversideMB 737.8 785.7 689.1 725.9 775.430.4 1.78%2,229.4 2,190.4705.9Riverside Transit AgencyCA Riverside
2,273.8 NA 2,157.1 2,304.6 2,379.8NA NANA 6,841.52,323.6CA Sacramento Sacramento Reg Tr Dist TOTAL
DR 22.9 NA 23.9 24.4 26.1NA NANA 74.424.5Sacramento Reg Tr DistCA SacramentoLR 1,120.4 1,177.4 1,126.1 1,168.3 1,200.048.4 0.08%3,497.1 3,494.41,199.3Sacramento Reg Tr DistCA SacramentoMB 1,130.5 1,159.8 1,007.1 1,111.9 1,153.748.2 3.59%3,390.1 3,272.71,099.8Sacramento Reg Tr DistCA Sacramento
1,335.7 1,364.2 1,332.5 1,363.1 1,389.054.4 -1.29%4,032.1 4,084.61,332.2CA San Bernardino OMNITRANS TOTAL
DR 38.8 41.5 39.3 38.5 40.21.8 3.90%122.6 118.042.3OMNITRANSCA San BernardinoMB 1,296.9 1,322.7 1,293.2 1,324.6 1,348.852.6 -1.44%3,909.5 3,966.61,289.9OMNITRANSCA San Bernardino
1,167.0 1,311.0 1,111.4 1,088.2 1,176.447.3 9.90%3,710.3 3,376.01,232.3CA San Carlos Caltrain TOTALCR 1,167.0 1,311.0 1,111.4 1,088.2 1,176.447.3 9.90%3,710.3 3,376.01,232.3CaltrainCA San Carlos
6,345.6 6,750.7 6,733.8 6,786.1 7,511.1251.2 -7.93%19,363.4 21,031.06,267.1CA San Diego San Diego Metrop Transit System TOTAL
DR 40.5 43.5 39.1 38.6 40.91.9 6.24%126.0 118.642.0San Diego Metrop Transit SystemCA San DiegoLR 2,240.9 2,326.3 2,480.2 2,472.1 2,878.580.1 -15.00%6,656.4 7,830.82,089.2San Diego Metrop Transit SystemCA San DiegoMB 4,064.2 4,380.9 4,214.5 4,275.4 4,591.7169.2 -3.83%12,581.0 13,081.64,135.9San Diego Metrop Transit SystemCA San Diego
665.7 771.9 699.1 687.0 715.429.4 2.21%2,147.9 2,101.5710.3CA San Francisco Golden Gate Bridge, Hwy & TD TOTAL
DR 9.9 11.2 9.9 10.2 10.90.5 0.00%31.0 31.09.9Golden Gate Bridge, Hwy & TDCA San FranciscoFB 146.8 182.2 142.5 146.3 150.96.5 9.26%480.4 439.7151.4Golden Gate Bridge, Hwy & TDCA San FranciscoMB 509.0 578.5 546.7 530.5 553.622.4 0.35%1,636.5 1,630.8549.0Golden Gate Bridge, Hwy & TDCA San Francisco
9,720.8 10,677.8 9,444.9 9,663.4 10,063.1410.8 4.36%30,443.2 29,171.410,044.6CA San Francisco San Francisco Bay Area RTD TOTALHR 9,720.8 10,677.8 9,444.9 9,663.4 10,063.1410.8 4.36%30,443.2 29,171.410,044.6San Francisco Bay Area RTDCA San Francisco
16,227.2 18,144.4 17,150.0 17,044.5 17,979.2656.1 -1.93%51,168.1 52,173.716,796.5CA San Francisco San Francisco Muni Rwy TOTAL
CC 358.3 472.2 448.3 358.0 462.914.6 1.46%1,287.7 1,269.2457.2San Francisco Muni RwyCA San FranciscoLR 3,757.2 4,177.2 4,024.0 3,950.7 4,140.4158.4 -2.01%11,871.1 12,115.13,936.7San Francisco Muni RwyCA San FranciscoMB 7,234.9 8,042.6 7,422.4 7,607.7 7,971.6290.2 -2.01%22,538.8 23,001.77,261.3San Francisco Muni RwyCA San FranciscoTB 4,876.8 5,452.4 5,255.3 5,128.1 5,404.3192.9 -2.01%15,470.5 15,787.75,141.3San Francisco Muni RwyCA San Francisco
85.0 112.6 40.2 46.5 48.04.3 >100%288.5 134.790.9CA San Francisco Water Emergency Transportation A TOTALFB 85.0 112.6 40.2 46.5 48.04.3 >100%288.5 134.790.9Water Emergency Transportation ACA San Francisco
3,476.2 3,835.9 3,486.7 3,535.1 3,745.4144.8 1.49%10,928.0 10,767.23,615.9CA San Jose Santa Clara Valley Trp Auth TOTAL
DR 56.1 63.7 63.2 64.1 67.32.6 -7.45%180.1 194.660.3Santa Clara Valley Trp AuthCA San JoseLR 841.0 915.0 796.9 835.0 870.033.6 3.67%2,593.8 2,501.9837.8Santa Clara Valley Trp AuthCA San JoseMB 2,579.1 2,857.2 2,626.6 2,636.0 2,808.1108.6 1.03%8,154.1 8,070.72,717.8Santa Clara Valley Trp AuthCA San Jose
Modes: MB - Bus, DR - Demand Response, CR - Commuter Rail, HR - Heavy Rail, LR - Light Rail, AG - Automated Guideway, CC - Cable Car, FB - Ferry Boat, IP - Inclined Plane, IR - Intermediate Rail, MO - Monorail, TB - Trolleybus, VP - Vanpool

APTA TRANSIT RIDERSHIP REPORT
State and City Transit Agency ModeAverage
Weekday Jan '13Trips for Trips for
Feb '13Trips forMar '13
Trips ThruMar '13
Trips forJan '12
Trips forFeb '12
Trips forMar '12
Trips ThruMar '12 Quarterly
Change(000's) (000's) (000's) (000's) (000's) (000's) (000's) (000's)(000's)
14First Quarter, 2013
675.1 652.4 645.7 715.2 690.926.6 -4.93%1,950.6 2,051.8623.1CA Santa Barbara Santa Barbara MTD TOTAL
DR 4.2 4.5 4.4 4.3 4.90.2 -5.15%12.9 13.64.2Santa Barbara MTDCA Santa BarbaraMB 670.9 647.9 641.3 710.9 686.026.4 -4.93%1,937.7 2,038.2618.9Santa Barbara MTDCA Santa Barbara
1,485.2 1,606.3 1,280.0 1,639.4 1,915.871.5 -7.06%4,493.7 4,835.21,402.2CA Santa Monica Santa Monica's Big Blue Bus TOTALMB 1,485.2 1,606.3 1,280.0 1,639.4 1,915.871.5 -7.06%4,493.7 4,835.21,402.2Santa Monica's Big Blue BusCA Santa Monica
39.8 42.2 37.9 41.2 40.81.9 -0.25%119.6 119.937.6CA Simi Valley City of Simi Valley/Transit TOTAL
DR 3.6 3.9 3.7 3.7 4.00.2 -0.88%11.3 11.43.8City of Simi Valley/TransitCA Simi ValleyMB 36.2 38.3 34.2 37.5 36.81.7 -0.18%108.3 108.533.8City of Simi Valley/TransitCA Simi Valley
75.2 81.0 63.4 62.8 69.93.8 21.26%237.8 196.181.6CA Stockton San Joaquin Reg Rail Comm TOTALCR 75.2 81.0 63.4 62.8 69.93.8 21.26%237.8 196.181.6San Joaquin Reg Rail CommCA Stockton
362.8 375.3 348.5 350.3 359.4NA 2.31%1,082.6 1,058.2344.5CA Stockton San Joaquin Reg Trans Dist TOTAL
DR 3.0 3.0 2.4 2.6 2.7NA 18.18%9.1 7.73.1San Joaquin Reg Trans DistCA StocktonMB 359.8 372.3 346.1 347.7 356.70.0 2.19%1,073.5 1,050.5341.4San Joaquin Reg Trans DistCA Stockton
403.6 425.9 396.6 403.3 427.715.7 0.29%1,231.1 1,227.6401.6CA Thousand Palms SunLine Transit Agency TOTAL
DR 10.8 11.9 10.3 10.7 11.40.5 5.56%34.2 32.411.5SunLine Transit AgencyCA Thousand PalmsMB 392.8 414.0 386.3 392.6 416.315.3 0.14%1,196.9 1,195.2390.1SunLine Transit AgencyCA Thousand Palms
89.0 91.8 86.5 94.3 94.33.4 -3.78%264.7 275.183.9CA Ventura Ventura County Transp Comm TOTAL
DR 17.1 18.4 17.0 17.4 18.80.7 -0.19%53.1 53.217.6Ventura County Transp CommCA VenturaMB 71.9 73.4 69.5 76.9 75.52.7 -4.64%211.6 221.966.3Ventura County Transp CommCA Ventura
147.0 154.3 141.5 147.2 161.46.3 1.80%458.2 450.1156.9CA Visalia Visalia City Coach TOTAL
DR 2.8 3.1 3.3 3.3 3.60.1 -10.78%9.1 10.23.2Visalia City CoachCA VisaliaMB 144.2 151.2 138.2 143.9 157.86.2 2.09%449.1 439.9153.7Visalia City CoachCA Visalia
1,109.6 1,237.1 1,105.1 1,121.9 1,238.146.8 0.79%3,492.4 3,465.11,145.7CA West Covina Foothill Transit TOTALMB 1,109.6 1,237.1 1,105.1 1,121.9 1,238.146.8 0.79%3,492.4 3,465.11,145.7Foothill TransitCA West Covina
228.2 242.0 250.1 243.0 260.111.0 -5.31%713.2 753.2243.0CO Colorado Springs Mountain Metropolitan Transit TOTAL
DR 23.7 26.3 24.5 23.6 26.01.1 -0.81%73.5 74.123.5Mountain Metropolitan TransitCO Colorado SpringsMB 200.2 212.4 219.4 213.0 227.89.7 -5.00%627.2 660.2214.6Mountain Metropolitan TransitCO Colorado SpringsVP 4.3 3.3 6.2 6.4 6.30.2 -33.86%12.5 18.94.9Mountain Metropolitan TransitCO Colorado Springs
6,719.2 7,163.4 7,045.3 7,000.9 7,471.9276.1 -3.32%20,804.6 21,518.16,922.0CO Denver Regional Trp District TOTAL
DR 130.6 138.2 137.2 131.7 141.14.2 -2.00%401.8 410.0133.0Regional Trp DistrictCO DenverLR 1,630.6 1,678.3 1,703.1 1,754.7 1,843.166.1 -8.27%4,862.5 5,300.91,553.6Regional Trp DistrictCO DenverMB 4,958.0 5,346.9 5,205.0 5,114.5 5,487.7205.8 -1.69%15,540.3 15,807.25,235.4Regional Trp DistrictCO Denver
Modes: MB - Bus, DR - Demand Response, CR - Commuter Rail, HR - Heavy Rail, LR - Light Rail, AG - Automated Guideway, CC - Cable Car, FB - Ferry Boat, IP - Inclined Plane, IR - Intermediate Rail, MO - Monorail, TB - Trolleybus, VP - Vanpool

APTA TRANSIT RIDERSHIP REPORT
State and City Transit Agency ModeAverage
Weekday Jan '13Trips for Trips for
Feb '13Trips forMar '13
Trips ThruMar '13
Trips forJan '12
Trips forFeb '12
Trips forMar '12
Trips ThruMar '12 Quarterly
Change(000's) (000's) (000's) (000's) (000's) (000's) (000's) (000's)(000's)
15First Quarter, 2013
90.4 87.6 85.7 87.5 88.34.3 2.37%267.7 261.589.7CO Grand Junction Mesa County Reg Transp Office TOTAL
DR 1.2 1.3 1.3 1.3 1.30.1 -5.13%3.7 3.91.2Mesa County Reg Transp OfficeCO Grand JunctionMB 89.2 86.3 84.4 86.2 87.04.2 2.48%264.0 257.688.5Mesa County Reg Transp OfficeCO Grand Junction
1,974.8 2,305.1 2,141.9 2,291.2 2,446.081.5 -5.13%6,526.4 6,879.12,246.5CT Hartford Connecticut Transit TOTALMB 1,974.8 2,305.1 2,141.9 2,291.2 2,446.081.5 -5.13%6,526.4 6,879.12,246.5Connecticut TransitCT Hartford
30.3 35.5 31.0 32.1 35.71.4 0.81%99.6 98.833.8CT Hartford Greater Hartford Tran Dist TOTALDR 30.3 35.5 31.0 32.1 35.71.4 0.81%99.6 98.833.8Greater Hartford Tran DistCT Hartford
NA NA NA NA NANA NANA NANACT New Haven Connecticut DOT TOTAL
CR 43.9 55.1 49.6 47.5 51.52.2 1.88%151.4 148.652.4Connecticut DOTCT New HavenMB NA NA NA NA NANA NANA NANAConnecticut DOTCT New Haven
NA NA NA NA NANA NANA NANACT Waterbury Northeast Transportation Co., Inc. TOTAL
DR 4.7 5.6 5.7 5.7 6.22.0 -10.80%15.7 17.65.4Northeast Transportation Co., Inc.CT WaterburyMB NA NA NA NA NANA NANA NANANortheast Transportation Co., Inc.CT Waterbury
30,754.5 34,487.6 32,794.8 33,029.3 37,971.41,354.7 -5.06%98,539.3 103,795.533,297.2DC Washington Washington Metro Area TA TOTAL
HR 20,535.4 23,377.9 22,125.5 22,255.8 26,331.2918.1 -5.88%66,557.4 70,712.522,644.1Washington Metro Area TADC WashingtonMB 10,219.1 11,109.7 10,669.3 10,773.5 11,640.2436.5 -3.33%31,981.9 33,083.010,653.1Washington Metro Area TADC Washington
833.3 868.2 881.1 923.8 855.837.5 -2.84%2,585.2 2,660.7883.7DE Wilmington Delaware Transit Corp TOTAL
DR 80.7 86.0 80.6 82.6 89.63.7 -0.16%252.4 252.885.7Delaware Transit CorpDE WilmingtonMB 752.6 782.2 800.5 841.2 766.233.8 -3.12%2,332.8 2,407.9798.0Delaware Transit CorpDE Wilmington
164.8 181.3 153.2 170.1 188.15.3 -0.82%507.2 511.4161.1FL Bradenton Manatee County Area Transit TOTAL
DR 6.9 7.2 6.8 6.9 7.40.3 0.95%21.3 21.17.2Manatee County Area TransitFL BradentonMB 157.9 174.1 146.4 163.2 180.75.0 -0.90%485.9 490.3153.9Manatee County Area TransitFL Bradenton
3,503.2 3,565.1 3,591.3 3,516.3 3,626.4144.1 0.45%10,782.6 10,734.03,714.3FL Fort Lauderdale Broward County Transit TOTAL
DR 55.9 56.6 60.9 60.7 63.42.4 -7.08%171.9 185.059.4Broward County TransitFL Fort LauderdaleMB 3,447.3 3,508.5 3,530.4 3,455.6 3,563.0141.7 0.58%10,610.7 10,549.03,654.9Broward County TransitFL Fort Lauderdale
390.8 418.2 327.6 358.9 401.215.5 9.15%1,187.2 1,087.7378.2FL Fort Myers Lee Tran TOTAL
DR 8.5 9.1 8.5 8.5 9.10.4 1.15%26.4 26.18.8Lee Tran FL Fort MyersMB 378.2 404.9 316.4 347.1 387.915.1 9.22%1,148.3 1,051.4365.2Lee Tran FL Fort MyersVP 4.1 4.2 2.7 3.3 4.20.0 22.55%12.5 10.24.2Lee Tran FL Fort Myers
1,111.3 921.8 1,006.0 1,157.3 958.950.5 0.37%3,133.8 3,122.21,100.7FL Gainesville Regional Transit System TOTAL
DR 4.0 4.5 3.9 3.7 4.20.1 5.08%12.4 11.83.9Regional Transit SystemFL GainesvilleMB 1,107.3 917.3 1,002.1 1,153.6 954.750.4 0.35%3,121.4 3,110.41,096.8Regional Transit SystemFL Gainesville
Modes: MB - Bus, DR - Demand Response, CR - Commuter Rail, HR - Heavy Rail, LR - Light Rail, AG - Automated Guideway, CC - Cable Car, FB - Ferry Boat, IP - Inclined Plane, IR - Intermediate Rail, MO - Monorail, TB - Trolleybus, VP - Vanpool

APTA TRANSIT RIDERSHIP REPORT
State and City Transit Agency ModeAverage
Weekday Jan '13Trips for Trips for
Feb '13Trips forMar '13
Trips ThruMar '13
Trips forJan '12
Trips forFeb '12
Trips forMar '12
Trips ThruMar '12 Quarterly
Change(000's) (000's) (000's) (000's) (000's) (000's) (000's) (000's)(000's)
16First Quarter, 2013
8,996.4 9,758.2 9,085.4 8,978.9 9,744.1367.8 1.11%28,117.2 27,808.49,362.6FL Miami Miami-Dade Transit Agency TOTAL
AG 766.3 902.7 744.5 762.5 884.332.3 4.75%2,504.9 2,391.3835.9Miami-Dade Transit AgencyFL MiamiDR 136.7 144.1 137.5 139.3 146.85.8 0.07%423.9 423.6143.1Miami-Dade Transit AgencyFL MiamiHR 1,683.4 1,903.4 1,571.3 1,566.8 1,704.872.7 10.42%5,347.6 4,842.91,760.8Miami-Dade Transit AgencyFL MiamiMB 6,410.0 6,808.0 6,632.1 6,510.3 7,008.2256.9 -1.54%19,840.8 20,150.66,622.8Miami-Dade Transit AgencyFL Miami
2,420.8 2,457.0 2,425.4 2,389.7 2,508.295.6 1.41%7,426.2 7,323.32,548.4FL Orlando Central Florida RTA TOTAL
DR 61.2 63.9 58.6 58.7 62.72.6 5.78%190.4 180.065.3Central Florida RTAFL OrlandoMB 2,339.6 2,372.8 2,349.7 2,313.7 2,427.592.2 1.20%7,175.7 7,090.92,463.3Central Florida RTAFL OrlandoVP 20.0 20.3 17.1 17.3 18.00.8 14.69%60.1 52.419.8Central Florida RTAFL Orlando
498.1 549.5 413.3 412.7 444.321.2 23.51%1,568.9 1,270.3521.3FL Pompano Beach South Florida RTA (Tri-Rail) TOTAL
CR 353.0 380.7 336.4 339.0 364.015.0 5.54%1,097.0 1,039.4363.3South Florida RTA (Tri-Rail)FL Pompano BeachMB 145.1 168.8 76.9 73.7 80.36.2 >100%471.9 230.9158.0South Florida RTA (Tri-Rail)FL Pompano Beach
254.0 261.4 256.7 259.1 252.410.2 1.47%779.5 768.2264.1FL Sarasota Sarasota County Area Transit TOTAL
DR 13.8 14.2 13.7 13.5 15.00.6 0.71%42.5 42.214.5Sarasota County Area TransitFL SarasotaMB 240.2 247.2 243.0 245.6 237.49.6 1.52%737.0 726.0249.6Sarasota County Area TransitFL Sarasota
1,237.7 1,288.5 1,248.6 1,241.2 1,321.051.6 0.24%3,820.1 3,810.81,293.9FL Tampa Hillsborough Area Reg TA TOTAL
DR 11.5 12.0 10.5 10.7 10.90.5 9.66%35.2 32.111.7Hillsborough Area Reg TAFL TampaLR 26.5 32.8 33.4 26.9 39.20.7 -7.84%91.7 99.532.4Hillsborough Area Reg TAFL TampaMB 1,199.7 1,243.7 1,204.7 1,203.6 1,270.950.4 0.38%3,693.2 3,679.21,249.8Hillsborough Area Reg TAFL TampaVP 0.0 0.0 0.0 0.0 0.00.0 NA0.0 0.00.0Hillsborough Area Reg TAFL Tampa
1,081.6 1,105.9 1,058.7 1,068.0 1,107.446.0 2.91%3,328.3 3,234.11,140.8FL West Palm Beach Palm Beach County STD TOTAL
DR 71.5 74.1 72.0 74.0 76.23.1 -0.86%220.3 222.274.7Palm Beach County STDFL West Palm BeachMB 1,010.1 1,031.8 986.7 994.0 1,031.242.8 3.19%3,108.0 3,011.91,066.1Palm Beach County STDFL West Palm Beach
9,948.8 10,620.7 10,895.4 10,650.9 11,463.6411.3 -3.89%31,725.3 33,009.911,155.8GA Atlanta Metro Atlanta Rapid Tr Auth TOTAL
DR 46.5 52.0 46.6 47.9 50.92.0 0.48%146.1 145.447.6Metro Atlanta Rapid Tr AuthGA AtlantaHR 5,300.1 5,627.3 5,888.9 5,658.6 6,229.2218.4 -5.08%16,873.2 17,776.75,945.8Metro Atlanta Rapid Tr AuthGA AtlantaMB 4,602.2 4,941.4 4,959.9 4,944.4 5,183.5190.9 -2.53%14,706.0 15,087.85,162.4Metro Atlanta Rapid Tr AuthGA Atlanta
12.4 13.0 18.9 20.9 22.50.6 -39.00%38.0 62.312.6GA Gainesville Hall Area Transit TOTAL
DR 2.0 2.1 2.1 2.3 2.30.1 -7.46%6.2 6.72.1Hall Area TransitGA GainesvilleMB 10.4 10.9 16.8 18.6 20.20.5 -42.81%31.8 55.610.5Hall Area TransitGA Gainesville
5,785.4 5,959.5 6,189.7 6,108.8 6,118.3NA -2.42%17,971.8 18,416.86,226.9HI Honolulu City & Cnty of Honolulu DOTS TOTAL
DR 79.7 83.8 79.8 78.9 84.5NA 1.44%246.7 243.283.2City & Cnty of Honolulu DOTSHI HonoluluMB 5,705.7 5,875.7 6,109.9 6,029.9 6,033.8NA -2.47%17,725.1 18,173.66,143.7City & Cnty of Honolulu DOTSHI Honolulu
Modes: MB - Bus, DR - Demand Response, CR - Commuter Rail, HR - Heavy Rail, LR - Light Rail, AG - Automated Guideway, CC - Cable Car, FB - Ferry Boat, IP - Inclined Plane, IR - Intermediate Rail, MO - Monorail, TB - Trolleybus, VP - Vanpool
APTA TRANSIT RIDERSHIP REPORT
State and City Transit Agency ModeAverage
Weekday Jan '13Trips for Trips for
Feb '13Trips forMar '13
Trips ThruMar '13
Trips forJan '12
Trips forFeb '12
Trips forMar '12
Trips ThruMar '12 Quarterly
Change(000's) (000's) (000's) (000's) (000's) (000's) (000's) (000's)(000's)
17First Quarter, 2013
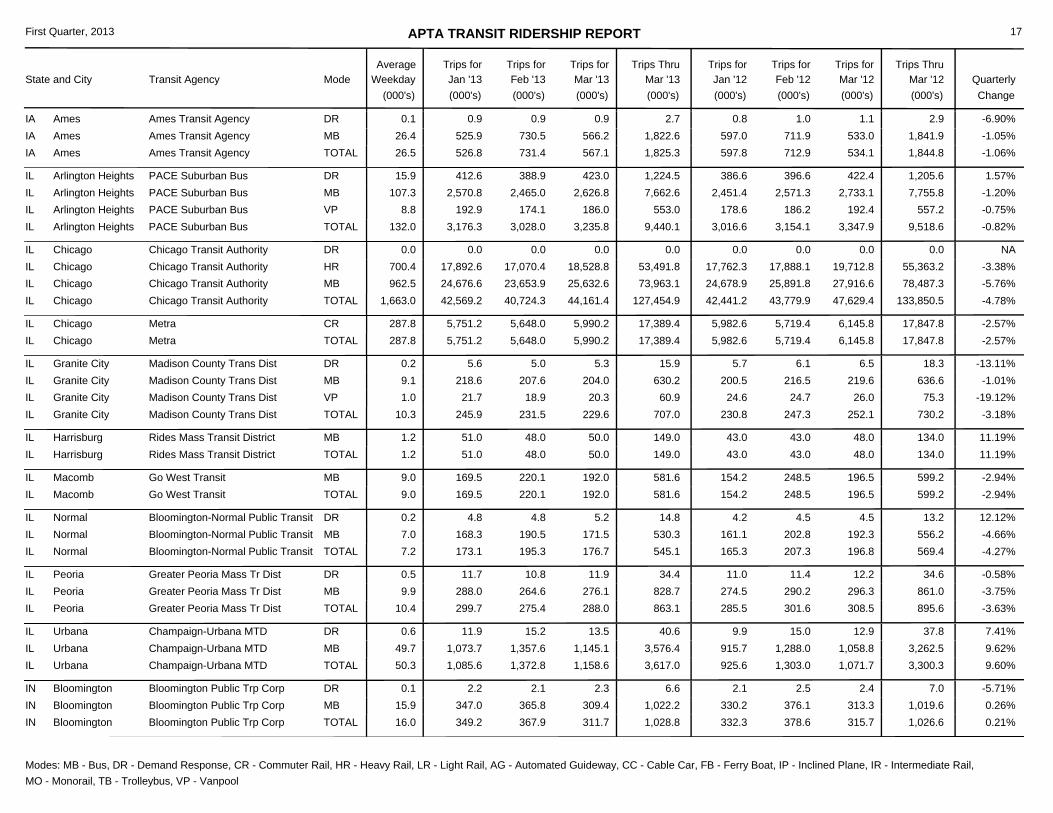
731.4 567.1 597.8 712.9 534.126.5 -1.06%1,825.3 1,844.8526.8IA Ames Ames Transit Agency TOTAL
DR 0.9 0.9 0.8 1.0 1.10.1 -6.90%2.7 2.90.9Ames Transit AgencyIA AmesMB 730.5 566.2 597.0 711.9 533.026.4 -1.05%1,822.6 1,841.9525.9Ames Transit AgencyIA Ames
3,028.0 3,235.8 3,016.6 3,154.1 3,347.9132.0 -0.82%9,440.1 9,518.63,176.3IL Arlington Heights PACE Suburban Bus TOTAL
DR 388.9 423.0 386.6 396.6 422.415.9 1.57%1,224.5 1,205.6412.6PACE Suburban BusIL Arlington HeightsMB 2,465.0 2,626.8 2,451.4 2,571.3 2,733.1107.3 -1.20%7,662.6 7,755.82,570.8PACE Suburban BusIL Arlington HeightsVP 174.1 186.0 178.6 186.2 192.48.8 -0.75%553.0 557.2192.9PACE Suburban BusIL Arlington Heights
40,724.3 44,161.4 42,441.2 43,779.9 47,629.41,663.0 -4.78%127,454.9 133,850.542,569.2IL Chicago Chicago Transit Authority TOTAL
DR 0.0 0.0 0.0 0.0 0.00.0 NA0.0 0.00.0Chicago Transit AuthorityIL ChicagoHR 17,070.4 18,528.8 17,762.3 17,888.1 19,712.8700.4 -3.38%53,491.8 55,363.217,892.6Chicago Transit AuthorityIL ChicagoMB 23,653.9 25,632.6 24,678.9 25,891.8 27,916.6962.5 -5.76%73,963.1 78,487.324,676.6Chicago Transit AuthorityIL Chicago
5,648.0 5,990.2 5,982.6 5,719.4 6,145.8287.8 -2.57%17,389.4 17,847.85,751.2IL Chicago Metra TOTALCR 5,648.0 5,990.2 5,982.6 5,719.4 6,145.8287.8 -2.57%17,389.4 17,847.85,751.2MetraIL Chicago
231.5 229.6 230.8 247.3 252.110.3 -3.18%707.0 730.2245.9IL Granite City Madison County Trans Dist TOTAL
DR 5.0 5.3 5.7 6.1 6.50.2 -13.11%15.9 18.35.6Madison County Trans DistIL Granite CityMB 207.6 204.0 200.5 216.5 219.69.1 -1.01%630.2 636.6218.6Madison County Trans DistIL Granite CityVP 18.9 20.3 24.6 24.7 26.01.0 -19.12%60.9 75.321.7Madison County Trans DistIL Granite City
48.0 50.0 43.0 43.0 48.01.2 11.19%149.0 134.051.0IL Harrisburg Rides Mass Transit District TOTALMB 48.0 50.0 43.0 43.0 48.01.2 11.19%149.0 134.051.0Rides Mass Transit DistrictIL Harrisburg
220.1 192.0 154.2 248.5 196.59.0 -2.94%581.6 599.2169.5IL Macomb Go West Transit TOTALMB 220.1 192.0 154.2 248.5 196.59.0 -2.94%581.6 599.2169.5Go West TransitIL Macomb
195.3 176.7 165.3 207.3 196.87.2 -4.27%545.1 569.4173.1IL Normal Bloomington-Normal Public Transit TOTAL
DR 4.8 5.2 4.2 4.5 4.50.2 12.12%14.8 13.24.8Bloomington-Normal Public Transit IL NormalMB 190.5 171.5 161.1 202.8 192.37.0 -4.66%530.3 556.2168.3Bloomington-Normal Public Transit IL Normal
275.4 288.0 285.5 301.6 308.510.4 -3.63%863.1 895.6299.7IL Peoria Greater Peoria Mass Tr Dist TOTAL
DR 10.8 11.9 11.0 11.4 12.20.5 -0.58%34.4 34.611.7Greater Peoria Mass Tr DistIL PeoriaMB 264.6 276.1 274.5 290.2 296.39.9 -3.75%828.7 861.0288.0Greater Peoria Mass Tr DistIL Peoria
1,372.8 1,158.6 925.6 1,303.0 1,071.750.3 9.60%3,617.0 3,300.31,085.6IL Urbana Champaign-Urbana MTD TOTAL
DR 15.2 13.5 9.9 15.0 12.90.6 7.41%40.6 37.811.9Champaign-Urbana MTDIL UrbanaMB 1,357.6 1,145.1 915.7 1,288.0 1,058.849.7 9.62%3,576.4 3,262.51,073.7Champaign-Urbana MTDIL Urbana
367.9 311.7 332.3 378.6 315.716.0 0.21%1,028.8 1,026.6349.2IN Bloomington Bloomington Public Trp Corp TOTAL
DR 2.1 2.3 2.1 2.5 2.40.1 -5.71%6.6 7.02.2Bloomington Public Trp CorpIN BloomingtonMB 365.8 309.4 330.2 376.1 313.315.9 0.26%1,022.2 1,019.6347.0Bloomington Public Trp CorpIN Bloomington
Modes: MB - Bus, DR - Demand Response, CR - Commuter Rail, HR - Heavy Rail, LR - Light Rail, AG - Automated Guideway, CC - Cable Car, FB - Ferry Boat, IP - Inclined Plane, IR - Intermediate Rail, MO - Monorail, TB - Trolleybus, VP - Vanpool

APTA TRANSIT RIDERSHIP REPORT
State and City Transit Agency ModeAverage
Weekday Jan '13Trips for Trips for
Feb '13Trips forMar '13
Trips ThruMar '13
Trips forJan '12
Trips forFeb '12
Trips forMar '12
Trips ThruMar '12 Quarterly
Change(000's) (000's) (000's) (000's) (000's) (000's) (000's) (000's)(000's)
18First Quarter, 2013
272.8 290.6 280.5 295.1 320.811.5 -7.07%833.0 896.4269.6IN Chesterton Northern IN Commuter TD TOTALCR 272.8 290.6 280.5 295.1 320.811.5 -7.07%833.0 896.4269.6Northern IN Commuter TDIN Chesterton
162.6 163.3 173.5 182.9 184.2NA -8.29%495.8 540.6169.9IN Fort Wayne Fort Wayne Public Tr Corp TOTAL
DR 4.1 4.2 3.5 3.6 3.9NA 13.64%12.5 11.04.2Fort Wayne Public Tr CorpIN Fort WayneMB 158.5 159.1 170.0 179.3 180.37.0 -8.74%483.3 529.6165.7Fort Wayne Public Tr CorpIN Fort Wayne
647.0 524.3 550.9 630.5 511.627.3 4.63%1,771.4 1,693.0600.1IN Lafayette Greater Lafayette PTC TOTAL
DR 1.9 1.9 2.0 2.0 2.10.1 -4.92%5.8 6.12.0Greater Lafayette PTCIN LafayetteMB 645.1 522.4 548.9 628.5 509.527.2 4.67%1,765.6 1,686.9598.1Greater Lafayette PTCIN Lafayette
166.9 158.6 175.8 181.2 174.77.3 -6.75%495.8 531.7170.3IN Muncie Muncie Indiana Transit Sys TOTAL
DR 5.5 5.7 5.6 5.8 6.20.2 -3.98%16.9 17.65.7Muncie Indiana Transit SysIN MuncieMB 161.4 152.9 170.2 175.4 168.57.0 -6.85%478.9 514.1164.6Muncie Indiana Transit SysIN Muncie
197.4 205.0 196.1 208.2 211.38.8 -2.89%597.8 615.6195.4IN South Bend South Bend Public Transp TOTAL
DR 4.5 4.6 4.5 4.7 4.80.2 -2.14%13.7 14.04.6South Bend Public TranspIN South BendMB 192.9 200.4 191.6 203.5 206.58.6 -2.91%584.1 601.6190.8South Bend Public TranspIN South Bend
53.1 54.7 53.5 63.1 62.32.5 -16.88%148.7 178.940.9KS Olathe Johnson County Transit TOTAL
DR 9.0 9.1 8.3 9.1 9.50.4 -2.60%26.2 26.98.1Johnson County Transit KS OlatheMB 44.1 45.6 45.2 54.0 52.82.1 -19.41%122.5 152.032.8Johnson County Transit KS Olathe
10.5 9.7 9.1 10.8 11.21.0 -2.25%30.4 31.110.2KY Bowling Green Community Action of Southern KY TOTAL
DR 1.1 1.1 1.2 1.3 1.50.5 -12.50%3.5 4.01.3Community Action of Southern KYKY Bowling GreenMB 9.4 8.6 7.9 9.5 9.70.4 -0.74%26.9 27.18.9Community Action of Southern KYKY Bowling Green
79.1 59.3 25.5 71.1 51.413.6 15.34%170.7 148.032.3KY Bowling Green Western Kentucky University Toppe TOTAL
DR 0.1 0.3 0.0 0.1 0.00.0 >100%0.5 0.10.1Western Kentucky University ToppeKY Bowling GreenMB 79.0 59.0 25.5 71.0 51.413.6 15.08%170.2 147.932.2Western Kentucky University ToppeKY Bowling GreenVP 0.0 0.0 0.0 0.0 0.00.0 NA0.0 0.00.0Western Kentucky University ToppeKY Bowling Green
285.4 294.3 300.2 300.1 308.312.0 -3.42%877.5 908.6297.8KY Fort Wright Tr Auth of Northern Kentucky TOTAL
DR 7.1 7.4 7.9 8.3 8.50.3 -10.93%22.0 24.77.5Tr Auth of Northern KentuckyKY Fort WrightMB 278.3 286.9 292.3 291.8 299.811.7 -3.21%855.5 883.9290.3Tr Auth of Northern KentuckyKY Fort Wright
1,225.5 1,196.1 1,300.4 1,288.0 1,305.948.3 -5.21%3,691.3 3,894.31,269.7KY Louisville Transit Auth of River City TOTAL
DR 34.0 37.2 35.4 35.3 37.11.4 -0.56%107.2 107.836.0Transit Auth of River CityKY LouisvilleMB 1,191.5 1,158.9 1,265.0 1,252.7 1,268.846.8 -5.35%3,584.1 3,786.51,233.7Transit Auth of River CityKY Louisville
1,426.4 1,674.4 1,379.2 1,258.5 1,543.4NA 6.09%4,435.7 4,181.11,334.9LA New Orleans Regional Transit Auth TOTAL
DR 15.0 18.0 16.2 15.3 17.7NA 0.20%49.3 49.216.3Regional Transit AuthLA New OrleansLR 516.8 691.3 548.1 448.0 662.4NA -8.62%1,515.6 1,658.5307.5Regional Transit AuthLA New OrleansMB 894.6 965.1 814.9 795.2 863.3NA 16.07%2,870.8 2,473.41,011.1Regional Transit AuthLA New Orleans
Modes: MB - Bus, DR - Demand Response, CR - Commuter Rail, HR - Heavy Rail, LR - Light Rail, AG - Automated Guideway, CC - Cable Car, FB - Ferry Boat, IP - Inclined Plane, IR - Intermediate Rail, MO - Monorail, TB - Trolleybus, VP - Vanpool

APTA TRANSIT RIDERSHIP REPORT
State and City Transit Agency ModeAverage
Weekday Jan '13Trips for Trips for
Feb '13Trips forMar '13
Trips ThruMar '13
Trips forJan '12
Trips forFeb '12
Trips forMar '12
Trips ThruMar '12 Quarterly
Change(000's) (000's) (000's) (000's) (000's) (000's) (000's) (000's)(000's)
19First Quarter, 2013
368.1 308.9 191.7 370.1 312.313.0 2.22%893.5 874.1216.5MA Amherst UMass Transit Service TOTALMB 368.1 308.9 191.7 370.1 312.313.0 2.22%893.5 874.1216.5UMass Transit ServiceMA Amherst
28,561.0 34,007.3 31,415.3 32,103.1 35,703.61,286.8 -4.70%94,554.6 99,222.031,986.3MA Boston Massachusetts Bay Tr Auth TOTAL
CR 2,557.1 2,981.9 3,017.5 2,897.3 3,137.4127.5 -5.21%8,580.4 9,052.23,041.4Massachusetts Bay Tr AuthMA BostonDR 148.1 177.4 213.8 210.8 231.06.6 -23.98%498.4 655.6172.9Massachusetts Bay Tr AuthMA BostonFB 66.2 80.9 80.2 82.6 97.93.4 -14.00%224.2 260.777.1Massachusetts Bay Tr AuthMA BostonHR 12,046.1 14,369.5 12,562.4 12,789.3 14,428.5534.7 -0.24%39,683.7 39,780.213,268.1Massachusetts Bay Tr AuthMA BostonLR 5,244.6 6,238.3 5,899.4 6,274.9 6,983.9221.9 -10.36%17,173.0 19,158.25,690.1Massachusetts Bay Tr AuthMA BostonMB 8,247.7 9,884.4 9,383.9 9,580.7 10,524.6381.1 -6.38%27,608.7 29,489.29,476.6Massachusetts Bay Tr AuthMA BostonTB 251.2 274.9 258.1 267.5 300.311.6 -4.81%786.2 825.9260.1Massachusetts Bay Tr AuthMA Boston
61.9 66.6 NA NA NANA NA185.3 NA56.8MD Annapolis Annapolis Department of Transporta TOTAL
DR 0.4 0.4 NA NA NANA NA1.2 NA0.4Annapolis Department of TransportaMD AnnapolisMB 61.5 66.2 NA NA NANA NA184.1 NA56.4Annapolis Department of TransportaMD Annapolis
8,365.0 8,705.5 9,323.8 9,405.7 10,185.7355.9 -10.90%25,764.4 28,915.28,693.9MD Baltimore Maryland Transit Admin TOTAL
CR 703.6 746.3 661.0 704.2 758.236.0 3.44%2,196.5 2,123.4746.6Maryland Transit AdminMD BaltimoreDR 127.7 136.9 152.7 169.9 174.87.0 -18.78%404.0 497.4139.4Maryland Transit AdminMD BaltimoreHR 1,217.3 1,252.6 1,215.0 1,277.2 1,367.650.3 -3.53%3,723.6 3,859.81,253.7Maryland Transit AdminMD BaltimoreLR 603.1 669.7 673.6 691.7 725.223.5 -8.75%1,907.6 2,090.5634.8Maryland Transit AdminMD BaltimoreMB 5,713.3 5,900.0 6,621.5 6,562.7 7,159.9239.0 -13.82%17,532.7 20,344.15,919.4Maryland Transit AdminMD Baltimore
NA NA NA NA NANA NANA NANAMD College Park Shuttle-UM Transit System TOTAL
DR NA NA NA NA NANA NANA NANAShuttle-UM Transit SystemMD College ParkMB 447.2 325.2 161.3 430.6 349.5NA 2.67%966.5 941.4194.1Shuttle-UM Transit SystemMD College Park
1,997.7 2,164.4 2,085.9 2,192.5 2,396.783.1 -7.60%6,167.9 6,675.12,005.8MD Rockville Montgomery County Ride-On TOTALMB 1,997.7 2,164.4 2,085.9 2,192.5 2,396.783.1 -7.60%6,167.9 6,675.12,005.8Montgomery County Ride-OnMD Rockville
36.1 45.8 37.9 40.1 44.51.5 -1.39%120.8 122.538.9ME Portland Northern NE Passenger RA TOTALCR 36.1 45.8 37.9 40.1 44.51.5 -1.39%120.8 122.538.9Northern NE Passenger RAME Portland
564.0 571.0 573.5 556.5 597.925.1 -0.74%1,715.1 1,727.9580.1MI Ann Arbor Ann Arbor Transportation Auth TOTAL
DR 14.0 15.7 14.1 14.1 15.20.6 2.53%44.5 43.414.8Ann Arbor Transportation AuthMI Ann ArborMB 550.0 555.3 559.4 542.4 582.724.6 -0.83%1,670.6 1,684.5565.3Ann Arbor Transportation AuthMI Ann Arbor
54.3 56.8 56.8 56.8 59.52.7 -3.06%167.8 173.156.7MI Bay City Bay Metropolitan Transp Auth TOTAL
DR 3.9 4.6 4.2 4.2 4.70.2 -2.29%12.8 13.14.3Bay Metropolitan Transp AuthMI Bay CityMB 50.4 52.2 52.6 52.6 54.82.5 -3.13%155.0 160.052.4Bay Metropolitan Transp AuthMI Bay City
Modes: MB - Bus, DR - Demand Response, CR - Commuter Rail, HR - Heavy Rail, LR - Light Rail, AG - Automated Guideway, CC - Cable Car, FB - Ferry Boat, IP - Inclined Plane, IR - Intermediate Rail, MO - Monorail, TB - Trolleybus, VP - Vanpool

APTA TRANSIT RIDERSHIP REPORT
State and City Transit Agency ModeAverage
Weekday Jan '13Trips for Trips for
Feb '13Trips forMar '13
Trips ThruMar '13
Trips forJan '12
Trips forFeb '12
Trips forMar '12
Trips ThruMar '12 Quarterly
Change(000's) (000's) (000's) (000's) (000's) (000's) (000's) (000's)(000's)
20First Quarter, 2013
2,244.0 NA NA NA NANA NANA NA2,499.1MI Detroit City of Detroit Dept of Trp TOTAL
DR 22.0 NA 22.0 22.0 22.0NA NANA 66.024.0City of Detroit Dept of TrpMI DetroitMB 2,222.0 2,509.0 2,654.1 2,567.3 2,890.696.3 -11.17%7,206.1 8,112.02,475.1City of Detroit Dept of TrpMI Detroit
503.5 541.4 548.5 547.9 570.421.5 -5.20%1,580.1 1,666.8535.2MI Flint Mass Transportation Authority TOTAL
DR 38.9 42.6 41.9 41.5 45.41.7 -4.58%122.9 128.841.4Mass Transportation AuthorityMI FlintMB 464.6 498.8 506.6 506.4 525.019.8 -5.25%1,457.2 1,538.0493.8Mass Transportation AuthorityMI Flint
1,159.1 1,104.5 1,119.7 1,159.8 1,085.550.6 2.26%3,441.1 3,365.01,177.5MI Grand Rapids Interurban Transit Partnership TOTAL
DR 32.4 35.8 41.3 38.9 39.71.6 -13.84%103.3 119.935.1Interurban Transit PartnershipMI Grand RapidsMB 1,122.4 1,064.0 1,074.4 1,116.8 1,041.748.8 2.82%3,324.2 3,232.91,137.8Interurban Transit PartnershipMI Grand RapidsVP 4.3 4.7 4.0 4.1 4.10.2 11.48%13.6 12.24.6Interurban Transit PartnershipMI Grand Rapids
284.2 269.2 259.4 285.8 269.611.9 2.10%831.9 814.8278.5MI Kalamazoo Kalamazoo Metro Transit Sys TOTAL
DR 10.7 11.7 10.6 11.1 11.90.5 -1.79%33.0 33.610.6Kalamazoo Metro Transit SysMI KalamazooMB 273.5 257.5 248.8 274.7 257.711.4 2.27%798.9 781.2267.9Kalamazoo Metro Transit SysMI Kalamazoo
1,264.5 1,107.9 1,187.8 1,328.5 1,118.552.1 -0.93%3,600.9 3,634.81,228.5MI Lansing Capital Area Transp Authority TOTAL
DR 42.1 45.5 45.6 46.2 48.01.9 -6.29%131.0 139.843.4Capital Area Transp AuthorityMI LansingMB 1,222.4 1,062.4 1,142.2 1,282.3 1,070.550.3 -0.72%3,469.9 3,495.01,185.1Capital Area Transp AuthorityMI Lansing
34.1 34.7 33.9 35.8 36.11.5 -2.74%102.9 105.834.1MI Monroe Lake Erie Transp Commission TOTAL
DR 10.9 11.3 11.8 11.6 12.00.5 -4.24%33.9 35.411.7Lake Erie Transp CommissionMI MonroeMB 23.2 23.4 22.1 24.2 24.11.0 -1.99%69.0 70.422.4Lake Erie Transp CommissionMI Monroe
58.2 63.1 62.0 61.8 62.62.7 -2.15%182.4 186.461.1MI Muskegon Heights Muskegon Area Transit Sys TOTAL
DR 1.9 2.3 1.5 1.6 1.70.1 29.17%6.2 4.82.0Muskegon Area Transit SysMI Muskegon HeightsMB 56.3 60.8 60.5 60.2 60.92.6 -2.97%176.2 181.659.1Muskegon Area Transit SysMI Muskegon Heights
117.0 129.6 127.5 126.5 135.211.4 -5.47%367.9 389.2121.3MI Port Huron Blue Water Area Transp Comm TOTAL
DR 42.2 49.7 52.4 50.1 54.88.3 -12.14%138.2 157.346.3Blue Water Area Transp CommMI Port HuronMB 74.8 79.9 75.1 76.4 80.43.0 -0.95%229.7 231.975.0Blue Water Area Transp CommMI Port Huron
204.1 210.6 208.0 213.8 222.59.7 -2.73%626.7 644.3212.0MN Burnsville Minnesota Valley Transit Auth TOTAL
DR 1.7 1.7 2.0 1.9 2.00.1 -11.86%5.2 5.91.8Minnesota Valley Transit AuthMN BurnsvilleMB 202.4 208.9 206.0 211.9 220.59.6 -2.65%621.5 638.4210.2Minnesota Valley Transit AuthMN Burnsville
74.5 75.0 77.6 80.7 80.83.6 -5.52%225.9 239.176.4MN Eden Prairie Southwest Metro Transit TOTALMB 74.5 75.0 77.6 80.7 80.83.6 -5.52%225.9 239.176.4Southwest Metro TransitMN Eden Prairie
6,264.5 6,760.2 6,418.2 6,528.4 6,946.7260.2 -2.35%19,425.8 19,893.36,401.1MN Minneapolis Metro Transit TOTAL
CR 52.9 56.0 48.0 46.5 49.22.5 14.54%164.6 143.755.7Metro TransitMN MinneapolisLR 684.4 772.4 777.7 687.7 809.727.9 -1.82%2,233.8 2,275.1777.0Metro TransitMN MinneapolisMB 5,527.2 5,931.8 5,592.5 5,794.2 6,087.8229.8 -2.56%17,027.4 17,474.55,568.4Metro TransitMN Minneapolis
Modes: MB - Bus, DR - Demand Response, CR - Commuter Rail, HR - Heavy Rail, LR - Light Rail, AG - Automated Guideway, CC - Cable Car, FB - Ferry Boat, IP - Inclined Plane, IR - Intermediate Rail, MO - Monorail, TB - Trolleybus, VP - Vanpool

APTA TRANSIT RIDERSHIP REPORT
State and City Transit Agency ModeAverage
Weekday Jan '13Trips for Trips for
Feb '13Trips forMar '13
Trips ThruMar '13
Trips forJan '12
Trips forFeb '12
Trips forMar '12
Trips ThruMar '12 Quarterly
Change(000's) (000's) (000's) (000's) (000's) (000's) (000's) (000's)(000's)
21First Quarter, 2013
40.3 40.6 44.0 42.8 44.21.8 -5.34%124.0 131.043.1MN Plymouth Plymouth Metrolink & DAR TOTAL
DR 3.5 3.3 3.6 3.4 3.50.0 -0.95%10.4 10.53.6Plymouth Metrolink & DARMN PlymouthMB 36.8 37.3 40.4 39.4 40.71.8 -5.73%113.6 120.539.5Plymouth Metrolink & DARMN Plymouth
1,113.7 1,296.4 1,337.1 1,332.1 1,446.950.6 -9.53%3,724.0 4,116.11,313.9MO Kansas City Kansas City Area Trp Auth TOTAL
DR 29.7 36.5 39.3 38.8 40.41.5 -13.42%102.6 118.536.4Kansas City Area Trp AuthMO Kansas CityMB 1,079.1 1,253.9 1,292.7 1,288.5 1,401.648.8 -9.50%3,604.5 3,982.81,271.5Kansas City Area Trp AuthMO Kansas CityVP 4.9 6.0 5.1 4.8 4.90.3 14.19%16.9 14.86.0Kansas City Area Trp AuthMO Kansas City
3,548.3 3,750.9 3,616.9 3,706.9 4,017.7142.8 -2.93%11,009.0 11,341.53,709.8MO Saint Louis Bi-State Dev Agency TOTAL
DR 45.2 49.0 48.1 47.9 50.62.0 -1.02%145.1 146.650.9Bi-State Dev AgencyMO Saint LouisLR 1,269.6 1,365.4 1,271.8 1,309.9 1,467.150.1 -3.01%3,927.1 4,048.81,292.1Bi-State Dev AgencyMO Saint LouisMB 2,233.5 2,336.5 2,297.0 2,349.1 2,500.090.7 -2.93%6,936.8 7,146.12,366.8Bi-State Dev AgencyMO Saint Louis
114.0 114.8 134.0 133.1 143.54.9 -14.76%350.0 410.6121.2MO Springfield City Utilities of Springfield TOTAL
DR 1.4 1.7 1.6 1.5 1.80.1 -2.04%4.8 4.91.7City Utilities of SpringfieldMO SpringfieldMB 112.6 113.1 132.4 131.6 141.74.8 -14.91%345.2 405.7119.5City Utilities of SpringfieldMO Springfield
650.2 695.7 587.0 660.0 617.931.7 6.39%1,984.0 1,864.9638.1NC Chapel Hill Chapel Hill Transit TOTAL
DR 5.5 5.6 5.1 5.3 5.60.3 1.88%16.3 16.05.2Chapel Hill TransitNC Chapel HillMB 644.7 690.1 581.9 654.7 612.331.4 6.43%1,967.7 1,848.9632.9Chapel Hill TransitNC Chapel Hill
2,104.6 2,218.5 2,216.0 2,217.9 2,357.9NA -4.04%6,517.7 6,791.82,194.6NC Charlotte Charlotte Area Transit TOTAL
DR 29.2 30.8 31.3 31.2 33.41.2 -5.63%90.5 95.930.5Charlotte Area TransitNC CharlotteLR 373.1 423.4 381.3 388.3 458.0NA -2.75%1,193.8 1,227.6397.3Charlotte Area TransitNC CharlotteMB 1,683.3 1,744.4 1,787.3 1,780.8 1,847.870.8 -4.45%5,174.8 5,415.91,747.1Charlotte Area TransitNC CharlotteVP 19.0 19.9 16.1 17.6 18.7NA 11.83%58.6 52.419.7Charlotte Area TransitNC Charlotte
421.1 407.1 427.5 449.3 438.216.8 -5.87%1,237.8 1,315.0409.6NC Greensboro Greensboro Transit Auth TOTAL
DR 19.2 20.0 18.3 18.9 20.30.8 1.04%58.1 57.518.9Greensboro Transit AuthNC GreensboroMB 401.9 387.1 409.2 430.4 417.916.0 -6.19%1,179.7 1,257.5390.7Greensboro Transit AuthNC Greensboro
5,362.8 6,205.5 6,381.7 6,381.0 7,129.1239.5 -13.52%17,203.2 19,891.85,634.9NJ Jersey City Port Authority of NY & NJ TOTAL
AG 127.0 179.2 143.3 131.1 172.45.1 1.61%454.0 446.8147.8Port Authority of NY & NJNJ Jersey CityFB 82.6 87.7 109.6 107.3 118.55.5 1.70%341.1 335.4170.8Port Authority of NY & NJNJ Jersey CityHR 5,153.2 5,938.6 6,128.8 6,142.6 6,838.2228.8 -14.14%16,408.1 19,109.65,316.3Port Authority of NY & NJNJ Jersey City
NA NA NA NA NANA NANA NANANJ Lindenwold Port Authority Transit Corp TOTAL
HR 813.9 895.6 882.1 881.3 955.836.7 -3.90%2,613.2 2,719.2903.7Port Authority Transit CorpNJ LindenwoldMB NA NA NA NA NANA NANA NANAPort Authority Transit CorpNJ Lindenwold
Modes: MB - Bus, DR - Demand Response, CR - Commuter Rail, HR - Heavy Rail, LR - Light Rail, AG - Automated Guideway, CC - Cable Car, FB - Ferry Boat, IP - Inclined Plane, IR - Intermediate Rail, MO - Monorail, TB - Trolleybus, VP - Vanpool

APTA TRANSIT RIDERSHIP REPORT
State and City Transit Agency ModeAverage
Weekday Jan '13Trips for Trips for
Feb '13Trips forMar '13
Trips ThruMar '13
Trips forJan '12
Trips forFeb '12
Trips forMar '12
Trips ThruMar '12 Quarterly
Change(000's) (000's) (000's) (000's) (000's) (000's) (000's) (000's)(000's)
22First Quarter, 2013
19,671.0 21,945.5 20,658.4 20,960.0 22,902.5NA -2.96%62,611.5 64,520.920,995.0NJ Newark New Jersey Transit Corp TOTAL
CR 5,930.4 6,712.0 6,367.8 6,287.7 6,762.6NA -2.91%18,854.0 19,418.16,211.6New Jersey Transit CorpNJ NewarkLR 1,576.6 1,714.7 1,633.4 1,748.1 1,915.7NA -7.87%4,880.5 5,297.21,589.2New Jersey Transit CorpNJ NewarkMB 12,164.0 13,518.8 12,657.2 12,924.2 14,224.2NA -2.33%38,877.0 39,805.613,194.2New Jersey Transit CorpNJ Newark
106.6 118.5 112.1 118.0 129.84.9 -7.28%333.7 359.9108.6NM Albuquerque New Mexico Dept of Trp TOTAL
CR 81.3 91.1 86.1 90.5 101.03.6 -8.32%254.5 277.682.1New Mexico Dept of TrpNM AlbuquerqueMB 25.3 27.4 26.0 27.5 28.81.3 -3.77%79.2 82.326.5New Mexico Dept of TrpNM Albuquerque
73.8 70.2 59.9 69.2 66.73.6 7.00%209.5 195.865.5NM Las Cruces City of Las Cruces-RdRUNR Tr TOTAL
DR 4.1 4.4 4.5 4.4 4.31.0 -3.79%12.7 13.24.2City of Las Cruces-RdRUNR TrNM Las CrucesMB 69.7 65.8 55.4 64.8 62.42.6 7.78%196.8 182.661.3City of Las Cruces-RdRUNR TrNM Las Cruces
651.0 703.0 666.2 652.5 686.822.7 1.57%2,036.9 2,005.5682.9NV Reno Regional Transportation Comm TOTAL
DR 18.5 20.4 18.5 16.7 18.10.7 10.88%59.1 53.320.2Regional Transportation CommNV RenoMB 632.5 682.6 647.7 635.8 668.722.0 1.31%1,977.8 1,952.2662.7Regional Transportation CommNV Reno
1,280.1 1,359.5 1,196.1 1,295.8 1,353.263.6 0.95%3,881.6 3,845.11,242.0NY Albany Capital District Transp Auth TOTAL
DR 19.2 21.4 21.4 22.1 24.00.8 -9.78%60.9 67.520.3Capital District Transp AuthNY AlbanyMB 1,260.9 1,338.1 1,174.7 1,273.7 1,329.262.8 1.14%3,820.7 3,777.61,221.7Capital District Transp AuthNY Albany
2,459.5 2,554.4 2,388.3 2,529.6 2,710.3105.1 -2.45%7,441.3 7,628.22,427.4NY Buffalo Niagara Frontier Trp Auth TOTAL
DR 13.8 14.5 14.3 15.2 15.70.7 -5.53%42.7 45.214.4Niagara Frontier Trp AuthNY BuffaloLR 512.0 535.3 521.5 569.3 617.921.6 -8.85%1,557.5 1,708.7510.2Niagara Frontier Trp AuthNY BuffaloMB 1,933.7 2,004.6 1,852.5 1,945.1 2,076.782.9 -0.57%5,841.1 5,874.31,902.8Niagara Frontier Trp AuthNY Buffalo
460.4 417.3 279.2 431.5 394.517.0 9.53%1,210.5 1,105.2332.8NY Ithaca Tompkins Consol Area Transit TOTAL
DR 5.3 6.2 5.2 5.5 6.50.3 0.00%17.2 17.25.7Tompkins Consol Area TransitNY IthacaMB 454.7 410.8 273.5 425.5 387.416.7 9.74%1,192.2 1,086.4326.7Tompkins Consol Area TransitNY IthacaVP 0.4 0.3 0.5 0.5 0.60.0 -31.25%1.1 1.60.4Tompkins Consol Area TransitNY Ithaca
7,305.0 8,095.6 8,021.5 7,585.6 8,258.1334.1 -1.66%23,469.3 23,865.28,068.7NY New York MTA Long Island Rail Road TOTALCR 7,305.0 8,095.6 8,021.5 7,585.6 8,258.1334.1 -1.66%23,469.3 23,865.28,068.7MTA Long Island Rail RoadNY New York
6,035.7 7,041.4 6,574.1 6,428.3 7,173.1282.5 -1.84%19,804.7 20,175.56,727.6NY New York MTA Metro-North Railroad TOTAL
CR 5,996.3 6,997.2 6,527.4 6,383.2 7,124.0280.3 -1.78%19,677.5 20,034.66,684.0MTA Metro-North RailroadNY New YorkFB 11.5 15.8 16.7 15.7 16.80.7 -18.70%40.0 49.212.7MTA Metro-North RailroadNY New YorkMB 27.9 28.4 30.0 29.4 32.31.4 -4.91%87.2 91.730.9MTA Metro-North RailroadNY New York
256,856.5 290,902.5 268,604.8 269,730.2 301,031.010,955.4 -1.23%829,083.1 839,366.0281,324.1NY New York MTA New York City Transit TOTAL
DR 678.4 773.9 757.3 761.3 848.328.8 -6.30%2,217.8 2,366.9765.5MTA New York City TransitNY New YorkHR 193,035.8 221,264.8 203,795.4 204,099.9 227,164.48,302.6 -1.20%627,446.8 635,059.7213,146.2MTA New York City TransitNY New YorkMB 63,142.3 68,863.8 64,052.1 64,869.0 73,018.32,624.0 -1.25%199,418.5 201,939.467,412.4MTA New York City TransitNY New York
Modes: MB - Bus, DR - Demand Response, CR - Commuter Rail, HR - Heavy Rail, LR - Light Rail, AG - Automated Guideway, CC - Cable Car, FB - Ferry Boat, IP - Inclined Plane, IR - Intermediate Rail, MO - Monorail, TB - Trolleybus, VP - Vanpool

APTA TRANSIT RIDERSHIP REPORT
State and City Transit Agency ModeAverage
Weekday Jan '13Trips for Trips for
Feb '13Trips forMar '13
Trips ThruMar '13
Trips forJan '12
Trips forFeb '12
Trips forMar '12
Trips ThruMar '12 Quarterly
Change(000's) (000's) (000's) (000's) (000's) (000's) (000's) (000's)(000's)
23First Quarter, 2013
315.8 343.0 385.6 367.2 415.414.9 -12.28%1,024.8 1,168.2366.0NY New York MTA Staten Island Railway TOTALHR 315.8 343.0 385.6 367.2 415.414.9 -12.28%1,024.8 1,168.2366.0MTA Staten Island RailwayNY New York
1,314.1 1,691.5 1,557.2 1,633.0 1,882.1NA -9.69%4,580.8 5,072.31,575.2NY New York New York City DOT TOTAL
FB 1,261.6 1,636.4 1,501.7 1,577.9 1,822.1NA -9.94%4,414.7 4,901.71,516.7New York City DOTNY New YorkMB 52.5 55.1 55.5 55.1 60.02.6 -2.64%166.1 170.658.5New York City DOTNY New York
412.2 468.1 437.5 405.8 484.018.4 -0.13%1,325.6 1,327.3445.3OH Akron METRO Regional Transit Authority TOTAL
DR 18.5 20.1 23.2 21.0 24.10.9 -15.81%57.5 68.318.9METRO Regional Transit AuthorityOH AkronMB 393.7 448.0 414.3 384.8 459.917.6 0.72%1,268.1 1,259.0426.4METRO Regional Transit AuthorityOH Akron
208.4 216.2 210.6 215.2 219.89.2 0.85%651.1 645.6226.5OH Canton Stark Area RTA TOTAL
DR 11.8 11.9 11.7 12.5 13.10.5 -4.83%35.5 37.311.8Stark Area RTAOH CantonMB 196.6 204.3 198.9 202.7 206.78.7 1.20%615.6 608.3214.7Stark Area RTAOH Canton
1,352.0 1,421.6 1,274.8 1,278.7 1,288.9NA 9.37%4,202.6 3,842.41,429.0OH Cincinnati Southwest Ohio RTA TOTAL
DR 12.9 14.3 13.9 14.0 14.8NA -3.04%41.4 42.714.2Southwest Ohio RTAOH CincinnatiMB 1,339.1 1,407.3 1,260.9 1,264.7 1,274.157.6 9.51%4,161.2 3,799.71,414.8Southwest Ohio RTAOH Cincinnati
3,943.2 4,134.2 3,790.6 3,928.3 4,247.9NA 0.58%12,036.8 11,966.83,959.4OH Cleveland Greater Cleveland Reg TA TOTAL
DR 43.9 35.5 47.9 49.2 52.9NA -15.40%126.9 150.047.5Greater Cleveland Reg TAOH ClevelandHR 528.1 554.4 493.5 508.7 566.4NA 2.98%1,615.3 1,568.6532.8Greater Cleveland Reg TAOH ClevelandLR 218.3 223.9 230.4 217.9 242.6NA -1.27%682.1 690.9239.9Greater Cleveland Reg TAOH ClevelandMB 3,152.9 3,320.4 3,018.8 3,152.5 3,386.0NA 0.58%9,612.5 9,557.33,139.2Greater Cleveland Reg TAOH Cleveland
1,504.4 1,555.6 1,572.3 1,588.4 1,628.162.9 -3.25%4,633.3 4,788.81,573.3OH Columbus Central Ohio Transit Auth TOTAL
DR 19.4 21.2 19.3 19.7 21.10.8 1.50%61.0 60.120.4Central Ohio Transit AuthOH ColumbusMB 1,485.0 1,534.4 1,553.0 1,568.7 1,607.062.1 -3.31%4,572.3 4,728.71,552.9Central Ohio Transit AuthOH Columbus
58.0 61.4 61.7 64.6 68.13.0 -7.15%180.5 194.461.1OH Grand River LAKETRAN TOTAL
DR 19.1 21.0 20.8 21.1 22.51.0 -5.75%60.7 64.420.6LAKETRANOH Grand RiverMB 38.9 40.4 40.9 43.5 45.62.0 -7.85%119.8 130.040.5LAKETRANOH Grand River
175.1 143.7 159.2 181.5 146.5NA -7.49%450.7 487.2131.9OH Kent Portage Area Reg Trp Auth TOTAL
DR 10.0 9.8 9.2 10.1 10.2NA 1.02%29.8 29.510.0Portage Area Reg Trp AuthOH KentMB 165.1 133.9 150.0 171.4 136.3NA -8.04%420.9 457.7121.9Portage Area Reg Trp AuthOH Kent
281.8 254.5 298.7 318.5 274.211.4 -7.24%826.9 891.4290.6OH Toledo Toledo Area Reg Transit Auth TOTAL
DR 24.5 27.3 24.1 24.6 24.10.9 7.14%78.0 72.826.2Toledo Area Reg Transit AuthOH ToledoMB 257.3 227.2 274.6 293.9 250.110.5 -8.51%748.9 818.6264.4Toledo Area Reg Transit AuthOH Toledo
Modes: MB - Bus, DR - Demand Response, CR - Commuter Rail, HR - Heavy Rail, LR - Light Rail, AG - Automated Guideway, CC - Cable Car, FB - Ferry Boat, IP - Inclined Plane, IR - Intermediate Rail, MO - Monorail, TB - Trolleybus, VP - Vanpool

APTA TRANSIT RIDERSHIP REPORT
State and City Transit Agency ModeAverage
Weekday Jan '13Trips for Trips for
Feb '13Trips forMar '13
Trips ThruMar '13
Trips forJan '12
Trips forFeb '12
Trips forMar '12
Trips ThruMar '12 Quarterly
Change(000's) (000's) (000's) (000's) (000's) (000's) (000's) (000's)(000's)
24First Quarter, 2013
7,789.1 8,495.1 8,373.5 8,345.7 8,742.2319.3 -3.69%24,522.9 25,461.48,238.7OR Portland Tri-County Metro Trp Dist TOTAL
CR 34.0 35.1 34.0 34.4 34.51.7 3.30%106.3 102.937.2Tri-County Metro Trp DistOR PortlandDR 81.9 88.2 87.0 88.3 92.33.6 -3.92%257.1 267.687.0Tri-County Metro Trp DistOR PortlandLR 2,839.2 3,305.9 3,258.9 3,266.4 3,502.2116.0 -8.61%9,164.0 10,027.53,018.9Tri-County Metro Trp DistOR PortlandMB 4,834.0 5,065.9 4,993.6 4,956.6 5,113.2198.0 -0.45%14,995.5 15,063.45,095.6Tri-County Metro Trp DistOR Portland
296.3 310.6 282.3 293.0 299.115.1 5.11%919.1 874.4312.2OR Salem Salem-Keizer Transit TOTAL
DR 12.9 14.0 13.2 13.4 13.80.7 2.23%41.3 40.414.4Salem-Keizer TransitOR SalemMB 283.4 296.6 269.1 279.6 285.314.4 5.25%877.8 834.0297.8Salem-Keizer TransitOR Salem
27.8 28.4 29.7 29.9 30.013.6 -4.35%85.7 89.629.5OR Wilsonville South Metro Area Rapid Transit TOTALMB 27.8 28.4 29.7 29.9 30.013.6 -4.35%85.7 89.629.5South Metro Area Rapid TransitOR Wilsonville
69.7 63.1 NA NA NANA NA202.8 NA70.0PA Altoona Altoona Metro Transit TOTAL
DR 0.7 0.6 NA NA NANA NA2.0 NA0.7Altoona Metro TransitPA AltoonaMB 69.0 62.5 NA NA NANA NA200.8 NA69.3Altoona Metro TransitPA Altoona
45.0 44.3 47.0 48.7 52.21.7 -7.37%137.0 147.947.7PA Greensburg Westmoreland County TA TOTAL
DR 1.4 1.3 1.3 1.3 1.40.0 2.50%4.1 4.01.4Westmoreland County TAPA GreensburgMB 43.6 43.0 45.7 47.4 50.81.7 -7.64%132.9 143.946.3Westmoreland County TAPA Greensburg
226.9 233.1 227.7 230.0 240.111.3 1.50%708.3 697.8248.3PA Harrisburg Cumberland-Dauphin-Harrisburg TA TOTAL
DR 15.6 16.0 15.3 15.8 16.70.8 1.05%48.3 47.816.7Cumberland-Dauphin-Harrisburg TAPA HarrisburgMB 211.3 217.1 212.4 214.2 223.410.5 1.54%660.0 650.0231.6Cumberland-Dauphin-Harrisburg TAPA Harrisburg
45.8 55.8 43.1 44.6 51.92.0 7.09%149.5 139.647.9PA Harris-Phil Penn DOT (Keystone) TOTALCR 45.8 55.8 43.1 44.6 51.92.0 7.09%149.5 139.647.9Penn DOT (Keystone)PA Harris-Phil
88.4 93.4 89.1 93.5 103.03.1 -6.20%267.9 285.686.1PA Johnstown Cambria County Transit Auth TOTAL
DR 0.3 0.3 0.3 0.3 0.40.0 0.00%1.0 1.00.4Cambria County Transit AuthPA JohnstownIP 1.4 2.7 0.4 1.5 4.10.1 -31.67%4.1 6.00.0Cambria County Transit AuthPA JohnstownMB 86.7 90.4 88.4 91.7 98.53.0 -5.67%262.8 278.685.7Cambria County Transit AuthPA Johnstown
182.4 187.9 170.0 197.1 200.97.5 -5.40%537.3 568.0167.0PA Lancaster Red Rose Transit Authority TOTAL
DR 24.0 23.8 26.7 26.5 28.31.1 -10.31%73.1 81.525.3Red Rose Transit AuthorityPA LancasterMB 158.4 164.1 143.3 170.6 172.66.4 -4.58%464.2 486.5141.7Red Rose Transit AuthorityPA Lancaster
28.4 29.0 27.7 30.1 32.11.2 -5.34%85.1 89.927.7PA Lebanon County of Lebanon Tr Auth TOTAL
DR 4.0 4.2 5.1 4.0 4.20.2 -7.52%12.3 13.34.1County of Lebanon Tr AuthPA LebanonMB 24.4 24.8 22.6 26.1 27.91.0 -4.96%72.8 76.623.6County of Lebanon Tr AuthPA Lebanon
Modes: MB - Bus, DR - Demand Response, CR - Commuter Rail, HR - Heavy Rail, LR - Light Rail, AG - Automated Guideway, CC - Cable Car, FB - Ferry Boat, IP - Inclined Plane, IR - Intermediate Rail, MO - Monorail, TB - Trolleybus, VP - Vanpool

APTA TRANSIT RIDERSHIP REPORT
State and City Transit Agency ModeAverage
Weekday Jan '13Trips for Trips for
Feb '13Trips forMar '13
Trips ThruMar '13
Trips forJan '12
Trips forFeb '12
Trips forMar '12
Trips ThruMar '12 Quarterly
Change(000's) (000's) (000's) (000's) (000's) (000's) (000's) (000's)(000's)
25First Quarter, 2013
27,459.1 34,213.3 25,921.8 27,715.3 34,569.71,164.7 -1.34%87,023.3 88,206.825,350.9PA Philadelphia Southeastern Penn TA TOTAL
CR 2,931.8 3,530.9 2,680.2 2,792.8 3,388.5127.8 3.97%9,212.9 8,861.52,750.2Southeastern Penn TAPA PhiladelphiaDR 131.9 173.5 135.0 119.2 166.95.7 1.61%427.9 421.1122.5Southeastern Penn TAPA PhiladelphiaHR 8,102.2 10,071.0 7,518.7 8,139.8 10,208.9340.2 -1.30%25,530.4 25,867.47,357.2Southeastern Penn TAPA PhiladelphiaLR 2,732.2 3,404.4 2,426.9 2,571.1 3,077.8115.2 7.00%8,641.0 8,075.82,504.4Southeastern Penn TAPA PhiladelphiaMB 13,104.8 16,463.2 12,720.9 13,622.6 17,141.7556.6 -3.97%41,758.1 43,485.212,190.1Southeastern Penn TAPA PhiladelphiaTB 456.2 570.3 440.1 469.8 585.919.4 -2.86%1,453.0 1,495.8426.5Southeastern Penn TAPA Philadelphia
5,027.6 5,217.7 5,301.3 5,399.5 5,891.4212.7 -6.52%15,510.3 16,592.25,265.0PA Pittsburgh Port Auth of Allegheny Co TOTAL
DR 132.8 138.6 138.4 144.4 156.85.8 -6.92%409.2 439.6137.8Port Auth of Allegheny CoPA PittsburghIP 52.8 85.2 58.9 65.3 97.81.8 -11.98%195.4 222.057.4Port Auth of Allegheny CoPA PittsburghLR 614.5 661.5 533.5 548.2 631.327.9 13.30%1,940.9 1,713.0664.9Port Auth of Allegheny CoPA PittsburghMB 4,227.5 4,332.4 4,570.5 4,641.6 5,005.5177.3 -8.81%12,964.8 14,217.64,404.9Port Auth of Allegheny CoPA Pittsburgh
274.9 288.6 264.3 288.5 304.311.8 -2.05%839.5 857.1276.0PA Reading Berks Area Reading Trp Auth TOTAL
DR 21.1 21.5 21.2 21.2 22.61.0 0.31%65.2 65.022.6Berks Area Reading Trp AuthPA ReadingMB 253.8 267.1 243.1 267.3 281.710.8 -2.25%774.3 792.1253.4Berks Area Reading Trp AuthPA Reading
879.7 680.0 732.2 905.2 654.833.1 4.05%2,385.0 2,292.2825.3PA State College Centre Area Transp Auth TOTAL
DR 2.6 2.9 2.9 2.9 3.20.1 -6.67%8.4 9.02.9Centre Area Transp AuthPA State CollegeMB 864.6 664.6 719.7 892.4 640.532.7 3.81%2,338.4 2,252.6809.2Centre Area Transp AuthPA State CollegeVP 12.5 12.5 9.6 9.9 11.10.3 24.84%38.2 30.613.2Centre Area Transp AuthPA State College
104.4 110.2 110.3 119.1 122.44.4 -8.87%320.6 351.8106.0PA Williamsport Williamsport Bureau of Tr TOTAL
DR 0.1 0.1 0.1 0.1 0.10.0 0.00%0.3 0.30.1Williamsport Bureau of TrPA WilliamsportMB 104.3 110.1 110.2 119.0 122.34.4 -8.88%320.3 351.5105.9Williamsport Bureau of TrPA Williamsport
1,111.4 1,030.5 1,047.8 1,112.5 1,144.552.2 1.08%3,340.5 3,304.81,198.6PR San Juan Puerto Rico DOT TOTAL
HR 972.3 889.7 914.6 986.2 1,014.445.4 -0.45%2,902.0 2,915.21,040.0Puerto Rico DOTPR San JuanMB 139.1 140.8 133.2 126.3 130.16.8 12.55%438.5 389.6158.6Puerto Rico DOTPR San Juan
NA NA NA NA NANA NANA NANARI Providence Rhode Island Public TA TOTAL
DR 51.5 58.5 57.8 58.2 63.5NA -6.24%168.3 179.558.3Rhode Island Public TARI ProvidenceFB NA NA NA NA NANA NANA NANARhode Island Public TARI ProvidenceMB 1,412.6 1,685.3 1,498.7 1,599.3 1,722.7NA -3.28%4,662.4 4,820.71,564.5Rhode Island Public TARI Providence
355.3 419.0 378.7 383.2 432.215.2 -2.38%1,165.7 1,194.1391.4SC Charleston Charleston Area RTA TOTAL
DR 5.7 6.3 5.8 6.0 6.30.2 0.00%18.1 18.16.1Charleston Area RTASC CharlestonMB 349.6 412.7 372.9 377.2 425.915.0 -2.41%1,147.6 1,176.0385.3Charleston Area RTASC Charleston
Modes: MB - Bus, DR - Demand Response, CR - Commuter Rail, HR - Heavy Rail, LR - Light Rail, AG - Automated Guideway, CC - Cable Car, FB - Ferry Boat, IP - Inclined Plane, IR - Intermediate Rail, MO - Monorail, TB - Trolleybus, VP - Vanpool

APTA TRANSIT RIDERSHIP REPORT
State and City Transit Agency ModeAverage
Weekday Jan '13Trips for Trips for
Feb '13Trips forMar '13
Trips ThruMar '13
Trips forJan '12
Trips forFeb '12
Trips forMar '12
Trips ThruMar '12 Quarterly
Change(000's) (000's) (000's) (000's) (000's) (000's) (000's) (000's)(000's)
26First Quarter, 2013
227.5 255.2 213.2 231.2 295.0NA -5.13%701.5 739.4218.8TN Chattanooga Chattanooga Area RTA TOTAL
DR 3.7 3.8 3.9 3.9 4.1NA -5.88%11.2 11.93.7Chattanooga Area RTATN ChattanoogaIP 12.1 35.1 0.0 0.0 34.0NA 64.41%55.9 34.08.7Chattanooga Area RTATN ChattanoogaMB 211.7 216.3 209.3 227.3 256.9NA -8.52%634.4 693.5206.4Chattanooga Area RTATN Chattanooga
74.2 70.7 72.8 75.2 78.43.0 -3.53%218.4 226.473.5TN Clarksville Clarksville Transit System TOTAL
DR 2.3 2.6 2.2 2.3 2.50.1 1.43%7.1 7.02.2Clarksville Transit SystemTN ClarksvilleMB 71.9 68.1 70.6 72.9 75.92.9 -3.69%211.3 219.471.3Clarksville Transit SystemTN Clarksville
4.8 5.0 3.3 3.9 4.81.4 30.83%15.7 12.05.9TN Franklin Franklin Transit Authority TOTALMB 4.8 5.0 3.3 3.9 4.81.4 30.83%15.7 12.05.9Franklin Transit AuthorityTN Franklin
854.8 871.3 740.4 833.5 884.735.1 3.71%2,549.8 2,458.6823.7TN Memphis Memphis Area Transit Auth TOTAL
DR 19.6 21.5 20.3 20.3 21.50.9 -1.93%60.9 62.119.8Memphis Area Transit AuthTN MemphisLR 84.8 119.7 74.3 83.7 140.23.3 -4.33%285.3 298.280.8Memphis Area Transit AuthTN MemphisMB 750.4 730.1 645.8 729.5 723.030.9 5.02%2,203.6 2,098.3723.1Memphis Area Transit AuthTN Memphis
811.7 780.3 786.0 799.7 860.8NA -0.79%2,427.2 2,446.5835.2TN Nashville Metropolitan Transit Auth TOTAL
DR 28.4 29.9 30.4 31.4 34.0NA -7.52%88.6 95.830.3Metropolitan Transit AuthTN NashvilleMB 783.3 750.4 755.6 768.3 826.832.3 -0.51%2,338.6 2,350.7804.9Metropolitan Transit AuthTN Nashville
58.3 60.3 64.6 64.4 65.72.9 -7.60%179.9 194.761.3TN Nashville Regional Transp Auth TOTAL
CR 19.5 21.1 21.9 22.3 24.31.0 -11.24%60.8 68.520.2Regional Transp AuthTN NashvilleMB 24.6 24.7 26.2 26.3 24.31.2 -2.34%75.0 76.825.7Regional Transp AuthTN NashvilleVP 14.2 14.5 16.5 15.8 17.10.7 -10.73%44.1 49.415.4Regional Transp AuthTN Nashville
2,584.7 2,379.2 2,402.2 3,179.7 3,634.0102.1 -10.76%8,224.0 9,215.93,260.1TX Austin Capital Metropolitan Trp Auth TOTAL
CR 51.7 116.3 25.6 32.3 51.32.9 93.96%211.8 109.243.8Capital Metropolitan Trp AuthTX AustinDR 46.8 49.8 47.6 47.4 50.32.3 -0.28%144.9 145.348.3Capital Metropolitan Trp AuthTX AustinMB 2,468.7 2,195.1 2,310.1 3,081.4 3,512.696.0 -12.26%7,812.6 8,904.13,148.8Capital Metropolitan Trp AuthTX AustinVP 17.5 18.0 18.9 18.6 19.80.9 -4.54%54.7 57.319.2Capital Metropolitan Trp AuthTX Austin
478.9 488.9 507.5 465.6 494.522.5 -0.44%1,461.2 1,467.6493.4TX Corpus Christi Corpus Christi Regional TA TOTAL
DR 15.8 16.2 17.6 16.8 17.70.7 -5.95%49.0 52.117.0Corpus Christi Regional TATX Corpus ChristiFB 0.0 13.5 0.0 0.0 10.30.9 31.07%13.5 10.30.0Corpus Christi Regional TATX Corpus ChristiMB 462.8 458.8 489.4 448.3 465.620.9 -0.41%1,397.6 1,403.3476.0Corpus Christi Regional TATX Corpus ChristiVP 0.3 0.4 0.5 0.5 0.90.0 -42.11%1.1 1.90.4Corpus Christi Regional TATX Corpus Christi
Modes: MB - Bus, DR - Demand Response, CR - Commuter Rail, HR - Heavy Rail, LR - Light Rail, AG - Automated Guideway, CC - Cable Car, FB - Ferry Boat, IP - Inclined Plane, IR - Intermediate Rail, MO - Monorail, TB - Trolleybus, VP - Vanpool

APTA TRANSIT RIDERSHIP REPORT
State and City Transit Agency ModeAverage
Weekday Jan '13Trips for Trips for
Feb '13Trips forMar '13
Trips ThruMar '13
Trips forJan '12
Trips forFeb '12
Trips forMar '12
Trips ThruMar '12 Quarterly
Change(000's) (000's) (000's) (000's) (000's) (000's) (000's) (000's)(000's)
27First Quarter, 2013
5,277.1 5,699.4 5,515.6 5,397.0 5,766.3224.1 -0.92%16,525.1 16,678.95,548.6TX Dallas Dallas Area Rapid Transit TOTAL
DR 60.1 62.0 66.9 67.3 70.32.9 -9.73%184.6 204.562.5Dallas Area Rapid TransitTX DallasLR 2,152.0 2,478.0 2,159.1 2,053.5 2,361.693.5 7.11%7,041.5 6,574.22,411.5Dallas Area Rapid TransitTX DallasMB 2,987.1 3,083.0 3,204.0 3,190.0 3,244.1124.0 -5.93%9,066.1 9,638.12,996.0Dallas Area Rapid TransitTX DallasVP 77.9 76.4 85.6 86.2 90.33.7 -11.14%232.9 262.178.6Dallas Area Rapid TransitTX Dallas
164.1 189.4 189.2 186.8 214.57.6 -12.09%519.1 590.5165.6TX Dallas-Ft Worth Trinity Railway Express TOTALCR 164.1 189.4 189.2 186.8 214.57.6 -12.09%519.1 590.5165.6Trinity Railway ExpressTX Dallas-Ft Worth
1,343.0 1,427.2 1,367.2 1,373.3 1,490.349.8 -3.54%4,081.0 4,230.81,310.8TX El Paso El Paso Mass Transit Dept TOTAL
DR 17.9 18.8 17.8 18.0 18.70.8 1.65%55.4 54.518.7El Paso Mass Transit DeptTX El PasoMB 1,325.1 1,408.4 1,349.4 1,355.3 1,471.649.0 -3.61%4,025.6 4,176.31,292.1El Paso Mass Transit DeptTX El Paso
59.2 63.4 58.3 52.0 57.4NA 11.27%186.6 167.764.0TX Galveston City of Galveston/Island Tr TOTAL
DR 1.5 1.8 1.8 1.7 2.00.1 -10.91%4.9 5.51.6City of Galveston/Island TrTX GalvestonLR 0.0 0.0 0.0 0.0 0.0NA NA0.0 0.00.0City of Galveston/Island TrTX GalvestonMB 57.7 61.6 56.5 50.3 55.42.7 12.02%181.7 162.262.4City of Galveston/Island TrTX Galveston
6,785.4 7,273.6 6,706.7 6,636.7 7,153.7288.3 2.58%21,026.1 20,497.16,967.1TX Houston Metro Tr Auth of Harris Co TOTAL
DR 138.0 146.1 134.0 135.4 141.25.6 3.51%425.0 410.6140.9Metro Tr Auth of Harris CoTX HoustonLR 922.4 1,296.5 902.0 935.3 1,252.441.5 1.85%3,146.9 3,089.7928.0Metro Tr Auth of Harris CoTX HoustonMB 5,523.0 5,629.4 5,455.1 5,356.4 5,544.3231.3 2.88%16,826.9 16,355.85,674.5Metro Tr Auth of Harris CoTX HoustonVP 202.0 201.6 215.6 209.6 215.89.9 -2.14%627.3 641.0223.7Metro Tr Auth of Harris CoTX Houston
327.8 263.5 229.3 341.3 273.313.5 1.02%852.5 843.9261.2TX Lewisville Denton County Transportation Auth TOTAL
CR 43.3 44.0 28.5 30.9 32.81.9 38.94%128.1 92.240.8Denton County Transportation AuthTX LewisvilleDR 2.4 2.4 2.3 2.4 2.50.1 0.00%7.2 7.22.4Denton County Transportation AuthTX LewisvilleMB 282.1 217.1 198.5 308.0 238.011.4 -3.67%717.2 744.5218.0Denton County Transportation AuthTX Lewisville
NA NA 252.3 456.7 356.6NA NANA 1,065.6NATX Lubbock Citibus TOTAL
DR NA NA 8.6 8.7 8.7NA NANA 26.0NACitibusTX LubbockMB 409.7 334.0 243.7 448.0 347.916.3 -0.78%1,031.5 1,039.6287.8CitibusTX Lubbock
11.7 11.5 11.0 11.2 11.3NA 3.28%34.6 33.511.4TX Port Arthur Port Arthur Transit TOTAL
DR 1.1 1.1 0.9 0.9 1.0NA 14.29%3.2 2.81.0Port Arthur TransitTX Port ArthurMB 10.6 10.4 10.1 10.3 10.3NA 2.28%31.4 30.710.4Port Arthur TransitTX Port Arthur
3,740.2 3,859.4 3,861.1 3,700.1 3,937.3143.6 -1.17%11,364.2 11,498.53,764.6TX San Antonio VIA Metropolitan Transit TOTAL
DR 83.4 87.3 85.9 85.6 88.93.7 -1.23%257.2 260.486.5VIA Metropolitan TransitTX San AntonioMB 3,656.8 3,772.1 3,775.2 3,614.5 3,848.4139.9 -1.17%11,107.0 11,238.13,678.1VIA Metropolitan TransitTX San Antonio
Modes: MB - Bus, DR - Demand Response, CR - Commuter Rail, HR - Heavy Rail, LR - Light Rail, AG - Automated Guideway, CC - Cable Car, FB - Ferry Boat, IP - Inclined Plane, IR - Intermediate Rail, MO - Monorail, TB - Trolleybus, VP - Vanpool

APTA TRANSIT RIDERSHIP REPORT
State and City Transit Agency ModeAverage
Weekday Jan '13Trips for Trips for
Feb '13Trips forMar '13
Trips ThruMar '13
Trips forJan '12
Trips forFeb '12
Trips forMar '12
Trips ThruMar '12 Quarterly
Change(000's) (000's) (000's) (000's) (000's) (000's) (000's) (000's)(000's)
28First Quarter, 2013
185.9 186.0 188.6 194.7 194.58.4 -2.58%562.9 577.8191.0UT Logan Logan/Cache Valley TD TOTAL
DR 2.4 2.5 2.3 2.4 2.70.1 1.35%7.5 7.42.6Logan/Cache Valley TDUT LoganMB 183.5 183.5 186.3 192.3 191.88.3 -2.63%555.4 570.4188.4Logan/Cache Valley TDUT Logan
279.9 266.8 420.1 307.8 277.280.2 -3.97%965.2 1,005.1418.5UT Park City Park City Transit TOTAL
DR 0.6 0.7 0.7 0.6 0.70.2 0.00%2.0 2.00.7Park City TransitUT Park CityMB 279.3 266.1 419.4 307.2 276.580.0 -3.98%963.2 1,003.1417.8Park City TransitUT Park City
3,450.9 3,821.5 3,528.1 3,521.2 3,914.8158.1 0.02%10,966.4 10,964.13,694.0UT Salt Lake City Utah Transit Authority TOTAL
CR 282.1 309.3 128.6 124.4 157.213.0 >100%883.4 410.2292.0Utah Transit AuthorityUT Salt Lake CityDR 60.5 67.9 57.4 57.2 63.93.1 7.84%192.5 178.564.1Utah Transit AuthorityUT Salt Lake CityLR 1,338.9 1,511.2 1,341.7 1,347.2 1,612.959.7 0.82%4,336.9 4,301.81,486.8Utah Transit AuthorityUT Salt Lake CityMB 1,646.7 1,820.4 1,882.0 1,866.5 1,953.276.8 -8.59%5,211.9 5,701.71,744.8Utah Transit AuthorityUT Salt Lake CityVP 122.7 112.7 118.4 125.9 127.65.6 -8.12%341.7 371.9106.3Utah Transit AuthorityUT Salt Lake City
361.5 369.5 385.8 386.0 415.4NA -5.37%1,123.5 1,187.2392.5VA Alexandria Virginia Railway Express TOTALCR 361.5 369.5 385.8 386.0 415.4NA -5.37%1,123.5 1,187.2392.5Virginia Railway ExpressVA Alexandria
210.9 235.8 200.8 218.2 214.19.5 3.89%657.7 633.1211.0VA Arlington Arlington Transit (ART) TOTALMB 210.9 235.8 200.8 218.2 214.19.5 3.89%657.7 633.1211.0Arlington Transit (ART)VA Arlington
69.2 71.8 67.1 79.6 81.43.3 -10.61%203.9 228.162.9VA Fairfax City of Fairfax CUE Bus TOTALMB 69.2 71.8 67.1 79.6 81.43.3 -10.61%203.9 228.162.9City of Fairfax CUE BusVA Fairfax
788.7 853.8 857.1 864.0 966.735.1 -9.13%2,442.5 2,687.8800.0VA Fairfax Fairfax County Dept of Transp TOTALMB 788.7 853.8 857.1 864.0 966.735.1 -9.13%2,442.5 2,687.8800.0Fairfax County Dept of TranspVA Fairfax
1,444.5 1,501.0 1,465.1 1,450.9 1,572.559.7 -0.58%4,462.5 4,488.51,517.0VA Hampton Hampton Roads Transit TOTAL
DR 24.9 26.2 27.2 27.7 29.41.1 -9.02%76.7 84.325.6Hampton Roads TransitVA HamptonFB 14.7 18.7 16.6 16.5 23.30.6 -11.52%49.9 56.416.5Hampton Roads TransitVA HamptonLR 134.8 128.2 99.1 89.4 140.75.0 17.62%387.2 329.2124.2Hampton Roads TransitVA HamptonMB 1,255.7 1,312.7 1,307.6 1,302.8 1,361.553.0 -1.74%3,902.6 3,971.91,334.2Hampton Roads TransitVA HamptonVP 14.4 15.2 14.6 14.5 17.60.0 -1.28%46.1 46.716.5Hampton Roads TransitVA Hampton
102.9 159.5 83.2 113.5 164.94.1 -2.30%353.3 361.690.9VA Williamsburg Williamsburg Area Transport TOTAL
DR 0.3 0.3 0.3 0.3 0.30.0 0.00%0.9 0.90.3Williamsburg Area TransportVA WilliamsburgMB 102.6 159.2 82.9 113.2 164.64.1 -2.30%352.4 360.790.6Williamsburg Area TransportVA Williamsburg
263.8 264.0 273.1 280.8 304.413.2 -7.35%795.2 858.3267.4VA Woodbridge PRTC Omni-Ride TOTALMB 263.8 264.0 273.1 280.8 304.413.2 -7.35%795.2 858.3267.4PRTC Omni-RideVA Woodbridge
229.7 240.1 232.7 243.9 247.09.9 -2.47%705.7 723.6235.9VT Burlington Chittenden County TA TOTAL
DR 4.3 4.9 4.4 4.5 4.80.2 1.46%13.9 13.74.7Chittenden County TAVT BurlingtonMB 225.4 235.2 228.3 239.4 242.29.7 -2.55%691.8 709.9231.2Chittenden County TAVT Burlington
Modes: MB - Bus, DR - Demand Response, CR - Commuter Rail, HR - Heavy Rail, LR - Light Rail, AG - Automated Guideway, CC - Cable Car, FB - Ferry Boat, IP - Inclined Plane, IR - Intermediate Rail, MO - Monorail, TB - Trolleybus, VP - Vanpool

APTA TRANSIT RIDERSHIP REPORT
State and City Transit Agency ModeAverage
Weekday Jan '13Trips for Trips for
Feb '13Trips forMar '13
Trips ThruMar '13
Trips forJan '12
Trips forFeb '12
Trips forMar '12
Trips ThruMar '12 Quarterly
Change(000's) (000's) (000's) (000's) (000's) (000's) (000's) (000's)(000's)
29First Quarter, 2013
NA NA 292.9 330.0 348.7NA NANA 971.6NAWA Bremerton Kitsap Transit TOTAL
DR 22.2 24.0 20.6 24.0 27.01.1 -2.65%69.7 71.623.5Kitsap TransitWA BremertonFB 34.8 37.8 31.3 35.8 35.21.7 6.84%109.3 102.336.7Kitsap TransitWA BremertonMB 240.7 259.6 221.0 248.6 262.511.5 3.29%756.2 732.1255.9Kitsap TransitWA BremertonVP 18.4 19.8 20.0 21.6 24.00.9 -10.37%58.8 65.620.6Kitsap TransitWA Bremerton
168.5 175.2 191.6 205.0 206.611.6 -13.66%520.8 603.2177.1WA Everett Everett Transit System TOTAL
DR 8.6 9.7 8.1 9.3 9.73.7 1.48%27.5 27.19.2Everett Transit SystemWA EverettMB 159.9 165.5 183.5 195.7 196.98.0 -14.37%493.3 576.1167.9Everett Transit SystemWA Everett
728.1 752.1 732.1 803.3 790.334.0 -2.82%2,260.0 2,325.7779.8WA Everett Snohomish County PTBA TOTAL
DR 15.2 16.1 13.8 16.4 17.50.7 -0.21%47.6 47.716.3Snohomish County PTBAWA EverettMB 638.0 658.2 646.9 706.8 687.229.5 -3.16%1,976.5 2,040.9680.3Snohomish County PTBAWA EverettVP 74.9 77.8 71.4 80.1 85.63.7 -0.51%235.9 237.183.2Snohomish County PTBAWA Everett
443.8 463.6 429.0 475.9 479.1NA -0.01%1,383.8 1,384.0476.4WA Olympia Intercity Transit TOTAL
DR 12.2 12.3 10.6 12.8 13.4NA 0.00%36.8 36.812.3Intercity TransitWA OlympiaMB 374.3 388.1 365.6 404.3 402.215.7 -0.87%1,161.9 1,172.1399.5Intercity TransitWA OlympiaVP 57.3 63.2 52.8 58.8 63.57.2 5.71%185.1 175.164.6Intercity TransitWA Olympia
355.7 367.3 370.0 388.9 402.730.4 -4.66%1,107.5 1,161.6384.5WA Richland Ben Franklin Transit TOTAL
DR 30.1 32.0 32.2 33.2 34.914.6 -7.48%92.8 100.330.7Ben Franklin TransitWA RichlandMB 251.0 261.2 236.9 254.6 268.012.0 0.79%765.5 759.5253.3Ben Franklin TransitWA RichlandVP 74.6 74.1 100.9 101.1 99.83.9 -17.43%249.2 301.8100.5Ben Franklin TransitWA Richland
9,431.6 10,218.1 9,155.8 9,817.6 10,235.1404.8 2.39%29,907.8 29,208.510,258.1WA Seattle King County Dept of Trp TOTAL
DR 93.3 100.0 84.2 96.9 102.84.0 2.78%291.8 283.998.5King County Dept of TrpWA SeattleLR 57.6 61.6 52.3 53.8 59.12.6 10.41%182.4 165.263.2King County Dept of TrpWA SeattleMB 7,522.9 8,235.1 7,280.1 7,718.0 8,092.9313.5 3.51%23,900.5 23,091.08,142.5King County Dept of TrpWA SeattleTB 1,489.6 1,547.7 1,481.6 1,651.5 1,670.771.5 -2.40%4,688.6 4,803.81,651.3King County Dept of TrpWA SeattleVP 268.2 273.7 257.6 297.4 309.613.2 -2.32%844.5 864.6302.6King County Dept of TrpWA Seattle
2,181.2 2,406.9 2,007.7 2,080.1 2,262.595.8 9.35%6,944.2 6,350.32,356.1WA Seattle Sound Transit TOTAL
CR 226.1 238.8 192.5 218.5 225.411.3 11.57%710.0 636.4245.1Sound TransitWA SeattleDR 4.9 5.3 5.4 5.2 5.50.2 -4.35%15.4 16.15.2Sound TransitWA SeattleLR 716.5 820.8 672.6 665.6 743.829.3 10.46%2,299.8 2,082.0762.5Sound TransitWA SeattleMB 1,233.7 1,342.0 1,137.2 1,190.8 1,287.855.0 8.39%3,919.0 3,615.81,343.3Sound TransitWA Seattle
1,451.4 1,751.1 1,382.5 1,550.2 1,704.552.1 1.22%4,693.9 4,637.21,491.4WA Seattle Washington State Ferries TOTALFB 1,451.4 1,751.1 1,382.5 1,550.2 1,704.552.1 1.22%4,693.9 4,637.21,491.4Washington State FerriesWA Seattle
Modes: MB - Bus, DR - Demand Response, CR - Commuter Rail, HR - Heavy Rail, LR - Light Rail, AG - Automated Guideway, CC - Cable Car, FB - Ferry Boat, IP - Inclined Plane, IR - Intermediate Rail, MO - Monorail, TB - Trolleybus, VP - Vanpool

APTA TRANSIT RIDERSHIP REPORT
State and City Transit Agency ModeAverage
Weekday Jan '13Trips for Trips for
Feb '13Trips forMar '13
Trips ThruMar '13
Trips forJan '12
Trips forFeb '12
Trips forMar '12
Trips ThruMar '12 Quarterly
Change(000's) (000's) (000's) (000's) (000's) (000's) (000's) (000's)(000's)
30First Quarter, 2013
1,001.8 1,013.6 1,004.6 1,003.7 1,021.243.9 2.16%3,094.9 3,029.51,079.5WA Spokane Spokane Transit Authority TOTAL
DR 39.4 41.0 37.2 38.1 38.41.9 7.65%122.4 113.742.0Spokane Transit AuthorityWA SpokaneMB 942.3 952.0 946.7 944.8 960.841.0 1.98%2,908.7 2,852.31,014.4Spokane Transit AuthorityWA SpokaneVP 20.1 20.6 20.7 20.8 22.01.0 0.47%63.8 63.523.1Spokane Transit AuthorityWA Spokane
945.1 1,000.1 982.9 978.7 1,037.939.8 -2.09%2,936.7 2,999.5991.5WA Tacoma Pierce Transit TOTAL
DR 29.2 32.1 28.7 33.4 33.81.2 -2.61%93.4 95.932.1Pierce TransitWA TacomaMB 841.2 887.2 888.3 871.3 925.335.1 -2.94%2,606.0 2,684.9877.6Pierce TransitWA TacomaVP 74.7 80.8 65.9 74.0 78.83.5 8.50%237.3 218.781.8Pierce TransitWA Tacoma
517.3 550.3 556.8 562.3 588.522.0 -5.41%1,615.2 1,707.6547.6WA Vancouver Clark Co Pub Trp Benefit Area TOTAL
DR 18.6 19.5 17.9 17.6 18.70.7 5.54%57.2 54.219.1Clark Co Pub Trp Benefit AreaWA VancouverMB 493.6 525.3 535.5 541.0 564.821.0 -6.08%1,541.5 1,641.3522.6Clark Co Pub Trp Benefit AreaWA VancouverVP 5.1 5.5 3.4 3.7 5.00.3 36.36%16.5 12.15.9Clark Co Pub Trp Benefit AreaWA Vancouver
113.0 108.8 103.2 120.5 116.25.1 -6.77%316.9 339.995.1WI La Crosse La Crosse Municipal Tr Utililty TOTAL
DR 6.0 6.2 6.8 6.9 6.80.3 -12.68%17.9 20.55.7La Crosse Municipal Tr UtililtyWI La CrosseMB 107.0 102.6 96.4 113.6 109.44.8 -6.39%299.0 319.489.4La Crosse Municipal Tr UtililtyWI La Crosse
1,511.2 1,420.8 1,172.5 1,556.8 1,501.059.7 -0.84%4,194.7 4,230.31,262.7WI Madison Metro Transit TOTAL
DR 21.4 21.4 21.4 23.2 23.90.8 -6.57%64.0 68.521.2Metro TransitWI MadisonMB 1,489.8 1,399.4 1,151.1 1,533.6 1,477.158.9 -0.75%4,130.7 4,161.81,241.5Metro TransitWI Madison
3,598.0 3,817.3 3,622.6 3,885.9 3,955.4144.2 -4.14%10,989.6 11,463.93,574.3WI Milwaukee Milwaukee County Tr Sys TOTAL
DR 43.1 47.3 48.5 50.6 51.21.8 -10.31%134.8 150.344.4Milwaukee County Tr SysWI MilwaukeeMB 3,554.9 3,770.0 3,574.1 3,835.3 3,904.2142.4 -4.06%10,854.8 11,313.63,529.9Milwaukee County Tr SysWI MilwaukeeVP 0.0 0.0 0.0 0.0 0.00.0 NA0.0 0.00.0Milwaukee County Tr SysWI Milwaukee
15.5 15.9 15.2 16.1 16.00.7 0.21%47.4 47.316.0WI Port Washington Ozaukee County Transit Services TOTAL
DR 7.8 8.2 7.8 7.9 7.80.3 3.40%24.3 23.58.3Ozaukee County Transit ServicesWI Port WashingtonMB 7.7 7.7 7.4 8.2 8.20.4 -2.94%23.1 23.87.7Ozaukee County Transit ServicesWI Port Washington
111.1 111.3 126.0 124.7 120.7NA -8.24%340.8 371.4118.4WI Racine Belle Urban System TOTAL
DR 3.0 3.0 3.5 3.8 4.0NA -15.93%9.5 11.33.5Belle Urban SystemWI RacineMB 108.1 108.3 122.5 120.9 116.7NA -8.00%331.3 360.1114.9Belle Urban SystemWI Racine
137.1 117.6 129.1 142.3 125.55.9 -8.29%364.0 396.9109.3WV Morgantown Mountain Line Transit Authority TOTAL
DR 0.9 1.1 1.0 1.1 1.10.2 3.13%3.3 3.21.3Mountain Line Transit AuthorityWV MorgantownMB 136.2 116.5 128.1 141.2 124.45.7 -8.38%360.7 393.7108.0Mountain Line Transit AuthorityWV Morgantown
Modes: MB - Bus, DR - Demand Response, CR - Commuter Rail, HR - Heavy Rail, LR - Light Rail, AG - Automated Guideway, CC - Cable Car, FB - Ferry Boat, IP - Inclined Plane, IR - Intermediate Rail, MO - Monorail, TB - Trolleybus, VP - Vanpool

APTA TRANSIT RIDERSHIP REPORT
Province and City Transit Agency ModeAverage
Weekday Jan '13Trips for Trips for
Feb '13Trips forMar '13
Trips ThruMar '13
Trips forJan '12
Trips forFeb '12
Trips forMar '12
Trips ThruMar '12 Quarterly
Change(000's) (000's) (000's) (000's) (000's) (000's) (000's) (000's)(000's)
31
CANADA
First Quarter, 2013
14,307.3 14,761.2 11,324.9 13,436.6 13,706.0576.4 11.07%42,725.6 38,467.513,657.1AB Calgary Calgary Transit TOTAL
LR 7,439.8 7,675.8 5,888.9 6,987.0 7,127.1290.0 11.07%22,217.3 20,003.07,101.7Calgary TransitAB CalgaryMB 6,867.5 7,085.4 5,436.0 6,449.6 6,578.9286.4 11.07%20,508.3 18,464.56,555.4Calgary TransitAB Calgary
26,929.8 27,940.9 28,249.1 31,664.2 31,017.11,089.1 -10.99%80,938.0 90,930.426,067.3BC Burnaby Greater Vancouver Transp Auth TOTAL
AG 9,285.2 9,791.7 9,230.4 9,863.8 10,179.3371.2 -3.65%28,203.6 29,273.59,126.7Greater Vancouver Transp AuthBC BurnabyCR 218.4 221.7 247.0 246.2 255.411.4 -7.29%694.0 748.6253.9Greater Vancouver Transp AuthBC BurnabyDR 117.9 124.0 120.1 131.9 136.55.1 -3.84%373.6 388.5131.7Greater Vancouver Transp AuthBC BurnabyFB 417.9 494.4 459.7 454.9 510.218.4 -4.52%1,360.4 1,424.8448.1Greater Vancouver Transp AuthBC BurnabyMB 12,259.1 12,266.9 13,326.7 15,173.5 14,466.2492.8 -15.51%36,300.8 42,966.411,774.8Greater Vancouver Transp AuthBC BurnabyTB 4,631.3 5,042.2 4,865.2 5,793.9 5,469.5190.2 -13.16%14,005.6 16,128.64,332.1Greater Vancouver Transp AuthBC Burnaby
2,181.7 2,339.4 2,791.6 2,698.7 2,779.492.6 -15.49%6,988.8 8,269.72,467.7BC Victoria BC Transit TOTAL
DR 32.3 34.1 31.4 33.6 32.61.3 4.61%102.1 97.635.7BC TransitBC VictoriaMB 2,149.4 2,305.3 2,760.2 2,665.1 2,746.891.3 -15.73%6,886.7 8,172.12,432.0BC TransitBC Victoria
1,384.2 1,600.8 1,404.8 1,423.1 1,593.664.2 2.54%4,533.7 4,421.51,548.7ON Brampton Brampton Transit TOTALMB 1,384.2 1,600.8 1,404.8 1,423.1 1,593.664.2 2.54%4,533.7 4,421.51,548.7Brampton TransitON Brampton
12,708.3 13,160.1 13,705.0 13,444.4 14,055.6560.7 -4.48%39,357.4 41,205.013,489.0ON Ottawa OC Transpo/Para Transpo TOTAL
DR 68.4 74.2 75.9 75.8 80.32.9 -6.68%216.5 232.073.9OC Transpo/Para TranspoON OttawaLR 302.1 333.2 402.9 357.0 386.214.3 -12.56%1,002.2 1,146.1366.9OC Transpo/Para TranspoON OttawaMB 12,337.8 12,752.7 13,226.2 13,011.6 13,589.1543.5 -4.24%38,138.7 39,826.913,048.2OC Transpo/Para TranspoON Ottawa
1,765.2 1,886.1 1,012.0 1,792.4 2,147.578.4 12.81%5,586.0 4,951.91,934.7ON Richmond Hill York Region Transit TOTALMB 1,765.2 1,886.1 1,012.0 1,792.4 2,147.578.4 12.81%5,586.0 4,951.91,934.7York Region TransitON Richmond Hill
62,761.3 69,831.6 67,972.9 66,500.2 71,498.42,639.9 -2.32%201,192.8 205,971.568,599.9ON Toronto Toronto Transit Commission TOTAL
DR 214.9 285.4 208.2 217.3 285.89.2 5.71%751.9 711.3251.6Toronto Transit CommissionON TorontoHR 24,548.1 24,409.9 25,748.4 24,811.8 26,002.8960.3 -2.32%74,789.4 76,563.025,831.4Toronto Transit CommissionON TorontoIR 1,219.1 1,185.3 1,086.8 1,044.1 1,113.443.2 13.25%3,674.1 3,244.31,269.7Toronto Transit CommissionON TorontoLR 6,712.2 8,806.2 7,587.3 7,303.6 7,808.0300.4 -0.48%22,589.0 22,698.97,070.6Toronto Transit CommissionON TorontoMB 30,067.0 35,144.8 33,342.2 33,123.4 36,288.41,326.8 -3.28%99,388.4 102,754.034,176.6Toronto Transit CommissionON Toronto
1,589.2 1,583.8 1,683.4 1,680.7 1,638.577.9 -3.27%4,839.1 5,002.61,666.1QC Montreal Agence Metropolitaine de Transport TOTAL
CR 1,456.6 1,453.5 1,559.1 1,542.4 1,504.271.5 -3.66%4,437.1 4,605.71,527.0Agence Metropolitaine de TransportQC MontrealMB 132.6 130.3 124.3 138.3 134.36.4 1.28%402.0 396.9139.1Agence Metropolitaine de TransportQC Montreal
54,117.2 57,551.9 55,547.0 56,209.7 58,309.02,263.0 -1.08%168,235.8 170,065.756,566.7QC Montreal Societe de transport de Montreal TOTAL
DR 251.3 264.9 228.3 251.3 264.99.9 0.00%744.5 744.5228.3Societe de transport de MontrealQC MontrealHR 29,829.5 31,816.3 29,819.5 31,160.7 31,715.11,241.0 -0.68%92,062.5 92,695.330,416.7Societe de transport de MontrealQC MontrealMB 24,036.4 25,470.7 25,499.2 24,797.7 26,329.01,012.0 -1.56%75,428.8 76,625.925,921.7Societe de transport de MontrealQC Montreal
Modes: MB - Bus, DR - Demand Response, CR - Commuter Rail, HR - Heavy Rail, LR - Light Rail, AG - Automated Guideway, CC - Cable Car, FB - Ferry Boat, IP - Inclined Plane, IR - Intermediate Rail, MO - Monorail, TB - Trolleybus, VP - Vanpool


