
Analysis of Used Oil
Policy Management
Options
for
The Waste Authority, Western Australia
February 2009

This report has been prepared by: David Fitzsimons with Dan Eatherley and Jenni Rasanen Checked as a final draft by: Katie Deegan Reviewed by: ………………………………………. Date: 23rd February 2009 (including comments from consultees) Contact: [email protected] File reference number: WEST01 165 issue2.doc Client Project Reference KE-50 2008
For more information visit www.oakdenehollins.co.uk

© Oakdene Hollins Ltd February 2009
For The Waste Authority Page 1
Contents
Glossary 3
Acknowledgements 4
1 Summary 5
2 Introduction 8 2.1 Background 8 2.2 Scope of Study 8
3 International Case Studies 9 3.1 Alberta Province, Canada 9 3.2 Denmark, Europe 17 3.3 Finland, Europe 29 3.4 Spain, Europe 37 3.5 Summary Case Study Metrics 39
4 Base-Line Scenario 41 4.1 Supply of Used Oil 41 4.2 Demand for Burner Fuels 44 4.3 Drivers for Competitive Change 48 4.4 Summary Costs and Benefits of Base-Line Case 52
5 Local Lube-to-Lube Re-Refining Scenario 54 5.1 Background 54 5.2 Optional Additional Policy Measures 55 5.3 Summary Costs and Benefits from Local Re-refining 60
6 Out-of-State Lube-to-Lube Re-Refining Scenario 64 6.1 Background 64 6.2 Optional Additional Policy Measures 65 6.3 Summary Costs and Benefits From Out-of-State Re-refining 65
7 Policy Options 69 7.1 Option 1 69 7.2 Option 2 70 7.3 Option 3 70 7.4 Option 4 71 7.5 Option 5 71 7.6 Option 6 72 7.7 Summary of Options 72
8 Sensitivity Analysis 73 8.1 Market Share Assumptions, Scenario 3 (Out-of-State) 74 8.2 Blending Ratio for Bottoms, Scenario 2 (Local Re-refining) 75

© Oakdene Hollins Ltd February 2009
For The Waste Authority Page 2
8.3 Used Oil Supply – All Scenarios 75 8.4 Mainland Demand for Burner Fuels 76
9 Conclusions 77
References 78 Case Studies - Alberta 78 Case studies - Denmark 80 Case studies - Finland 82
Appendices 85

© Oakdene Hollins Ltd February 2009
For The Waste Authority Page 3
Glossary
AORA Australian Oil Recyclers Association
Bottoms The thick residue following the refining of used oils, also referred to as VTB (vacuum tower bottoms)
C/L Cents per litre
LCA Life cycle assessment
PSO Product Stewardship (Oil) Act 2000
Regeneration Synonym in this report for “re‐refining”
Re‐refining The processing of used mineral oils to manufacture base oil
Tonnes Used as an approximate equivalent of 1,000 litres

© Oakdene Hollins Ltd February 2009
For The Waste Authority Page 4
Acknowledgements
Robert Atkins Director DEC Environmental Regulation
Lyle Barrett Institute of Automotive Mechanical Engineers
Steve Beilby Business Co‐ordinator DEC Environmental Regulation
Peter Fitzpatrick Motor Traders Association
Mark Glover LOREX
Rod Lucatelich Environment Manager, BP
Rob Jarrett Boral Midland Brick
Jose Fernando Suarez Mejido Sener Grupo de Ingenieria S A
Sean McSevich Industry Regulation, DEC South West Region
Ged Styles ToxFree Solutions
Ken Tushingham Verve Energy
Gary Watson Transpacific Industries Group Ltd
Fred Wren Managing Director, Wren Oil
Thanks to Sam Wilkinson at DEC for providing suggestions and local contacts and to
Leanne Reid at DEC for co‐ordinating the stakeholder meetings in WA for David
Fitzsimons of Oakdene Hollins during 31st October to 9th November 2008.
Thanks also for the written comments received in January 2009 from Gary Watson of
Transpacific Industries Ltd, Fred Wren of Wren Oil and Mark Glover Of LOREX
Investments Pty Ltd.

© Oakdene Hollins Ltd February 2009
For The Waste Authority Page 5
1 Summary
What actions, if any, might be taken to ensure greater stability in the collection and processing of used oil in Western Australia (WA)? This study sets out a range of policy options centred on three scenarios. To inform the policy options we have provided three detailed up‐to‐date case studies from Alberta, Denmark and Finland and a shorter case study on recent regulatory changes in Spain. All four States operate a levy and subsidy system similar in some respects to the Federal Product Stewardship for Oil (PSO) in Australia. In Denmark and Finland new re‐refinery plants have just been, or are about to be, completed. This study sets out how costs and benefits are distributed between four categories of stakeholder; used oil generators, used oil collectors and processors, burner fuel and lubricant buyers, and the WA Environment. The base‐line scenario describes what is most likely to occur in WA if no further policy interventions are taken during the period to 2011/12. It describes a situation in which the joint venture between Wren Oil and Nationwide continues to enjoy the benefits of higher prices and reduced collection costs but there is no investment in a local re‐refining plant. The higher collection prices increase the amount of oil that is self‐managed by generators thereby increasing the risk of environmental damage due to uncollected oil being inappropriately discarded. Our modelling shows that up to 350,000 litres of used oil will be self‐managed and we estimate an initial risk of 15% (and growing thereafter) of disruption to the burner fuel market leading to a repeat of the problems experienced in 2006/07. A second scenario investigates the building of a local re‐refinery by the joint venture at a claimed cost of A$20 million. From 2010 it receives 30 million litres of feedstock. The collection price for most of these oils falls from 15 to 8 cents per litre, especially for generators of oil in the automotive sector. Our modelling shows that up to 200,000 litres will be self‐managed, but with a lower risk of disruption than in the base‐line scenario. However, the disposal of bottoms from the re‐refinery (5.5 million litres) continues to carry a risk of disruption because at least 50% of it will need to be blended at a ratio of 1:1 and exported to non‐mainland markets. A third scenario investigates the implications if a new competitor (LOREX) enters the market in order to collect oils for storage and onward transfer by sea freight to out‐of‐state re‐refining. In this scenario prices for collection fall extensively to 5 cents per litre for industry and the mining sector and nil in the automotive sector. This price reduction reduces the quantity of self‐managed oil to less than 50,000 litres. The risk of disruption falls but this is sensitive to the extent of market share won by the new competitor (we have assumed a maximum of 25%). As the out‐of‐state re‐refinery is treated differently in our model because its own vacuum tower bottoms (VTBs) are not sent included in shipments to non‐mainland markets from WA, we modelled a range of options for a fairer comparison. The shaded area in the figure

© Oakdene Hollins Ltd February 2009
For The Waste Authority Page 6
below can be interpreted as meaning that local and out‐of‐state lube‐to‐lube re‐refining offer potentially similar risk profiles within a range of 25% and 50% market share for the out‐of‐state re‐refinery. Comparative Risk of Disruption to Collection (measured by the proxy figure of used oil sent to non-mainland markets) under Each Scenario
0.0
5.0
10.0
15.0
20.0
25.0
30.0
35.0
Jul-0
8
Jan-0
9Ju
l-09
Jan-1
0Ju
l-10
Jan-1
1Ju
l-11
Jan-1
2Ju
l-12
Jan-1
3Ju
l-13
Jan-1
4Ju
l-14
Jan-1
5Ju
l-15
Year
Non
Mai
nlan
d B
urne
r Fue
l, M
illio
n Li
tres
No Intervention Local Re-refining Out of State Re-refining
LR with Bottoms OSR 50% Market Share
Amount of Self-Managed Oil under Each Scenario
0
50,000
100,000
150,000
200,000
250,000
300,000
350,000
400,000
450,000
Jul-0
8Ju
l-09
Jul-1
0Ju
l-11
Jul-1
2Ju
l-13
Jul-1
4Ju
l-15
Year
Self
Man
aged
Oil,
L
$0.00
$0.01
$0.02
$0.03
$0.04
$0.05
$0.06
$0.07
$0.08
$0.09
$0.10
$0.11
$0.12
$0.13
$0.14
$0.15
$0.16
$0.17
$0.18
Col
lect
ion
Cos
t, A
$No Intervention Local Re-refining Out of State Re-refiningNI Collection Cost LR Collection Cost OSR Collection Cost

© Oakdene Hollins Ltd February 2009
For The Waste Authority Page 7
All three scenarios are possible without any further policy interventions. This study does not provide recommendations but we have set out a number of possible policy options for consideration (Section 7). These are: Option 1 Establish a timetable for the introduction of new atmospheric
pollution abatement controls for plants that accept waste derived fuels.
Option 2 Monitor the progress of the JV toward delivering a new lube-to-lube plant. Option 3 Offer a grant toward the cost of a re-refining plant/tank storage capacity
conditional on commissioning before 2011. Option 4 Investigate the introduction of more onerous license conditions for used oil
operators. Option 5 Request that the relevant state Government Departments including
Transport Department give priority to investigating the viability of using bottoms in asphalt products.
Option 6 Write formally to the JV partners recommending that that they seek authorisation from the ACCC for the public interest issues arising from the achievement of the JV objective, offering to provide information.
These policy options are targeted at improving the prospects of achieving one or more of the scenarios. This is shown in the table below along with an indication of the public sector resources required to deliver them. Summary of Policy Options and Public Resources Required
Aimed at Mitigating Risks under Scenario 1 or
Achieving Scenarios 2 or 3
1 2 3
Public Resources Required
Option 1 √ √ Medium
Option 2 √ Low
Option 3 √ (√) High
Option 4 √ √ Medium
Option 5 √ √ √ Low
Option 6 √ Low (√) = Scenario 3 may be assisted if financial aid is provided for tank storage only.
Each scenario offers a different distribution of the main costs and benefits between the principal stakeholders. These are detailed in Sections 4, 5 and 6. Amongst generators of used oil, the automotive sector stands to gain most from the construction of a re‐refining plant, whether in state or out‐of‐state as prices for collection are forecast for these generators to fall significantly from current levels. The modelling results, although sensitive to four key assumptions, can be interpreted to mean that the greatest level of stability in the collection and processing of used oil will be achieved by: 1. Accelerating the construction of new oil storage facilities and a local lube‐to‐lube
re‐refinery, followed by 2. Increased competition at collection, possibly led by an out‐of‐state re‐refinery
operator.

© Oakdene Hollins Ltd February 2009
For The Waste Authority Page 8
2 Introduction
2.1 Background
In the light of the disruption caused to the used oil collection and processing infrastructure during 2006/07, the Department, on behalf of the Waste Authority, wishes to investigate options that will improve the certainty of service provision for used oil collection and processing across the State. It is this wish that forms the principal objective of this study.
2.2 Scope of Study
In August 2008, Oakdene Hollins was commissioned by the Waste Authority to prepare Part B of a study of used oil management in the State of Western Australia. At the same time, Perth‐based consultant ACIL Tasman was appointed to prepare Part A of the study. The specification for the study was set out in schedule 2 of the “Request, KE 50 2008” and published on the State Government web site. For Part B, the scope of work is: • prepare selected case studies of other jurisdictions (Section 3) • establish the base‐line case and “likely changes” case (Sections 4, 5 & 6) • identify expected outcomes of alternative management options
(Section 7) • prepare a sensitivity analysis (Section 8) • consult with key stakeholders. At the same time, the Federal Government engaged PwC (PriceWaterhouseCoopers) to conduct an independent review of the Product Stewardship (Oil) Act 20001.
1 PSO Review, PwC Economics (Level9) GPO Box 2650 Sydney NSW 1171. email

© Oakdene Hollins Ltd February 2009
For The Waste Authority Page 9
3 International Case Studies
The system of waste oil collection and treatment in the State of Western Australia (WA) exhibits features that are significantly different from those seen in other advanced economies concerned with the issue: in particular, WA’s remoteness from similar markets for the feedstock and outputs of used oil treatment. Nevertheless, we have drawn on three case studies where elements of their experience in managing used oils help to inform the options to be considered by policy makers in WA.2 The three case studies are: • Alberta Province, Canada • Denmark, Northern Europe • Finland, Northern Europe. We have selected Alberta on the basis of its relatively remote location, being equidistant between the only re‐refining plants in Canada. Denmark has been selected for its policy management choices during a recent transition from sending used oil to fuel outlets toward fulfilling a 75% target of re‐refining. Finland has been selected for its remoteness issues and the almost finished new investment in a single re‐refining plant. All three are comparable in terms of population, tonnages of used oil collected, management systems designed to fund the collection or reprocessing of oils and aspects of long distance transport economics.
3.1 Alberta Province, Canada
The western Canadian Province of Alberta operates an Advanced Disposal Fee system similar to that implemented by Australia’s Federal Government, except that in Alberta the payments (return incentives) are disbursed to collectors rather than to reprocessors. In addition, return incentives are not only available for used oil but also for the collection of oil filters and containers. Alberta’s system has been stable for more than a decade, principally because it permits trade in used oil with other Canadian Provinces and exports to the United States. Stability has, arguably, been reinforced by the Province’s indifference as to whether used oil is directed toward reprocessing for legitimate fuel uses or lubricant products.
2 All costs, prices and values quoted in the case studies are in local currency, with Australian dollar
equivalents in parentheses. Conversions from local currency values to Australian dollar equivalents were performed using the conversion website xe.com and should be treated with caution as they were made in October 2008 while global financial markets were experiencing significant instability.

© Oakdene Hollins Ltd February 2009
For The Waste Authority Page 10
3.1.1 Notable Differences with Western Australia
• There is no Federal Government programme of used oil management. The Provincial Government alone is responsible for policy in this arena, with a private sector body responsible for day‐to‐day running of the used oil collection programme.
• Trade opportunities are more extensive as road and rail distances are
not prohibitively expensive.
• Almost 87 million litres of used oil were collected in 2007 from Alberta’s population of 3.3 million. WA collects approximately 42.3 million litres.
• Lubricant sales are far larger due to the quantity of oils sold for pumps
and compressors from which only a small proportion is recoverable.
• Competition is more intense. Although the collection market is dominated by two companies, Enviro‐West Inc and Newalta Inc, competition is so great in urban areas that some generators of used oil in September 2008 were paid as much as 18 Canadian cents per litre.
• Public policy interest in used oil is centred on extending the existing
C$15.7 million (A$18.7 million) levy on lubricants programme.
1000 km

© Oakdene Hollins Ltd February 2009
For The Waste Authority Page 11
Canada has a population of 33 million of which 3.3 million live in Alberta. Population density in the Province is as low as 0.34 per km2 (Northern Lights) but in the main urban area of Calgary is 28.6 people per km2.
3.1.2 The AUOMA Model
For the last ten years, the industry‐led Alberta Used Oil Management Association (AUOMA) has managed an extended producer responsibility (EPR) scheme for collecting and recycling post‐consumer oil, filters and containers. Funds raised from a levy of 5 cents per litre of lubricant at the point of first sale incentivise the recovery of used oil materials by a network of collectors across the Province. In 2007, the levy raised an aggregate sum of C$15.7 million (A$18.7 million). The AUOMA model has led to its adoption in four other Provinces under the auspices of Canada’s Used Oil Management Association (UOMA). The system is deemed to be necessary to ensure the collection of oil from rural areas and from those who change engine oil at home. Ontario, Canada’s largest Province, has to date resisted adopting a similar scheme on the grounds that given the current high price of fuels the need for any ADF (Advanced Disposal Fee) system on lubricants is unnecessary. Instead, it is argued, a market framed by clear legal constraints should be sufficient to ensure that oil is collected and treated effectively. The AUOMA programme has its roots in an approach made by the Canadian Council of Ministers of the Environment (CCME) to the Canadian Petroleum Products Institute (CPPI) in 1988. CCME was concerned that the existing scheme (whereby retailers were responsible for taking back used oil from customers) was ineffective, and due to the high cost of disposal was in effect penalising those retailers diligent enough to accept the returned oil. Free‐riders were evidently disadvantaging conscientious garage owners. CCPI, the national association of oil refiners and marketers which counts Chevron, Shell, Esso and Petro‐Canada among its members, was asked to quantify the environmental impact of used oil. This prompted the government of Alberta to initiate a stakeholder consultation exercise with improved used oil management as its goal. In April 1993 AUOMA was established and charged with trialling a user‐pay incentive‐based programme in six locations in Alberta. The outcome of this two year pilot resulted in the 1997 Lubricating Oil Material Recycling and Management Regulation. The Alberta Used Oil Management Programme was launched, and continues to this day. AUOMA is a multi‐stakeholder not‐for‐profit organisation now consisting of 184 oil and filter wholesalers, oil collectors, transporters and processors. Its key function is to maximise used oil collection but it does not stipulate end‐uses for the recovered material. There are a number of things AUOMA

© Oakdene Hollins Ltd February 2009
For The Waste Authority Page 12
itself does not do: it does not transport, or at any stage take ownership of used oil materials; it does not control collection or recycling facilities; it is not government‐funded; and it does not regulate. AUOMA is instead a ‘delegated administrative organisation’ directed to carry out business on behalf of the Provincial government. The Federal government of Canada has no responsibility for regulating used oil management. The AUOMA programme, described as ‘government initiated and industry‐driven’, is broadly revenue‐neutral and works as follows. All first sellers operating in the Province are required to register with AUOMA, paying it the fixed five cents environmental handling charge (EHC) for every litre of lubricating oil sold to a non‐registered buyer. No EHC is payable for two‐cycle oil, chain oils, drilling, machining and cutting fluids. ‘First sellers’ include manufacturers, marketers, wholesalers, retail distributors or importers. The EHC, also levied on filters and containers, can either be absorbed by the seller or passed on to the customer. The levy is not paid on supply sales transactions between registered members. AUOMA collected $15.7 million (A$18.7 million) through the EHC in 2007. While a portion of the funds (4%) pays for administration and public awareness‐raising activities, around 92% is redistributed as a return incentive (RI) to private sector collectors of used oil. The used oil is collected from some 4,000 generators throughout Alberta, of which about 400 serve as registered ‘drop‐off locations’ accepting used oil materials from ‘do‐it‐yourself oil changers’, farmers and small businesses. Most of these depots are managed by the Alberta Bottle Depot Association, although a few are run by municipalities.
3.1.3 Collection Zoning
To qualify for an RI, collectors must demonstrate that the oil will be recycled ‘appropriately’ by submitting documentation signed by reprocessors registered with AUOMA and whose operations have government approval. Registered collectors are also audited annually and must be in possession of a Letter of Regulatory Compliance. The RI is disbursed based on actual volumes of oil collected determined by tank gauging and discounted by the percentage of contamination by water and by solids. To decide on a sufficient level of incentive, given that the cost of transportation can be an important consideration in oil collection, the Province is divided into six geographic zones (Figure 1). A Freight Equalized Zone Pricing system then dictates the appropriate RI to be paid based on primary and secondary road networks, the volume of oil to be collected and Provincial demographics. The RI thus ranges from 6 cents (A$0.07) per litre in Calgary (Zone 1) to 16 cents (A$0.19) per litre in the far north of the Province (Zone 6). In the Province of British Columbia return incentives are as much as 27 cents (A$0.34) per litre for the remote Queen Charlotte Islands.

© Oakdene Hollins Ltd February 2009
For The Waste Authority Page 13
Fig. 1: Used Oil Collection Zones in Alberta
Source: Corporate Link Management Consultants. 2002. Economic and environmental
performance of Alberta’s used oil program
3.1.4 Metrics
In an area of wastes management where data are often lacking or of poor quality, a clear success of the AUOMA programme has been the significant quantity of auditable annual collection and processing figures made publicly available. Used oil recovery rates have grown markedly: in 2007, 86.9 million litres were collected, a rise of 32.8 million litres over 1998; the market for lubricants in Alberta is unusual compared to most advanced economies. AUOMA claims that last year’s collection figure represents 82% of recoverable used oil3. Given the extent of cross‐border trade in used oil, it is feasible that some of the increase in collection volume is derived from material recovered in the USA and thereby not subject to the Advanced Disposal Fee (ADF): however, such fraud would be comparatively complex to arrange. The number of collection facilities has almost doubled in the same period. The programme also picks up 6.5 million filters and 1,800 tonnes of containers, the majority of which were previously disposed of to landfill, although AUOMA concedes that improvements in container collection rates (currently standing at 45%) are needed. The Association claims a heightened public support for its scheme and notes that the biggest
3 This is difficult to verify as we are not privy to the assumptions which need to be made regarding
what constitutes a ‘recoverable’ fraction. However, AUOMA’s 2007 Annual Report states that the Association raised C$15.681 million (A$18.7 million) through the 5 cents/litre EHC suggesting that some 313.6 million litres of lubricant were sold in the Province last year. Data from the scheme show that 165,319,155 litres were levied in 2007.

© Oakdene Hollins Ltd February 2009
For The Waste Authority Page 14
recovery rate gains have occurred in rural areas previously disadvantaged by their remoteness. The success of the so‐called ‘Prairie model’ has led to its adoption in British Columbia, Saskatchewan, Manitoba and Quebec. However the programme has not been universally welcomed. Ontario is home to one of only two re‐refineries in Canada (SafetyKleen in Breslau, Ontario; the other is Newalta’s plant on Vancouver Island, British Columbia). This Province has so far resisted harmonization with UOMA and has recently implemented a program of its own for collecting filters and containers. Similarly, the maritime Provinces of Nova Scotia, Prince Edward Island and Newfoundland still choose to operate a retail service model. For many critics, the chief bone of contention is that the more environmentally favourable option of re‐refining used oil into new lubricants is not incentivised with the result that collected oil is more likely to be directed towards the residual fuel market. This argument seems justifiable given the high price of fuel. But although most of Alberta’s used oil certainly is directed towards combustion, a surprisingly high proportion is actually re‐refined. This, despite a lack of facilities in the Province and in the face of stiff competition from fuel uses ‐ used oil collectors are said to be paying some urban generators 10 to 18 cents (A$0.12 to A$0.21) per litre.
Fig. 2: End Uses for Collected Used Oil in Alberta in 2007
Recycled As Oil Base Stock
16%
Reprocessed Other Lub. Products
22%
Fuel for Lg. Industrial Burners
12%
Fuel for Asphalt Plants 45%
Fuel for Small Space Heaters
5%
Source: AUOMA 2007 Annual Report. NB: “Other Lub Products” are not actually new lubricants but lower grade products such as oil
fracturing fluids.

© Oakdene Hollins Ltd February 2009
For The Waste Authority Page 15
According to AUOMA’s 2007 Annual Report, although most of the 91 million litres4 passed on for recycling last year was burnt as a fuel (mostly in the Province’s asphalt plants), as much as 38% of the collected oil was apparently directed towards lubricant products (see Figure 2). This would seem too high a figure given that the Province lacks a re‐refinery, the closest plant being Newalta’s facility on Vancouver Island some 1,400 miles distant. However, AUOMA’s new chief executive informs us that the 22% of “Other Lub. Products” does not refer to re‐refining but rather a “lesser process [wherein] the used oil is used as additive for new products, like oilfield fracturing fluid.” Thus, the 16% figure reflects the truer ‐ albeit still surprisingly high ‐ figure for re‐refining of Alberta’s used oil.
3.1.5 Trade in Used Oil and Transport Economics
A striking feature of the management of used oil in Alberta is the extent to which collected oil is transported to end uses outside the Province (Table 1).
Table 1: Collected Oil End Uses& Destinations in 2007, litres
USED OIL End uses
Within Alberta
Outwith Alberta
% sent out of Province
Recycled as base oil 128,298 14,592,173 99.1%
Other lubricant products* 14,392,485 5,985,413 29.4%
Fuel for industrial burners 1,439,603 9,436,731 86.8%
Fuel for asphalt plants 26,930,501 13,490,622 33.4%
Fuel for small space heaters 2,014,692 2,666,592 57%
Total 44,905,579 46,171,531 50.69% Source: AUOMA 2007 Annual Report. Notes: *Refers to “lesser processes” where low quality lubricant is used as an additive, for
example, in oilfield fracturing fluids
The majority of the used oil that is sent out of the Province is directed to the west and south west for use as a fuel supplement in large‐scale industrial processes such as paper mills. Some oil filters are reported to travel as far south as Texas but the general rule of thumb used by collectors is not to exceed one day of travel or a maximum budget of 6 or 7 cents (A$0.07 or A$0.08) per litre.
4 86.9 million litres of used oil are reported to have been collected through the AUOMA scheme in
2007. We assume the 91 million litre figure for used oil processed includes additional volumes of used oil stockpiled from previous years. Also, according to AUOMA’s Annual Report figures on end-use volumes were not audited and may vary from the schedule of used oil materials collected because of production losses and changes in inventory.
© Oakdene Hollins Ltd February 2009
For The Waste Authority Page 16
3.1.6 Policy Priorities
AUOMA views accidental spillage into water bodies as the greatest environmental risk posed by used lubricating oil. The focus is squarely on maximising collection of oil provided that the material is not disposed of to landfill or spread on roads ‐ both legal practices in some Canadian Provinces. The focus on collection is such that oil filters and the containers in which lubricants are packaged and sold have become an increasingly important priority. The fact that used containers and filters can sometimes hold significant quantities of oil residues which risk spillage into water bodies if disposed of inappropriately provides the impetus. The method of disbursing funds through the RI via six zones in which different rates are paid is cumbersome and requires careful audit if it is not to be abused. The system sets financial payments as a proxy for market prices. Consequently, during periods when prices in general and oil prices in particular are changing frequently, the accuracy of the financial payments needs to be reviewed more often. Inefficiency is an inherent risk in any such detailed market intervention. Some contend that the potential for anti‐competitive practice is behind Ontario’s reluctance to adopt the UOMA model since oil companies, which manufacture lubricant products, have a vested interest in preventing competitors from manufacturing base oil derived from used oils. Equally there are concerns of market manipulation in the other direction. Should the Provincial government place tight limits on the market for burner fuels derived from used oil and arrange for a re‐refining plant to be constructed, the operators would then enjoy regional market power since there would be no prospect of a competing plant being opened.
3.1.7 Learning Points from the Alberta Case Study
Alberta’s AUOMA model has provided: • 10 years of stability in the system for collecting used oil • significantly increased collection tonnages during a period of static or
declining lubricant sales • rich data records on volumes and sources of used oil in a developed
economy • improved collection from isolated rural areas • data to demonstrate that oil filters and the containers in which lubricant
is sold present a potentially significant environmental hazard.
In the context of the options under consideration in Western Australia, the case study provides the following learning points:

© Oakdene Hollins Ltd February 2009
For The Waste Authority Page 17
• Stability was achieved through a mix of risk reduction policies, not through a single policy intervention.
• Once re‐refineries are built and their capital is regarded as a sunk cost,
the operators can compete for used oil over a very large geographic area. This might encourage high levels of short term financial support for re‐refineries to get them established in Australia.
• Major industrial plant closures and switches in industrial fuel demand
in Alberta during the 10 year period had no impact on the collection infrastructure.
• Risk to the collection system was reduced by enabling diversification of
outlets through out‐of‐Province trade.
• Risk of collection failure was further reduced with strict ‘fitness’ criteria for collection companies seeking registration to receive return incentive payments.
• Oil filters and lubricant packaging were shown to present associated
environmental risks to the quality of water resources. The significant differences between WA and Alberta overwhelm the superficial similarities such as the issue of isolation and also the presence of a large mining industry. A key issue, given the higher costs of transport from WA to reach other markets for used oil, is the experience of other developed economies that chose to encourage local re‐refining for the majority of the collected oil. For this reason our next case study investigates the experiences of Denmark.
3.2 Denmark, Europe
Two mechanisms for used oil collection operate side‐by‐side in the northern European country of Denmark. The Mineral Oil Branch (MB), a private sector body, incentivises the free collection of waste oils suitable for re‐refining through a levy on new gear, engine and hydraulic oils. The subsidy is paid based on the recovered oil ultimately re‐refined. Used oils contaminated with metals or with high volumes of water, such as marine lubricants and spent cutting and drilling fluids, are excluded from the MB programme. Generators of such non re‐refinable materials are instead required to pay market rates for their disposal. Denmark has recently prioritized regeneration over fuel uses for waste lubricant, effected via fiscal and regulatory changes. Before 2002, most

© Oakdene Hollins Ltd February 2009
For The Waste Authority Page 18
recovered oil was burnt in local district heating plants. The Danish government has accomplished this transition with minimal disruption to the collection infrastructure. This has been achieved by effectively restricting competition for used oil collection to two companies ‐ one operating the country’s sole re‐refinery. The same two firms dominate collection across both the MB and market systems. Denmark’s easy access to markets beyond its borders has further smoothed the transition from fuel uses to regeneration. In 2007, a total of 68.2 million litres of all lubricant types was consumed by Denmark’s population of 5.5 million. Although the MB system recovered just 18.3 million litres of waste oil in the same year, a 90% recovery rate is claimed since non‐re‐refinable materials are ignored in the calculation, which also assumes that half the remaining re‐refinable lubricant is lost in use. The volumes collected by the market outside the MB system are less clear, although one company reports that it collected 17 million litres of non‐re‐refinable used oils. Given Denmark’s small size (43,098 km2), high population density (127 per km2) and the fact that a significant proportion of the oil is excluded, it is reasonable to question the value for money achieved by the MB scheme. The running costs are some 30 million Danish Krone (A$7 million) per annum. Per litre of oil collected, we calculate the Danish system costs twice as much as Alberta’s.
3.2.1 Notable Differences with Western Australia
• A twin approach to used oil collection: a levy and subsidy programme for maximising recovery of re‐refinable used oils and a market‐based scheme for the remaining lower quality used oils.
• Although there are numerous populated islands, the country is small
(with around one‐sixtieth the land area of WA) with a far higher average population density.
• Transport economics allow used oil to be transferred by road tanker to
neighbouring countries, especially Germany, for approximately 2 to 3 Euro cents (A$0.04 to A$0.05) per litre. Similarly, Denmark’s proximity to Scandinavia permits ‘topping up’ of feedstock for its seaport‐connected Kalundborg plant in the event of reduced local supply.
• Denmark operates a highly regulated market in which two companies,
Dansk Olie Genbrug (DOG) and Gunnar Lund Olieservice, enjoy protection from market entrants in the collection of used oil. Notably, DOG also owns the one re‐refining plant operated in Denmark.

© Oakdene Hollins Ltd February 2009
For The Waste Authority Page 19
3.2.2 Background
In common with most of Europe, the Danish tax system historically favoured combustion outlets for used oil by setting the excise duty on fuel oil derived from treated used oil at zero. Denmark’s fiscal arrangements were the subject of an EU infringement case and in 1992 the difference in duty on fuel oils produced from waste oil versus virgin oil was removed. The change in the rules presented a problem for the Danish government as the economic incentive for waste companies to collect oil was thereby removed. With generators such as garages now required to pay collectors for the removal of used oil, the authorities were concerned that illegal disposal would result. To tackle the issue, the government started to subsidise used oil collection in 1993, financing the scheme by imposing an ADF (advanced disposal fee) of 2 Danish Krone (DKK) (A$0.48) per litre on sales of new lubricants. The government‐run system recovered between 35 and 40 million litres of waste oil per annum by the late 1990s. This has been estimated to represent perhaps 75% of the total used oil recoverable in Denmark, but such figures
400 km

© Oakdene Hollins Ltd February 2009
For The Waste Authority Page 20
are hard to verify given assumptions made concerning oil volume losses during use. The system was, however, considered expensive and by the late 1990s oil collection was increasingly viewed as something the State should not be managing directly. In 1998, the annual subsidy had reached 42 million DKK (A$10 million). Succumbing to political pressure, the government started cutting back the subsidy and eventually withdrew it, passing control of oil collection to the Mineralolie Branchenforening (MB), an industry association representing lubricant importers and sellers. On 1 July 2000 a new privately‐run scheme focusing solely on re‐refinable oils, and funded by a continuing ADF, was introduced and continues to the present day. The state tax on lubricant sales was withdrawn in 2002. Waste oils not suitable for regeneration were excluded from the MB scheme and are instead collected at market cost to generators.
3.2.3 Re-refinable Oils: The MB Collection System
The not‐for‐profit MB voluntarily runs a programme wherein a charge is levied on lubricant sold by its members. The levy now stands at 50 Danish øre (A$0.12)5 per litre and is payable only on lubricant grades which, at the end of their life, are suitable for re‐refining. This material tends to be used gear, engine and hydraulic oil. Oils designed for cutting, drilling and various marine purposes do not attract the levy and are excluded from the MB programme. The funds collected through the levy are passed to the Miljøpuljen ApS – an Environmental Pool fund used to subsidise the free collection of re‐refinable waste oils. The subsidy is disbursed on the basis of the volume of re‐refinable oil collected, after solids and water are removed. The current subsidy stands at around 1.5 DKK (A$0.36) per litre re‐refined. The subsidy is payable only for the output of base oil that is sold for lubricant uses6. We understand the MB plans to reduce it as base oil prices rise. The subsidy is paid for the total volume of both the regenerated base oils and fuel oils produced. Danish law does not preclude any firm from recovering used oil and claiming Miljøpuljen funds, but in practice the collection market is dominated by just two companies: Dansk Olie Genbrug (DOG), owned by Avista Oil (itself part of Mustad International Group) and its only significant competitor Gunnar Lund Olieservice. DOG claims to recover around two thirds of Denmark’s collectable oil with Gunnar Lund accounting for the rest. Both businesses are protected from new entrants to the MB scheme by a requirement that any oil collection company seeking to claim a subsidy must offer free, national collection for any quantity of used oil above 200 litres that is suitable for re‐refining. Although Denmark is
5 On 1 October 2008 this levy was lowered from 60 øre (14 Australian cents), reflecting the increasing
value in used oil since 2006 and thereby the reduced costs involved in its collection. Similarly, we have been informed that the subsidy passed onto the collectors has also been reduced.
6 The subsidy can be paid for oil that is refined using TFE (Thin Film Evaporators) similar to that used by Wren Oil at Picton - but only if the feedstock has been carefully selected.

© Oakdene Hollins Ltd February 2009
For The Waste Authority Page 21
small ‐ taking just four hours to drive its length ‐ the country is composed of numerous, populated islands. This disadvantages new collectors whose business plan is to start recovering local oil with the intention of eventually offering nationwide coverage. Discussions with DOG reveal that in 2007 it collected 13 million litres of oil of the type suitable for re‐refining. Following dewatering and the removal of solid contaminants at a plant in the city of Horsens, the remaining 10.4 million litres were then re‐refined into 7.8 million litres of base oil and 2.6 million litres of fuel oils. The 10.4 million litres regenerated by DOG would therefore have attracted a total subsidy of around 15.6 million DKK (A$3.7 million)7. Oil generators are also able to deposit waste lubricants at one of around 40 collection points distributed around Denmark. Unlike in Alberta, the scheme does not reward the collection of oil filters and lubricant packaging; instead the emphasis is on re‐refining at least 75% of the collected oil. Filters and containers are, however, collected through the market system.
3.2.4 Non-Refinable Oils: The Market System
Both DOG and Gunnar Lund dominate the collection market for lower grades of oils outside the MB programme. These include slops from shipping and oils containing metal impurities from cutting and drilling industries are not suitable for re‐refining. Unlike with the re‐refinable used oils, generators of such material are expected to pay for its collection and disposal. DOG reports that it collected around 17 million litres of such material in 2007, ensuring that re‐refinable and non‐re‐refinable grades of oil are collected separately, and asking generators producing both grades to keep them apart. A small quantity of oil is also collected outside the MB programme by several intermediary companies including the hazardous waste firm KommuneKemi and Stena Miljø a large general waste collector who then sell on re‐refinable oil to DOG. Stena Miljø also collects used oil containers and filters, something neither DOG nor Gunnar Lund are able to do since they lack the vacuum trucks for removing sand from the filters.
3.2.5 Re-refining Priority
Denmark had long delayed transposing into national law Article 3(1) of the 1975 EU waste oil directive (75/439/EEC) requiring Member States to prioritize re‐refining of used oil over fuel uses8. Instead, Denmark’s
7 Note that until September 2008, Denmark did not have a functioning re-refinery so the used oil regeneration described here would have occurred at the Dollbergen plant in Germany. 8 Article 3 (1) of Directive 75/439/EEC on the disposal of waste oils, amended by Council Directive 87/101/EEC of 22 December 1986, states: “Where technical, economic and organizational constraints so allow, Member States shall take the measures necessary to give priority to the processing of waste oils by regeneration.”
© Oakdene Hollins Ltd February 2009
For The Waste Authority Page 22
existing statute BEK 619 (Bekendtgørelse om affald 619 or ‘Statutory Order no. 619’) governing waste oil allowed it to be directed to heating uses as a means of recovering heat value. This is not surprising given that the country has had no domestic re‐refining capacity until very recently. Although a re‐refinery plant was established at the Danish seaport of Kalundborg in the 1990s, the 35 million litres per annum input capacity facility failed to perform for much of the decade. During this period most lubricating oil recovered was instead incinerated in district heating plants. In 2002, however, Denmark passed BEK 616 which amended BEK 619 by giving priority to re‐refining, thereby satisfying the EU. A voluntary target of re‐refining 75% of the collected used oil was subsequently inserted in the latest of Denmark’s National Waste Strategies. In the context of Denmark, re‐refining is taken to include re‐refining recovered lubricant into both new base oils and also new fuel oils. The subsidy is paid for the total dewatered lubricant regenerated. In order to support this target the State Government: • Taxed all fuel oils, which since 1992 included those derived from waste
oils; last year the excise duty rate on heavy fuel oil used for heating by businesses stood at the equivalent of 325 Euros (578 AUD) per thousand litres ‐ the third highest in the EU‐27 (Figure 3).
• Raised the emissions standards to such an extent that upgrading small
and medium‐sized power plants to meet the new regulations while continuing to burn waste oil was no longer cost effective. The main outcome has been that small district heating plants no longer are able to burn waste lubricating oil.
In 2003, the Mustad International Group from Houston USA, acquired DOG and subsequently also purchased the largest European re‐refining plant, the 150 million litre per annum capacity Mineralöl‐Raffinerie Dollbergen GmbH in Germany. This investment provided the opportunity to upgrade and enlarge the Dollbergen plant using the company’s solvent extraction based Vaxon process. But with both the Dollbergen and Kalundborg facilities running at around 70% capacity, Mustad decided to close Kalundborg in February 2005. For three years, used oil collected in Denmark was stockpiled at Kalundborg and exported by road tanker (and sea ferry) almost 600 kilometres south to Dollbergen.

© Oakdene Hollins Ltd February 2009
For The Waste Authority Page 23
Fig. 3: Excise Duty on Heavy Fuel Oil (Heating “Business Use”) in EU Member States
0
50
100
150
200
250
300
350
400
450
BEB G CZ DK DE EE EL ES FR I.E. IT IT CY
LVLT LU HU HU HU MT NL AT PL PT RO SI SK FI SE UK
Member State
Exci
se D
uty
Rat
e (v
alue
s in
EU
RO
per
th
ousa
nd li
tres
at 1
Oct
200
7)
Source: European Environment Agency 2007 NB: Minimum excise duty: 15 Euros per 1000kg
DK = Denmark

© Oakdene Hollins Ltd February 2009
For The Waste Authority Page 24
Recent higher oil prices and guarantees of continuing regulatory control over alternative fuel uses in Denmark made possible an investment decision by Mustad International Group to upgrade the Kalundborg plant in 2008. Previously, technical problems had meant that Kalundborg’s outputs were suitable only for industrial and bunker fuel markets. Moreover, the plant’s equipment was said to be relatively energy‐intensive. Industry contacts now inform us that the revamped Kalundborg, which re‐opened in August 2008, is significantly more efficient and now produces more widely accepted base oil products. From interviews conducted for this case study we are told that the outputs of the Kalundborg plant are:
Table 2: Kalundborg Plant Data
PRODUCTS Re-refined from Used Oil
Input Feedstock - Used Oil incl. water and solids
(million litres/yr)
Outputs (million litres/yr)
40.0 Base Oil Production 24.0
Fuel Oils 5.5 Heavy Fuel 2.5
Asphalt extender 5.0 Source: Estimates from trade interviews by Oakdene Hollins Ltd
Used oil is no longer being shipped south to Dollbergen. Additional used oil feedstock for Kalundborg has also been negotiated from nearby Sweden, and Norway, and DOG is now planning to source additional oil from Finland. These plans may prove to be frustrated by new re‐refining plants that were announced in 2008 for Norway (Puralube Nordic AS and Ineos Bamble AS) and Finland (see the following case study, Section 3.3). The only Danish outlet for lower quality oils collected by DOG and Gunnar Lund, and the bottoms from the distillation process at Kalundborg, is now as auxiliary fuel burnt by a hazardous waste incinerator run by KommuneKemi. The latter company does collect small quantities of oil itself and has in the past exchanged any re‐refinable material it recovers for poorer quality oil collected by Gunnar Lund. We understand that less than 1 million litres is now sold to KommuneKemi each year – and the figure is falling rapidly as the Danish government continues restricting waste oil combustion. DOG also exports these materials for fuel distillation at the Dutch ‘North Refinery’ and for a reduction process at the Salzgitter Flachstahl steel mill in Germany. For a period oily sludges and ‘bottoms’ from the re‐refining processes were also incinerated at the Ålborg Portland cement works but Ålborg chose not to renew its permit to process following the introduction of the 2005 EU Waste Incineration Directive. Two large Danish industrial groups, Danfoss and Grundfos, were until recently also

© Oakdene Hollins Ltd February 2009
For The Waste Authority Page 25
permitted to burn small but significant quantities of waste lubricating oil which they generate, but the practice has now been outlawed.
Fig. 4: Key Outlets for Danish Used Oil, 1990 – 2008
3.2.6 Metrics
Overall lubricant oil consumption in Denmark has been steadily falling, reflecting the general trend in developed economies as cars become more efficient in their use of lubricating oil. In 1986, just over 96 million litres of all grades were sold; last year sales stood at around 68 million litres (Figure 5).
300 km

© Oakdene Hollins Ltd February 2009
For The Waste Authority Page 26
Fig. 5: Consumption of Lubricants in Denmark
0
20
40
60
80
100
120
1986 1988 1990 1992 1994 1996 1998 2000 2002 2004 2006
New
Lub
rican
t Con
sum
ptio
n (m
illion
litre
s)
Total Automotive Industrial Marine SundryLubricants
Source: Mineralolie Branchenforening
The MB estimates that of the total lubricants sold in any one year, roughly 60% are of the type that ultimately can be re‐refined. On that basis, around 41 million litres of re‐refinable lubricants were estimated to be sold in 2007. Assuming around 50% is lost in use, 20 million litres per annum would be expected to be recoverable. Thus, the MB system seems fairly effective as last year 18.3 million litres were actually collected (Figure 6). Unaccounted‐for oil is thought to be burnt illegally by farmers, and in small space heaters, although widespread dumping of oil is considered unlikely.
Fig. 6: Fates of Used Lubricants Collected through the MB System
0
5
10
15
20
25
2001 2002 2003 2004 2005 2006 2007
Mill
ion
Litre
s
Used Oil Collected Re-refined as Heating Oil Re-refined as Base Oils
Source: Mineralolie Branchenforening

© Oakdene Hollins Ltd February 2009
For The Waste Authority Page 27
In line with the new Danish policy favouring regeneration, over the last six years the volume of used oil re‐refined to base oil has steadily increased, while fuel oil production has plummeted. In 2001, just 1.7 million litres of base oil were produced from recovered oil. Last year, the figure stood at around 13.5 million litres. Figure 7 shows the fate of the used oil collected through the MB system in 2007. About 15% of the 18.3 million litres collected in 2007 was comprised of water and solid contaminants. The removal of the latter gave 15.5 million litres of used oil for which a total subsidy of 23.3 million DKK (A$5.7 million) was payable. Just over 2 million litres of heating oil and, as mentioned, 13.5 million litres of base oil were then produced.
Fig. 7: Management of Used Oil Collected in Denmark in 2007
Re-refined as Base Oils
74%
Re-refined as Heating Oil
11%
Water, Solids, Contaminants
Removed15%
Source: Mineralolie Branchenforening Although the Danish system is apparently achieving its target of maximising the volumes of oil being re‐refined, the system is not cheap. In fact, we estimate it costs almost twice as much as the Alberta programme. According to the Danish Topic Centre on Waste & Resources, in 2006 the MB scheme cost consumers approximately 30 million DKK (A$7 million). Although this suggests a 30% saving on the previous government‐run scheme which cost 42 million DKK (A$10 million), this is equivalent to 1.68 DKK (A$0.41) per litre of oil recovered. In 2007, based on the total income achieved through levies, we calculate that the Alberta scheme cost consumers just 18 Canadian cents (A$0.22) per litre recovered9.
9 According to the AUOMA Annual Report for 2007, 86,891,745 litres of used oil were collected at a
cost of C$15,681,140 in Environmental Handling Charges. This excludes C$567,921 raised by AUOMA from Investment income and C$3,076 in Registration fees.

© Oakdene Hollins Ltd February 2009
For The Waste Authority Page 28
3.2.7 Prices
With an increasing demand for oil products manufactured from re‐refined oil, the Dollbergen plant in Germany has been able to pay feedstock suppliers between 80 and 100 Euros (A$142 and A$178) per tonne for their used oil at the refinery gate. Despite the costs of transporting oil to Germany by road tanker (approximately 25 to 30 Euros (A$44 to A$53) per tonne including ferry costs), oil collectors in Denmark could remain profitable and the Danish used oil management system remain stable. In the event that gate prices fell, the DOG and Gunnar Lund could in any case ask for higher return incentive payments from the Miljøpuljen. The two oil collectors also receive payment from the lower quality oils they handle. As mentioned above, these non‐re‐refinable oils are excluded from the MB system and generators are expected to pay DOG and Gunnar Lund for their disposal. For example, we are informed that shipping companies will pay the collectors between 560 and 710 DKK (A$134 and A$169) per tonne. The price paid depends on the quality and volume of oil being recovered and the prevailing fuel price. The collection companies also raise revenue from selling the material to KommuneKemi at approximately 220 DKK (A$52) per tonne; they achieve even higher prices from the German and Dutch plants described above.
3.2.8 Learning Points from the Danish Case Study
• Denmark has focused on the collection of waste oils which are re‐refinable but has left the market to deal with the more problematic oil bottoms, marine slops, and oils contaminated with metals. Proximity to other markets, particularly in Holland and Germany, has provided outlets for such materials.
• In order to encourage private sector investment in a small‐scale re‐
refining plant, the State government took fiscal and regulatory actions designed to limit the threat presented by the competing market of industrial fuels.
• The increased risks to the stability of the collection system in relying on
a single local re‐refining plant were reduced by the plant’s owner (Mustad International) operating a second larger‐scale plant within economic transport distance.
• These risks were further reduced by requiring additional tank storage
capacity on‐site at Kalundborg.
• The regulatory controls placed over new market entrants further reduced the investment risk to Mustad International.

© Oakdene Hollins Ltd February 2009
For The Waste Authority Page 29
• The local collection company (Gunnar Lund Olieservice), equivalent to Wren Oil in WA, survived the acquisition of its only major competitor (DOG) and that competitor’s integration with the new re‐refining plant.
• Contracts with the collection companies include enforceable
performance terms. Failure to collect from remote locations on grounds that it is too expensive would lead to action under the contract. To date this has never been necessary. Performance bonds are not required since subsidy payments are made during each year.
However, as with Alberta, modest transport costs to neighbouring markets have permitted stability in Denmark’s collection system during upheavals in the market – this marks the single most important difference with conditions experienced in Western Australia.
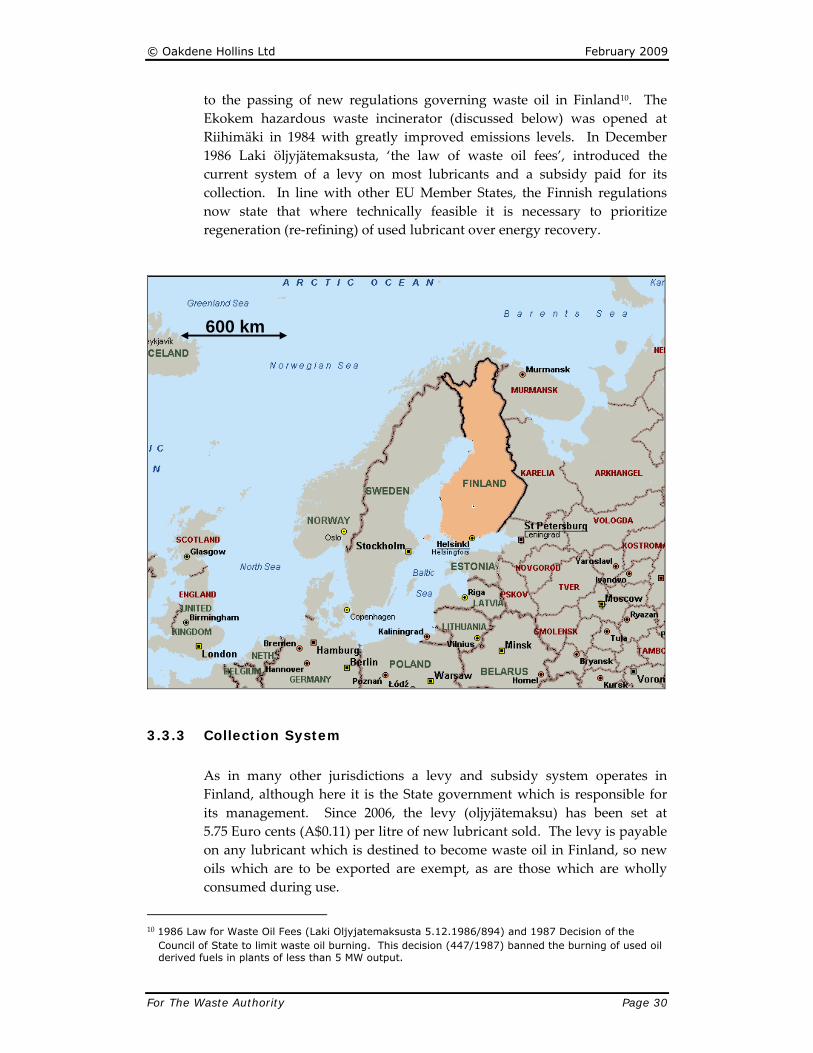
3.3 Finland, Europe
Finland has a population of 5.3 million and operates a similar ADF system to that used in Denmark and elsewhere. A levy is charged on most lubricants and the accumulated fund is distributed to a single collection business targeting mostly the best quality used oil; suitable for re‐refining. The case study expands on the evidence from Denmark since a new 60,000 tonne re‐refining plant is being built and will be opened in 2009. Notably, the investment risks associated with the new privately‐funded re‐refining plant were reduced by controlling the burner fuel market and establishing a five year used oil supply contract with the monopoly collection business. We estimate that more than 40% of the collectable oil is left outside the subsidised collection system.
3.3.1 Notable Differences with Western Australia
• The State Government manages the fund raised from a levy on lubricant sales.
• Subsidies are paid to a single monopoly collector on the basis of an
open book ‘cost plus’ system. A five year contract is negotiated with the single collector to ensure that public service requirements are explicit.
3.3.2 Background
Historically, the management of waste lubricants in Finland was poor. Most recovered oil tended to be combusted in industrial burners with poor emissions standards. Increasing environmental awareness in the 1980s led
© Oakdene Hollins Ltd February 2009
For The Waste Authority Page 30
to the passing of new regulations governing waste oil in Finland10. The Ekokem hazardous waste incinerator (discussed below) was opened at Riihimäki in 1984 with greatly improved emissions levels. In December 1986 Laki öljyjätemaksusta, ‘the law of waste oil fees’, introduced the current system of a levy on most lubricants and a subsidy paid for its collection. In line with other EU Member States, the Finnish regulations now state that where technically feasible it is necessary to prioritize regeneration (re‐refining) of used lubricant over energy recovery.
3.3.3 Collection System
As in many other jurisdictions a levy and subsidy system operates in Finland, although here it is the State government which is responsible for its management. Since 2006, the levy (oljyjätemaksu) has been set at 5.75 Euro cents (A$0.11) per litre of new lubricant sold. The levy is payable on any lubricant which is destined to become waste oil in Finland, so new oils which are to be exported are exempt, as are those which are wholly consumed during use.
10 1986 Law for Waste Oil Fees (Laki Oljyjatemaksusta 5.12.1986/894) and 1987 Decision of the
Council of State to limit waste oil burning. This decision (447/1987) banned the burning of used oil derived fuels in plants of less than 5 MW output.
600 km

© Oakdene Hollins Ltd February 2009
For The Waste Authority Page 31
The levy is passed on to the Ministry of the Environment which then uses the money in two ways. A proportion is used to subsidise the collection, transportation and storage of waste oil, while the rest is directed toward an Oil Conservation Fund (Öljysuojelurahasto) for cleaning up soil and water contaminated with spilled lubricant oil. In Finland, the waste oil collection market is monopolised by Ekovoima Oy (literally ‘Eco Power Ltd’), a subsidiary of Ekokem Group, and this is the only company which directly receives the subsidy. In the past some competition was provided by the Finnish environmental management and services giant L&T (Lassila & Tikanoja), but as discussed below L&T has now changed its focus to oil reprocessing. The exact amount of subsidy paid to Ekokem varies according to the cost of the collection operation and, according to the rules of the Finnish Council of State (Valtioneuvosto), is set at a level such that the collecting companies can make ‘reasonable profit’. Rather than being paid per litre collected, Ekokem is instead given a fixed annual subsidy depending on the yearly cost of oil collection. This is essentially a ‘cost plus’ contract based on an open book arrangement in which the collector provides accounting information as required. Ekokem’s 2007 Annual Report states that it received €2.052 million (A$4.1 million) of waste oil subsidy in 2007. This is slightly down on the 2006 figure of €2.558 million (A$5.2 million) because increasing efficiencies and crude oil price rises last year led to greater profits for Ekokem. We estimate that this subsidy is equivalent to 9 Euro cents per litre in 2007 (A$0.18). For the year 2008, the Finnish Ministry of the Environment informs us that no subsidy at all may be paid since Ekovoima is now so profitable. However, our contact at Ekovoima thinks a small subsidy of €0.5‐1 million (A$1 to A$2 million) might still be disbursed (equivalent to between 2 and 4 cents, or A$0.04 to A$0.08, per litre). Ekokem’s 2007 report also reveals that the Ministry of the Environment and Ekokem signed a new five year agreement for managing waste oil collection in Finland. Ekovoima has nationwide responsibility for overseeing the collection and handling of Finnish waste oil, and delivery to the ‘appropriate’ processor. While in some municipalities the company will collect directly, in most parts of the country it sub‐contracts recovery to a number of other smaller firms which are also subject to new five year contracts with Ekovoima. The latter are required to use standard vehicles, uniform and other visible branding symbols to reassure generators that they are part of the official collection scheme. Part of the subsidy agreement is that any quantity of good quality oil exceeding 400 litres is collected at no charge to the generator. Generators of smaller quantities of good quality used lubricants are required to pay for
© Oakdene Hollins Ltd February 2009
For The Waste Authority Page 32
collection. We understand the amount charged varies between 15 and 48 Euro cents (A$0.30 to A$0.96) per litre depending on the transportation distance and whether or not other wastes can be recovered at the same time. Collectors are also permitted to charge generators a disposal fee for lower quality oils contaminated with more than 10% water and other foreign particles, regardless of the volume collected. The charge includes an additional 20 Euro cents (A$0.40) per litre processing fee and varies between 35 and 68 Euro cents (A$0.70 to A$1.36) per litre depending on transportation distance. Generators are requested to keep the different grades of used oil separately. Small volumes of waste oil can also be deposited free of charge by the public at collection points provided by ‘municipal waste corporations’ and are handed over to Ekovoima. The municipalities pay Ekovoima approximately 20 cents per litre (A$0.40) for this service as the oil is typically of a poor quality.
3.3.4 Reprocessing
All waste lubricant collected in Finland is reprocessed or disposed of in‐state. This looks likely to continue given the imminent commissioning of a major new regeneration facility described below. The fate of collected oil will depend on its quality but, where feasible, regeneration is now Finland’s priority. Until autumn 2007, the vast majority of waste oil was burnt, either in large industrial plants or at Ekokem’s hazardous waste incinerator at Riihimäki. The plant at Riihimäki has been in operation since 1984 and meets tight emissions controls11. A small amount (2,000 tonnes annually) of recovered material categorized as ‘white’ used oil was ‐ and still is ‐ sent for de‐watering and cleaning at another Ekokem facility in Jämsänkoski. The output from this plant tends to be lower quality base oils and is used mainly in the forestry sector for cutting tools. Waste oil of the type formerly sent for burning is now being stockpiled by a separate company called L&T Recoil Oy, a joint venture company managed by L&T. This is in readiness for a new 60 million litres per annum capacity oil re‐refinery located at the Finnish port of Hamina (Figure 8). Originally scheduled for the end of 2008, the Hamina plant’s opening has been delayed until spring 2009.
11 The plant is compliant with WID (Waste Incineration Directive) requirements on emissions

© Oakdene Hollins Ltd February 2009
For The Waste Authority Page 33
Fig. 8: Waste Oil Reprocessing Facilities in Finland
250 km

© Oakdene Hollins Ltd February 2009
For The Waste Authority Page 34
The Managing Director of L&T Recoil informs us that the new plant uses similar technology to that employed by Puralube at its plant in Tröglitz near Leipzig in Germany. It will be able to reprocess waste oils into new base oils SN150 and SN500 for overseas markets. The plant would thereby easily qualify for the highest level of PSO benefit in Australia. We understand that all the Finnish sourced waste oil to be reprocessed by L&T Recoil will be delivered by Ekovoima as part of a new five year contract. However, 50% of its feedstock will need to be imported from other countries. Hamina was probably chosen as a location in order to give the plant convenient access to feedstock from nearby countries such as Poland and Sweden. This plant will likely compete for regional feedstock with the newly re‐opened Danish facility at Kalundborg described in the previous case study (Section 3.2). In addition, Puralube, in association with Ineos Bamble AS is opening a new 85 million litre per annum re‐refining plant at Ronningen, Norway in 201012. Approximately 10,500 tonnes of used oil, not best suited for regeneration, is likely to continue to be directed towards combustion in industrial plants, although their output must exceed 5 megawatts and meet the strict emissions standards.
3.3.5 Metrics
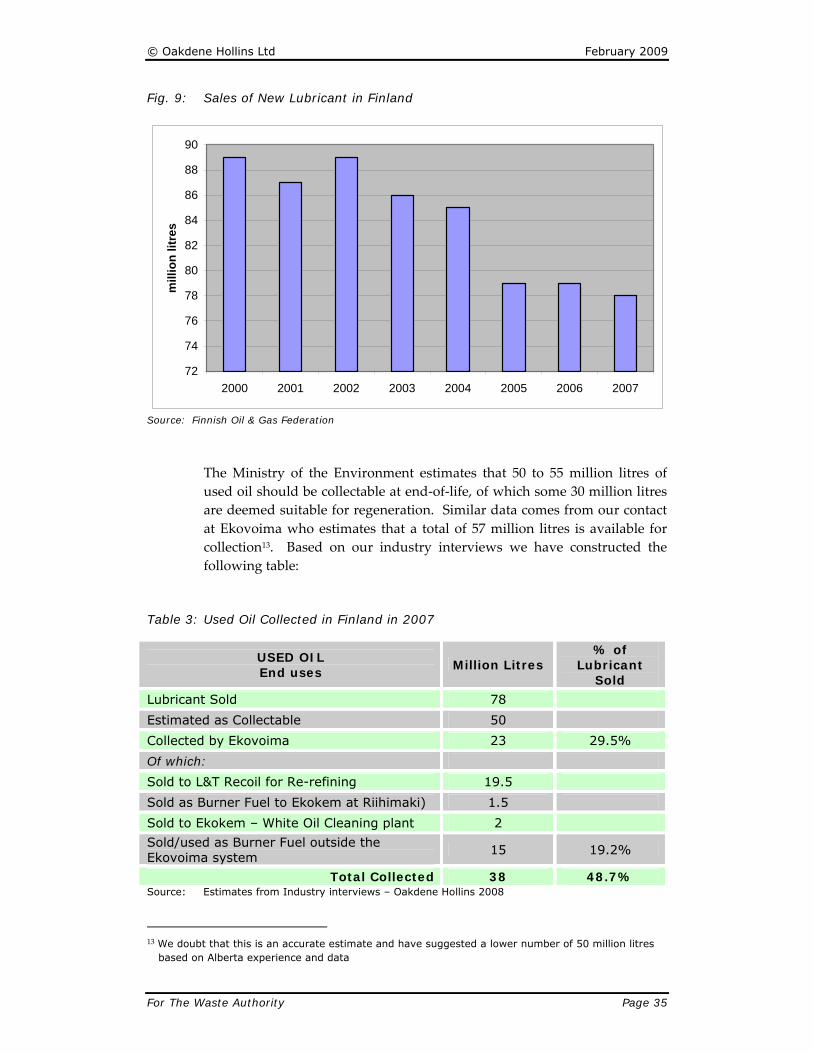
Neste, Shell and Teboil dominate the market for lubricating oil sales in Finland. According to the Finnish Oil & Gas Federation, a total of 77.86 million litres of new lubricant were sold in 2007, 31.93 million litres of which being motor oil. As in other developed economies, this represents a significant decline in sales as lubricant longevity increases (Figure 9). In 1990, almost 118 million litres (of all grades) were sold. Given the 5.75 Euro cents (A$0.11) per litre levy on sales of new lubricant, we calculate that in 2007 the Finnish government should have collected some €4.5 million (A$9 million). This broadly concurs with the €4 million figure for total levies collected in 2007 published by the Finnish Oil & Gas Federation.
12 The reported investment cost is US$70.6 million
© Oakdene Hollins Ltd February 2009
For The Waste Authority Page 35
Fig. 9: Sales of New Lubricant in Finland
72
74
76
78
80
82
84
86
88
90
2000 2001 2002 2003 2004 2005 2006 2007
mill
ion
litre
s
Source: Finnish Oil & Gas Federation
The Ministry of the Environment estimates that 50 to 55 million litres of used oil should be collectable at end‐of‐life, of which some 30 million litres are deemed suitable for regeneration. Similar data comes from our contact at Ekovoima who estimates that a total of 57 million litres is available for collection13. Based on our industry interviews we have constructed the following table:
Table 3: Used Oil Collected in Finland in 2007
USED OIL End uses
Million Litres % of
Lubricant Sold
Lubricant Sold 78
Estimated as Collectable 50
Collected by Ekovoima 23 29.5%
Of which:
Sold to L&T Recoil for Re-refining 19.5
Sold as Burner Fuel to Ekokem at Riihimaki) 1.5
Sold to Ekokem – White Oil Cleaning plant 2
Sold/used as Burner Fuel outside the Ekovoima system
15 19.2%
Total Collected 38 48.7% Source: Estimates from Industry interviews – Oakdene Hollins 2008
13 We doubt that this is an accurate estimate and have suggested a lower number of 50 million litres
based on Alberta experience and data

© Oakdene Hollins Ltd February 2009
For The Waste Authority Page 36
Around half of the used oil collected in Finland comes from garages, with the rest arising from industrial uses.
3.3.6 Prices
The price data gathered from industry sources is summarised as:
Table 4: Used Oil Collection Prices in Finland in 2007/8, Euro cents
USED OIL Types
Collection Price Cents
per litre
Subsidy (2007) Cents
Subsidy (2008) Cents
Clean oil in quantities > 400 litres Free 9 2 – 4
Clean oil in quantities < 400 litres 15 - 48 9 2 – 4
Oil contaminated with >10% water etc 35 - 68 9 2 – 4
Oil from Municipality Collection Points 20 9 2 – 4
Oil sold to re-refinery (mid 2008 Gate Price)
16 - 18
Source: Estimates from Industry interviews – Oakdene Hollins 2008
3.3.7 Learning Points from the Finnish Case Study
• In common with Denmark the collection system is designed to target the oil most suited to re‐refining and to prevent it from being used as a burner fuel.
• The quantity of oil outside the levy and subsidy system represents, we
estimate, slightly less than 40% of the collected oil in Finland. The regulatory authorities are confident that this is managed correctly as there is a culture in which inappropriate management would be unacceptable.
• The construction of the new re‐refining plant was supported by the
State government by preventing competition from burner fuel markets and providing an assured five year supply of suitable oils.
In order to provide a broader evidence base we have included a short case study of Spain (Section 3.4) which has very recently reformed its system in order to encourage the collection of all used oils whilst giving priority to re‐refining to base oil.

© Oakdene Hollins Ltd February 2009
For The Waste Authority Page 37
3.4 Spain, Europe
Until 3 June 2006, Spain operated a national system of subsidies for the collection and processing of used oils. The maximum level of these subsidies was:
Table 5: Maximum Subsidies for Used Oil in Spain until 2006
USED OIL
Euro Cents per litre
A$ cents Equivalent
Transport & collection 2.405 4.8
Re-refining 6.612 13.2
Treatment to produce a burner fuel or bituminous product
1.804 3.6
In practice, the budget for these subsidies was uncertain from one year to the next. In 2002, for example, the budget shortfall was 11% and in 2003 the budget shortfall was declared as being 50% until intense lobbying led to a more generous budget provision. The uncertainty created by the budget changes led to a wholesale review of the system and, in common with Denmark, the system was delegated to a new private sector organisation funded by a levy of 5 cents per litre (A$0.10) on most new lubricant sales. In 2007 lubricant sales in Spain were approximately 520,000 tonnes. Legislation was agreed in June 200614 that created SIGAUS (Sistema Integrado de Gestion de Aceites Usados). In October 2008 the collection subsidy was reduced slightly (from 2.88 to 2.68 cents per litre (A$0.5.5) in recognition of the higher values attached to used oils during 2008 in particular. The new rates of subsidies are:
Table 6: Maximum Subsidies for Used Oil in Spain in2008
USED OIL
Euro Cents per litre
A$ cents Equivalent
Transport & collection 2.68 5.5
Re-refining 9.00 18.0
Treatment to produce a burner fuel or bituminous product
2.40 4.8
The SIGAUS management board is expected to achieve targets for diverting a proportion of the collected used oil to re‐refining. These annual targets
14 RealDecreto 679/2006 “por el que se regula la gestion de los aceites industrials usados”

© Oakdene Hollins Ltd February 2009
For The Waste Authority Page 38
are 55% in 2007 and 65% in 2008, with a review in 2009 with the aim of identifying the opportunity to increase the target further. In practice many collectors pass on their right to claim a subsidy to the reprocessor of oil, whether for burner fuel or re‐refining as base oil. Although the system encourages competition between collectors, the market power of the re‐refining plant operators is leading to an increasing market share for integrated collection and re‐refining companies. 214,000 tonnes of used oil are reported as being collected, of which 120,000 tonnes are re‐refined. We are not confident that this information is accurate as we are aware that Portugal exports approximately 30,000 tonnes of used oil into Spain, of which 10,000 tonnes are directed to re‐refining. The current re‐refining capacity in Spain is not more than 95,000 tonnes although new capacity is being planned in the Rioja region.
Table 7: Re-Refining Throughput by Plant, 2008
Plant Tonnes
CATOR 32,000
ECO LUBE 27,000
AURECAN 18,000
AUREMUA 18,000
TOTAL 95,000 Notable differences between this system and those managed in Denmark and Finland are: • Subsidy payments are made for all used oil feedstock, thereby
encouraging collection of oil regardless of its origin. The higher subsidy for re‐refining seeks to make it competitive with burner fuel markets thereby encouraging collectors to keep separate those oils suitable for re‐refining. In 2008, collectors were being paid up to 16 Euro cents per litre (A$0.32) on the gate by re‐refineries in Spain.
• During 2008, most oils are reported as being collected free of charge in
Spain except for Marpol (marine) wastes and heavily contaminated industrial oils.
• The subsidy for re‐refining has encouraged proposed new investment
in the sector albeit during a period of exceptionally high oil prices.
• The levy on lubricants raises approximately €26 million (A$52 million). We estimate that SIGAUS performs at broadly the same level as

© Oakdene Hollins Ltd February 2009
For The Waste Authority Page 39
Finland in paying 12 Euro cents (A$0.24) for every litre of collected used oil, with a similar proportion directed to re‐refining.
3.5 Summary Case Study Metrics
Comparing the outcome measures from the three detailed case study jurisdictions (Table 8) raises questions over the definitions of terms, and the data associated with those definitions. In Alberta, re‐refining includes use of the collected oil as a drilling lubricant, which requires very little treatment to meet the necessary specification. In all three, different methods are used to estimate the proportion of sold lubricants that are collectable. In Alberta this is especially important given the significantly higher level of lubricant sales. Denmark and Finland have introduced complex ADF (Advanced Disposal Fee) systems to target only those oils suitable for re‐refining. Other used oils are subject to high collection prices with the risk that this provides an incentive for inappropriate disposal. When challenged, the authorities in both countries did not consider this risk of environmental damage to be a real one ‐ for cultural reasons. At a broad level of comparison, Western Australia appears to be performing well, with comparatively high levels of per capita lubricant sales and a percentage collection level similar to that achieved in Finland and Denmark. By 2009 the main difference will be that WA will direct no oil to re‐refining.

© Oakdene Hollins Ltd February 2009
For The Waste Authority Page 40
Table 8: Summary Metrics from Case Studies 2006/7
Western Australia
Alberta Denmark Finland
System Operator Fed Gov Private-sector
(UOMA)
Private-sector
(Mineral Oil Branch)
Private sector
(Ekovoima)
System Funded by ADF ADF ADF ADF
ADF per litre 5.449 cents 5.0 cents 50 øre 5.75 cents
ADF Total Annual Fund (Million)
27.7 C$15.7 DKK30 Euros 4.5
ADF (A$m equivalent)
A$3.8 WA Only A$18.7 A$7.0 A$9.0
Incentive Paid to Reprocessor Collector Collector Collector
End-use Prioritization Yes,
Re-refining No Yes,
Re-refining Yes,
Re-Refining
Population (millions) 2.1 3.3 5.47 5.5
Lubricating Oil Sold (tonnes) 70,000 165,319 70,000 78,000
Used Oil Collected within ADF System (tonnes)
42,300 87,000 18,300 23,000
Total Used Oil Collected (tonnes)
42,300 87,000 40,000 38,000
Of which: Long Distance Transport (%) > 15% 50%
> 15% Nil from
2009
> 20% Nil from
2009 % to Base Oil for Lubricant1 (estimate for 2009)
0% 16% 60% 60%
Notes: 1. Re-refining to base oil for use as a lubricant

© Oakdene Hollins Ltd February 2009
For The Waste Authority Page 41
4 Base-Line Scenario
This section describes likely outcomes over the period 2008 to 2011 should the State Government make no additional interventions in the market for collection and processing of used oil. In order to frame this base‐line scenario, the following “business as usual” assumptions have been made: • The 2008 PSO review will lead to no significant changes in the current
system of benefit payments to processors of used oil. • The substitution of solid fuels by gas in the grid and off‐grid power
sectors, as well as in energy‐intensive industrial processes, will continue15.
• Demand for lubricants in 2006/7 of 72.6 million litres will grow by
approximately 3.5% in each year to 201116.
• Volatile prices (upwards and downwards) for mineral oil products will continue.
• Research carried out by Wren Oil on the incorporation of ‘bottoms’ into
asphalt uses will result in no new commercial applications by 2011.
• The substitution of long cycle carbon fuels by short cycle carbon fuels to reduce the CO2 emissions from energy‐intensive processes will either begin or, in some cases such as cement production, continue.
Aside from the factors influencing the supply of used oil and demand for burner fuels that may test the stability of the collection infrastructure, the base‐line scenario also investigates the constraints on the joint venture between Wren Oil and Nationwide Oil building a new lube‐to‐lube re‐refining plant.
4.1 Supply of Used Oil
As reported elsewhere17, the quality of data on used oil collection in Australia is poor. Nevertheless, two data sources provide some guidance on supply factors. Lubricant sales (by volume) followed a downward trend
15 Part A study Section 1 16 This is based on the same assumptions used in the federal review of the PSO. However, in
Appendix 1 we have modelled a slightly different growth rate by user sector for WA specifically. 17 MMA (2005 p 14-15) and PwC Discussion Paper on PSO Review Page 34.

© Oakdene Hollins Ltd February 2009
For The Waste Authority Page 42
of 2.3% annually until 2006/07 before rising by 10% in 2006/07. Over a similar period, used oil recycled under the PSO system followed a similar downward trajectory until 2006/07 after which it increased by 15.5% in 2007/08 to 253 million litres (Figure 10). This last figure may have been inflated by the release of previously stored used oil. In Appendix 1 we have modelled the expected changes in collected used oil from WA. We have shown different rates of change from sectors such as mining, automotive, other industry, marine and Local Government. The upward trend is dependent on continued growth in the mining sector.
Fig. 10: Oil Recycled under the PSO Scheme, 2000 to 2008
Source: Chart reproduced from PWC “Second Independent Review of PSO” Discussion Paper 29th
September 2008
4.1.1 Impact of Increased Collection Prices
The introduction of a collection fee of A$0.15 per litre in Western Australia is highly likely to reduce the volumes of used oil collected in future years. In the USA at least, a change in the economics of used oil collection requiring generators of used oil to pay a fee has been associated with reduced volumes of used oil collected and an increase in the number of oil pollution incidents reported to Environment Protection Agencies18. In more recent years, collectors in urban areas in other parts of the world have been able to pay generators for used oil and this appears to have increased the volume of oil collected even as lubricant sales decline19. The exact
18 The best academic evidence for this is in “Midnight Dumping Public Policies and Illegal Disposal of
Used Oil” Hilary Sigman in Rand Journal of Economics Vol 29 (1998). 19 The Alberta case study in Section 3 (above) provides evidence of this.

© Oakdene Hollins Ltd February 2009
For The Waste Authority Page 43
relationship or elasticity between the price of used oil services and the volumes collected in WA is unknown. It is unlikely that evidence from the USA or other jurisdictions could be applied directly to WA nevertheless assuming that there is no relationship between price and the amount of oil collected would not be sound20. Written comments on this report from Gary Watson of Transpacific Industries Pty Ltd state: “there is no evidence to date to suggest that used oil collection volumes in Western Australia have dropped since the introduction of the 15 cent per litre charge.” The comments go on to state that “further substantiation of assumptions regarding the supply elasticity of used oil should be provided or assumptions and conclusions adjusted accordingly.” We have not changed our model in response to this request but acknowledge that we have not been presented with the statistical evidence necessary to show that there is no underlying relationship between price and supply. Written comments on this report from Fred Wren of Wren Oil state: “Since all collections are on the CWTS database, the DEC can reduce the 1.5% risk by reminding generators to ensure they are disposing of their used oil under the regulations…If a reduction is noticed perhaps it would be prudent to make the WA generator accountable.” The comments go on, “Since the collection fee has been in place since September 2007, it should be relatively easy to determine if there is actual evidence of a trend to increased reported oil pollution incidents.” The price increase in WA will not impact on those changing engine oil at home who will still have access to existing Local Government facilities free of charge. The Part A report indicates that there is a low risk that this Local Government infrastructure may be reduced in response to higher collection fees. Equally, it is unlikely that the largest generators in the mining and manufacturing sectors will be affected. More likely, volumes will fall as businesses in a broad range of categories find alternative means of disposing of used oil. They will become self‐managers of their used oil. These may include burning it in heaters and driers, burning in open fires, tipping into public drainage systems, tipping onto already contaminated ground or mixing with solid wastes that are destined for landfill. There is likely to be an irregular and unpredictable geographical distribution of this uncollected oil. In the absence of elasticity data, our best estimate of the impact the collection price increase will have on volumes of collected used oil is a reduction of 1.5% when prices increase from nil to 15 cents for those oils collected from sectors other than local authorities, mining and marine. In these sectors the price change will have no impact. Where prices change by amounts of less than 15 cents we have used a linear relationship to model the impact. This is shown in Appendix 1.
20 Denmark and Finland both claim that there is no such relationship for “cultural reasons”.

© Oakdene Hollins Ltd February 2009
For The Waste Authority Page 44
Table 9: Forecast Changes in Used Oil Supply (Base-line Scenario), million litres 2008 2009 2010 2011
Used Oil Collected1 42.3 43.2 44.2 46.1
Lubricant Sold2 75.1 76.7 78.5 81.8
Litres
Self-Managed Oil Due to Price Increase
349,500 351,405 353,345 355,320
Notes: 1. In September 2008 PwC forecast lubricant sales in Australia to increase 3.5% annually to 2011/12. 2. Strategic Waste Initiative Scheme project 4014 estimated lubricant sales in WA at 66ML in 2005/06. Sales increased dramatically in the following year to circa 72.6ML in 2006/07.
In view of the poor data available for collection and the variation in annual data due to issues such as temporary storage, we doubt that it will be practical to monitor the amount of oil collected with the aim of identifying this change. However, other metrics may be more useful, specifically measuring changes in the number of reported oil pollution incidents.
4.2 Demand for Burner Fuels
94% of the 253 million litres of used oil collected in Australia and recycled under the PSO programme was directed to burner fuel uses. 6% was directed to re‐refined lubricant uses including associated uses as hydraulic and transformer oils (Figure11). The Part A study establishes that demand for burner fuels during 2007/08 was sufficient with prices in excess of A$0.50 per litre being paid by industrial consumers. However, the concentration of demand around a few large users raises the risk of a repetition of the crisis during 2005/06 when the storage capacity for used oil of 20 million litres was exceeded. In almost all jurisdictions the potential demand from the burner market greatly exceeds the potential supply from used oil derived sources. In Australia as a whole, analysis of the potential demand for burner fuels confirms a similar pattern (Figure 12). However, during our stakeholder interviews in November 2008 we noted that potential users of burner fuels in the energy‐intensive industries were considerably more reluctant to use burner fuels derived from used oil than in similar processes in Europe21.
21 Fred Wren of Wren Oil met with us on November 6th and detailed the difficulty in selling burner fuels to the asphalt and aluminium sectors.

© Oakdene Hollins Ltd February 2009
For The Waste Authority Page 45
Fig. 11: Flow Chart for Recycling Used Oil in Australia
Source: Chart reproduced from PWC “Second Independent Review of PSO” Discussion Paper 29th
September 2008
Fig. 12: Projected Demand for Burner Fuels, to 2015
Source: Chart reproduced from PWC “Second Independent Review of PSO” Discussion Paper 29th
September 2008

© Oakdene Hollins Ltd February 2009
For The Waste Authority Page 46
For the purposes of the base‐line scenario we have been guided by the Part A report to assume that burner fuel markets will continue to offer the used oil collection companies stable demand at a discount to fuel oil prices. However, we have noted that the risk profile of this market, described in the Part A report, is such that risk mitigation measures are advisable. Demand for used oil derived fuels is dependent on a modest number of large users in the power sector and industrial intensive energy users (Adelaide Brighton’s lime kiln, Kundara Gold) supported by a single long distance user (CIP) on Christmas Island. The risk associated with this demand profile has been demonstrated in 2006/7. There is at least a 15% risk in the current year of one or more of these users reducing their demand, a risk that is likely to increase as the trends toward higher operating standards and switch to other fuels continues. Recently, this estimate of risk was demonstrated when the smelter used by Nationwide at Kalgoorlie closed for a four‐month period of maintenance. Approximately 4 million litres of oil were directed to markets via Singapore and not to alternative mainland markets. Further evidence is provided by the closure in December 2008 of the Austral Brick works at Waterloo. This demonstrates the lack of depth in mainland markets and their sensitivity to changes in demand for burner fuels. In Appendix 1 we have modelled the profile of expected demand from mainland (in‐state) users of burner fuels, and expect it to fall in stepped three year intervals. The market for burner fuels outside mainland WA is much larger and for this reason we have shown it as absorbing the remaining amount of burner fuel.
Table 10: Forecast Changes in Demand for Used Oil Derived Burner Fuels (Base-line Scenario) – million litres
2007/08 2008/09 2009/10 2010/11
Used Oil Collected 42.3 43.2 44.2 46.1
Mainland Burner Fuels Demand 1
16.9 14.7 15.0 15.7
Non-Mainland Burner Fuels Demand 16.9 19.9 21.3 22.2
Notes: 1. When used oil is used as a fuel to process used oil (process heat) it is not included in demand for burner fuels.
Written comments on this report from Fred Wren of Wren Oil state: “CCL Dongara has been requesting a 7‐8ML supply but current export prices have been
© Oakdene Hollins Ltd February 2009
For The Waste Authority Page 47
better than their offered price. They can be tapped as a potential future user of VTB as fuel if not used as a bitumen additive.”
4.2.1 Regulatory Control Over Burner Fuel Market
As noted in Section 4.2 the potential market for burner fuels is much larger than the actual market. Potential buyers in WA appear wary of waste derived fuels even though the regulatory controls would permit their use. Suppliers have responded to this reticence by seeking to create a framework of quality standards. Recent work conducted by AORA22 (Australian Oil Recyclers Association) partly mirrors similar efforts in the UK aimed at establishing credible quality standards for fuels derived from used oils. The UK based work follows a High Court decision there in 2006 23. In our opinion, it is likely that the attempt by industry suppliers to establish such protocols will be challenged by other European States, since the Waste Framework Directive makes clear that the re‐refining of used oil should be given preference over burner fuels. Their concern is likely to be based on chlorine levels in used oil and the impact this could have in dioxin emissions when used outside of high‐temperature (>800O Centigrade) burning plants. The preference for re‐refining is based on LCA (life cycle assessment) evidence24. Of more concern is the risk profile of shipments of used oil to the Singapore market for onward sale to buyers elsewhere. In the Appendix we have modelled the increasing reliance on shipping used oils out‐of‐state. This trade is permitted by Federal Authorities as being a specified product outside the provisions of the Basle Convention. For purposes of presentation we have used this reliance on exporting oil outside the terms of the Basle Convention as a proxy for the risk of disruption to the collection infrastructure. In other words, as the reliance on exporting used oil increases so the risk of disruption rises in tandem.
4.2.2 Case Study Evidence
The case study evidence from Alberta shows that reliance on export markets was necessary to reduce the risk of disruption to collection infrastructure. However, there was no need to rely on “specified product” definitions. In Denmark, access to the burner fuel market was greatly restricted by raising emission standards. Exports were important whilst a new re‐
22 “Burner Oils – Proposed Standards” June 2008 I D Rae/W R Jackson 23 OSS versus Environment Agency case CO/243L/2006 and subsequent (successful) appeal. 24 “Ecological and Energetic assessment of re-refining used oils to base oils..” IFEU for GEIR 2005

© Oakdene Hollins Ltd February 2009
For The Waste Authority Page 48
refining plant was being built; again there was no requirement to rely on “specified product” definitions. In Finland, exports of used oil have not been necessary even in the past year as a new re‐refining plant is being built. This is only because of the extent of state control over the collection and treatment of used oil, something not available to the State Government in WA. WA has depended on a similar out‐of‐state trade in the past and continues to do so.
4.3 Drivers for Competitive Change
The Part A report describes a market structure in which the two leading competitors have agreed to set a common default price of 15 to 27 cents per litre for the collection of used oil25. Furthermore, the report notes that both competitors have agreed to cooperate in the development of one or more capital‐intensive projects; firstly new storage infrastructure at Bunbury Port and secondly the commissioning of a re‐refining plant at the Romine Holdings Pty Ltd26 site at Picton.
4.3.1 Increased Collection Prices
The proposed joint venture company (JV) between Wren and Nationwide is similar to the commercial arrangements in Scandinavian countries, specifically Denmark and Finland. In those jurisdictions, the State Government has awarded quasi monopoly rights to oil collection companies in order to achieve the EU level requirement to give priority to the re‐refining of used oils. The main difference with WA being that the State Governments in Scandinavian countries have established formal contract terms in which certain services are expected in return for the quasi monopoly rights. The JV appears to be offering an implicit contract to suspend competition in order to aggregate assets and accumulate financial resources and then jointly build a new re‐refining plant at an unspecified date. Oil collectors have explained that storage and sea freight costs have increased due to the dislocation in the market caused by the closure of Loongana Lime and exporting infrastructure at Kwinana27. The Part A study calculated the annual addition sales income from the price changes as A$6.3 million.
25 Price information is rarely this transparent since used oil is often collected with other hazardous
wastes such as oil filters, brake fluids, anti freeze, rags and containers. 26 Trading as Wren Oil 27 AORA letter dated 13th February 2007

© Oakdene Hollins Ltd February 2009
For The Waste Authority Page 49
Prices have been increased immediately and collection rounds rationalised to reduce costs. Environmental damage, albeit an uncertain amount of environmental damage, will be caused by this price signal. The following policy questions arise: • If the State Government encourages a new competitor to enter the
market will this serve to undermine the rationale for the JV thereby causing it to break up ‐ and with it the prospects for a local re‐refining plant?
• If the State Government chooses not to encourage a new competitor,
can it set terms to accelerate the necessary investment in local re‐refining?
Written comments on this report from Fred Wren of Wren Oil state: “Wren and Nationwide Oil have remained competitors and have not rationalised rounds to reduce costs.” We have not adjusted our model to take account of this statement. However it is important to note that the implied costs savings from the joint venture will be lower than modelled if no rationalisation has yet taken place. We would argue that it is likely to do so at some point, and the savings we have modelled are conservative. The comments go on to point out that: “The harsh WA operating conditions cannot be compared to the short hauls in Europe where smaller trucks rarely leave sealed roads: or, even compared to Alberta, Canada. For example, a road train combination has 52 single use tyres due to casings being ruined by stone damage.”
4.3.2 Capital Investment in Re-Refining
The immediate outcome from the decision to co‐operate should be an increase in the profitability of both companies. This provides an incentive to preserve the benefits from cooperation from the joint venture and not necessarily to make ambitious investment decisions. On the other hand, the barriers to market entry will be increased once the JV invests in the only lube‐to‐lube re‐refining plant that will ever be built in the State. During November 2008 we interviewed Gary Watson, General Manager Strategic Developments at Transpacific Industries, as well as Fred Wren, Managing Director of Wren Oil. We concluded from these interviews that both parties to the joint venture assert an intention to build a re‐refinery but that no project management

© Oakdene Hollins Ltd February 2009
For The Waste Authority Page 50
plan exists. Transpacific wish to engage with South African based FFS to build a plant whereas Wren Oil has alternative technology suppliers. The Part A report identifies that the JV considers the necessary investment to be in the region of A$20 million. In our opinion this is an underestimate of the investment necessary to achieve the base oil output standards required to receive the 50 cent per litre benefit payable under the current PSO. Nevertheless, both Transpacific Industries and Wren Oil assert that A$20 million is more than sufficient. Written comments on this report from Fred Wren of Wren Oil state: “To substantiate our claims, I have in my possession two separate proposals to build a 50ML Oil Recovery System as well as a 40ML hydro treater costing under US$10 million or approximately A$15 million.” In order to provide a reasonable base‐line estimate of the potential returns from re‐refining we obtained up‐to‐date costings for a new re‐refining plant scaled at 30,000 tonnes feedstock from Sener, based in Madrid. Sener designed, built and for a time operated the Ecolube re‐refining plant near Madrid. These costings (excluding land purchase costs) are shown in Section 5. The capital cost of the plant was equivalent to a 2008 value of approximately A$30 million. In the current market for base oils, even relatively dark colour products are finding markets at prices in excess of A$1,200 per tonne. If prices fall as supply from standard refineries improves, re‐refineries producing the poorest quality base oils will be at most risk. European re‐refineries have largely sought to avoid this risk by building plants at higher cost to produce products that are comparable to, and in some cases better than, those available from standard refineries28. The balance between these pressures to invest in re‐refining and not to do so will be determined by the individuals involved, their shareholders and bankers and their respective appetites for risk. In our view, the immediate and risk‐free above‐average rents earned from the JV arrangements will tip the balance of probability toward delaying investment in a lube‐to‐lube re‐refining plant for as long as possible. The recent turmoil in prices and exchange rates will add significantly to the required rate of return for an investment in re‐refining. Written comments on this report from Gary Watson of Transpacific Industries Pty Ltd state the JV “has in no way been influenced by any commercial motivation to delay the investment by the parties.” The statement continues: “The valuation task has been protracted and this is the reason why construction has not yet commenced on the re‐refining facility.”
28 Examples include the recently upgraded Dolbergen plant in Germany, Puralube plants in Germany
and the Viscolube plant in Milan and Poland.

© Oakdene Hollins Ltd February 2009
For The Waste Authority Page 51
The base‐line scenario acknowledges this balance of probability i.e. that the JV will continue to collect oil to supply the burner fuel markets on mainland WA and non‐mainland markets. Consequently there are implications for the policy stance of the State Government. These are: • Should new competition be encouraged? For example by awarding
Local Government collection contracts to a market entrant. • Should measures be taken to establish formal conditions on the JV
arrangement? For example by setting milestones for progress in building a new lube‐to‐lube plant coordinated with new controls over the burner fuel market. Alternatively, setting milestones for progress in building new storage and export facilities.
• In view of the risks of further disruption to the local burner fuel market
what risk mitigation procedures can be put in place? For example, ensuring that sufficient storage capacity is available. Requiring oil processors to provide financial instruments allowing regulators access to funds when abandoned hazardous wastes such as tank bottoms need to be managed.
4.3.3 Capital Investment in Storage
In November 2008 we met with David Lantry of the Bunbury Port Authority. Wren Oil is proposing to construct three storage tanks in an area adjacent to Berth 8. The proposal includes a pipeline to supply the berth. Each tank is likely to cost A$750,000 and will hold 4 million litres of used oil. Wave Technology has been engaged as consultants to support this proposal and whilst there are clearly several issues to be resolved, the proposal appears to be progressing. The overall investment in the storage facility is claimed by Wren Oil to be A$4 million to A$5 million including a double skinned pipeline to Berth 8, should this be built. The Port Authority has some doubts over the need for the pipeline and its implied inflexibility should Berth 8 be occupied by vessels serving other users at the port. The storage tanks will provide up to 12 million litres of capacity or approximately 3.4 months of collection. Once built, the storage tanks will service non‐mainland markets and will replace existing storage tanks at Fremantle that are currently being rented. For this reason, tank storage capacity has not been used to adjust our estimate of the risk of disruption in our base‐line scenario. However, should the Fremantle storage tanks close without the new tanks being in place there could be a significant increase in risk should alternative storage tanks not be available elsewhere. It is not feasible to deliver used oil by road tankers to off‐load onto a vessel in berth at port, either in Fremantle or Bunbury.
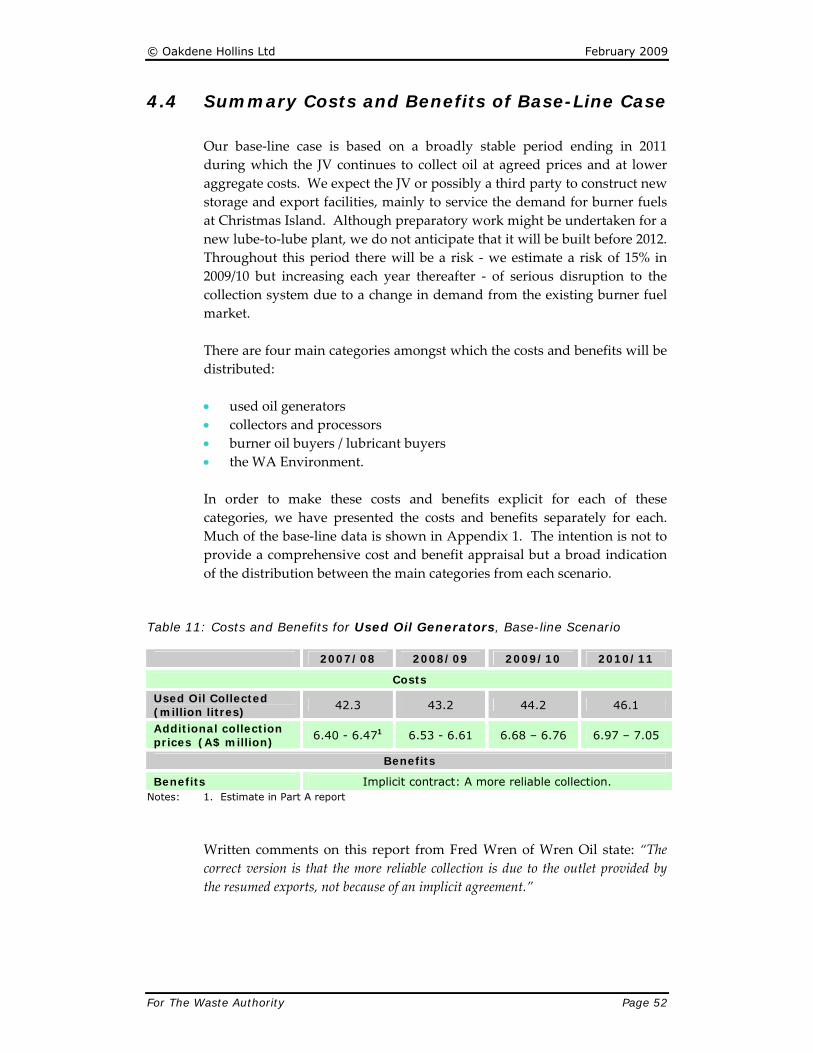
© Oakdene Hollins Ltd February 2009
For The Waste Authority Page 52
4.4 Summary Costs and Benefits of Base-Line Case
Our base‐line case is based on a broadly stable period ending in 2011 during which the JV continues to collect oil at agreed prices and at lower aggregate costs. We expect the JV or possibly a third party to construct new storage and export facilities, mainly to service the demand for burner fuels at Christmas Island. Although preparatory work might be undertaken for a new lube‐to‐lube plant, we do not anticipate that it will be built before 2012. Throughout this period there will be a risk ‐ we estimate a risk of 15% in 2009/10 but increasing each year thereafter ‐ of serious disruption to the collection system due to a change in demand from the existing burner fuel market. There are four main categories amongst which the costs and benefits will be distributed: • used oil generators • collectors and processors • burner oil buyers / lubricant buyers • the WA Environment. In order to make these costs and benefits explicit for each of these categories, we have presented the costs and benefits separately for each. Much of the base‐line data is shown in Appendix 1. The intention is not to provide a comprehensive cost and benefit appraisal but a broad indication of the distribution between the main categories from each scenario.
Table 11: Costs and Benefits for Used Oil Generators, Base-line Scenario 2007/08 2008/09 2009/10 2010/11
Costs
Used Oil Collected (million litres)
42.3 43.2 44.2 46.1
Additional collection prices (A$ million)
6.40 - 6.471 6.53 - 6.61 6.68 – 6.76 6.97 – 7.05
Benefits
Benefits Implicit contract: A more reliable collection. Notes: 1. Estimate in Part A report
Written comments on this report from Fred Wren of Wren Oil state: “The correct version is that the more reliable collection is due to the outlet provided by the resumed exports, not because of an implicit agreement.”

© Oakdene Hollins Ltd February 2009
For The Waste Authority Page 53
Table 12: Costs and Benefits for Used Oil Collectors and Processors (JV only), Base-line Scenario, A$m
2007/08 2008/09 2009/10 2010/11
Costs (A$ million)
Capex: storage/export facilities 0.2 1.8 0.3
Capex: Preparatory work on lube-to-lube plant
0.1 0.15 0.2 0.2
Benefits (A$ million)
Additional benefits from collection price increases
6.40 - 6.47 6.53 - 6.61 6.68 – 6.76 6.97 – 7.05
Additional benefits from collection round rationalisation1
0.1 0.15 0.15 0.2
Notes: 1. Wren Oil point out in written comments on this report that such rationalisation has yet to occur (February 2009). Further, Wren Oil would like to see this modelled with higher costs and a re-refinery completed in 2012 at a cost of AU$15 million.
Table 13: Costs and Benefits for Burner Fuel Buyers, Base-line Scenario, A$m 2007/08 2008/09 2009/10 2010/11
Costs Nil nil nil Nil
Benefits A$ million
Benefits from Reduced Fuel Costs1
5.07 5.19 5.5 5.7
Notes: 1. Based on a 20% discount to the Singapore Residual Fuel Oil Price. Although this is variable price we have assumed this to be worth a conservative average of 15 cents per litre. Wren Oil has commented that larger discounts are available.
Table 14: Costs and Benefits for the WA Environment, Base-line Scenario, litres 2007/08 2008/09 2009/10 2010/11
Costs (Litres)
Costs: Uncollected used oil (self-managed)
349,500 351,405 353,345 355,320
Costs Emissions from the burning of oils as fuels. Specifically metals such as lead, copper and chromium as well as
halogenated compounds and possibly PCB.
Benefits
None

© Oakdene Hollins Ltd February 2009
For The Waste Authority Page 54
5 Local Lube-to-Lube Re-Refining Scenario
5.1 Background
Our base‐line case assumes that the JV will delay investment in a lube‐to‐lube re‐refining plant. Whether or not this delay occurs is marginal and in our view largely dependent on the appetite for risk amongst the parties to the JV and that of their bankers and investors. The recent turmoil in markets (Figure 13) will have reshaped the explicit and implicit risk models used by these parties. Any such changes will not have improved the probability of investment sooner rather than later since oil prices have moved sharply downwards.
Fig. 13: The Recent State of the Crude Oil Market
The PSO programme provides large scale and relatively stable financial support for lube‐to‐lube plants. However, the State Government has the option of supplementing this financial support with a mixture of measures designed to accelerate the investment decision. In particular, it can act to

© Oakdene Hollins Ltd February 2009
For The Waste Authority Page 55
remove the advantages conferred through support for the JV arrangement if progress milestones are not achieved. Similar issues were faced by the Danish and Finnish State Governments, detailed in the case studies. In both cases it was pressure to conform to the EU regulatory requirement to favour re‐refining that informed their policy response. There was no equivalent to the financial support from the Federal PSO programme. Both achieved their policy goals in 2008/09 albeit with extensive intervention in the market for collection and processing. The proposed small scale and low technology re‐refining plant in WA would be less efficient than larger plants but is not without precedents elsewhere. Of the 42.3 million litres reported as being collected in 2007, not more than approximately 70% (30 million litres) will be suitable feedstock for re‐refining29. The Sener‐designed Ecolube plant near Madrid in Spain (30,000 tonnes) and the Whelan Refining plant in Stoke‐on‐Trent, England (35,000 tonnes) are comparable plants, similar in capital investment levels and scale30. Both operate successfully and supply base oils and fuels but have the advantage of being able to import oil feedstock from a much larger market than that available in WA. In order to accelerate the investment in a local re‐refining plant the State Government can consider a number of policy options.
5.2 Optional Additional Policy Measures
In Denmark and Finland, a lead investor was given support by the State Government with the aim of reducing risk and thereby the cost of capital. In WA, one risk to investors in a lube‐to‐lube plant is that a proportion of collected oil will be directed to burner fuel markets by competitors. Previously, both competitors co‐operating through the JV had the potential to undermine any lube‐to‐lube investment by the other. The approach in Denmark and Finland was to restrict the burner fuel market through fiscal interventions as well as new emission regulations. This made it difficult for new entrants to start collecting oil with the aim of directing oil to burner fuels, an activity that would remain profitable alongside any new lube‐to‐lube plant since it requires very low capital investment.
29 Re-refining plants aim to receive automotive engine oils but can handle a much broader range of
oils if the pre-treatment systems are capable of doing so. The high proportion of mining derived oils may allow the percentage to be higher in WA.
30 Both are based on solvent extraction technologies and adapted from the InterLine process.

© Oakdene Hollins Ltd February 2009
For The Waste Authority Page 56
5.2.1 Restricting the Burner Fuel Market
The gate fee paid for used oil at a new lube‐to‐lube plant opening in 2008, taking account of the PSO benefit, is likely to be in the range 30 to 40 cents per litre31. The notional gate fee for a comparable used oil processing plant that provides rudimentary treatment to meet the specification for most (but not all) burner fuels is likely to be less than this, probably in the range 15 to 20 cents per litre. The output from this type of plant is likely to qualify for a Category 6 PSO benefit or possibly a Category 5 benefit. However, the lube‐to‐lube plant will be in one fixed location, the burner fuel processors could be widely distributed and operate closer to both collection markets and end‐users of burner fuels. Such operations will be profitable at the same time as the lube‐to‐lube plant is operating. Potential market entrants will view the prices available in the WA market as attractive. There will be a persistent risk of new entrants seeking to enter this market with the aim of supplying the burner fuel market. It will be helpful to the investors in the lube‐to‐lube plant to know that proposals to constrain this market are being developed. These are likely to take the form of emission abatement equipment being required for plants that accept waste oil derived fuels and amendments to threshold levels at which such equipment is necessary. Alternatively, placing further controls on the specification of burner fuels, specifically the chlorine and ash content, will send a further signal that this market will not be developed further.
Option 1 Establish a timetable for the introduction of new atmospheric pollution abatement controls for plants that accept waste derived fuels.
5.2.2 Create Explicit Performance Terms for the JV
There is a risk that disruption in demand from the burner fuel market will cause a repetition of the collection crisis. We have estimated this risk to be 15% in the first year and rising thereafter, reflecting the trends toward switching from solid fuels to gas and toward fuels derived from short cycle carbon sources. There is a separate risk that the JV will fail to collect oil from the most remote generators or that the price structure is arranged to provide clearer incentives for some generators to seek alternatives to having their oil collected.
31 This is our own estimate. We have benchmarked it against Australian operators. In a personal
communication 18th October 2008 we were told that 30 to 35 c/l would be reasonable for large re-refineries and 28-30 c/l for smaller ones.

© Oakdene Hollins Ltd February 2009
For The Waste Authority Page 57
In both Denmark and Finland it was possible for the State Government to manage the distribution of funds from the levy on lubricants. This provided them with sufficient power to establish the terms on which they wanted waste oil collectors to operate. This option is not available to the WA State Government. In both Denmark and Finland collection charges for the cleanest oil is set at nil and incentives are paid for this oil to be directed to re‐refining. In WA, where an additional levy on lubricants is not proposed, the State has encouraged higher collection charges for all oils but has yet to establish what controls and conditions there will be on the recipients of this additional income. It should be possible to imitate the objectives of the Danish and Finnish systems by making explicit the key metrics that will be used to measure progress toward the construction of a lube‐to‐lube re‐refining plant, and to establish the consequences of failing to achieve these milestones. These could take the form of: • Agreeing a series of milestones related to the project development of
the lube‐to‐lube plant for the period 2008 to 2010. These are likely to be associated with financial commitments such as: planning application, submission under Part IV of the Environmental Protection Act, utility upgrades (gas supply for example, or sewage water discharge) land transactions, appointment of consultants and project managers, project financing, contracts for equipment supply and building contracts.
• Identifying a sample of 25 remote and marginal generators of used oil,
then inviting them to signal if they are satisfied with the collection service.
• Requiring the JV to provide a quarterly statement of the quantity of
used oil held in storage. In Denmark and Finland the State Government has the power to remove a significant financial incentive from non‐performing oil collection businesses. Every five years a formal commercial contract is renewed allowing a review of performance. Such powers are not available in WA but there are multiple opportunities to exercise softer power to support or otherwise delay the investment plans of the JV. The simplest way of adding leverage to the soft power would be to offer a grant toward some aspect of the re‐refining plant, conditional on commissioning before 2011. Written comments on this report from Gary Watson of Transpacific Industries Pty Ltd state: “The JV parties would welcome further discussion of an arrangement linking the offer of a Government grant towards the re‐refining project to the completion of milestones on the project.”

© Oakdene Hollins Ltd February 2009
For The Waste Authority Page 58
Option 2 Monitor the progress of the JV toward delivering a new lube-to-lube
plant. Option 3 Offer a grant toward the cost of a re-refining plant/tank storage
capacity conditional on commissioning before 2011.
5.2.3 Risk Mitigation Measures
Even with progress toward a new lube‐to‐lube plant there is a continuing and growing risk of disruption caused by events in the burner fuel markets, in particular the narrow market demand for the heavy bottoms fraction from used oil processing. This thick, non‐pumpable bottoms waste builds up in storage tanks and represents a steadily accumulating liability for almost all used oil collection businesses. In the Appendices we have modelled the risk profile of the three scenarios. For the local lube‐to‐lube re‐refining scenario, it is the fate of bottoms that constitutes the largest source of on‐going risk. We are assuming that local markets will be restricted to cement kilns and hazardous waste incineration plants (ToxFree) and that at least 50% of this material will need to be blended with other used oils and sent to non‐mainland markets. As there will be approximately 5,000 tonnes of bottoms each year, this is not an insignificant issue and is largely an issue unique to WA. In view of the disruption events in 2006/07, there are some options that the State Government may wish to consider in order to reduce the potential risks to the environment. Monitoring / Amending License Conditions for Used Oil Processors In all hazardous waste businesses the economics of collection and processing are such that the company is paid to collect the waste but then incurs significant costs to process it and dispose of the residues. This encourages stock‐piling of the waste. Operators can choose to exit the sector by stock‐piling large amounts of hazardous waste and then abandon the site, taking the cash received from the collection services with them. In many jurisdictions this risk is mitigated by monitoring the financial performance of operators, measuring the number of prosecutions or licence infringements, benchmarking the site operation on an annual basis or requiring the operator to provide a financial instrument that, when triggered, provides the regulator with a sum of money to clean up the site. All or any of these mechanisms could be used to reduce the risk of further disruption. Requiring an operator to provide a financial bond or guarantee

© Oakdene Hollins Ltd February 2009
For The Waste Authority Page 59
will inevitably distort competition by favouring larger organisations. Investigating the feasibility of implementing such measures may also signal the intention to increase the barriers to entrants in this market.
Option 4 Investigate the introduction of more onerous license conditions for used oil operators.
Supporting Research and Development on Asphalt Uses Wren Oil has won a grant of A$400,000 to investigate the markets for using bottoms as an asphalt improver. Following a series of delays the project is shortly (December 2008) to get underway. A successful outcome for this project would significantly reduce the risk profile associated with a lube‐to‐lube plant in WA. During our interviews with stakeholders in November 2008 there was strong support for the project, but most interviewees reported that they doubted the quality standards for asphalt in the transport department could be changed to incorporate used oil bottoms. In practice, whilst roads use will be important, there are other products such as roofing that could be investigated. In all cases, the State Government could assist the project. The Waste Authority might wish to ask for this issue to be given a higher priority in the Transport Department, learning from experience in other jurisdictions that have allowed bottoms into asphalt products.
Option 5 Request that the relevant state Government Departments including Transport Department give priority to investigating the viability of using bottoms in asphalt products.
Recognising the public interest issues in the Joint Venture Arrangements During consultation, Peter Fitzpatrick, Chief Executive Officer of the MTA (Motor Trade Association) suggested that it would be in the interest of the joint venture parties to prepare a note for the ACCC to have the public interest in the objectives of the joint venture acknowledged under the terms of the Trade Practices Act. Such authorisations are commonplace in the motor trades when finance deals arranged by manufacturers are offered to purchasers through automotive dealers. The car buyer has no option but to use the specified finance company thereby restricting consumer choice. Normally such authorisations are given by the ACCC if it is clear that the car buyer has the option of refusing the offer i.e. it is not a condition of sale.
Option 6 Write formally to the JV partners recommending that that they seek authorisation from the ACCC for the public interest issues arising from the achievement of the JV objective, offering to provide information.

© Oakdene Hollins Ltd February 2009
For The Waste Authority Page 60
Written comments on this study from Gary Watson of Transpacific Industries Pty Ltd state: “It is a requirement under Australian Corporations Law that public companies obtain ACCC consent to transactions such as the proposed JV. It is therefore not necessary for the Waste Authority to write formally to the JV partners in relation to this matter.”
5.3 Summary Costs and Benefits from Local Re-refining
The scenario has been modelled in Appendix 2. It shows that: • The overall risk of disruption will fall significantly once a plant is
commissioned. The range of risk will be lowered further if a market for bottoms is identified other than blending at least 50% of it for sale to non‐mainland markets as burner fuel.
• Collection prices for generators of crankcase oils (in the automotive sector) will fall by approximately 50%.
• Burner fuel users will lose the benefit of an average 15 cent per litre they currently receive from using fuels that are cheaper than the alternatives. On the other hand, manufacturers of lubricants will benefit from a small but new supply of base oils sold at a discount to the market price for Group I base oils. It is reasonable to assume that the value of the discount will be 15% or approximately A$210 per tonne32 (21 cents per litre) at October 2008 prices.
• The oil collection and processing sector will grow significantly, with product sales from the one new plant probably exceeding A$25 million annually. To put this in context, collection turnover in WA is probably not more than A$6 million in the current year with a further A$19 million in fuel sales.
• The environmental impacts deserve close scrutiny but are likely to include a reduction in the environmental loading of metals and dioxins from low‐temperature combustion, although the extent of this benefit will depend largely on the fate of the bottoms from the re‐refining plant33. Road transport miles will increase as used oils travel further to reach the single re‐refining plant.
32 Group I prices for base oils quoted in Singapore (ISIS LOR) are A$1,400 in October 2008 but likely
to fall sharply by the end of 2008. 15% represents A$210. Most European re-refineries have not been taking a discount since their output quality has improved (Puralube, Dolbergen and Ecolube). The proposed WA plant will not achieve this quality.
33 LCA (Life Cycle Assessment) evidence in this arena suggests that re-refining offers an overall beneficial, if modest, impact on the environment.

© Oakdene Hollins Ltd February 2009
For The Waste Authority Page 61
In the absence of data for the proposed plant we have modelled the scenario using data supplied by Sener Grupo de Ingenieria SA. It is based on their Ecolube plant, 30 km west of Madrid at Fuenlabrada. The technology used is extraction using propane, followed by atmospheric and vacuum distillation. This technique was introduced during the 1980s by Interline Inc but was found to be unreliable. A number of operators have since improved the original concept to manufacture base oils and fuels without a final catalytic hydro‐treating process. This allows the plant to operate efficiently at a scale of 30 million litres feedstock capacity instead of a minimum efficient scale of 60 million litres to 70 million litres. The actual performance of the Fuenlabrada plant has been better than reported in the table below, but we have made downward adjustments for the uncertainties in WA feedstock quality. The Part A report states that an investment of A$20 million is planned by the JV, and we have used this figure. We are familiar with at least one plant that manufactures group I base oil with a used oil feedstock of 35 million litres that has capital investment of approximately this level. However, a new solvent extraction plant, excluding land costs would cost in the region of A$30 million. The summary data are taken largely from Appendix 2.
Table 15: Estimates for a New Re-Refining Plant Opening in 2010/11, Local Re-Refining Scenario
2007/08 2008/09 2009/10 2010/11
Capex (A$million)1 0.4 5.6 12.0 2.0
Payment at gate for used oil (cents per litre)
0.30 0.30
Feedstock (million litres) 20.0 30.0
Outputs (million litres)
Grp I Base Oil (65%) 13.0 19.5
Spindle Oils (4%) 0.8 1.2
Light Ends (6%) 1.2 1.8
Bottoms2 3.6 5.5
Water & Losses 1.4 2.0 Notes: 1. Estimate from JV in Part A report of A$20 million.
2. There is a very narrow market in WA for bottoms. Unless this can be widened by, for example, using it in asphalt products there is a risk of this residue building up much as happened in 2005/06.
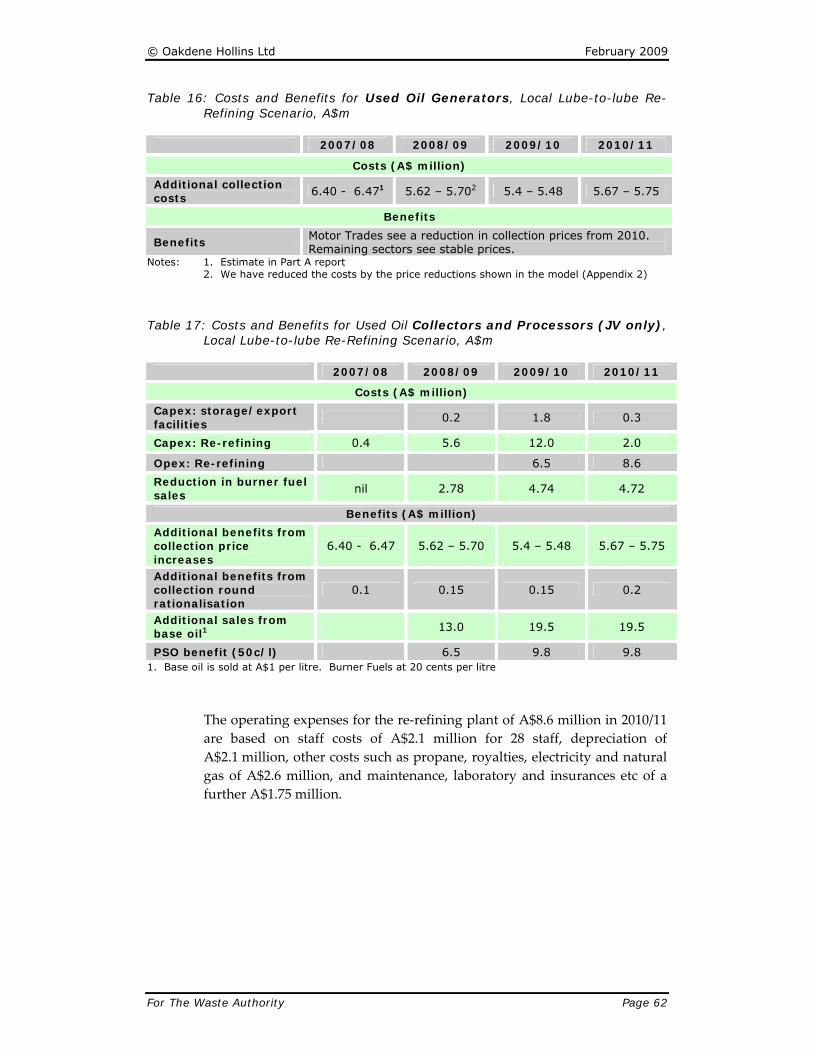
© Oakdene Hollins Ltd February 2009
For The Waste Authority Page 62
Table 16: Costs and Benefits for Used Oil Generators, Local Lube-to-lube Re-Refining Scenario, A$m
2007/08 2008/09 2009/10 2010/11
Costs (A$ million)
Additional collection costs
6.40 - 6.471 5.62 – 5.702 5.4 – 5.48 5.67 – 5.75
Benefits
Benefits Motor Trades see a reduction in collection prices from 2010. Remaining sectors see stable prices.
Notes: 1. Estimate in Part A report 2. We have reduced the costs by the price reductions shown in the model (Appendix 2)
Table 17: Costs and Benefits for Used Oil Collectors and Processors (JV only), Local Lube-to-lube Re-Refining Scenario, A$m
2007/08 2008/09 2009/10 2010/11
Costs (A$ million)
Capex: storage/export facilities 0.2 1.8 0.3
Capex: Re-refining 0.4 5.6 12.0 2.0
Opex: Re-refining 6.5 8.6
Reduction in burner fuel sales nil 2.78 4.74 4.72
Benefits (A$ million)
Additional benefits from collection price increases
6.40 - 6.47 5.62 – 5.70 5.4 – 5.48 5.67 – 5.75
Additional benefits from collection round rationalisation
0.1 0.15 0.15 0.2
Additional sales from base oil1 13.0 19.5 19.5
PSO benefit (50c/l) 6.5 9.8 9.8 1. Base oil is sold at A$1 per litre. Burner Fuels at 20 cents per litre
The operating expenses for the re‐refining plant of A$8.6 million in 2010/11 are based on staff costs of A$2.1 million for 28 staff, depreciation of A$2.1 million, other costs such as propane, royalties, electricity and natural gas of A$2.6 million, and maintenance, laboratory and insurances etc of a further A$1.75 million.

© Oakdene Hollins Ltd February 2009
For The Waste Authority Page 63
Table 18: Costs and Benefits for Burner Fuel Buyers & Lubricant Buyers, Local Lube-to-lube Re-Refining Scenario, A$m
2007/08 2008/09 2009/10 2010/11
Costs (A$ million) Loss of benefits from Reduced Burner Fuel Costs
nil 2.09 3.56 3.54
Benefits (A$ million)
Benefits from Reduced Lubricant Costs1
nil 2.73 4.1 4.1
Notes: 1. Based on a 20% discount to the Singapore Residual Fuels prices. Although this is variable price we have assumed this to be worth a conservative average of 15 cents per litre. 2. Based on a 15% discount against ISI LOR (Singapore) base oil prices i.e. A$210/tonne.
Table 19: Costs and Benefits for the WA Environment, Local Lube-to-Lube Re-Refining Scenario, litres
2007/08 2008/09 2009/10 2010/11
Costs
Costs: Uncollected used oil (Self-Managed) 349,500 234,270 188,451 189,504
Costs
Emissions from the burning of oils as fuels. Specifically metals such as lead, copper and chromium as well as
halogenated compounds and possibly PCB. Increased road transport.
Benefits
Reductions in the costs compared to Scenario 1

© Oakdene Hollins Ltd February 2009
For The Waste Authority Page 64
6 Out-of-State Lube-to-Lube Re-Refining Scenario
6.1 Background
The most probable third scenario involving re‐refining investment is an out‐of‐state plant supplied with feedstock drawn partly from WA. LOREX Investments Pty Ltd has developed such a proposal in partnership with Laing O’Rourke. The proposal involves construction of a larger scale re‐refining plant (ca.100 million litres) at Kooragang Island, Newcastle in NSW. During the consultation process we were invited to consider other options such as the reconfiguration of recently closed bio‐fuel plants. In our opinion, whilst there are several possible alternative scenarios, the most advanced and credible is that proposed by LOREX. The competition between two re‐refining strategies ‐ several small‐scale plants as favoured by TPI Group Ltd and single large‐scale plants as favoured by LOREX ‐ is discussed in the federal review of the PSO. In summary, larger plants enjoy economies of scale that provide a cost advantage that is claimed to be larger than the cost disadvantage of needing to transport feedstock over greater distances. For WA we have been especially careful to evaluate the likely costs of shipping used oil by sea to NSW. This issue has been discussed in the Part A report. The evidence from Alberta (and also from the USA) is that used oil feedstock can travel distances in excess of 2,000 km to a re‐refinery. SafetyKleen in the USA first established the advantages of scale in re‐refining used oil, but also discovered the scale disadvantages of organising inward bulk transport of used oil feedstock. This scenario is modelled on the basis that there is no local lube‐to‐lube re‐refinery. Although we have not had sight of the LOREX business plan, once the plant is built it is likely to be a credible competitor for some used oil from WA. During the consultation process we were told that the plant is expected to be commissioned by 2010 although we have no information concerning the impact of the recent financial turmoil on these proposals.
© Oakdene Hollins Ltd February 2009
For The Waste Authority Page 65
6.2 Optional Additional Policy Measures
That out‐of‐state re‐refining is economically viable places two types of pressure on potential investors in local lube‐to‐lube re‐refining plant. Either the joint venture partners fear the threat and seek a higher rate of return on their investment, or they seek to invest as soon as possible to make it more difficult for LOREX to win market share. With such uncertainty, we have not identified policy options that specifically aim to achieve the out‐of‐state lube‐to‐lube re‐refining scenario. Nevertheless, there are outcomes that enable this scenario to occur and which do not undermine other scenarios. These are: • Improving storage infrastructure at Bunbury Docks, Fremantle or
elsewhere in WA that allows export of used oil or bottoms residues. • A successful outcome from the research and development project on
using bottoms residues in bituminous binders. Policy options that support these outcomes have been described in Section 5 and are discussed in further detail in Section 7. The distribution and size of costs and benefits arising from the out‐of‐state lube‐to‐lube re‐refining are different from the other scenarios and these are shown in Appendix 3 and in Section 6.3 below.
6.3 Summary Costs and Benefits From Out-of-State Re-refining
The scenario has been modelled in Appendix 3. Modelling of the costs and benefits in this scenario are largely determined by unknowable assumptions concerning the extent to which market share is won. For modelling purposes we have assumed that market share will grow to a maximum of 25%, and then we tested the outcomes should it grow to 50%. Within the constraints of the modelling assumptions used, the following outcomes were noted: • Collection prices for generators of crankcase oils (in the automotive
sector) will fall to nil (free of charge) and fall to 5 cents per litre in the mining and industrial sectors due to more intense competition. This has the positive impact of greatly reducing the amount of used oil that is self managed by generators.
• The JV arrangement would break up, further intensifying price competition.
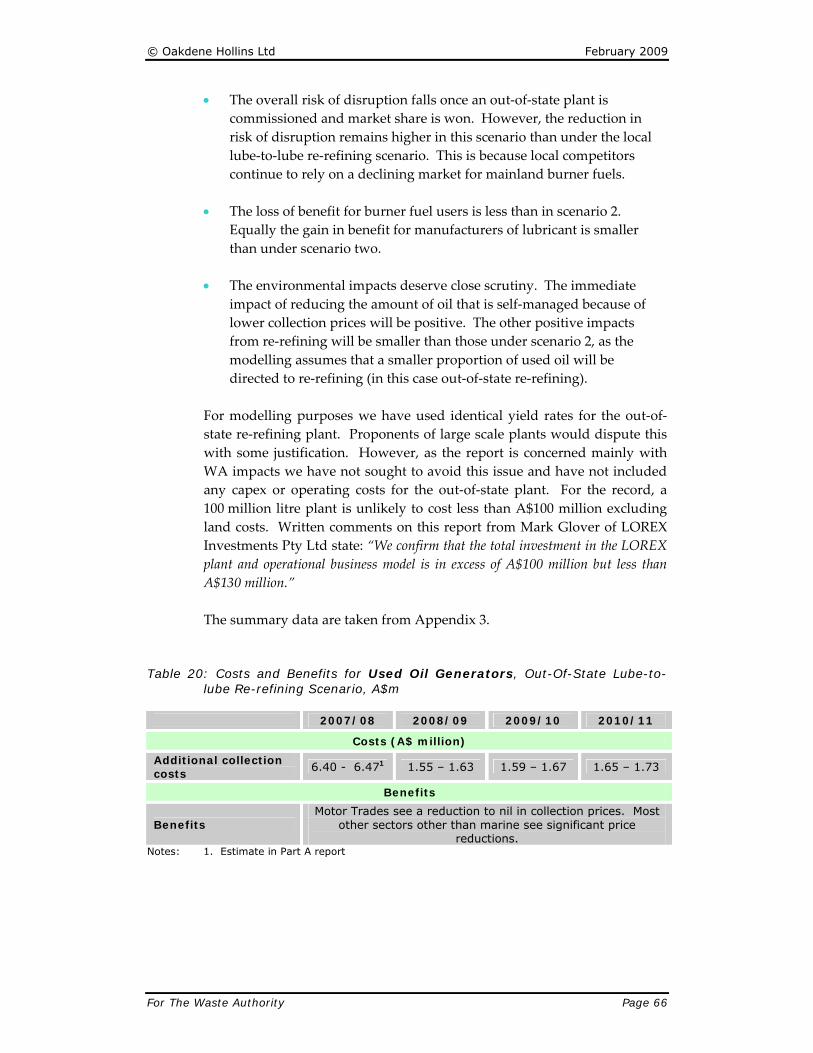
© Oakdene Hollins Ltd February 2009
For The Waste Authority Page 66
• The overall risk of disruption falls once an out‐of‐state plant is commissioned and market share is won. However, the reduction in risk of disruption remains higher in this scenario than under the local lube‐to‐lube re‐refining scenario. This is because local competitors continue to rely on a declining market for mainland burner fuels.
• The loss of benefit for burner fuel users is less than in scenario 2. Equally the gain in benefit for manufacturers of lubricant is smaller than under scenario two.
• The environmental impacts deserve close scrutiny. The immediate impact of reducing the amount of oil that is self‐managed because of lower collection prices will be positive. The other positive impacts from re‐refining will be smaller than those under scenario 2, as the modelling assumes that a smaller proportion of used oil will be directed to re‐refining (in this case out‐of‐state re‐refining).
For modelling purposes we have used identical yield rates for the out‐of‐state re‐refining plant. Proponents of large scale plants would dispute this with some justification. However, as the report is concerned mainly with WA impacts we have not sought to avoid this issue and have not included any capex or operating costs for the out‐of‐state plant. For the record, a 100 million litre plant is unlikely to cost less than A$100 million excluding land costs. Written comments on this report from Mark Glover of LOREX Investments Pty Ltd state: “We confirm that the total investment in the LOREX plant and operational business model is in excess of A$100 million but less than A$130 million.” The summary data are taken from Appendix 3.
Table 20: Costs and Benefits for Used Oil Generators, Out-Of-State Lube-to-lube Re-refining Scenario, A$m
2007/08 2008/09 2009/10 2010/11
Costs (A$ million)
Additional collection costs
6.40 - 6.471 1.55 – 1.63 1.59 – 1.67 1.65 – 1.73
Benefits
Benefits Motor Trades see a reduction to nil in collection prices. Most
other sectors other than marine see significant price reductions.
Notes: 1. Estimate in Part A report

© Oakdene Hollins Ltd February 2009
For The Waste Authority Page 67
Table 21: Costs and Benefits for Used Oil Collectors and Processors (JV only), Out-Of-State Re-refining Scenario, A$m
2007/08 2008/09 2009/10 2010/11
Costs (A$ million)
Capex: storage/export facilities 0.2 1.8 0.3
Reduction in sales of burner fuels1 nil Nil 1.04 1.40
Benefits (A$ million)
Additional benefits from collection price increases
6.40 - 6.47 1.55 – 1.63 1.59 – 1.67 1.65 – 1.73
Additional benefits from collection round rationalisation
0.1 nil nil Nil
1. Sales price for fuels averaged at 20 c/l
Table 22: Costs and Benefits for Burner Fuel Buyers & Lubricant Buyers, Out-of-State Lube-to-lube Re-refining Scenario, A$m 2007/08 2008/09 2009/10 2010/11
Costs (A$ million) Loss of benefits from Reduced Burner Fuel Costs1
Nil nil 0.78 1.05
Benefits (A$ million)
Benefits from Reduced Lubricant Costs2
Nil 0.6 1.2 1.58
Notes: 1. Based on a 20% discount to the Singapore Residual Fuels prices. Although this is variable price we have assumed this to be worth a conservative average of 15c/l. 2. Based on a 15% discount against ISI LOR (Singapore) base oil prices i.e. A$210/tonne.
Table 23: Costs and Benefits for the WA Environment, Local Lube-to-lube Re-refining Scenario, litres
2007/08 2008/09 2009/10 2010/11
Costs
Costs: Uncollected used oil (self-managed) 26,500 39,353 47,617 48,586
Costs
Emissions from the burning of oils as fuels. Specifically metals such as lead, copper and chromium as well as
halogenated compounds and possibly PCB. Increased road transport
Benefits
Much reduced oil self management costs compared to scenarios 1 or 2 but less benefit from re-refining as
quantities sent to re-refining are less than in scenario 2 The distribution of costs and benefits in this scenario are more dependent on the modelling assumptions than in scenarios 1 or 2. It is also possible

© Oakdene Hollins Ltd February 2009
For The Waste Authority Page 68
that a fourth scenario would deliver the best possible outcome by combining scenarios 2 and 3. In these circumstances a local lube‐to‐lube plant would be built and then collection prices forced down through greater competition from LOREX. We have not modelled this scenario as it depends for its credibility on a good knowledge of the distribution of used oils that are ideally suited to re‐refining.
© Oakdene Hollins Ltd February 2009
For The Waste Authority Page 69
7 Policy Options
All three of the scenarios described in this report could occur without policy interventions of any description. Perhaps an ideal outcome would be that scenario 1 is followed by scenario 2 and then by scenario 3. This would deliver a higher proportion of used oil directed to lube‐to‐lube re‐refining as well as sufficient competition to put downward pressure on collection prices. This section considers the extent to which policy options are appropriately targeted and whether they are practical and necessary.
7.1 Option 1
Option 1 Establish a timetable for the introduction of new atmospheric pollution abatement controls for plants that accept waste derived fuels.
The purpose of this option is to support investment in re‐refining, whether local or out‐of‐state, once such investment is in place. It will aim to remove the possibility that competitors will enter the market in order to collect oils and supply a local user of burner fuels. The JV partners and other re‐refining investors are likely to welcome this work programme on condition that tighter regulations are not introduced until after new re‐refining capacity has been commissioned. Even at this time, it may not be necessary to implement new regulations given the culture amongst energy buyers in WA to generally avoid waste derived fuels. The cost of developing tighter regulations that may be applied in future years will fall on the Department of Environment and Conservation. A work programme over two years scheduled with small initial steps and, later, more public consultation is all that is required. Development of this work, if supported by the oil collection sector, could be made conditional on satisfactory progress being made with a lube‐to‐lube re‐refinery and new storage tanks. Costs on the Department are unlikely to exceed the equivalent of 25 person days in the first year but may increase in the second to 50 person days. The costs thereafter are unknown.

© Oakdene Hollins Ltd February 2009
For The Waste Authority Page 70
7.2 Option 2
Option 2 Monitor the progress of the JV toward delivering a new lube-to-lube plant.
The purpose of this option is to establish explicit milestones for progress in developing new tank infrastructure at Bunbury Docks and building lube‐to‐lube re‐refining capacity. Inviting the JV partners to set out a timetable for progress and then programming a small number of review meetings should be sufficient. The resources required to do this task should be negligible during the first year but may grow as issues arise of non‐ or conditional performance.
7.3 Option 3
Option 3 Offer a grant toward the cost of a re-refining plant/tank storage capacity conditional on commissioning before 2011.
The purpose of this option is to accelerate investment in lube‐to‐lube re‐refining in support of the existing federal system of financial aid. It would also add a clear penalty to option 2 should non‐performance become an issue. Nevertheless, the resources required to implement this option will be significant. A financial award will need to be organised appropriately and competitive bids sought. The contractual arrangements for payment of the award will be complex and inevitably involve resolution of disputes and technical monitoring of plant design, construction and operation that requires skills not held within the Department. To justify the resources required to administer the award and its payment a minimum amount of perhaps A$2 million or more would be necessary. Administration costs of 15% or more would be expected for complex grant awards in the range A$2 million to A$5 million i.e. A$300,000 to A$750,000. As the JV partners claim to be able to build the plant for less than A$20 million such financial assistance would represent a large element of the final cost and inevitably raise questions over the choice of technology. A simpler approach would be to offer financial assistance toward the cost of new storage facilities to enable export of used oil, bottoms or base oil. A competition is likely to attract more than one applicant and the technical issues concerning performance are far less onerous. Additional storage

© Oakdene Hollins Ltd February 2009
For The Waste Authority Page 71
reduces the risk of disruption under all three scenarios as long as a condition of grant award is that the storage is available for such purposes for a period of several years.
7.4 Option 4
Option 4 Investigate the introduction of more onerous licence conditions for used oil operators.
The purpose of this option is to provide the State Government with a more satisfactory contingency should scenario 1 occur and the increasing risks of disruption reoccur. In such circumstances there would be a fund on which to draw to pay for the disposal of accumulated used oil or bottoms. In practice option 4 would raise the barriers to entry for new small competitors as they would need to demonstrate that they were able to provide the financial instruments necessary to comply with the new license conditions. This option is likely to be resisted by existing used oil collection companies. Resources required to implement option 4 would come from the Department of Environment and Conservation. Costs are likely to be similar to those in option 1. Option 4 would be unnecessary in the event of scenario 2 occurring and possibly in the event of scenario 3 occurring.
7.5 Option 5
Option 5 Request that the relevant state Government Departments including Transport Department give priority to investigating the viability of using bottoms in asphalt products.
The purpose of this option is to reduce the risks of disruption under scenario 1, scenario 2 and possibly create new business opportunities under scenario 3. It is the only option that could have entirely beneficial impacts across all three scenarios. There is also the possibility of linking the allocation of Departmental resources under this option with option 2. DEC has the potential to be able to co‐ordinate meetings, liaise with other departments and generally enable activities that neither of the JV partners could manage. Resources required would be modest, involving appointing a monitoring and enabling officer to attend meetings led by Wren Oil and then actively taking forward actions. As the federally‐funded project is shortly to start, allocation of a
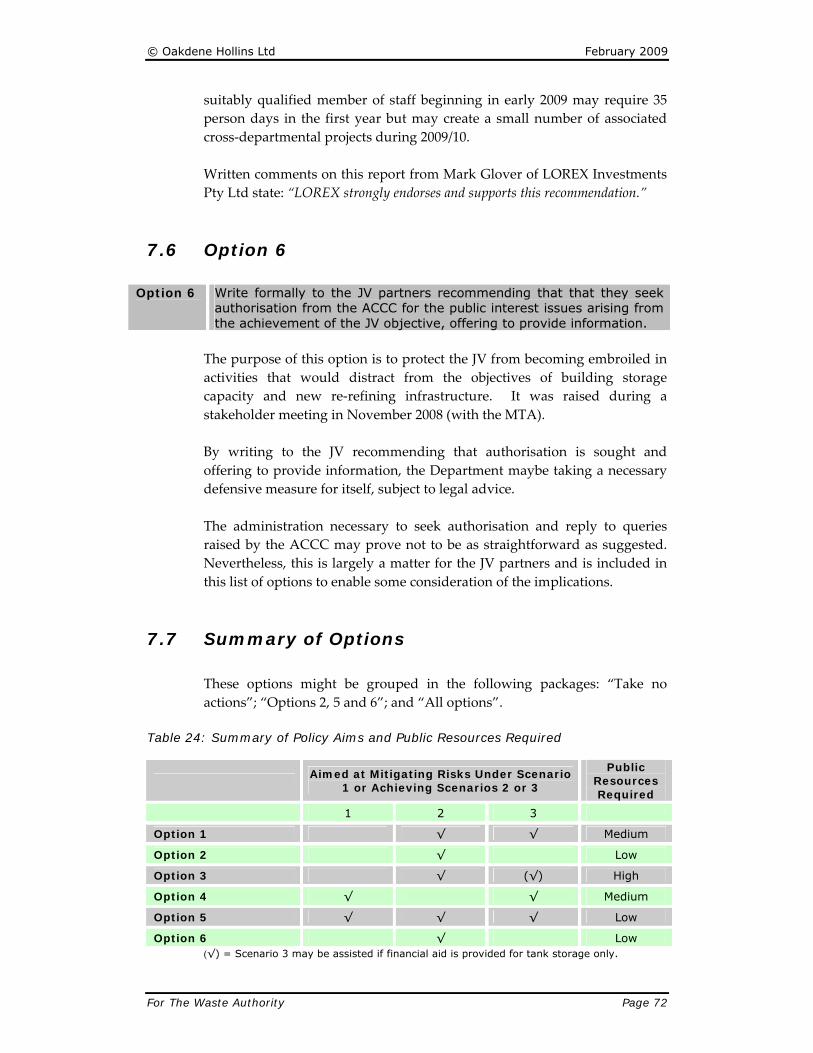
© Oakdene Hollins Ltd February 2009
For The Waste Authority Page 72
suitably qualified member of staff beginning in early 2009 may require 35 person days in the first year but may create a small number of associated cross‐departmental projects during 2009/10. Written comments on this report from Mark Glover of LOREX Investments Pty Ltd state: “LOREX strongly endorses and supports this recommendation.”
7.6 Option 6
Option 6 Write formally to the JV partners recommending that that they seek authorisation from the ACCC for the public interest issues arising from the achievement of the JV objective, offering to provide information.
The purpose of this option is to protect the JV from becoming embroiled in activities that would distract from the objectives of building storage capacity and new re‐refining infrastructure. It was raised during a stakeholder meeting in November 2008 (with the MTA). By writing to the JV recommending that authorisation is sought and offering to provide information, the Department maybe taking a necessary defensive measure for itself, subject to legal advice. The administration necessary to seek authorisation and reply to queries raised by the ACCC may prove not to be as straightforward as suggested. Nevertheless, this is largely a matter for the JV partners and is included in this list of options to enable some consideration of the implications.
7.7 Summary of Options
These options might be grouped in the following packages: “Take no actions”; “Options 2, 5 and 6”; and “All options”.
Table 24: Summary of Policy Aims and Public Resources Required
Aimed at Mitigating Risks Under Scenario 1 or Achieving Scenarios 2 or 3
Public Resources Required
1 2 3
Option 1 √ √ Medium
Option 2 √ Low
Option 3 √ (√) High
Option 4 √ √ Medium
Option 5 √ √ √ Low
Option 6 √ Low (√) = Scenario 3 may be assisted if financial aid is provided for tank storage only.

© Oakdene Hollins Ltd February 2009
For The Waste Authority Page 73
8 Sensitivity Analysis
The objective in preparing a model of the three scenarios was to identify the range of outcomes when measured against two key indicators: the amount of used oil that is self‐managed by generators, and the risk of a repeat of the disruption to the collection infrastructure seen during 2006/07. The risk of disruption (Figure 14) varies in our model according to the extent to which each scenario generates used oil that has to be sent to non‐mainland markets (Christmas Island and other markets via Singapore). The measure of self‐managed oil (Figure 15) highlights the implications of price changes at the point of collection.
Fig. 14: Comparative Risk of Disruption to Collection (measured by the proxy
figure of used oil sent to non-mainland markets) under Each Scenario
0.0
5.0
10.0
15.0
20.0
25.0
30.0
35.0
Jul-0
8
Jan-0
9Ju
l-09
Jan-1
0Ju
l-10
Jan-1
1Ju
l-11
Jan-1
2Ju
l-12
Jan-1
3Ju
l-13
Jan-1
4Ju
l-14
Jan-1
5Ju
l-15
Year
Non
Mai
nlan
d B
urne
r Fue
l, M
illio
n Li
tres
No Intervention Local Re-refining Out of State Re-refining
LR with Bottoms OSR 50% Market Share

© Oakdene Hollins Ltd February 2009
For The Waste Authority Page 74
Fig. 15: Amount of Self-Managed Oil under Each Scenario
0
50,000
100,000
150,000
200,000
250,000
300,000
350,000
400,000
450,000
Jul-0
8Ju
l-09
Jul-1
0Ju
l-11
Jul-1
2Ju
l-13
Jul-1
4Ju
l-15
Year
Self
Man
aged
Oil,
L
$0.00
$0.01
$0.02
$0.03
$0.04
$0.05
$0.06
$0.07
$0.08
$0.09
$0.10
$0.11
$0.12
$0.13
$0.14
$0.15
$0.16
$0.17
$0.18
Col
lect
ion
Cos
t, A
$
No Intervention Local Re-refining Out of State Re-refiningNI Collection Cost LR Collection Cost OSR Collection Cost
Using these two key indicators to measure the differences between each of the three scenarios is dependent on a small number of underpinning assumptions that may significantly impact on the results. These assumptions are, in order of their sensitivity: • Market share assumptions of LOREX under scenario 3 • Blending ratio of bottoms with used oil under scenario 2 • Growth in used oil supply from the mining sector • Mainland demand for burner fuels.
8.1 Market Share Assumptions, Scenario 3 (Out-
of-State)
We have no means of knowing whether the operators of the out‐of‐state re‐refinery will be able to exploit the cost advantages from their larger scale plant by investing in collection vehicles in WA. If they succeed in doing so they may take a market share in excess of the 25% maximum market share that we have modelled in scenario 3. When comparing the outcomes of scenario 2 and scenario 3, the choice of market share determines the extent to which out‐of‐state re‐refining can compare with the reductions in risk achieved by a local lube‐to‐lube re‐refinery.

© Oakdene Hollins Ltd February 2009
For The Waste Authority Page 75
Written comments on this report from Mark Glover of LOREX Investments Pty Ltd state: “However, in the event that suitable commercial terms are not achievable…LOREX will roll out their own collection vehicles and supporting storage and infrastructure…LOREX would aim to collect up to 20 ML in the entire WA market as a minimum.”
8.2 Blending Ratio for Bottoms, Scenario 2 (Local Re-refining)
The model assumes that the local re‐refinery will produce more than 5 million litres of bottoms once maximum annual capacity has been achieved. This presents a significant on‐going risk of disruption since not more than 50% of the bottoms can be used in mainland burner fuel markets and must be sent to non mainland markets. We have modelled the use of oil at a ratio of 1:1 to blend with the bottoms to transport them to non‐mainland markets. The choice of blending ratio has a significant impact on the level of risk of disruption that we show in Figure 14 since risk is measured using a proxy that is the amount of oil that needs to be sent to non mainland markets. We could have applied a different blending ratio depending on the amount of bottoms that could be sent to cement or lime kilns or other high temperature incineration routes in WA (such as ToxFree). When comparing the results with scenario 3 (out‐of‐state) the out‐of‐state plant has the advantage of not being considered to have an equivalent bottoms issue since it is located outside of WA. Written comments on this report from Mark Glover of LOREX Investments Pty Ltd state: “LOREX is placing considerable emphasis on producing a bottoms product rather than an indeterminate waste residue or variable by‐product. LOREX would proactively support the R&D efforts to see VTB’s blown into new bituminous binder products.”
8.3 Used Oil Supply – All Scenarios
In our model of used oil supply, current supply of 42.3 million litres increases to 54.2 million litres by 2015. Such forecast growth is dependent on growth in demand from the mining sector and slight growth in the automotive sector. Other sectors decline slowly. Although we have reflected a short term reduction in growth in the mining sector this resumes to 8% annual growth thereafter reflecting expected

© Oakdene Hollins Ltd February 2009
For The Waste Authority Page 76
economic growth rates in China in particular. Should this growth not occur or should demand for lubricants fall in the mining sector, the overall scale of the costs and benefits will be reduced but the distribution will not be significantly changed.
8.4 Mainland Demand for Burner Fuels
The model is based on an assumption that demand in mainland WA for burner fuels will show step‐down changes of 15% every three years beginning in 2009. The evidence to justify such three year reductions is the recent history of plant closures described in detail in the Part A study. In practice such closures may not occur. In circumstances where such reductions in demand for burner fuels do not occur or if demand increases, the risk profiles we have prepared will be reduced in intensity although the comparative differences will remain the same.

© Oakdene Hollins Ltd February 2009
For The Waste Authority Page 77
9 Conclusions
No single case study provides a template from which lessons can be taken and applied in Western Australia. Nevertheless, in two of the three case studies (Alberta and Denmark) the capacity to export used oil has been of critical importance in maintaining stability in the used oil collection infrastructure during periods of change. Western Australia, during an extended period of transition toward a lube‐to‐lube re‐refining solution, has become dependent on shipping used oil to non‐mainland markets. This dependency is especially sensitive since the non‐mainland markets carry a high risk of disruption; either because of reliance on Basle Convention interpretation or else on the continuation of phosphate mining on Christmas Island. The creation of a joint venture between Nationwide and Wren Oil offers the prospect of a local re‐refining plant and additional storage capacity to enable exports of used oil, fuel and base oil. However, the higher costs of collection that the joint venture has imposed will increase the amount of used oil that is self‐managed by some generators. There is as yet no credible business plan to show the steps that will be taken to deliver such investment. The WA Waste Authority has set a goal of reducing the risk of a repeat of the disruption to the collection infrastructure that occurred in 2006/07. Within the context of the three scenarios that we have investigated, this goal would be advanced by either scenario 2 or 3, both of which involve an investment in re‐refining. It is possible that either of these scenarios will occur without further intervention since the financial incentives provided by the PSO, if maintained following the current review, offer strong incentive for investment. Local re‐refining offers a more certain possibility than out‐of‐state proposals but the modelling shows that the costs and benefits from either option are differently distributed. In both cases however the risks of disruption and risks associated with self‐management of oil are lower than in the base‐line scenario. The question is whether any further interventions are necessary? Without sight of a credible business plan from the joint venture this important question cannot be answered. In the meantime there are several policy options that could be considered to promote movement toward either scenario that involves investment in lube‐to‐lube re‐refining and new storage capacity to ensure continued sea‐borne trade in used oil derived materials.

© Oakdene Hollins Ltd February 2009
For The Waste Authority Page 78
References
Case Studies - Alberta
Industry Contacts Ronald J. Driedger, Executive Director, BCUOMA ‐ British Columbia Used Oil Management Association, Suite 125, 9‐45905 Yale Road, Chilliwack, BC CANADA, V2P 8E6 Email: [email protected] Telephone: +1 604‐703‐1990 Fax: +1 604‐703‐1998 Website: http://www.usedoilrecycling.com/en/bc/ Roger Jackson, Executive Director, AUOMA ‐ Alberta Used Oil Management Association, Suite 1050, Scotia 1, Scotia Place, 10060 Jasper Avenue, Edmonton, Alberta CANADA, T5J 3R8 Email: [email protected] Telephone: +1 780‐414‐1514; Cell +1 780‐554‐7523 Website: http://www.usedoilrecycling.com/en/ab Patrick Kane, Alberta Environment, 9820 106th St, Main Floor Oxbridge Place, Edmonton, Alberta, CANADA, T5K 2J6 Email: [email protected] Telephone: +1 780‐422‐2136 Fax: +1 780‐422‐5120 Website: http://environment.alberta.ca/ Jeff Linton, Executive Director, Alberta Bottle Depot Association, 17 Linthorpe Rd, Spruce Grove, Alberta CANADA, T7X 2C3; Email: [email protected] Telephone: +1 780‐962‐5227; Website: http://www.albertadepot.ca/about.asp Barb Parry, Manager, Technical Services, Newalta Corporation, 130 Forester St., N. Vancouver, British Columbia, CANADA, V7H 2M9; Email: [email protected] Telephone: +1 604‐924‐2703 Website: http://www.newalta.com/ Christina Seidel, Executive Director, Recycling Council of Alberta, Box 23, Bluffton, Alberta, CANADA, T0C 0M0; Email: [email protected]

© Oakdene Hollins Ltd February 2009
For The Waste Authority Page 79
Telephone: +1 403.843.6563 Website: http://www.recycle.ab.ca/ Ted Stoner, Vice President ‐ Western Region, Canadian Petroleum Products Institute , Bow Valley Square 1, 1010 ‐ 202 6th Ave. SW, Calgary Alberta CANADA, T2P 2R9 Email: [email protected] Telephone: +1 403‐266‐7565; Fax: +1 403‐269‐9367 Website: http://www.cppi.ca/ Usman A. Valiante, Senior Policy Analyst, Corporate Policy Group LLP, Ontario, CANADA Email: [email protected] Telephone: +1 416 420 4222 Articles and Reports Bearing Point Inc., 2005. UOMA Program Review Final Report. Edmonton, Alberta, Canada. Prepared for the Used Oil Management Association. Canadian Petroleum Products Institute. 2002. Moving forward in used oil stewardship. Presentation to Recycling Council of B.C. 28th Annual Conference Victoria, B.C. May 30, 2002. Bill Levy, CPPI. Competition Bureau Canada. 2004. Unpublished Letter to Diversion Ontario. The Corporate Link Management Consultants (CLMC). 2002. Economic and environmental performance of Alberta’s used oil program. A discussion paper prepared for Environment Canada for presentation to the OECD Workshop on the Economics of Extended Producer Responsibility. Corporate Policy Group LLP. 2005. A critical review of the Used Oil Management Association (UOMA) Program Review. Driedger, Ron. 2004. New start to used oil recycling in BC, September 2004. Unpublished memo. Oakdene Hollins Ltd. 2004. Improving markets for secondary materials. Case study report on oils. Prepared for the OECD. Used Oil Management Association (UOMA). 2000. UOMA Program Review. PowerPoint Presentation to Resource Recycling Workshop, Taipei, Taiwan, June 2000.

© Oakdene Hollins Ltd February 2009
For The Waste Authority Page 80
Used Oil Management Association (UOMA). 2003. OUOMA used oil material diversion program. PowerPoint Presentation to Municipal Consultation Workshop – Kingston, Sep 23. White Court Star (Newspaper). 2008. Alberta mindset changing for recycled oil. Wednesday July 23, 2008 Case studies - Denmark
Industry Contacts Bernhard Brackhahn, Waste Centre Denmark (Videncenter for affald), Teknikerbyen 35 DK‐2830 Virum DENMARK, Email: [email protected] Telephone: +45 70 21 80 30 or 8034 (direct) Fax: +45 70 21 80 31 Website: http://www.wasteinfo.dk/ Detlev Bruhnke, Member of Management Board, Technology & Development, AVISTA Oil AG, Bahnhofstraße 82, 31311 Uetze, GERMANY Email: detlev.bruhnke@avista‐oil.com Telephone: +49 (0) 5177 85 148 Mobile: +49 (0) 163 5750549 Fax: +49 (0) 5177 85 226 Website: www.mineraloel‐raffinerie.de Bjarne Damsgaard, KommuneKemi a/s, Lindholmvej 3, DK‐5800, Nyborg, DENMARK Telephone: +45 6331 7362; Mobile: +45 3085 8132 Email: [email protected] Website: www.kommunekemi.dk Peter Grau, Miljøstyrelsen/Danish Environmental Protection Agency (EPA), Miljøministeriet//Ministry of Environment, Strandgade 29 DK‐1401 Copenhagen K; Email: [email protected] Telephone: + 45 72 54 4000 or 4191 (direct) Fax: (+ 45) 33 32 22 28 Website: www.mst.dk Janus Søgaard Kirkeby, Waste Centre Denmark (Videncenter for affald), Teknikerbyen 35 DK‐2830 Virum DENMARK, Email: [email protected] or [email protected] Telephone: +45 70 21 80 30 or 8032 (direct) Fax: +45 70 21 80 31
© Oakdene Hollins Ltd February 2009
For The Waste Authority Page 81
Website: http://www.wasteinfo.dk/ Ingemann Klausen, Consultant, Mineralolie Brancheforeningen & Miljøpuljen ApS, Postboks 08, 2791 Dragør, DENMARK Email: [email protected] Telephone: +45 2090 0551 Website: http://www.oliebranchen.dk/Organisation/MB/Kontakt_MB.aspx Bjarne Lund, Manager, Gunnar Lund Olieservice, Olievej 10, DK‐6700, Esbjerg, DENMARK Telephone: +45 7513 8600 Fax: +45 7513 0487 Website: http://www.gunnarlund.dk/ Merete Steffensen, Dansk Olie Genbrug, Juelsmindevej 18, 4400 Kalundborg, DENMARK Email: [email protected] Telephone: +45 59 56 56 44 Website: www.oliegenbrug.dk Nina Veyhe, Mineralolie Brancheforeningen & Miljøpuljen ApS, Postboks 08, 2791 Dragør, DENMARK Email: mb‐[email protected] Telephone: +45 33 14 59 22; Website: www.oil‐forum.dk/mb or http://www.oliebranchen.dk/Organisation/MB/Kontakt_MB.aspx David Watson, Danish Topic Centre on Waste and Resources/European Topic Centre on Waste and Resource Management ‐ ETC/RWM, Højbro Plads 4, Mezzaninen, DK‐1200 Copenhagen K DENMARK, Email: [email protected] Telephone: +45 72 54 61 60 Fax: +45 33 32 22 27 Website: http://wasteandresources.dk/ Articles and Reports Danish Topic Centre on Waste & Resources. 2006. Dropping the requirement for waste oil regeneration – potential socio‐economic impacts. European Commission. 2001. Critical review of existing studies and life cycle analysis on the regeneration and incineration of waste oils. Written by Taylor Nelson Sofres S.A. European Commission. 2003. Report from the Commission to the Council and the European Parliament on the implementation of community waste legislation. Directive 75/442/EEC on waste, Directive 91/689/EEC on hazardous waste, Directive 75/439/EEC on

© Oakdene Hollins Ltd February 2009
For The Waste Authority Page 82
waste oils, Directive 86/278/EEC on sewage sludge and Directive 94/62/EC on packaging and packaging waste for the period 1998‐2000. European Commission. 2004. Definition of waste recovery and disposal operations. Part B. Neutralisation of waste specific environmental data. Written by Ökopol GmbH. European Commission. 2006. Report from the Commission to the Council and the European Parliament on implementation of the Community Waste Legislation, Directive 75/442/EEC on waste, Directive 91/689/EEC on hazardous waste, Directive 75/439/EEC on waste oils, Directive 86/278/EEC on sewage sludge, Directive 94/62/EC on packaging and packaging waste and Directive 1999/31/EC on the landfill of waste for the period 2001‐2003. Resource Recovery Forum. 2005. Europe – Waste Framework Directive. Resource Recovery Forum. 2006. Denmark – changes to waste oil management legislation could increase incineration and jeopardise greener regeneration practices. Case studies - Finland
Industry Contacts Kari Kyllönen, Service Manager, Ekovoima Oy, Kuulojankatu 1, 11120 Riihimäki, FINLAND Email: [email protected] Telephone: +358 10 7551 322 Website: http://www.ekokem.fi/portal/en/ Hannu Laaksonen, Senior Engineer, Ympäristöministeriö / The Ministry of the Environment, Ympäristönsuojeluosasto / Environmental protection department, Kasarmikatu 25, PL 35, 00023 Valtioneuvosto, (Helsinki), FINLAND Email: [email protected], Telephone (Mobile): +358 50 538 6972 Website: http://www.ymparisto.fi/default.asp?node=4032&lan=en Kai Löfgren, Managing Director, L & T Recoil Oy, Konetie 6 FI‐04300 Tuusula, FINLAND Email: kai.lofgren@lt‐recoil.com Telephone: +358 10636 5618; Mobile: +358 40 570 7016 Fax: +358 10636 5612 Website: http://www.lt‐recoil.com/

© Oakdene Hollins Ltd February 2009
For The Waste Authority Page 83
Articles and Reports – IN ENGLISH Lassila & Tikanoja plc, 2008. Annual Report 2007. http://www.lassila‐tikanoja.com/en/investors/stockexchangereleases/Documents/LT%20Annual%20Report%202007.pdf. L&T Recoil Oy, 2007. Foundation. http://www.lt‐recoil.com/foundation/. (Information released 1.10.2007) L&T Recoil Oy, 2008. Re‐refinery. http://www.lt‐recoil.com/re‐refinery/. Öljy‐ ja kaasualan keskusliitto – Finnish Oil and Gas Federation, 2008a. Oil and natural gas in Finland. http://www.oil‐gas.fi/files/357_finland.pdf. Articles and Reports – ONLY IN FINNISH Ekokem‐konserni – Ekokem Group, 2008a. Ekokem‐konsernin vuosikertomus 2007 (Annual report of Ekokem Group 2007). http://www.ekokem.fi/attachments/vuosikertomus_ja_emas/ekokem_vsk_030408final.pdf. Ekokem‐konserni – Ekokem Group, 2008b. Historian havinaa (History of the Company). http://www.ekokem.fi/portal/fi/ekokem‐yhtiot/historiaa/ Finlex, 1993. Valtioneuvoston päätös öljyjätteen polton rajoittamisesta 447/1987 (Decision of the Council of State about limiting waste oil burning). http://www.finlex.fi/fi/laki/smur/1987/19870447 and http://www.finlex.fi/fi/laki/alkup/1987/19870447. Finlex, 1997. Valtioneuvoston päätös öljyjätemaksuinsa kertyvien varojen käytöstä öljyjätehuoltoon 1191/1997 (Decision of the Council of State about the use of funds collected from waste oil fees for waste oil services). http://www.finlex.fi/fi/laki/smur/1997/19971191 and http://www.finlex.fi/fi/laki/alkup/1997/19971191. Finlex, 2003. Valtioneuvoston päätös öljyjätehuollosta 101/1997 (Decision of the Council of State about waste oil services). http://www.finlex.fi/fi/laki/smur/1997/19970101 and http://www.finlex.fi/fi/laki/alkup/1997/19970101. Finlex, 2006. Laki öljyjätemaksusta 5.12.1986/894 (Law for waste oil fees). http://www.finlex.fi/fi/laki/smur/1986/19860894 and http://www.finlex.fi/fi/laki/ajantasa/1986/19860894. Neste Oil, 2008. Hinnoitteluperiaatteet (Pricing principles for waste oil collection). http://www.neste.fi/artikkeli.aspx?path=2589%2c2655%2c2710%2c2734%2c2742%2c3309%2c3313%2c3454%2c3455.

© Oakdene Hollins Ltd February 2009
For The Waste Authority Page 84
Lube Report, 2008. Puralube Plans Norwegian Rerefinery. Volume 8 Issue 40. http://www.imakenews.com/lng/e_article001217774.cfm. Tilastokeskus – Statistics Finland Ympäristöministeriö – the Ministry of the Environment, 2008. Jäteöljy. http://www.ymparisto.fi/default.asp?contentid=255014&lan=FI. (Page updated 10.7.2008.) Öljy‐ ja kaasualan keskusliitto – Finnish Oil and Gas Federation, 2008b. Hinnat ja verot Suomessa (Prices and Taxes in Finland). http://www.oil‐gas.fi/files/260_HinnatjaverotSuomessa.pdf

© Oakdene Hollins Ltd February 2009
For The Waste Authority Page 85
Appendices
Appendix 1: Base-Line Scenario 1 Appendix 2: Scenario 2, Local Re-refinery Appendix 3: Scenario 3, Out-of-State Re-refinery

© Oakdene Hollins Ltd Appendix 1: Base-Line Scenario February 2009
For The Waste Authority Page 86
Collection volumes decline slowly except in mining and automotive which increase. For treatment reductions in process heat reflect higher shipments to non-mainland markets as untreated oil from 2010.
15% step change reduction in mainland burner fuel demand every 3 years beginning 2009.
Collection
(Million Litres/yr) Volume %Change Volume %Change Volume %Change Volume %Change Volume %Change Volume %Change Volume %Change Volume %Change
Mining 16.5 5.0% 17.3 5.0% 18.2 5.0% 20.0 10.0% 21.8 9.0% 23.8 9.0% 25.7 8.0% 27.7 8.0%
Automotive 18.0 1.0% 18.2 1.0% 18.4 1.0% 18.5 1.0% 18.7 1.0% 18.9 1.0% 19.1 1.0% 19.3 1.0%
Industry 5.3 -1.0% 5.2 -1.0% 5.2 -1.0% 5.1 -1.0% 5.1 -1.0% 5.0 -1.0% 5.0 -1.0% 4.9 -1.0%
Marine 1.7 -1.0% 1.7 -1.0% 1.7 -1.0% 1.6 -1.0% 1.6 -1.0% 1.6 -1.0% 1.6 -1.0% 1.6 -1.0%Local Government 0.8 -3.0% 0.8 -3.0% 0.8 -3.0% 0.7 -3.0% 0.7 -3.0% 0.7 -3.0% 0.7 -3.0% 0.6 -3.0%
Total 42.3 43.2 44.2 46.1 48.0 50.0 52.0 54.2
Treatment (M Ltr/yr) Volume %Comp. Volume %Comp. Volume %Comp. Volume %Comp. Volume %Comp. Volume %Comp. Volume %Comp. Volume %Comp.
Water 2.1 5.0% 2.2 5.0% 2.2 5.0% 2.3 5.0% 2.4 5.0% 2.5 5.0% 2.6 5.0% 2.7 5.0%
Process Heat 6.3 15.0% 6.5 15.0% 5.6 12.8% 5.9 12.8% 6.1 12.8% 5.4 10.8% 5.6 10.8% 5.9 10.8%Mainland Burner Fuel 16.9 40.0% 14.7 34.0% 15.0 34.0% 15.7 34.0% 13.9 28.9% 14.5 28.9% 15.0 28.9% 13.3 24.6%
Non-Mainland Burner Fuel 16.9 40.0% 19.9 46.0% 21.3 48.3% 22.2 48.3% 25.6 53.4% 27.7 55.3% 28.8 55.3% 32.3 59.6%
Total 42.3 43.2 44.2 46.1 48.0 50.0 52.0 54.2
Cost ($AUD/litre) Virgin Fuel Price (local) $0.50 V Fuel Price (low quality) $0.40
Used Oil Collection
Mining $0.15 $2,475,000 $2,598,750 $2,728,688 $3,001,556 $3,271,696 $3,566,149 $3,851,441 $4,159,556
Automotive $0.15 $2,700,000 $2,727,000 $2,754,270 $2,781,813 $2,809,631 $2,837,727 $2,866,104 $2,894,765
Industry $0.15 $795,000 $787,050 $779,180 $771,388 $763,674 $756,037 $748,477 $740,992
Marine $0.50 $850,000 $841,500 $833,085 $824,754 $816,507 $808,342 $800,258 $792,256Local Government $0.08 $64,000 $62,080 $60,218 $58,411 $56,659 $54,959 $53,310 $51,711
Total $6,884,000 $7,016,380 $7,155,440 $7,437,922 $7,718,166 $8,023,214 $8,319,590 $8,639,280
$0.35 $5,922,000 $5,142,109 $5,255,810 $5,483,285 $4,852,630 $5,061,184 $5,263,884 $4,659,951
$0.20 $3,384,000 $3,975,412 $4,262,064 $4,446,529 $5,118,888 $5,530,276 $5,751,762 $6,460,328
Total Sales, $AUD
Benefits ($AUD/litre)
Users of Burner Fuels
Mainland $0.15
Non Mainland $0.20
Jul-13 Jul-14 Jul-15Jul-08 Jul-09 Jul-10 Jul-11 Jul-12
Sales of Mainland Burner Fuel
Sales of Non Mainland Burner Fuel
Wren/Nationwide (JV) $16,190,000 $18,614,674 $19,335,237 $19,759,559$16,133,901 $16,673,314 $17,367,736 $17,689,684

© Oakdene Hollins Ltd Appendix 2: Scenario 2, Local Re-refining February 2009
For The Waste Authority Page 87
Lube to Lube re-refining facility in WA with a capacity of 20 million litres in 2009 then increased to 30 ML thereafter.
Collection
(Million Liters/yr) Volume %Change Volume %Change Volume %Change Volume %Change Volume %Change Volume %Change Volume %Change Volume %Change
Mining 16.5 5.0% 17.3 5.0% 18.2 5.0% 20.0 10.0% 21.8 9.0% 23.8 9.0% 25.7 8.0% 27.7 8.0%
Automotive 18.0 1.0% 18.2 1.0% 18.4 1.0% 18.5 1.0% 18.7 1.0% 18.9 1.0% 19.1 1.0% 19.3 1.0%
Industry 5.3 -1.0% 5.2 -1.0% 5.2 -1.0% 5.1 -1.0% 5.1 -1.0% 5.0 -1.0% 5.0 -1.0% 4.9 -1.0%
Marine 1.7 -1.0% 1.7 -1.0% 1.7 -1.0% 1.6 -1.0% 1.6 -1.0% 1.6 -1.0% 1.6 -1.0% 1.6 -1.0%Local Government 0.8 -3.0% 0.8 -3.0% 0.8 -3.0% 0.7 -3.0% 0.7 -3.0% 0.7 -3.0% 0.7 -3.0% 0.6 -3.0%
Total 42.3 43.2 44.2 46.1 48.0 50.0 52.0 54.2
Treatment Volume %Comp. Volume %Comp. Volume %Comp. Volume %Comp. Volume %Comp. Volume %Comp. Volume %Comp. Volume %Comp.
Water 2.1 5.0% 1.2 5.0% 0.7 5.0% 0.8 5.0% 0.9 5.0% 1.0 5.0% 1.1 5.0% 1.2 5.0%
Process Heat 6.3 15.0% 1.4 6.0% 0.8 6.0% 1.0 6.0% 1.1 6.0% 1.2 6.0% 1.3 6.0% 1.5 6.0%Mainland Burner Fuel 16.9 40.0% 9.3 40.0% 5.7 40.0% 6.4 40.0% 7.2 40.0% 8.0 40.0% 8.8 40.0% 9.7 40.0%
Non-Mainland Burner Fuel 16.9 40.0% 11.4 49.0% 6.9 49.0% 7.9 49.0% 8.8 49.0% 9.8 49.0% 10.8 49.0% 11.9 49.0%
Total 42.3 23.2 14.2 16.1 18.0 20.0 22.0 24.2
Re-refining Capacity 20.0 30.0 30.0 30.0 30.0 30.0 30.0
Water 1.0 5.0% 1.5 5.0% 1.5 5.0% 1.5 5.0% 1.5 5.0% 1.5 5.0% 1.5 5.0%
Process Heat 1.6 8.0% 2.4 8.0% 2.4 8.0% 2.4 8.0% 2.4 8.0% 2.4 8.0% 2.4 8.0%
Base Oil 13.0 65.0% 19.5 65.0% 19.5 65.0% 19.5 65.0% 19.5 65.0% 19.5 65.0% 19.5 65.0%
Spindle Oil 0.8 4.0% 1.2 4.0% 1.2 4.0% 1.2 4.0% 1.2 4.0% 1.2 4.0% 1.2 4.0%
Light Oil 1.2 6.0% 1.8 6.0% 1.8 6.0% 1.8 6.0% 1.8 6.0% 1.8 6.0% 1.8 6.0%
Bottoms 2.4 12.0% 3.6 12.0% 3.6 12.0% 3.6 12.0% 3.6 12.0% 3.6 12.0% 3.6 12.0%
Other treatment
Bottoms 2.4 3.6 3.6 3.6 3.6 3.6 3.6Blending oil required
Blending ratio 1.0 2.4 3.6 3.6 3.6 3.6 3.6 3.6
Non Mainland Burner Fuel 4.8 7.2 7.2 7.2 7.2 7.2 7.2
Cost ($AUD/litre) Virgin Fuel Price $0.50 Virgin Oil Price $1.20
Used Oil Collection
Mining $0.15 $2,475,000 $0.15 $2,598,750 $0.15 $2,728,688 $0.15 $3,001,556 $0.15 $3,271,696 $0.15 $3,566,149 $0.15 $3,851,441 $0.15 $4,159,556
Automotive $0.15 $2,700,000 $0.10 $1,818,000 $0.08 $1,468,944 $0.08 $1,483,633 $0.08 $1,498,470 $0.08 $1,513,454 $0.08 $1,528,589 $0.08 $1,543,875
Industry $0.15 $795,000 $0.15 $787,050 $0.15 $779,180 $0.15 $771,388 $0.15 $763,674 $0.15 $756,037 $0.15 $748,477 $0.15 $740,992
Marine $0.50 $850,000 $0.50 $841,500 $0.50 $833,085 $0.50 $824,754 $0.50 $816,507 $0.50 $808,342 $0.50 $800,258 $0.50 $792,256Local Government $0.08 $64,000 $0.08 $62,080 $0.08 $60,218 $0.08 $58,411 $0.08 $56,659 $0.08 $54,959 $0.08 $53,310 $0.08 $51,711
Total $6,884,000 $6,107,380 $5,870,114 $6,139,743 $6,407,005 $6,698,941 $6,982,075 $7,288,389
$1.00 $13,000,000 $19,500,000 $19,500,000 $19,500,000 $19,500,000 $19,500,000 $19,500,000
$0.20 $400,000 $240,000 $240,000 $240,000 $240,000 $240,000 $240,000
$0.50 $6,500,000 $9,750,000 $9,750,000 $9,750,000 $9,750,000 $9,750,000 $900,000
$0.35 $5,922,000 $3,980,687 $1,260,000 $1,260,000 $1,260,000 $1,260,000 $1,260,000 $1,260,000
Total Sales, $AUD
$12,806,000 $29,988,067 $36,620,114 $36,889,743 $37,157,005 $37,448,941 $37,732,075 $29,188,389
Benefits ($AUD/litre)
Users of Base Oils $0.20
Users of Burner Fuels $0.15 but different quantities
Wren/Nationwide (JV)
Sales of Lubricant (Base) OilSales of Spindle+Light
OilPSO Payment for Base Oil
Sales of Non Mainland Burner Fuel
Jul-12 Jul-13 Jul-14 Jul-15Jul-08 Jul-09 Jul-10 Jul-11

© Oakdene Hollins Ltd Appendix 3: Scenario 3, Out-of-State Re-refining February 2009
For The Waste Authority Page 88
A competitor enters the market in 2009 to collect waste oil. They take a market share of 10% in 2009 and increase to 20% by 2010, 25% thereafter.
This leaves enough oil (subject to quality assumptions) for a WA lube to lube plant to operate.
Collection
(Million Liters/yr) Volume %Change Volume %Change Volume %Change Volume %Change Volume %Change Volume %Change Volume %Change Volume %Change
Mining 16.5 5.0% 17.3 5.0% 18.2 5.0% 20.0 10.0% 21.8 9.0% 23.8 9.0% 25.7 8.0% 27.7 8.0%
Automotive 18.0 1.0% 18.2 1.0% 18.4 1.0% 18.5 1.0% 18.7 1.0% 18.9 1.0% 19.1 1.0% 19.3 1.0%
Industry 5.3 -1.0% 5.2 -1.0% 5.2 -1.0% 5.1 -1.0% 5.1 -1.0% 5.0 -1.0% 5.0 -1.0% 4.9 -1.0%
Marine 1.7 -1.0% 1.7 -1.0% 1.7 -1.0% 1.6 -1.0% 1.6 -1.0% 1.6 -1.0% 1.6 -1.0% 1.6 -1.0%Local Government 0.8 -3.0% 0.8 -3.0% 0.8 -3.0% 0.7 -3.0% 0.7 -3.0% 0.7 -3.0% 0.7 -3.0% 0.6 -3.0%
Total 42.3 1.0% 43.2 1.0% 43.6 1.0% 46.3 6.0% 48.6 5.0% 51.0 5.0% 53.0 4.0% 55.2 4.0%
Treatment (ML/yr) Volume %Comp. Volume %Comp. Volume %Comp. Volume %Comp. Volume %Comp. Volume %Comp. Volume %Comp. Volume %Comp.
Water 2.1 5.0% 1.9 5.0% 1.7 5.0% 1.7 5.0% 1.8 5.0% 1.9 5.0% 2.0 5.0% 2.1 5.0%
Process Heat 6.3 15.0% 2.3 6.0% 2.1 6.0% 2.1 6.0% 2.2 6.0% 2.3 6.0% 2.4 6.0% 2.5 6.0%Mainland Burner Fuel 16.9 40.0% 15.6 40.0% 14.0 40.0% 13.9 40.0% 14.6 40.0% 15.3 40.0% 15.9 40.0% 16.5 40.0%
Non-Mainland Burner Fuel 16.9 40.0% 19.1 49.0% 17.1 49.0% 17.0 49.0% 17.9 49.0% 18.7 49.0% 19.5 49.0% 20.3 49.0%
Total 42.3 38.9 34.9 34.7 36.4 38.3 39.8 41.4
Re-refining (ML/yr)
Water 0.2 5.0% 0.4 5.0% 0.6 5.0% 0.6 5.0% 0.6 5.0% 0.7 5.0% 0.7 5.0%
Process Heat 0.3 8.0% 0.7 8.0% 0.9 8.0% 1.0 8.0% 1.0 8.0% 1.1 8.0% 1.1 8.0%
Base Oil 2.8 65.0% 5.7 65.0% 7.5 65.0% 7.9 65.0% 8.3 65.0% 8.6 65.0% 9.0 65.0%
Spindle Oil 0.2 4.0% 0.3 4.0% 0.5 4.0% 0.5 4.0% 0.5 4.0% 0.5 4.0% 0.6 4.0%
Light Oil 0.3 6.0% 0.5 6.0% 0.7 6.0% 0.7 6.0% 0.8 6.0% 0.8 6.0% 0.8 6.0%
Bottoms 0.5 12.0% 1.0 12.0% 1.4 12.0% 1.5 12.0% 1.5 12.0% 1.6 12.0% 1.7 12.0%
Market Share
42.3 100.0% 38.9 90.0% 34.9 80.0% 34.7 75.0% 36.4 75.0% 38.3 75.0% 39.8 75.0% 41.4 75.0%
Lorex 0.0 0.0% 4.3 10.0% 8.7 20.0% 11.6 25.0% 12.1 25.0% 12.8 25.0% 13.3 25.0% 13.8 25.0%
Other treatment
Bottoms 0.52 1.05 1.39 1.46 1.53 1.59 1.65
0.52 1.05 1.39 1.46 1.53 1.59 1.65
1.0 2.1 2.8 2.9 3.1 3.2 3.3
Cost ($AUD/litre) Virgin Fuel Price $0.50 Virgin Oil Price $1.20
Used Oil Collection
Mining $0.05 $825,000 $0.05 $866,250 $0.05 $909,563 $0.05 $1,000,519 $0.05 $1,090,565 $0.05 $1,188,716 $0.05 $1,283,814 $0.05 $1,386,519
Automotive $0.00 $0 $0.00 $0 $0.00 $0 $0.00 $0 $0.00 $0 $0.00 $0 $0.00 $0 $0.00 $0
Industry $0.05 $265,000 $0.05 $262,350 $0.05 $259,727 $0.05 $257,129 $0.05 $254,558 $0.05 $252,012 $0.05 $249,492 $0.05 $246,997
Marine $0.50 $850,000 $0.50 $841,500 $0.50 $833,085 $0.50 $824,754 $0.50 $816,507 $0.50 $808,342 $0.50 $800,258 $0.50 $792,256Local Government $0.08 $64,000 $0.08 $62,080 $0.08 $60,218 $0.05 $36,507 $0.05 $35,412 $0.05 $34,349 $0.05 $33,319 $0.05 $32,319
Total $2,004,000 $2,032,180 $2,062,592 $2,118,909 $2,197,042 $2,283,420 $2,366,883 $2,458,091
$1.00 $2,808,715 $5,673,604 $7,517,526 $7,893,402 $8,288,072 $8,619,595 $8,964,379
$0.20 $86,422 $174,572 $231,308 $242,874 $255,018 $265,218 $275,827
$0.50 $1,404,358 $2,836,802 $3,758,763 $3,946,701 $4,144,036 $4,309,797 $4,482,189
$0.35 $5,922,000 $5,444,586 $4,888,028 $4,857,478 $5,100,352 $5,355,370 $5,569,584 $5,792,368
Total Sales, $AUD
$7,926,000 $7,273,548 $6,538,102 $6,446,660 $6,748,133 $7,067,934 $7,344,747 $7,635,936
Lorex $7,138,584 $8,311,921 $9,377,277 $9,839,187 $10,325,278 $10,736,321 $11,164,907
Benefits ($AUD/litre)
Users of Base Oils $0.20
Users of Burner Fuels $0.15 but different quantities
Jul-12 Jul-13 Jul-14 Jul-15Jul-08 Jul-09 Jul-10 Jul-11
Wren/Nationwide (JV)
Blending oil required
Non Mainland Burner Fuel
Sales of Lubricant (Base) OilSales of Spindle+Light
OilPSO Payment for Base Oil
Sales of Mainland Burner Fuel
Wren/Nationwide (JV)


