
Eco Care SolutionsAnnexure
Draft EIA ReportA-1
SNF Flopam India Pvt. Ltd.
Annexure-ITerms of References letter received from SEAC
Eco Care SolutionsAnnexure
Draft EIA ReportA-2
SNF Flopam India Pvt. Ltd.

Eco Care SolutionsAnnexure
Draft EIA ReportA-3
SNF Flopam India Pvt. Ltd.
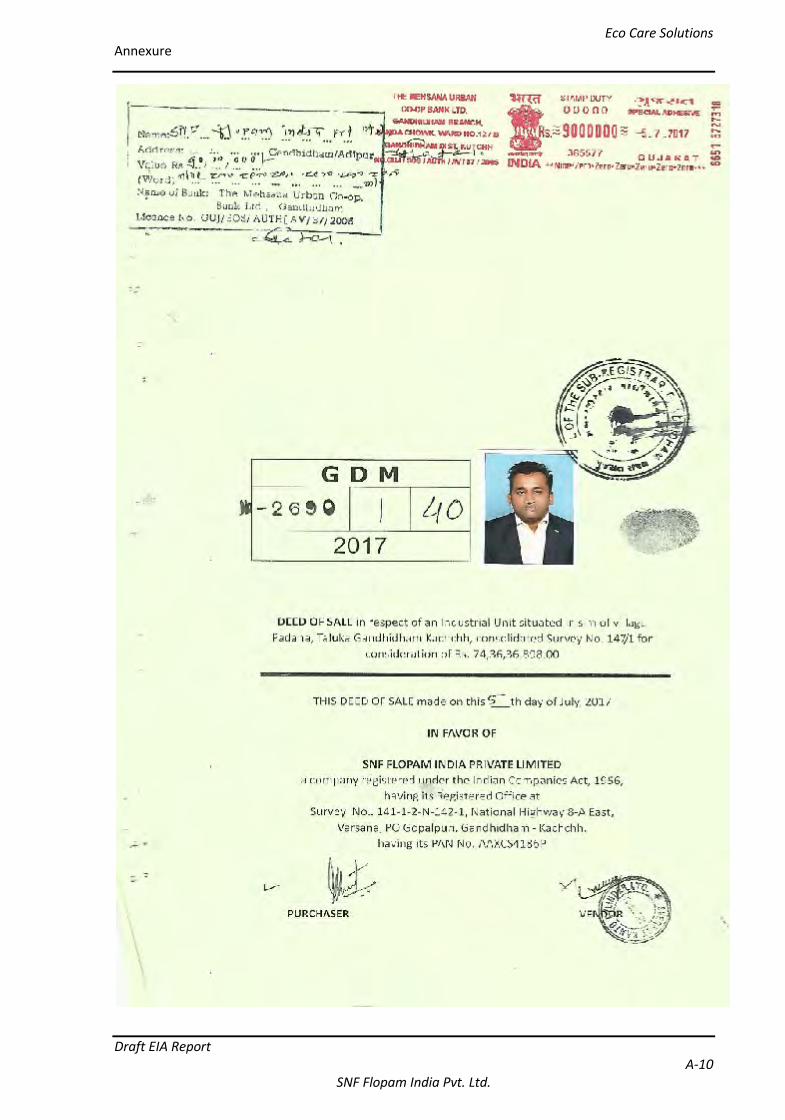
Annexure-IILand Ownership Papers

Eco Care SolutionsAnnexure
Draft EIA ReportA-4
SNF Flopam India Pvt. Ltd.

Eco Care SolutionsAnnexure
Draft EIA ReportA-5
SNF Flopam India Pvt. Ltd.

Eco Care SolutionsAnnexure
Draft EIA ReportA-6
SNF Flopam India Pvt. Ltd.

Eco Care SolutionsAnnexure
Draft EIA ReportA-7
SNF Flopam India Pvt. Ltd.

Eco Care SolutionsAnnexure
Draft EIA ReportA-8
SNF Flopam India Pvt. Ltd.

Eco Care SolutionsAnnexure
Draft EIA ReportA-9
SNF Flopam India Pvt. Ltd.
Eco Care SolutionsAnnexure
Draft EIA ReportA-10
SNF Flopam India Pvt. Ltd.

Eco Care SolutionsAnnexure
Draft EIA ReportA-11
SNF Flopam India Pvt. Ltd.

Eco Care SolutionsAnnexure
Draft EIA ReportA-12
SNF Flopam India Pvt. Ltd.

Eco Care SolutionsAnnexure
Draft EIA ReportA-13
SNF Flopam India Pvt. Ltd.

Eco Care SolutionsAnnexure
Draft EIA ReportA-14
SNF Flopam India Pvt. Ltd.

Eco Care SolutionsAnnexure
Draft EIA ReportA-15
SNF Flopam India Pvt. Ltd.

Eco Care SolutionsAnnexure
Draft EIA ReportA-16
SNF Flopam India Pvt. Ltd.

Eco Care SolutionsAnnexure
Draft EIA ReportA-17
SNF Flopam India Pvt. Ltd.

Eco Care SolutionsAnnexure
Draft EIA ReportA-18
SNF Flopam India Pvt. Ltd.
Annexure-IIIPermission Letter for Water supply
Eco Care SolutionsAnnexure
Draft EIA ReportA-19
SNF Flopam India Pvt. Ltd.

Eco Care SolutionsAnnexure
Draft EIA ReportA-20
SNF Flopam India Pvt. Ltd.

Eco Care SolutionsAnnexure
Draft EIA ReportA-21
SNF Flopam India Pvt. Ltd.

Eco Care SolutionsAnnexure
Draft EIA ReportA-22
SNF Flopam India Pvt. Ltd.
Annexure – IVUndertaking for Greenbelt plantation outside the premises, no borewell dug

Eco Care SolutionsAnnexure
Draft EIA ReportA-23
SNF Flopam India Pvt. Ltd.
Annexure-VMEMBERSHIP CERTIFICATE OF TSDF SITE

Eco Care SolutionsAnnexure
Draft EIA ReportA-24
SNF Flopam India Pvt. Ltd.
Annexure-VIPhotographs of Proposed and Existing Plant Site

Eco Care SolutionsAnnexure
Draft EIA ReportA-25
SNF Flopam India Pvt. Ltd.
Annexure – VIIEnvironment Policy
Eco Care SolutionsAnnexure
Draft EIA ReportA-26
SNF Flopam India Pvt. Ltd.
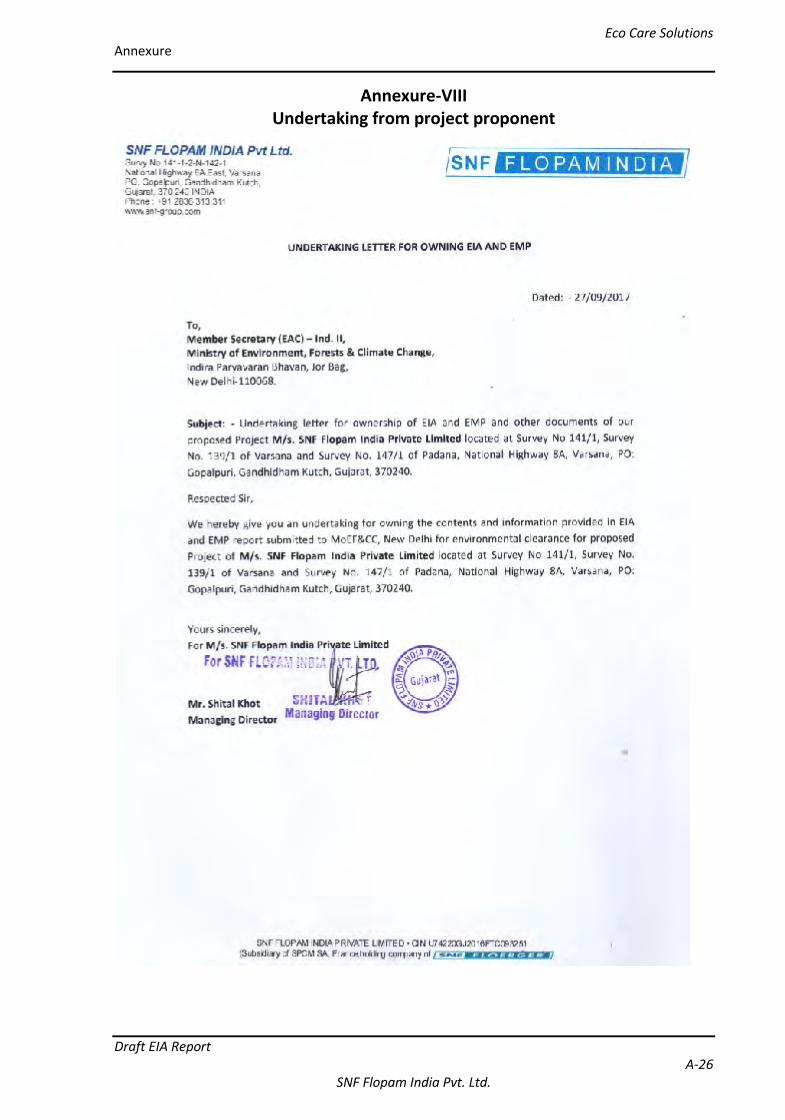
Annexure-VIIIUndertaking from project proponent
Eco Care SolutionsAnnexure
Draft EIA ReportA-27
SNF Flopam India Pvt. Ltd.
Annexure-IXUndertaking from Consultant
Eco Care SolutionsAnnexure
Draft EIA ReportA-28
SNF Flopam India Pvt. Ltd.
Annexure-XGeohydrological Features
A Report on Geo Hydrological & Survey & Investigation for Feasibility study to constructrecharge structure in & around Plant Site of M/s. SNF Flopam India Pvt Ltd at Village:Varsana, Taluka: Anjar, District: Kutchh-
CONTENTS
1. Introduction to the Study Area
2. Geology & Geo Hydrology
3. Recharge into Ground Water Aquifer
4. Conclusions and Recommendations
LIST OF TABLE
SR. NO. TITLE TABLE NO
1 Rainfall Distribution I2 Land Use &Runoff Estimation II3 Size of Recharge pond III4 Specifications for Large Diameter Recharge Percolation Well IV
LIST OF PLATE
SR NO TITLE PLATE NO1 Map showing Location of Kutchh & Gujarat I2 Map showing Location of Anjar, Bachau and Gandhidham Taluka II3 Google Map Showing drainage around Village Varsana III4 Map Showing Location of Site Area IV5 Map Showing Plant Area V6 Map Showing Sardar Sarovar Project Canal Command VI7 Geological Map of Gujarat VII8 Hydrograph of Piezometer at Bhimasar VIII9 Various Recharge Structures IX
10 Recharge Percolation Well X

Eco Care SolutionsAnnexure
Draft EIA ReportA-29
SNF Flopam India Pvt. Ltd.
Chapter I
INTRODUCTION
Preamble
M/s. SNF FLopam India Ltd. is having its industry located at Survey No 141/1/2 and 142/1, S.
no. 139/1 of Varsana and 147/1 of Padana, National Highway 8A, Varsana, PO: Gopalpuri, Ta:
Anjar, Kutch, Gujarat.
The Source of Water supply for this industry is from through surface water from Narmada
Main canal managed by Gujarat Water Infrastructure Ltd. The Site is around 10 km from
Gandhidham and around 20.24 km from Anjar on Nstional Highway. It falls in Sardar Sarovar
Project Canal Command. It is well connected by road through state transport buses and other
private vehicles. The location of Site has been given in Plate I, II, III, IV, V & VI.
The hydro geologic setting plays an important role in determining the degree to which
recharge water can enter into aquifer and can alter the ground water quality in local aquifer
system. The type of soils and their ability to absorb the salts in recharge water and the
hydraulic properties of the aquifer contribute to or reduce salt concentrations.
Measures are needed to enhance recharge to underneath aquifer through appropriate
planning for recharge structure construction with due emphasis on sustainable development
in tune with ecological balance.
The management of this company is very keen to take the measures that are needed to use
surface water economically and judiciously. And take step to recharge rain water through
appropriate planning, & and put emphasis on sustainable development in tune with ecological
balance.
The alert and foresighted Engineers & Management of M/s. SNF Flopam India. Ltd., Village
Varsana, Taluka Anjar Kutch-370240 has entrusted the work pertaining to Geo hydrological
Survey & Investigation in and around this plant site to M/s Eco Care Solutions.
Objective of Present Study
Conducting Geo Hydrological Survey & Investigation in and around the study area of
Project site for having information on Geological Features and assessing Geo
Hydrological status of the Study area”.

Eco Care SolutionsAnnexure
Draft EIA ReportA-30
SNF Flopam India Pvt. Ltd.
Rain water harvesting plan for premises 284615 m2
Site visit for proposed project site
preparation of report
This report presents Hydro Geological and Geo Hydrological condition in and around the
present plant site for checking Feasibility Study for Constructing Recharge Structure.
During this study, earlier work done in and around the present site area on various aspects
such as Geological, Geo Hydrological and Hydro Geological was reviewed. And thereafter,
reconnaissance survey was conducted for collecting the relevant information on general Geo
Hydrological conditions.
Relevant information on ground water conditions with special emphasis on surface water &
ground water flow direction and flow pattern in and around the present study area was
studied.
Water samples were collected and analyzed to have an idea about the present water quality.
Collected & interpreted information was used to Conduct feasibility study for constructing
recharge structure in and around this plant site . Sites were selected for recharge structure
construction. Specification for recharge structure construction and its maintenance were
recommended. Technical Report was prepared covering all these aspects with Conclusions
and Recommendations.
Climate
The climate of this area is dry and pleasant. During the monsoon the humidity of air in general
is high with relative humidity exceeding 80 percent in coastal region over 65 in the interior.
The evaporation and evapotranspiration losses in and around study area is fairly high. I.e.
3000 mm /year.
The Rain fall
is erratic both with respect space, depth and time .Rainfall occurs in stormy pattern resulting
in the bulk of the runoff flowing down The study area receives rainfall mainly from the south
west monsoon Average Rainfall data for Anjar, Bachau& and Gandhidham for the period 2003
to -2012 (10Year) is 478.63 mm which is given in Table I below:
Table I : Rainfall Distribution

Eco Care SolutionsAnnexure
Draft EIA ReportA-31
SNF Flopam India Pvt. Ltd.
Period Anjar Bachau Gandhidham2003to 2012 Rainfall In mm Rainfall In mm Rainfall In mm
Mean 471.6 487.0 477.3
Average Rainfall= 1435.9/3=478.63
Soil
in and around the study area the land is mostly plain where the soil is sandy with clay and
alluvial loam in some parts. The soil at this site is sandy and loamy.
Physiography
The study area comprises of coastal area which is characterized by sand mounds and narrow
plain strip The study area is almost plain with mild slope. The streams flowing in and around
the study area are ephermal and in general flows locally from North West to South East or
more precisely from West to East Plate III

Eco Care SolutionsAnnexure
Draft EIA ReportA-32
SNF Flopam India Pvt. Ltd.
CHAPTER II
GEOLOGY & GROUND WATER CONDITIONS
Geology
The general regional geology has been given in Plate V. Geology in and around the study area
is Alluvium. It is underlain by Weathered shale , sandstone The litho logical logs of nearby
piezometer is given in the Appendix I
Ground Water Conditions
The ground water in and around the study area is mainly confined in unconfined and semi
confined conditions. In general the ground water quality is inferior (saline), except at places
where such wells are located near surface water bodies are yielding relatively good quality
water. The information on wells in and around study area is given in Table IV.
In Unconfined Aquifer the depth to water level below measuring point varies from 8.5 m to
9.70m. (Modavadar)
In Unconfined Aquifer the Total Depth below Ground level is varying from 15.80 m (Modavad)
to16.70m. (Modavadar)
In Semi-confined Aquifer the depth to water level below measuring point varies from 14.40
m(Nani Chirai) to 25.00 m(Varsana).
In Semi-confined Aquifer the Total Depth below Ground level is varying from 22.30 mbgl
(Lunva) to 80.00 mbgl (Padana).
Discharge is ranging from 250lpm to 300lpm.
Available information to gather with reduced water table map of CGWB was studied to
visualize the ground water flow pattern and flow direction on regional scale. From the
observation of this map it is evident that in general, ground water flow follows surface
topography.
It is pertinent to mention that the topography control the both surface as well as Sub surface
Ground water flow path. From the study of this map it is observed that the Ground water flow
direction is from North West to South East or more precisely from north to south. It is in
conformity of regional ground water flow direction and flow pattern.
Ground Water Resources Estimates of Anjar Taluka

Eco Care SolutionsAnnexure
Draft EIA ReportA-33
SNF Flopam India Pvt. Ltd.
From the ground water resources point of view Anjar and Bachau Taluka of Kutch district falls
in over exploited category. The present stage of ground water development is more than 100
(%).
And Gandhidham taluka falls in saline category.
(As per the Report of Committee on Estimation of Ground Water Resources and Irrigation
Potential of ground water in Gujarat, Narmada Water Resources Water Supply and Kalpasar
Department, Government of Gujarat on March 2002 )
The study area falls in Narmada canal command Plate.
Source of Water
There are two main water sources of water around the study area viz.
(a) Surface water / Narmada canal water,
(b) Ground water.
Water requirement at project site
Total daily water requirement at project site will be around 8 kilo liter per day
Assuming 300 working days, total yearly water requirement at project site will be around 2400
kiloliter per year
Waste Water generation at project site
Total daily waste water generation at project site will be around 2.5 kiloliter per day
Assuming 300 working days, total yearly waste water generation water requirement at project
site will be around 750 kiloliter per year
Treated waste water will be finally evaporated in evaporation pan and thus the plant will
maintain zero discharge.

Eco Care SolutionsAnnexure
Draft EIA ReportA-34
SNF Flopam India Pvt. Ltd.
Chapter III
RECHARGE IN TO GROUND WATER AQUIFER
As mentioned above From the ground water resources point of view Anjar and Bachau
Taluka of Kutch district falls in over exploited category. The present stage of ground water
development is more than 100 (%).And Gandhidham taluka falls in saline category.
Anjar,Bhachau & Gandhidham Talukas of Kachchh District are hard core drought prone area
where occurrence of droughts is frequent.
Water requires to be treated as precious commodity. It is the single resources limiting the
economic development of the region.
The rain fall is erratic both with respect space, depth and time.
Rainfall occurs in stormy pattern that results in the bulk of the runoff flowing down the sea
or the Rann.
About 94.07% of annual rainfall is received during monsoon season.
Therefore water should be used economically and judiciously. There is scope to conserve
water through constructing recharge structures to recharge aquifer and rain water harvesting
structure at feasible site. Experience indicates that it can yields good results.
Rainfall is one of the important Parameters that contribute water for recharging ground water
aquifer and therefore estimation on likely Runoff quantum (Runoff Volume) is of prime
importance.
The Rainfall Data for the period 2003 to 2012 (10Year) as given in Table 4 and Land Use data
as given Table 5 below is used in estimating the likely Runoff quantum . The Average Rainfall
for Last 10 year for the Period 2003 -2012 is 478.63.
From the study it is inferred that there is availability of underground space for storing
recharged water if given opportunity. Opportunities may be created by planning for rainwater
harvesting. The application of concept of availability and opportunity has been given thought.
Recharged Rain water after mixing with aquifer water may likely to dilute and improve the
aquifer water quality.
Table II
Land Use &Runoff Estimation
Serialno
Land Use Built upArea in m2
Runoffcoefficient
Rainfallin mm
Runoff Volumein m3

Eco Care SolutionsAnnexure
Draft EIA ReportA-35
SNF Flopam India Pvt. Ltd.
I Manufacturing Facilities 34726 0.85 479 14138.692 Storage of raw material 5670 0.85 479 2308.5413 Other built area 9246 0.85 479 3764.5094 Utilities /ETP Area 500 203.5755 Undeveloped area 136421 0.80 479 39207.46 Green Area 94000 0.40 479 22513Total Sub Total (I)+ (II) 82135.715
Using applicable norms of runoff coefficient based on the land use, the estimated effective
runoff likely to be available is given in above Table II.
Planning for Alternative dependable water supply source through ground water pumping
during extreme emergency.
Water requirement of this plant is met through surface water supply through Narmada Main
Canal. However, during the maintenance period of this canal, disruption in continuous water
supply is likely which may likely to hamper production. As stand by dependable water supply
source during extreme emergency ground water pumping is given consideration
At this plant site, 2910 Kiloliter water per day is required which is supplied from Narmada
Canal.
Out of this, per day 245 Kiloliter treated water is reused for gardening.
Assuming 300 working days, yearly surface water requirement is around 873000 m3 per year.
Probable recharge from premsies shall be 82136 m3
Looking to the availability of ample open Land around present plant site and land use there in
, it may be possible to recharge more quantity of rainwater quantum in to underneath ground
water aquifer by constructing suitable recharge structure as described and shown in Plate IX
& X.
Rain Water Harvesting
It is the deliberate attempt for collecting /concentrating, storing and distributing rain water.
The method is site specific and need based. Catchments includes Roof top, Compounds and
pavements, land surface , Impervious / semi pervious surface etc.
At this plant site This can be done by Recharge Structures like
Roof Top Harvesting
Recharge Pond and/or
Recharge Pit
Recharge Well,

Eco Care SolutionsAnnexure
Draft EIA ReportA-36
SNF Flopam India Pvt. Ltd.
If plan properly and designed scientifically it may aid in improving the recharge availability and
opportunity. Recharge structure construction work apparently appears to be expensive.
Even this roof top rain water harvesting structure is planned to store rainwater which can be
subsequently used for daily consumption as it is of good quality.
Various recharge structures are shown in Plate IX
Recharge Pond
Table III
Size of Recharge pond
Sr. No Length inm
Width in m Depth inm
Volume of water likely tobe stored in m3
1 10 10 5 5002 15 15 5 1125
Looking to the surface soil condition and sub-surface aquifer characteristics, it is better to
construct Recharge pond to have better recharge rate because rate of recharge is a function
of surface area, time and depth of water column. Evaporation is optimum at 2 m water
column depth. By increasing the pond depth (>2m) thee is there is likely reduction in
evaporation. Therefore, depth of recharge pond should be more than 2 mtr reduce the
evaporation
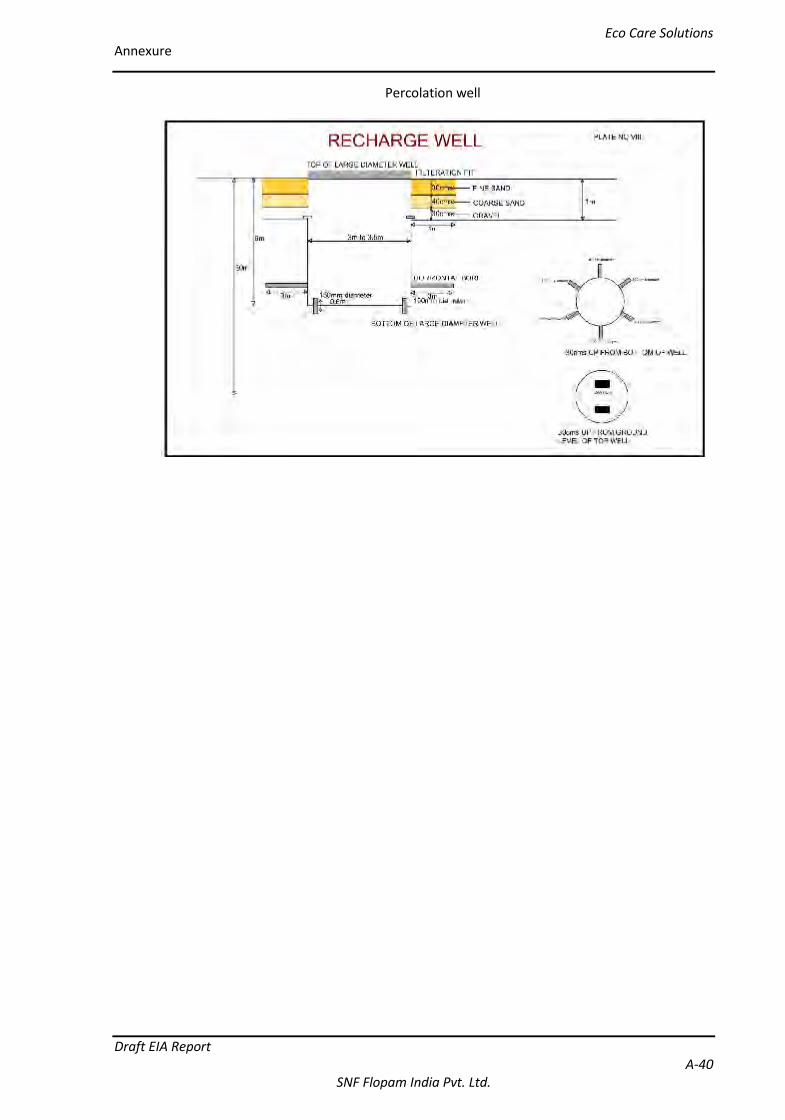
Percolation Well
Based on the local hydro geological conditions Large Diameter Recharge Percolation Well
appears to be feasible. The figure of Recharge well is given in Plate X and Specifications for
Recharge well construction are given below in Table IV.
Table IV
Specifications for large diameter well around tube well
Diameter 3 to 3.5 mDepth 6 to 8 m below ground levelDiameter of Horizontal bores
in the sides of large diameter well4 or 6 inch (100mmto 150mm)
Length of Horizontal bores 1 to 3 meter
Chapter IV
Conclusions and Recommendations

Eco Care SolutionsAnnexure
Draft EIA ReportA-37
SNF Flopam India Pvt. Ltd.
The Source of Water supply for this industry is through Narmada Main canal by Gujarat
Water Infrastructure Ltd. The Site is Hardly 20 km from Gandhidham and around 20 km from
Anjar on state high way..
The climate of this area is dry and pleasant.
The rain fall is erratic both with respect space and time .Rainfall occurs in stormy pattern
resulting in the bulk of the runoff flowing down the sea.
The annual average rainfall of the study area is very low. The Average Long term rainfall for
the period (2003-2012) is 479 mm
In and around the study area of Varsana , the land is mostly plain The soil at this site is sandy
and loamy.
Geology in and around the study area is Alluvium. It is underlain by Weathered shale ,
sandstone
The general regional geology comprises Jurassic of Kutchh i.e. Sandstone, shale& siltstone.
The ground water in and around the study area is mainly confined in unconfined and semi
confined conditions.
From the ground water resources point of view Anjar Taluka of Kutch district falls in over
exploited category where ground water development is more than 100 percent.
The study area falls in Narmada canal command. In Anjar Taluka, There are two main
sources for water availability in and around study area viz. (a) Surface water / Narmada canal
water, (b) Ground water.
Total Land Area of plant is 6000 m2.
Total estimated Effective Runoff likely to be available from Plant Site Area is around 1621.42
m3
Water requirement of this plant is met through surface water supply through Narmada Main
Canal. However, during the maintenance period of this canal, disruption in continuous water
supply is likely which may likely to hamper production. As stand by dependable water supply
source during extreme emergency ground water pumping is given consideration
At this plant site, 8.0 Kiloliter water per day is required which is supplied from Narmada
Canal. Assuming 300 working days, yearly surface water requirement is around 2400 m3 per
year
Treated effluent will be finally Evaporated in Evaporation pan with zero effluent discharge
It is assumed 30 days maintenance period of canal/and or disruption phase of surface water
supply during each year and during this period as a stand by dependable water supply
source ground water pumping is planned .

Eco Care SolutionsAnnexure
Draft EIA ReportA-38
SNF Flopam India Pvt. Ltd.
The required water supply from ground source during this period of 30 days will be =8.0
m3/day x30 day=240 m3/year
As this Taluka fall in over exploited category, the required rain water to be recharged into
ground water aquifer will be 2.0 times the ground water quantity pumped i.e 8.0 m3/day
x30 day=240 m3/year x2.0 =480 Kiloleter /year)
Looking to the availability of open Land around present plant site and land use there in , it
may be possible to recharge more quantity of rainwater quantum in to underneath ground
water aquifer by constructing suitable recharge structure as described and shown in Plate IX
& X
Appendix I
LITHO LOGICAL LOG OF NEAR BY BORE HOLES OF SITE AREA
Village : Bhimasar
Taluka : Anjar District : Kutch
Depth To Lithology Colour Texture Shape4 Top Soil Brown medium Rounded
11 Sand reddish white medium tocoarse
Rounded
15 Clay Brown fine to medium Rounded21 Sand pale white fine to medium Rounded25 Clay light brown fine to medium Rounded39 Sand reddish brown fine to medium rounded to
subrounded66 Clay with
SandstoneYellow Fine Rounded

Eco Care SolutionsAnnexure
Draft EIA ReportA-39
SNF Flopam India Pvt. Ltd.
BHIMASAR
Village : Moti Chira , Taluka: Anjar,
District: Kutch
Depth To Lithology Colour Texture5 Topsoil Red medium to coarse
10 Sand + Clay White Coarse16 Clay Yellow fine to medium35 Sand + clay red and white coarse to meduim42 Clay with Sand Yellow fine to medium
Water Level Range in m 11TO18
TDS Range in PPM 9000-18900
Eco Care SolutionsAnnexure
Draft EIA ReportA-40
SNF Flopam India Pvt. Ltd.
Percolation well

Eco Care SolutionsAnnexure
Draft EIA ReportA-41
SNF Flopam India Pvt. Ltd.
Plate I Gujarat and Kutch Map
Plate 2 Anjar, Bachau and Gandhidham Taluka

Eco Care SolutionsAnnexure
Draft EIA ReportA-42
SNF Flopam India Pvt. Ltd.

Eco Care SolutionsAnnexure
Draft EIA ReportA-43
SNF Flopam India Pvt. Ltd.
Plate 3 Google Map Showing drainage around Village Varsana
Plate 4 Map Showing Location of Site Area
Eco Care SolutionsAnnexure
Draft EIA ReportA-43
SNF Flopam India Pvt. Ltd.
Plate 3 Google Map Showing drainage around Village Varsana
Plate 4 Map Showing Location of Site Area
Eco Care SolutionsAnnexure
Draft EIA ReportA-43
SNF Flopam India Pvt. Ltd.
Plate 3 Google Map Showing drainage around Village Varsana
Plate 4 Map Showing Location of Site Area

Eco Care SolutionsAnnexure
Draft EIA ReportA-44
SNF Flopam India Pvt. Ltd.
Plate 5 Map Showing Plant Area

Eco Care SolutionsAnnexure
Draft EIA ReportA-45
SNF Flopam India Pvt. Ltd.
Plate 6 Map Showing Sardar Sarovar Project Canal Command

Eco Care SolutionsAnnexure
Draft EIA ReportA-46
SNF Flopam India Pvt. Ltd.
Plate 7 Geological Map of Gujarat

Eco Care SolutionsAnnexure
Draft EIA ReportA-47
SNF Flopam India Pvt. Ltd.
Plate 8 Hydrograph of Piezometer at Bhimasar

Eco Care SolutionsAnnexure
Draft EIA ReportA-48
SNF Flopam India Pvt. Ltd.
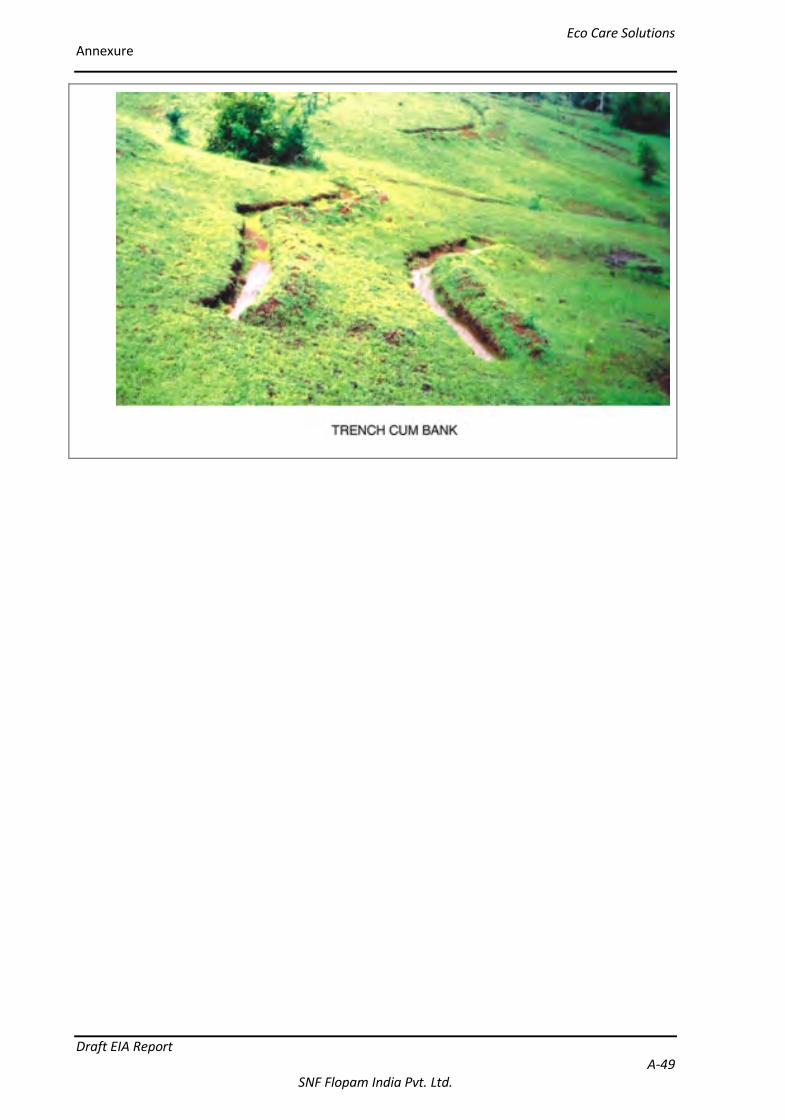
Plate 9 Various Recharge Structures
Eco Care SolutionsAnnexure
Draft EIA ReportA-49
SNF Flopam India Pvt. Ltd.

Eco Care SolutionsAnnexure
Draft EIA ReportA-50
SNF Flopam India Pvt. Ltd.
Plate 10 Recharge Percolation Well

Eco Care SolutionsAnnexure
Draft EIA ReportA-51
SNF Flopam India Pvt. Ltd.
Annexure XIToposheet

Eco Care SolutionsAnnexure
Draft EIA ReportA-52
SNF Flopam India Pvt. Ltd.
Annexure XIIMeterological Data
DIR SPD DIR SPD DIR SPD DIR SPD DIR SPD DIR SPD
01 NNW 006 SW 014 WSW 016 SW 022 W 010 WSW 018
02 NW 012 SW 010 WSW 016 SW 020 SW 012 WSW 024
03 NW 010 SW 006 W 012 W 016 WSW 012 WSW 026
04 NW 010 SW 004 WSW 010 WSW 028 WSW 012 SW 022
05 NNW 008 NW 004 WSW 014 SW 028 WSW 004 SW 022
06 NE 004 SW 012 SW 012 WSW 024 WSW 014 SW 022
07 WNW 004 NW 006 WSW 006 SW 012 SW 020 WSW 022
08 WSW 006 SW 020 NNW 012 NNE 008 W 008 WSW 024
09 SW 006 SW 018 NNE 012 NE 012 SW 024 SW 024
10 SW 012 SW 010 NNW 004 NNE 004 SW 012 SW 024
11 NW 014 SW 014 NNW 012 NE 006 WSW 012 SW 022
12 NNW 004 SW 006 NW 012 SW 012 WSW 008 SW 022
13 NNW 008 N 010 CALM 000 SW 012 CALM 000 SW 022
14 NNE 006 NE 006 SW 012 SW 014 WSW 006 WSW 024
15 NE 006 NNE 006 SW 012 SW 024 W 010 W 026
16 NNE 006 SSW 012 SW 018 SW 012 WSW 012 WSW 028
17 NNW 006 SW 016 W 006 W 018 WSW 012 SW 022
18 WSW 006 SW 028 WSW 006 SW 012 WSW 020 SW 026
19 WSW 010 SW 016 SW 012 SW 016 SW 020 SW 022
20 CALM 000 CALM 000 SW 024 SW 028 SW 024 SW 024
21 CALM 000 NNW 008 SW 020 SW 022 WSW 020 WSW 024
22 WNW 004 SW 012 SW 016 SW 024 SW 012 SW 022
23 WNW 004 SW 020 SW 016 SW 022 WSW 012 SW 024
24 NNE 004 SSW 014 SW 016 WSW 022 SW 020 SW 028
25 WSW 010 SW 016 WNW 006 SW 022 WSW 022 SW 028
26 WSW 004 SSW 018 WSW 008 SW 020 WSW 016 WSW 020
27 CALM 000 W 014 WSW 012 SW 022 WSW 022 SW 024
28 NW 004 SW 012 WSW 012 SW 024 SW 022 SW 028
29 WSW 006 SW 014 WSW 006 SW 024 WNW 014 W 018
30 WSW 008 SW 018 WSW 010 SW 028 WSW 012 SW 022
31 WSW 014 SW 020 SW 016 SW 030
LEGEND: - VRB= VARIABLE SPD= WIND SPEED
▼▼▼ MONTH▼▼▼
APRIL MAY
YEAR : 2017STATION: NEW KANDLA
ELEMENTS: - (1) WIND DIRECTION & (2) WIND SPEED REPORTED IN KMPH
METEOROLOGICAL CENTRE, AHMEDABAD
DAILY METEOROLOGICAL DATA
1730 HRS ISTDATE
0830 HRS IST 1730 HRS IST 0830 HRS IST 1730 HRS IST 0830 HRS IST
MARCH

Eco Care SolutionsAnnexure
Draft EIA ReportA-53
SNF Flopam India Pvt. Ltd.
0830 HRSIST
1730 HRSIST
0830 HRSIST
1730 HRSIST
0830 HRSIST
1730 HRSIST
1 079 062 090 063 093 0672 080 066 087 051 083 0423 080 031 080 049 083 0584 041 026 089 060 082 0565 065 028 089 050 073 0526 064 020 082 039 079 0607 084 033 059 034 081 0358 079 048 050 013 074 0339 088 046 041 021 082 052
10 087 047 042 022 080 06511 042 033 039 026 081 06312 053 029 033 017 081 05813 061 027 032 020 065 05514 063 033 072 023 079 06515 065 032 084 024 073 06416 049 038 084 029 079 06117 064 063 076 029 080 06118 085 068 086 032 077 06119 095 067 080 057 080 05220 083 063 085 061 075 05921 053 027 076 055 076 06022 067 044 076 053 072 05323 083 053 076 058 073 05724 060 046 076 053 080 05825 088 041 078 046 076 06326 078 055 076 056 076 06627 065 053 080 054 075 06528 056 054 087 068 073 06529 082 056 078 072 073 06330 088 063 083 068 076 06031 087 045 079 056
DATE
▼▼▼ MONTH▼▼▼
MARCH
METEOROLOGICAL CENTRE , AHMEDABAD.
DAILY METEOROLOGICAL DATA
STATION: - NEW KANDLA
APRIL MAY
YEAR: - 2017
ELEMENT: - RELATIVE HUMIDITY IN %

Eco Care SolutionsAnnexure
Draft EIA ReportA-54
SNF Flopam India Pvt. Ltd.
0830 HRSIST
1730 HRSIST
0830 HRSIST
1730 HRSIST
0830 HRSIST
1730 HRSIST
1 0 0 0 0 0 02 0 0 0 0 0 03 0 0 5 0 5 04 0 0 0 0 0 05 0 0 6 0 7 06 0 0 0 0 0 07 0 1 0 0 0 08 0 0 0 0 0 09 0 1 0 0 0 0
10 0 0 0 0 4 011 0 0 0 0 2 012 0 1 0 0 0 013 0 0 0 0 0 014 0 0 0 0 0 015 0 0 0 0 0 016 0 0 0 0 1 017 0 0 0 0 0 018 0 0 0 0 0 019 0 0 1 0 0 020 0 0 0 0 0 021 0 0 0 0 1 022 0 0 0 0 1 023 0 0 2 0 1 024 0 0 2 0 0 025 0 0 5 0 0 026 0 0 0 0 1 027 0 0 0 0 1 028 0 0 1 0 1 029 0 0 0 0 2 030 0 0 0 0 2 031 0 0 2 0
YEAR: - 2017
DATE
ELEMENT: - CLOUD COVERAGE IN OKTAS
METEOROLOGICAL CENTRE , AHMEDABAD.
DAILY METEOROLOGICAL DATA
▼▼▼ MONTH▼▼▼
MARCH APRIL MAY
STATION: - NEW KANDLA

Eco Care SolutionsAnnexure
Draft EIA ReportA-55
SNF Flopam India Pvt. Ltd.
01 35.8 21.6 000.0 35.4 23.8 000.002 34.1 21.0 000.0 34.6 24.3 000.003 34.2 18.9 000.0 36.2 25.5 000.004 34.5 20.0 000.0 36.8 25.5 000.005 34.1 19.5 000.0 36.6 26.0 000.006 34.0 17.5 000.0 35.8 24.5 000.007 35.0 20.0 000.0 33.9 17.9 000.008 33.3 21.0 000.0 34.1 19.0 000.009 32.3 20.7 000.0 37.8 20.6 000.010 31.3 20.1 000.0 40.1 21.6 000.011 31.1 17.6 000.0 42.3 23.1 000.012 30.9 16.5 000.0 43.5 24.2 000.013 30.6 15.2 000.0 44.5 24.3 000.014 30.1 15.6 000.0 44.6 25.0 000.015 34.7 19.4 000.0 45.1 24.4 000.016 36.1 20.5 000.0 42.7 24.1 000.017 37.5 21.9 000.0 38.5 24.0 000.018 33.6 22.2 000.0 38.9 24.5 000.019 34.3 22.5 000.0 37.1 25.6 000.020 34.7 20.5 000.0 35.3 26.2 000.021 35.1 20.5 000.0 36.1 26.1 000.022 38.6 21.9 000.0 38.4 26.0 000.023 33.3 20.6 000.0 38.2 26.0 000.024 34.7 21.8 000.0 36.5 26.0 000.025 36.3 20.5 000.0 35.9 25.6 000.026 35.3 22.0 000.0 34.7 25.4 000.027 36.8 23.6 000.0 37.3 25.0 000.028 37.1 24.6 000.0 37.4 25.5 000.029 38.4 23.9 000.0 33.5 25.7 000.030 38.1 23.0 000.0 33.5 25.6 000.031 34.6 23.8 000.0
MAXIMUMTEMPERATURE IN
DEG C
MINIMUMTEMPERATURE
IN DEG C
TOTALRAINFALL
in mm
MAXIMUMTEMPERATURE
IN DEG C
MINIMUMTEMPERATURE
IN DEG C
TOTALRAINFALL
in mm
METEOROLOGICAL CENTRE, AHMEDABAD
DAILY METEOROLOGICAL DATA
STATION: - NEW KANDLA YEAR: - 2017
DATE
MONTH
▼ ▼ ▼ ▼
MARCH APRIL

Eco Care SolutionsAnnexure
Draft EIA ReportA-56
SNF Flopam India Pvt. Ltd.
01 35.5 25.1 000.0 ---- ---- ----02 36.1 25.1 000.0 ---- ---- ----03 40.6 27.0 000.0 ---- ---- ----04 37.1 25.4 000.0 ---- ---- ----05 38.1 25.5 000.0 ---- ---- ----06 37.3 24.4 000.0 ---- ---- ----07 35.8 26.2 000.0 ---- ---- ----08 39.7 27.0 000.0 ---- ---- ----09 39.5 27.4 000.0 ---- ---- ----10 38.3 28.0 000.0 ---- ---- ----11 37.1 27.5 000.0 ---- ---- ----12 38.4 26.0 000.0 ---- ---- ----13 37.6 25.5 000.0 ---- ---- ----14 39.1 26.4 000.0 ---- ---- ----15 38.7 26.0 000.0 ---- ---- ----16 38.2 27.0 000.0 ---- ---- ----17 38.1 27.3 000.0 ---- ---- ----18 37.9 28.0 000.0 ---- ---- ----19 37.8 27.9 000.0 ---- ---- ----20 38.5 27.6 000.0 ---- ---- ----21 37.5 28.4 000.0 ---- ---- ----22 37.1 28.2 000.0 ---- ---- ----23 38.6 27.6 000.0 ---- ---- ----24 37.3 28.0 000.0 ---- ---- ----25 38.8 28.5 000.0 ---- ---- ----26 36.3 28.2 000.0 ---- ---- ----27 36.3 28.8 000.0 ---- ---- ----28 36.9 29.4 000.0 ---- ---- ----29 37.2 29.4 000.0 ---- ---- ----30 37.1 28.9 000.0 ---- ---- ----31 38.4 29.1 000.0 ---- ---- ----
TOTALRAINFALL
in mm
MAXIMUMTEMPERATURE
IN DEG C
MINIMUMTEMPERATURE
IN DEG C
TOTALRAINFALL
in mm
DAILY METEOROLOGICAL DATA
STATION: - NEW KANDLA YEAR: - 2017
DATE
MONTH
▼ ▼ ▼ ▼
MAY JUNE
MAXIMUMTEMPERATURE IN
DEG C
MINIMUMTEMPERATURE
IN DEG C
METEOROLOGICAL CENTRE, AHMEDABAD

Eco Care SolutionsAnnexure
Draft EIA ReportA-57
SNF Flopam India Pvt. Ltd.
Annexure XIIITraffic Survey Data
Traffic count towards Bimasar
The 24 hours, hourly survey has been carried out. The details of the traffic is as per the below table.
TRAFFIC SURVEY: TOWARDS BimasarTime Bicycle 2 Wheeler Auto Car Bus/Truck LCV Others PCU/Hour
8th April 20179:00 to 10:00 2 32 20 122 97 145 0 652.810:00 to 11:00 0 36 12 108 72 140 0 53211:00 to 12:00 0 90 18 187 133 154 3 869.112:00 to 13:00 0 85 19 123 225 190 0 1125.513:00 to 14:00 1 91 09 101 214 130 0 979.914:00 to 15:00 1 58 21 166 250 97 2 1105.215:oo to 16:00 0 48 18 180 250 115 0 113316:00 to 17:00 0 65 12 162 240 120 0 1094.517:00 to 18:00 1 30 10 184 215 160 1 1079.918:00 to 19:00 0 46 22 121 175 140 0 88719:00 to 20:00 0 32 17 173 255 240 0 110420:00 to 21:00 0 45 20 182 227 95 1 104021:00 to 22:00 0 33 10 140 181 105 0 856.522:00 to 23:00 0 13 20 110 160 127 0 79423:00 to 0:00 0 20 05 108 181 142 0 864.8
9th April 20170:00 to 1:00 0 13 03 48 145 132 0 677.31:00 to 2:00 0 30 18 83 131 61 0 594.42:00 to 3:00 0 21 38 63 178 67 0 739.33:00 to 4:00 0 14 20 86 80 72 0 413.24:00 to 5:00 0 10 12 120 117 60 0 5725:00 to 6:00 0 18 10 170 90 43 0 519.26:00 to 7:00 1 38 11 188 150 103 1 814.17:00 to 8:00 2 46 20 160 132 151 2 814.28:00 to 9:00 2 76 47 190 156 130 0 925.8

Eco Care SolutionsAnnexure
Draft EIA ReportA-58
SNF Flopam India Pvt. Ltd.
Traffic count towards VARSANA
TRAFFIC SURVEY: TOWARDS VARSANATime Bicycle 2 Wheeler Auto Car Bus/Truck LCV Others PCU/Hour
8th April 20179:00 to 10:00 1 45 31 115 134 85 3 694.410:00 to 11:00 1 47 40 255 86 103 2 724.111:00 to 12:00 0 120 46 260 197 190 1 1224.512:00 to 13:00 0 55 50 117 92 74 2 577.113:00 to 14:00 0 70 60 145 162 130 1 909.514:00 to 15:00 1 95 85 255 167 140 1 1086.415:00 to 16:00 0 60 35 217 145 121 2 889.416:00 to 17:00 0 47 64 185 148 114 3 880.617:00 to 18:00 0 156 34 240 135 125 4 93818:00 to 19:00 0 120 68 255 180 136 0 1113.419:00 to 20:00 0 32 40 165 171 150 0 94420:00 to 21:00 0 70 60 210 215 167 0 1183.821:00 to 22:00 0 76 70 101 210 155 1 1057.522:00 to 23:00 0 30 26 92 217 197 2 1062.823:00 to 0:00 0 37 13 85 165 160 0 835.5
9th April 20170:00 to 1:00 0 35 13 90 123 120 0 657.51:00 to 2:00 0 30 35 55 131 85 0 6172:00 to 3:00 0 10 17 46 90 92 0 466.83:00 to 4:00 0 26 12 85 95 89 0 519.64:00 to 5:00 0 20 05 110 122 105 0 6385:00 to 6:00 0 25 06 60 150 97 1 665.86:00 to 7:00 0 10 10 73 163 125 1 753.57:00 to 8:00 0 38 35 110 175 150 2 9028:00 to 9:00 0 35 60 195 187 160 0 1057.5

Eco Care SolutionsAnnexure
Draft EIA ReportA-59
SNF Flopam India Pvt. Ltd.
Traffic count towards MODVADAR
TRAFFIC SURVEY: Towards MODVADARTime Bicycle 2 Wheeler Auto Car Bus/Truck LCV Others PCU/Hour
8th April 20179:00 to 10:00 2 8 10 8 2 0 1 30.310:00 to 11:00 2 9 5 10 2 0 0 26.311:00 to 12:00 1 12 11 15 1 0 0 35.412:00 to 13:00 0 7 8 11 1 0 0 25.513:00 to 14:00 1 5 12 7 3 0 2 33.914:00 to 15:00 0 6 9 5 1 0 1 21.515:00 to 16:00 0 3 15 8 2 0 1 3216:00 to 17:00 2 8 16 10 1 0 2 36.817:00 to 18:00 1 9 10 8 3 0 0 31.918:00 to 19:00 2 7 8 7 1 0 1 23.819:00 to 20:00 0 5 6 3 1 0 0 14.520:00 to 21:00 0 6 3 8 0 0 0 1421:00 to 22:00 0 3 5 5 1 0 1 1622:00 to 23:00 0 8 2 3 2 0 0 1523:00 to 0:00 0 2 0 5 0 0 0 6
9th April 20170:00 to 1:00 0 1 3 6 0 0 0 9.51:00 to 2:00 0 0 0 0 0 0 0 02:00 to 3:00 0 0 0 3 0 0 0 33:00 to 4:00 0 0 0 0 0 0 1 1.54:00 to 5:00 0 3 5 0 0 0 0 6.55:00 to 6:00 2 5 3 5 2 0 0 17.36:00 to 7:00 1 10 8 8 1 0 0 29.47:00 to 8:00 3 16 12 10 4 1 2 47.78:00 to 9:00 1 18 15 12 3 0 1 46.9

Eco Care SolutionsAnnexure
Draft EIA ReportA-60
SNF Flopam India Pvt. Ltd.
Traffic count towards CHIRAI MOTITRAFFIC SURVEY: TOWARDS Chirai Moti
Time Bicycle 2 Wheeler Auto Car Bus/Truck LCV Others PCU/Hour8th April 2017
9:00 to 10:00 1 15 8 18 3 0 1 44.410:00 to 11:00 2 18 14 12 1 0 0 38.811:00 to 12:00 0 12 11 10 4 0 0 3912:00 to 13:00 0 8 7 17 1 0 2 3413:00 to 14:00 1 6 5 8 2 0 1 23.914:00 to 15:00 0 4 8 10 0 0 0 2015:00 to 16:00 0 8 10 13 1 1 0 31.416:00 to 17:00 0 12 14 11 2 0 0 3717:00 to 18:00 2 11 13 8 2 0 2 39.818:00 to 19:00 2 10 9 15 3 0 1 40.319:00 to 20:00 0 7 5 7 2 0 1 2320:00 to 21:00 0 5 3 8 0 0 1 1521:00 to 22:00 1 7 5 5 1 0 1 18.422:00 to 23:00 0 3 0 4 2 0 0 11.523:00 to 0:00 0 0 0 1 0 0 0 1
9th April 20170:00 to 1:00 0 0 1 2 0 0 0 31:00 to 2:00 0 0 0 0 0 0 0 02:00 to 3:00 0 0 0 0 0 0 0 03:00 to 4:00 0 0 0 0 0 0 1 1.54:00 to 5:00 0 0 1 1 0 0 0 25:00 to 6:00 0 3 5 3 2 0 0 15.56:00 to 7:00 2 10 8 8 2 1 0 29.27:00 to 8:00 2 15 9 14 3 0 2 43.38:00 to 9:00 3 11 13 18 4 0 1 51.2


