
Austin Real Estate Data Scrappy, Analysis and Interactive Visualization
Xiaoyu Qian (UT ORIE)
Daqi Xu (UT ME)
Chunqi Wang (UT ME)
November 17 2015
Advisor: Dr. Ned Dimitrov
Computational Optimization
Outline
• Data Acquisition (scrapy, pandana)
• Analysis and Prediction(sklearn, xgboost)
• Interactive Visualization (Bokeh)
2

Data Acquisition
• Zestimate® home value
• Elements influence price• Geography
• Size
3
http://www.zillow.com/howto/DataCoverageZestimateAccuracyTX.htm

Data Acquisition
• Zillow.com (Scrapy)
4
• Geography• Latitude• Longitude• Zip Code• Address
• House• Area• Bathroom• Bedroom• Price
http://www.zillow.com/homes/for_sale/Austin-TX-78731_rb/

Data Acquisition
• OpenStreetMap API (Pandana)
5
★supermarket★ restaurant
★hospital★ bar ★ schoolDistance to The Closest Hospital Near Austin (m)

Analysis and Prediction
• Preprocessing• Format
• data.bedrooms =“stuido” -> 1 ;
• data.price = “132K” -> 132000;
• Data.price = 495000+ -> 495000;
• Missing Value
• Clustering:• Location
• Size
• Amanities
6

Analysis and Prediction
• Model• Linear Regression
• Random Forest Tree
• Xgboost
7

Analysis and Prediction
• Tuning Parameters• GridSearch
8
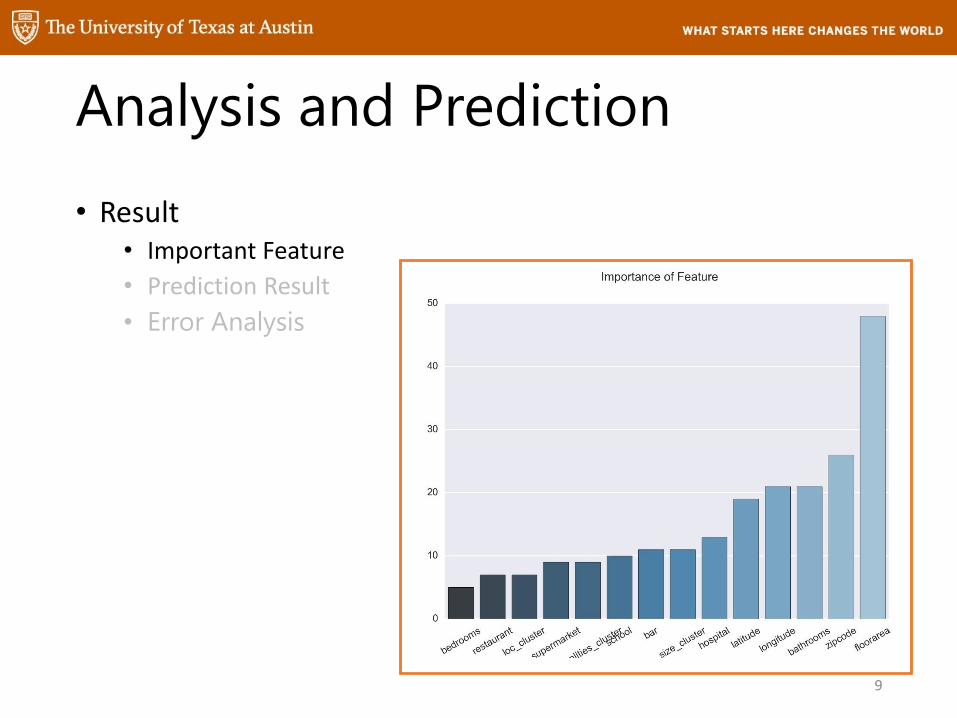
Analysis and Prediction
• Result• Important Feature
• Prediction Result
• Error Analysis
9
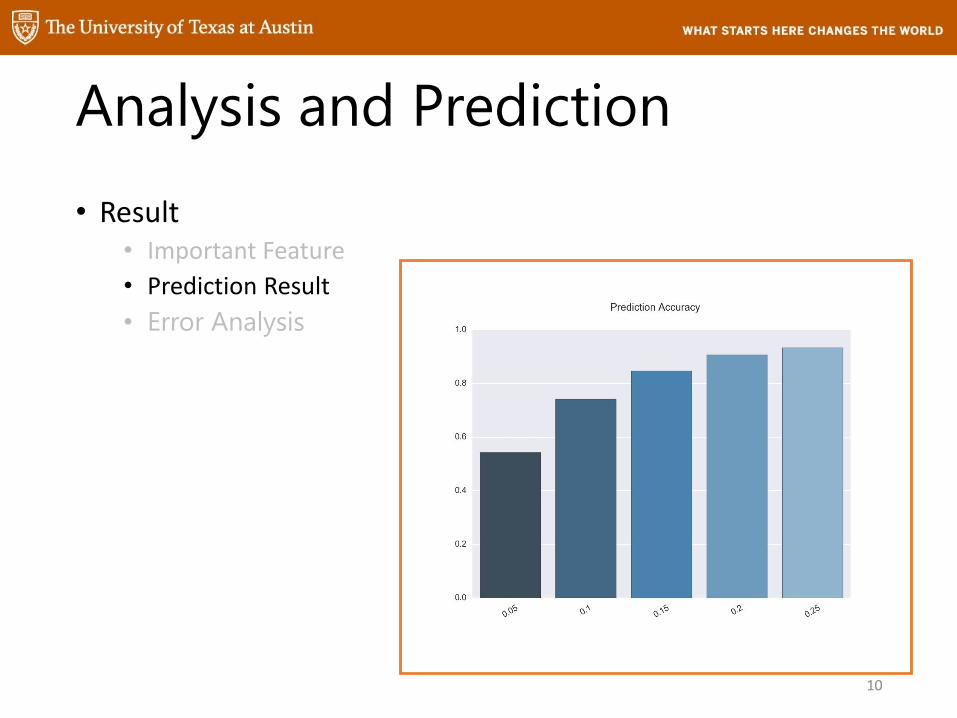
Analysis and Prediction
• Result• Important Feature
• Prediction Result
• Error Analysis
10

Analysis and Prediction
• Result• Important Feature
• Prediction Result
• Error Analysis
11

Visualization
• Key for a good data report:• Effective
• Attractive
• Comprehensive
• Interactive report• Interesting
• One-for-All
12
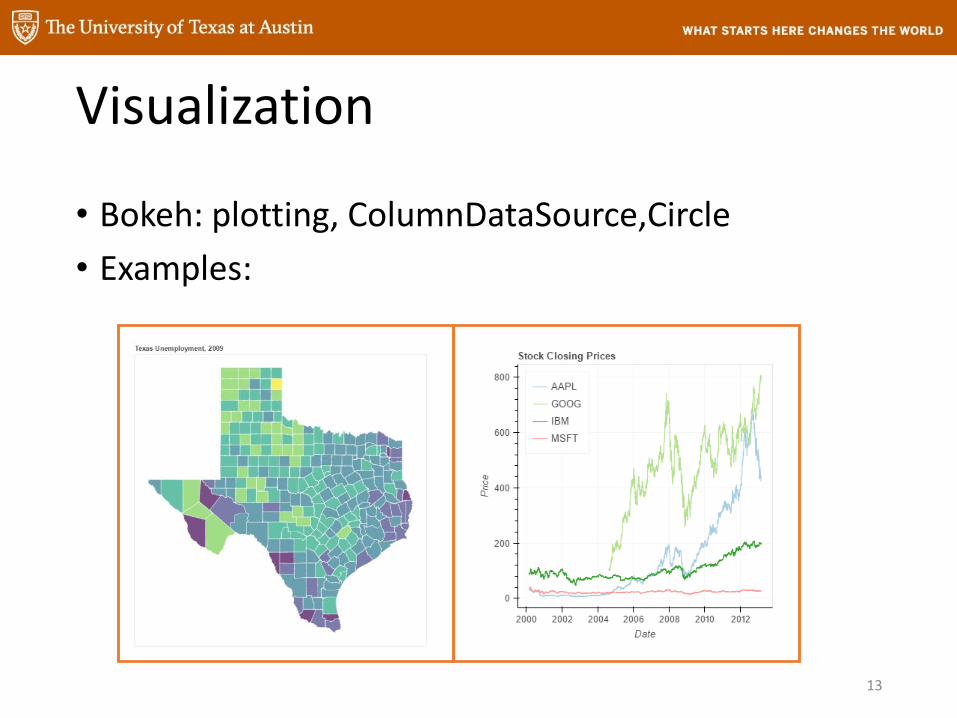
Visualization
• Bokeh: plotting, ColumnDataSource,Circle
• Examples:
13

Visualization
14
Austin Houses for Sale: Austin Predictions:

Future Work
• Scrapping more information (year built) from other website (redfin.com)
• Collecting more data from other Texas counties
• D3 interactive analysis
15

Q&A
16


