
B2B Spend Management SurveyBrought to you by MasterCard International and Ariba

B2B Spend Management Survey
Page 1
About MasterCard
MasterCard International provides payment solutions via member financial institutions thatenable organizations of all sizes to optimize the financial and information supply chain. TheMasterCard advantage lies in the company s ability to understand and respond to the uniqueneeds of businesses in implementing e-B2B payment solutions. Now, more than ever,organizations are concerned about corporate accountability, regulatory compliance, andfinancial transparency. The MasterCard eB2B ChoiceTM strategy provides companies withflexible platforms and a range of vendors from which to choose. MasterCard s goal is to enableorganizations to benefit from the efficiencies of a fully automated supply chain with minimumimplementation costs.
For further information, please contact:
MasterCard Internationale-Commerce and e-B2B Center of Excellence2000 Purchase St.Purchase, NY 10577USA
Philip PhilliouVice President, e-Business and Emerging Technologies (eB2B)Tel: (914) 249-6841E-mail: [email protected]
Shari KrikorianVice President, e-Business and Emerging Technologies (eB2B)Tel: (914) 249-5871E-mail: [email protected]
http://www.mastercardbusiness.com/e-B2B/
About Ariba
Ariba Inc. is a leading enterprise spend management (ESM) solutions provider. Ariba helpscompanies develop and leverage spend management as a core competency to drive significantbottom-line results. Ariba Spend Management software and services allow companies to aligntheir organizations with a spend-centric focus and deploy closed-loop processes for increasedefficiencies and sustainable savings.
For further information, please contact:
Ariba Inc.(650) 390-1000http://www.ariba.com/
Ingrid BellPR [email protected]

B2B Spend Management Survey
Page 2
Contents
1. Introduction ............................................................................................ 3
2. Summary of Quantitative Responses Overall .................................... 4
2.1 Demographics ................................................................................. 4
2.2 Purchasing and Corporate Card Programs.................................. 8
2.3 Enterprise Resource Planning System....................................... 10
2.4 Electronic Invoice Presentment and Payment System............. 12
2.5 Automated Expense Management System ................................ 16
2.6 Satisfaction.................................................................................... 18
3. Respondent Profile and Survey Methodology .................................. 20

B2B Spend Management Survey
Page 3
1 Introduction
MasterCard International and Ariba recently conducted a survey of 153 professionals withdecision-making or influencing power over corporate purchasing methods. The survey foundthat two out of every three companies with annual revenues exceeding $500 million now usesome form of Electronic Invoicing Presentment and Payment (EIPP) to streamline their financialmanagement processes. The survey characterized forms of EIPP as solutions that enableeither EDI or non-EDI electronic invoice receipt or presentment, or the ability to accept or makeelectronic payments.
Highlights of the B2B Spend Management Survey include:
• 66 percent of respondents currently use some form of an EIPP system (including bothelectronic data interchange [EDI] and non-EDI);
• 62 percent rely on such technology to make electronic payments to suppliers; and35 percent use the technology to receive payments from customers
• More than half the respondents (51 percent) cited the reduced processing time andresulting lower costs as the primary benefits of using EIPP
• Survey respondents cited cost (25 percent), complexity (22 percent), and aversion tomaking changes to their IT systems (19 percent) as the top reasons for not deploying anEIPP system
• 69 percent of respondents whose companies currently do not have EIPP systemsreported plans for a future deployment; 48 percent of those implementations areexpected in the next year and an additional 32 percent are planned for the next one totwo years

B2B Spend Management Survey
Page 4
2 Summary of Quantitative Responses Overall
2.1 Demographics (seven questions)
Below is a summary of the demographic characteristics of the survey group.
Question 1: Which job title best describes you?
1%
2%
47%
3%
34%
4%
4%
5%
1%
0% 10% 20% 30% 40% 50% 60%
Other
CPO
VP Finance
VP Purchasing
VP Travel
VP Procurement
Manager A/R
Manager A/P
eBusiness
eBusiness professionals make up nearly half of survey respondents. Just over one-third oftotal respondents noted that they work in other departments including:
• IT Manager or Director• Manager of Procurement• Manager of Purchasing

B2B Spend Management Survey
Page 5
Question 2a: Your company s annual revenue:
16%
8%
4%
7%
66%
0% 10% 20% 30% 40% 50% 60% 70%
500 Million - 999 Million
1 Billion - 1.49 Billion
1.5 Billion - 1.99 Billion
2 Billion - 2.49 Billion
2.5 Billion and Over
Over 60% of the companies represented by this survey have annual revenue of over $2.5billion.

B2B Spend Management Survey
Page 6
Question 2b: The areas in which your company has a physical office:
97%
58%
47%
18%
0% 10% 20% 30% 40% 50% 60% 70% 80% 90% 100%
United States
Europe
Asia
Other
Nearly all of the companies represented by this survey have offices in the United States — alarge percentage have offices around the world. Approximately 58% also have offices inEurope, and 47% have offices in Asia. Other regions noted by respondents included LatinAmerica, South America, Canada, Africa, India and Australia.
Question 2c: The number of your company s employees:
11%
32%
30%
14%
8%
5%
0% 10% 20% 30% 40% 50% 60% 70% 80% 90% 100%
< 10,000
10,000 to 49,999
50,000 to 99,999
100,000 to 149,999
150,000 to 199,999
200,000 +
Just over half of the companies surveyed employ less than 50,000 people.

B2B Spend Management Survey
Page 7
Question 3: Identify the industry your company represents:
3%
1%
1%
1%
6%
9%
7%
3%
22%
17%
2%
6%
11%
12%
0% 10% 20% 30%
Other
Healthcare
Discrete Manufacturing
CPG/Retail
High Tech
Financial Services
Diversified Chemicals
Public Sector
Logistics & Transportation
Oil & Gas
Pharmaceutical
Software & Services
Telecom
Utilities & eEngergy
Respondents industries varied fairly equally across the board. Financial Servicescharacterizes a majority of respondents with 22%, but other popular choices included HighTech and CPG/Retail. Approximately 17% of respondents choose other to describe the mainindustry their company is engaged in. Some of these other responses includedManufacturing, Specialty Materials, Automotive, Consulting, Distribution, Document Finishing,eCommerce, Electronics Distribution, Entertainment, Mining, Port Services, Printing Ink,Process Manufacturing, and Research and Development.

B2B Spend Management Survey
Page 8
Question 4: How has your company addressed the need to comply with new corporategovernance procedures? (check all that apply)
64%
66%
34%
71%
48%
0% 10% 20% 30% 40% 50% 60% 70% 80%
Automating Existing Manual Processes
Implementing New Technology Systems
Establishing Digital Paper Trails
Improving Internal Controls
Instituting a Monitoring Process for ContinuedCompliance Over Time
In order to comply with new corporate governance procedures, most respondents noted thattheir companies have improved internal controls, implemented new technology systems andautomated existing manual processes.
2.2 Purchasing and Corporate Card Programs (three questions)
Question 5a: Does your company have a purchasing card program?
83%
17%
0% 10% 20% 30% 40% 50% 60% 70% 80% 90%
Yes
No

B2B Spend Management Survey
Page 9
Question 5b: What percentage of spend is purchased via payment cards?
18%
39%
24%
18%
0% 10% 20% 30% 40% 50%
< 1%
1% > 5%
5% > 10%
> 10%
Question 6: Do you have a corporate card program (for travel and entertainmentexpenses)?
89%
11%
0% 10% 20% 30% 40% 50% 60% 70% 80% 90% 100%
Yes
No
Just over 80% of those surveyed noted that their companies have a purchasing card program,while nearly 90% have a corporate card program for travel and entertainment expenses. Almost40% of those surveyed note that less than 5% of their spend is purchased via payment cards.

B2B Spend Management Survey
Page 10
Question 7: The number of business travelers in your company:
2%
62%
23%
9%
4%
1%
0% 10% 20% 30% 40% 50% 60% 70%
< 10,000
10,000 to 49,999
50,000 to 99,999
100,000 to 149,999
150,000 to 199,999
200,000 +
At 62%, a majority of respondents note that less than 10,000 of their company s employeestravel for business, although 23% have between 10,000 and 49,999 traveling employees.
2.3 Enterprise Resource Planning System (three questions)
Question 8a: Do you have an enterprise resource planning (ERP) system?
77%
23%
0% 10% 20% 30% 40% 50% 60% 70% 80%
Yes
No

B2B Spend Management Survey
Page 11
Question 8b: Which ERP do you use?
25%
16%
21%
36%
2%
0% 10% 20% 30% 40%
Other
Oracle
PeopleSoft
SAP
GEAC
Of the 77% of survey respondents who use an enterprise resource planning (ERP) system, asignificant percentage use SAP, Oracle and People Soft. Responses in the other categoryincluded Computron, CODA, MFG/PRO, Invensys Protean, JDedwards, Lawson, Legacy,ManufacTech, Microsoft Navision, Mincom MIMS and Trams. 15% of this group noted they usevarious systems and 5% were not sure what their organization uses.

B2B Spend Management Survey
Page 12
Question 8c: How satisfied are you with the integration of payment card data with yourcompany s ERP system?
10%
30%
42%
10%
9%
0% 10% 20% 30% 40% 50%
Very Satisfied
Satisfied
Neither Satisfied or Dissatisfied
Somewhat Dissatisfied
Very Dissatisfied
Overall, respondents are satisfied with the integration of payment card data with theircompany s ERP system although 42% are neutral.
2.4 Electronic Invoicing Presentment and Payment System (four questions)
Question 9a: Which of the following types of electronic invoicing presentment andpayment (EIPP) systems does your company use? (check all that apply)
35%
62%
13%
58%
35%
43%
23%
0% 10% 20% 30% 40% 50% 60% 70%
None of the Above
Electronic Invoice Presentment (EDI)
Electronic Invoice Presentment (non-EDI)
Electronic Invoice Receipt (EDI)
Electronic Invoice Receipt (non-EDI)
Electronic payment to suppliers
Electronic payments from customers
Of the majority of respondents whose companies use Electronic Invoicing Presentment andPayment (EIPP) for either accounts receivable or accounts payable, electronic payments tosuppliers and electronic invoice presentment (EDI) are the most popular systems.

B2B Spend Management Survey
Page 13
Question 9b: How long has your company used each of the EIPP systems? (if applicable)
(a) Electronic Invoice Presentment (EDI)
7%
14%
28%
52%
0% 10% 20% 30% 40% 50% 60%
0 - 6 Months
6 - 12 Months
1 - 2 Years
2 + Years
(b) Electronic Invoice Presentment (non-EDI)
9%
13%
26%
52%
0% 10% 20% 30% 40% 50% 60%
0 - 6 Months
6 - 12 Months
1 - 2 Years
2 + Years
(c) Electronic Invoice Receipt (EDI)
9%
17%
24%
50%
0% 10% 20% 30% 40% 50% 60%
0 - 6 Months
6 - 12 Months
1 - 2 Years
2 + Years

B2B Spend Management Survey
Page 14
(d) Electronic Invoice Receipt (non-EDI)
17%
20%
30%
33%
0% 10% 20% 30% 40%
0 - 6 Months
6 - 12 Months
1 - 2 Years
2 + Years
(e) Electronic payment to your suppliers
4%
22%
24%
49%
0% 10% 20% 30% 40% 50% 60%
0 - 6 Months
6 - 12 Months
1 - 2 Years
2 + Years
(f) Electronic payments from your customers
4%
14%
18%
64%
0% 10% 20% 30% 40% 50% 60% 70%
0 - 6 Months
6 - 12 Months
1 - 2 Years
2 + Years

B2B Spend Management Survey
Page 15
Below is a snapshot of the length of time companies have used each of the following EIPPSystems:
• Electronic Invoice Presentment (EDI) — more than 2 years• Electronic Invoice Presentment (non-EDI) — more than 2 years• Electronic payments from customers — more than 2 years• Electronic Invoice Receipt (non-EDI) — more than 1 year• Electronic Invoice Receipt (EDI) — more than 2 years• Electronic payments to suppliers — more than 2 years
Overall, it appears that companies using any of the EIPP systems have done so for over 2years, although one third of companies using the non-EDI version of electronic invoice receipthave used the system between 1 and 2 years.
Question 9c: What is the No. 1 benefit your company has gained since implementingEIPP?
14%
3%
51%
10%
12%
10%
0% 10% 20% 30% 40% 50% 60%
Other
Reduced processing time resulting in reducedprocessing costs
Enables the capture of early payment discounts
Enables redeployment of manpower
Provides timely and reliable data
Reduces exceptions
Overall, companies that use EIPP systems benefit from reduced processing time, whichreduces processing costs.

B2B Spend Management Survey
Page 16
Question 9d: If your company does not use an EIPP system, why not? (check all thatapply)
14%
44%
25%
22%
19%
3%
0% 10% 20% 30% 40% 50%
Other
Cost
Complexity
Don’t want to make any IT changes to the system
Don’t trust the technology
Security concerns
Respondents whose companies do not have an EIPP system note cost as the number onereason; complexity and an aversion to making IT changes also came up frequently. Othersurvey responses explaining why some companies do not already have an EIPP system notedthat organizations were in the process of implementing an EIPP system, they don t know or theyare not ready.
2.5 Automated Expense Management System (two questions)
Question 10a: Which automated expense management system do you use?
7%
5%
23%
42%
12%
1%
8%
0% 10% 20% 30% 40% 50%
Other
Ariba
Concur
Necho
Oracle
PeopleSoft
SAP
Ariba is the most popular version of the Automated Expense Management System. Otherresponses included:
• Captura• Express• Extensity• GEAC• Homegrown• In House

B2B Spend Management Survey
Page 17
• Interplex• Organic
Question 10b: Why do you choose not to use an automated expense managementsystem? (check all that apply)
50%
22%
28%
13%
9%
0% 10% 20% 30% 40% 50% 60%
Other
Cost
Complexity
Don’t want to make any IT changes to the system
Security Concerns
Complexity is the main reason some of the companies surveyed are not currently using theAutomated Expense Management System followed by cost and an aversion to making ITsystem changes. Significant other responses include respondents with companies that areresistant to change. In addition, respondents noted controller s concerns, corporate politics, theuse of in house tools, limited application, and other priorities.

B2B Spend Management Survey
Page 18
2.6 Satisfaction (four questions)
Question 11: How convinced are you of the ability of payment and spend managementsolutions to deliver ROI/cost savings?
50%
32%
16%
1%
1%
0% 10% 20% 30% 40% 50% 60%
Very Convinced
Somewhat Convinced
Neither Convinced or Unconvinced
Somewhat Unconvinced
Very Unconvinced
Overall, this group is very convinced that payment and spend management solutions have theability to deliver ROI/cost savings.
Question 12: How satisfied are you with your organization s current ability to aggregatevendor contracts across various departments?
12%
30%
29%
22%
7%
0% 10% 20% 30% 40%
Very Satisfied
Satisfied
Neither Satisfied or Dissatisfied
Somewhat Dissatisfied
Very Dissatisfied
B2B Spend Management Survey
Page 19
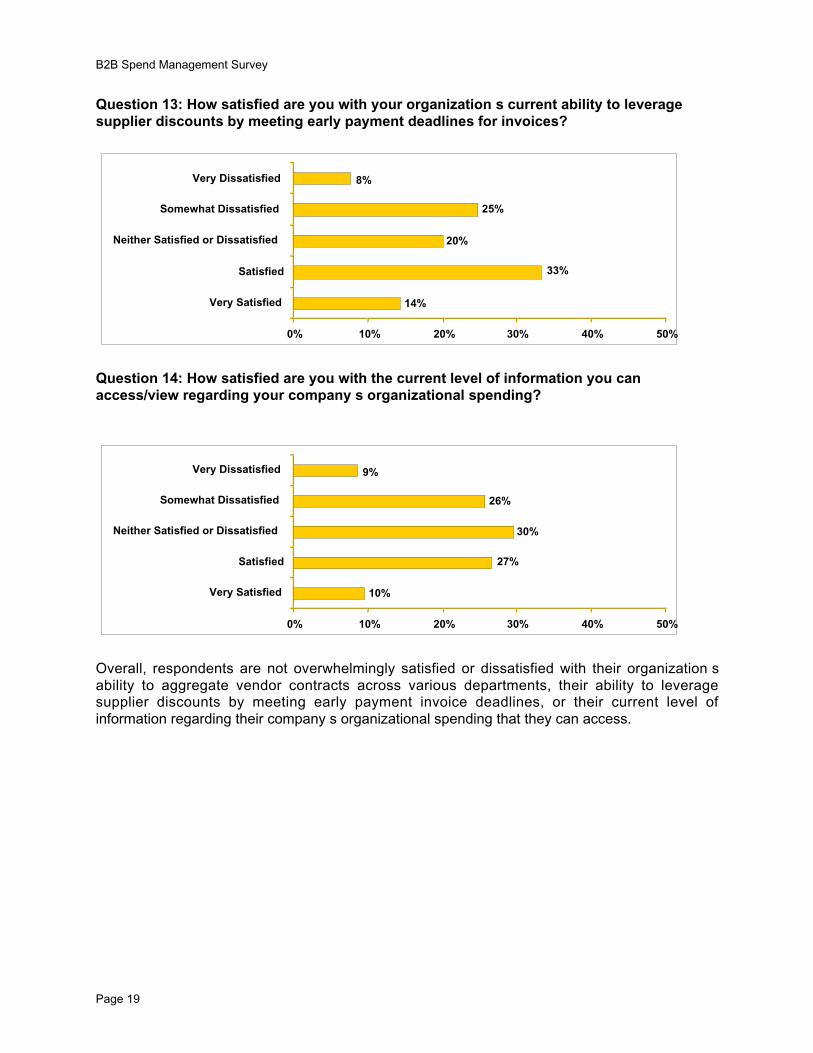
Question 13: How satisfied are you with your organization s current ability to leveragesupplier discounts by meeting early payment deadlines for invoices?
14%
33%
20%
25%
8%
0% 10% 20% 30% 40% 50%
Very Satisfied
Satisfied
Neither Satisfied or Dissatisfied
Somewhat Dissatisfied
Very Dissatisfied
Question 14: How satisfied are you with the current level of information you canaccess/view regarding your company s organizational spending?
10%
27%
30%
26%
9%
0% 10% 20% 30% 40% 50%
Very Satisfied
Satisfied
Neither Satisfied or Dissatisfied
Somewhat Dissatisfied
Very Dissatisfied
Overall, respondents are not overwhelmingly satisfied or dissatisfied with their organization sability to aggregate vendor contracts across various departments, their ability to leveragesupplier discounts by meeting early payment invoice deadlines, or their current level ofinformation regarding their company s organizational spending that they can access.

B2B Spend Management Survey
Page 20
3 Respondent Profile and Survey MethodologyAn online survey (https://www.infosurv.com/mst.html) was administered to participants in theAriba LIVE convention. All valid survey respondents must have indicated decision-making orinfluencing power over corporate purchasing methods (i.e., credit card, check, etc.)
Respondents were invited to take the survey at a convention kiosk, and responses werecollected from 5/3/04 until 5/4/04. Ultimately, 153 respondents submitted a response yielding astatistically significance of +/- 7.92% confidence interval at the 95% confidence level.


