
Cefas contract report: ME5403 Module 7
Project ME5403
Applied science to support the licensing of dredging,
disposal, renewables and general construction and
associated monitoring under FEPA, CPA and the future
Marine Act
Module 7 – Application and development of Sediment
Profile Imagery (SPI)
Authors: Silvana Birchenough, Ruth Parker, Thi Bolam, Claire
Mason, Jon Barry and Silke Kröger.
Issue date: 7th June 2013

3
Cefas Document Control
Application and development of Sediment Profile Imagery
Submitted to: The Marine Management Organisation (MMO) and The Department of
Environment, Food and Rural Affairs (Defra)
Date submitted: 07/06/13
Project Manager: Sonia Kirby & Clare Powell
Report compiled by: Silvana Birchenough, Ruth Parker, Thi Bolam, Claire Mason, Jon Barry and
Silke Kröger
Quality control by: Chris Vivian
Approved by & date: Jan Brant
Version: 5
Version Control History
Author Date Comment Version
Silvana Birchenough 17/05/13 Draft 1
Chris Vivian 22/05/13 QA comments 2
Thi Bolam & Ruth Parker 22/05/13 Comments 3
Silvana Birchenough 23/05/13 Editorial changes & text 3a
Jan Brant 31/05/13 Comments 3b
Silvana Birchenough 04/06/13 Edits 4
Jan Brant 04/06/13 Final QA 5

4
Application and development of Sediment Profile Imagery
Silvana Birchenough, Ruth Parker, Thi Bolam, Claire Mason, Jon Barry and Silke Kr
Head office
Centre for Environment, Fisheries & Aquaculture Science
Pakefield Road, Lowestoft, Suffolk NR33 0HT, UK
Tel +44 (0) 1502 56 2244 Fax +44 (0) 1502 51 3865
www.cefas.defra.gov.uk
Cefas is an executive agency of Defra
Application and development of Sediment Profile Imagery
Authors:
a Birchenough, Ruth Parker, Thi Bolam, Claire Mason, Jon Barry and Silke Kr
Issue date: 07 June 2013
Centre for Environment, Fisheries & Aquaculture Science
Pakefield Road, Lowestoft, Suffolk NR33 0HT, UK
44 Fax +44 (0) 1502 51 3865
Cefas is an executive agency of Defra
5
Application and development of Sediment Profile Imagery
a Birchenough, Ruth Parker, Thi Bolam, Claire Mason, Jon Barry and Silke Kröger

0
Executive Summary
The aim of this module was to collect parallel information with SPI technology and DGT gels (passive
samples) to enable a further vertical characterisation of sediments in a dredged material disposal
site. This is the first time that the two techniques have been used at Cefas to monitor an area
subjected to dredged material disposal, which in this case was Souter point disposal site. The specific
aims were to assess: i) the utility of these techniques, ii) the logistics of testing and employing the
combination of techniques (SPI and DGT gels), iii) the speed of data return from these two
techniques and iv) the value of SPI and DGT gels as complementary techniques to provide additional
capability into a existing monitoring context and v) if the data generated from these two techniques
could support a cost-effective survey.
The collection of good quality SPI images made possible a rapid assessment of the status of an area
based on the calculation of the following biological and physical parameters:
1) surface sediment type (measured from the upper 5 cm sediment layer);
2) prism penetration depth (gives an indication of relative sediment compaction;
3) sediment boundary roughness (indicates the degree of physical disturbance or biotic activity
at the sediment water boundary) and sediment apparent redox potential discontinuity
depth (aRPD) (is the gradient of colour change between paler oxidized surficial sediments
and darker reduced sediment at depth).
Additionally, the use of the DGT gels allowed mapping depth profiles of various metals within the
sediments in the disposal site. The higher resolution provided by the DGT gels provides insight into
metal specific resupply and behaviour within disposal site sediments. It highlighted the comparative
availability of metals in sediment pore-waters and provides new information on whether sediments
are acting as a source/sink for metals. A modelling approach provides more robust assessment of
specific metal behaviour between and within sites. Combined, these techniques illustrate the
disconnect between total metal concentrations and availability to pore-waters and for which metals
release is related to a disposal activity or not. It highlights that the total metal concentration is rarely
a good descriptor of release to the pore-waters in this case and link between total metal reservoir,
associated environmental drivers (TOC, PSA) and pore-water chemistry (DOC, AVS) will determine
the risk posed from metals associated with disposal activity.
The overall information generated from the SPI and other sediment information (PSA, TOC, bulk
metals) resulting from this work evidenced that the fauna and sediments in the vicinity of the
1
disposal areas showed a distinct presence of added dredged material and a reduction in faunal
numbers when compared with the reference areas. The ability to sample with SPI allowed rapid
coverage of large areas and provided a good reliable set of information, which enabled
characterisation of the sediments, fauna and the aRPD across different areas. The use of SPI also has
been applied for disposal site monitoring at Souter Point since 2005 and has also allowed
characterisation of the presence of dredged material in the centre of the disposal area.
The combined approaches of SPI (rapid spatial technique to identify comparative site redox and
disposal material) and DGT sampling (and associated environmental variables) at selected sites can
provide an improved assessment of the risk posed from disposal sites sediments in terms of direct
metal release to the sediment pore-water (potential bioavailability), across the sediment –water
interface (source/sink) and also under disturbance events (storms). The combined techniques can be
readily linked within monitoring programmes in a cost-effective manner and targeted to site or
contaminant specific issues.

2
Table of contents
Contents
Cefas contract report: ME5403 Module 7 ........................................................................................... 1
Introduction ........................................................................................................................................... 3
Disposal site regulation and monitoring ............................................................................................ 4
Background of the DGT method .......................................................................................................... 6
Aims of this module .............................................................................................................................. 8
Methods: Souter Point case study (Aims 1 & 2) ................................................................................ 8
Background of Souter Point disposal site ........................................................................................... 9
Sampling approach ............................................................................................................................. 9
DGT probe deployment and retrieval and analysis .......................................................................... 11
Total Metals ...................................................................................................................................... 12
Statistical approaches and analysis................................................................................................... 13
Results (Aims 1 and 3) ........................................................................................................................ 13
DGT fluxes and profiles ..................................................................................................................... 16
Macrofaunal communities ................................................................................................................ 22
Discussion ........................................................................................................................................... 25
Application of gel technology and SPI in monitoring and assessment studies (Aim 3) ............. 25
Capabilities .......................................................................................................................................... 27
Limitations of SPI and DGT technologies (Aim 4) ........................................................................... 29
Recommendations for future routine application (Aim 5) .............................................................. 31
Conclusions and way forward ........................................................................................................... 32
8. Dissemination .................................................................................................................................. 34
8.1 Presentations meetings/Study groups or conferences ............................................................... 34
8.2 Papers (in preparation) ............................................................................................................... 35
9. References ....................................................................................................................................... 36
Appendix 1: Images ............................................................................................................................ 42

3
Introduction
The use of the Sediment Profile Imagery (SPI) technology and their images have been demonstrated
to be an effective tool to disseminate scientific results to regulators, non-specialists, industry and
wider stakeholders including the general public. Initial efforts were supported by the contract
ME1401 to develop SPI capability as a routine tool for monitoring marine environments. The SPI
technology has proven to be an effective manner to collect, communicate and disseminate
information to a wide range of stakeholders.
During this module (project ME5403) the aim was to develop the SPI capability in relation to passive
samplers, as it was recognised that information obtained by undertaking work in parallel with these
two techniques could help to answer regulatory needs. This work was designed to combine the SPI
and DGT gels to place them into a full operation as a tool for monitoring in support of the regulatory
needs. The idea of implementing the DGT passive samplers technique in Cefas was to explore their
performance as a cost-effective tool with a rapid return of information to assist the existing work
conducted under monitoring to support marine licenses. The use of DGT gels alongside the SPI
technology is a developed method, which has been applied to sediment systems, showing a robust
return of information and successful results (Teal et al., 2009, 2013). However, this is the first time
that Cefas applied these two techniques during the same survey (e.g. the SPI and DGT gels in
parallel) to provide additional information into an existing monitoring context in relation to dredged
material.
One key focus of this module was to use a combination of the existing SPI technology with existing
Diffusive Gradient in Thin-films (DGT) gels. This work enabled the matching of SPI sediment images
with metal profiles measured by the DGT gels as well as quantitative sediment chemistry
measurements of nutrients, metals, organics etc. These novel gel based responsive materials are a
simple method allowing more informative surveys of offshore related chemical distribution to be
carried out to complement existing monitoring practices.
The work undertaken under this module was at Souter Point dredged material disposal site, which
provided a suitable scenario for testing a combination of new techniques. The site is annually
monitored by Cefas on behalf of the MMO and Defra. A multi-disciplinary team of sedimentologists,
biogeochemist and chemists based at the Cefas Lowestoft laboratory, worked on all aspects of this
work. Some of the initial work was to prepare and deploy the gel probes as well as to understand the

4
logistics of deployment, laboratory analysis and to also conduct a testing trial of gels with freshly
collected sediment cores collected at Souter Point disposal site to assess the performance of the gel
as sediment analytical tools.
During the development of this work, Cefas scientists have interacted during meetings and
workshops with other academic partners (namely Dr. Andrew Mayes at UEA and Dr. Gary Fones at
Portsmouth University) to gain additional understanding of the DGT gel technology as well as
deployment and cost-effective testing. The results obtained under this module have been further
disseminated to Cefas colleagues and others (i.e. academic colleagues) also working on this topic.
The techniques developed under this module could potentially be adopted for future disposal site
monitoring. For example the use of SPI is a technique that is routinely employed. At present the use
of grabs to collect bulk sediment samples only have limited penetration when compared to sediment
corers, which can penetrate deeper into the sediment and can also provide a profile of sediment
layering, which can help to provide a more detailed sampling sediment chemistry as well as the
faunal response in these areas. The combination of SPI with in situ samplers for selected chemical
components significantly enhances the usefulness of this tool for environmental impact assessment,
providing a rapid tool for monitoring the current status of dredged material disposal sites.
Disposal site regulation and monitoring
There are approximately 150 sites licensed for dredged material disposal around the UK, however by
no means all the sites are used in any one year. The majority of these sites are located off the coast
of the mainland, mostly within a few miles of a major port or estuary entrance, within estuaries (e.g.,
Humber), (Bolam et al., 2006). Annually, some 25 - 50 million wet tonnes of dredged material are
disposed of at these sites. Individual quantities can range from a few hundred to several million
tonnes. Equally, the nature of the material may also vary from soft silts to boulders and crushed
rock, although the majority is finer material (Bolam et al., 2006).
At some disposal sites, the material disposed of is a combination of capital and/or maintenance
dredged material. The quantities of dredged material are often referred to as quantities of returns
(in tonnage) for specific sites. Some of the disposal sites have been used for decades (up to 100

5
years) and so in some cases, disposal of these materials started well before statutory controls for the
protection of the marine environment were enforced (Eagle et al., 1979; Birchenough et al., 2006).
The disposal of dredged material was licensed under FEPA 1985 Part 2 until 6th April 2011 when it
was superseded by the Marine Licensing section of the Marine and Coastal Access Act 2009 (MCAA)
following guidelines laid down by the OSPAR Convention 1992 and the London Protocol 1996. The
licensing authority for England under the MCAA has been the Marine Management Organisation
(MMO) since 1st April 2010 when they took over the role from the Marine and Fisheries Agency.
Prior to issuing a disposal licence, alternative disposal options, including beneficial uses of dredged
material (Murray, 1994) must be explored by the applicant, for example, beach recharge, coastal
defence and habitat enhancement (Waldock et al., 2002). However, open water disposal in licensed
sites is in many cases the best practicable environmental option and also the only economically
realistic one for the dredged material (Birchenough et al., 2006).
In licensing the disposal of dredged material at sea, several national and international agreements
(e.g., the London Protocol of 1996 (LP96), the OSPAR Convention, the Habitats and Species Directive
(92/43/EEC), the Wild Birds Directive (79/409/EEC), the Water Framework Directive ( 2000/60/EC)
and the Waste Framework Directive (2008/98/EC)), must be taken into account, to determine
whether likely impacts arising from the dredging and disposal are acceptable (MEMG, 2003). Criteria
considered under the various conventions and directives include the presence and levels of
contaminants in the materials to be disposed of, along with perceived impacts on any sites of
conservation value in the vicinity of disposal.
Cefas’ role is to provide scientific advice to the MMO on the suitability of the material for sea
disposal at the application stage and, once a licence is granted, to check through disposal site
monitoring that licence conditions are met and that no unexpected effects occur. Advice on the
licensing of dredged material disposal at sea is provided by Cefas’ Regulatory Assessment Team who
collates advice as appropriate from relevant Cefas experts. Work conducted under the FEPA
monitoring contract SLAB5 helps underpin the scientific rationale in support of this advice. The work
conducted under this ME5403 module also aims to complement the work conducted under that
contract.
Cefas has a tiered approach to assessing which disposal sites should be recommended to the MMO
for sampling in any one year. This tier-based approach considers a number of possible issues or
6
environmental concerns that may be associated with dredged material disposal within a risk-based
framework (Bolam et al., 2009). Cefas’ duty is then to design an appropriate monitoring plan as part
of our ‘check monitoring’ process on behalf of the regulator. These monitoring activities result in the
acquisition of physical and biological datasets that, in addition to their primary function, can be
utilised to gain further understanding of the marine ecosystems in and around the disposal sites and,
ultimately, enable better management of the activities.
The aim of this module is to provide applied science to support the licensing and monitoring of
dredged material disposal sites under FEPA and the Marine Act. The aim of applying the SPI
alongside the DGT gels at disposal site areas could help to support the current monitoring conducted
under the contract SLAB5. The idea using the SPI camera to characterise areas that have been
subject to historic and current dredged material disposal has helped to: i) visualise the status of the
seafloor and associated benthic communities, ii) provide a rapid return of information, which is easy
to communicate, iii) enabled the study of vertical additions of dredged material and also assess the
presence/absence of fauna as well as delimitation of the aRPD. The use of DGT gels in sediments
collected from an active disposal site has provided the opportunity to assess metal speciation and
the remobilisation of metals at a detailed vertical distribution within the sediment profile in
sediments. This assessment provided a rapid return of information and also enhancing the spatial
coverage of a disposal site. The application of methods such as the ones tested in this module could
provide a cost-effective monitoring design at disposal sites.
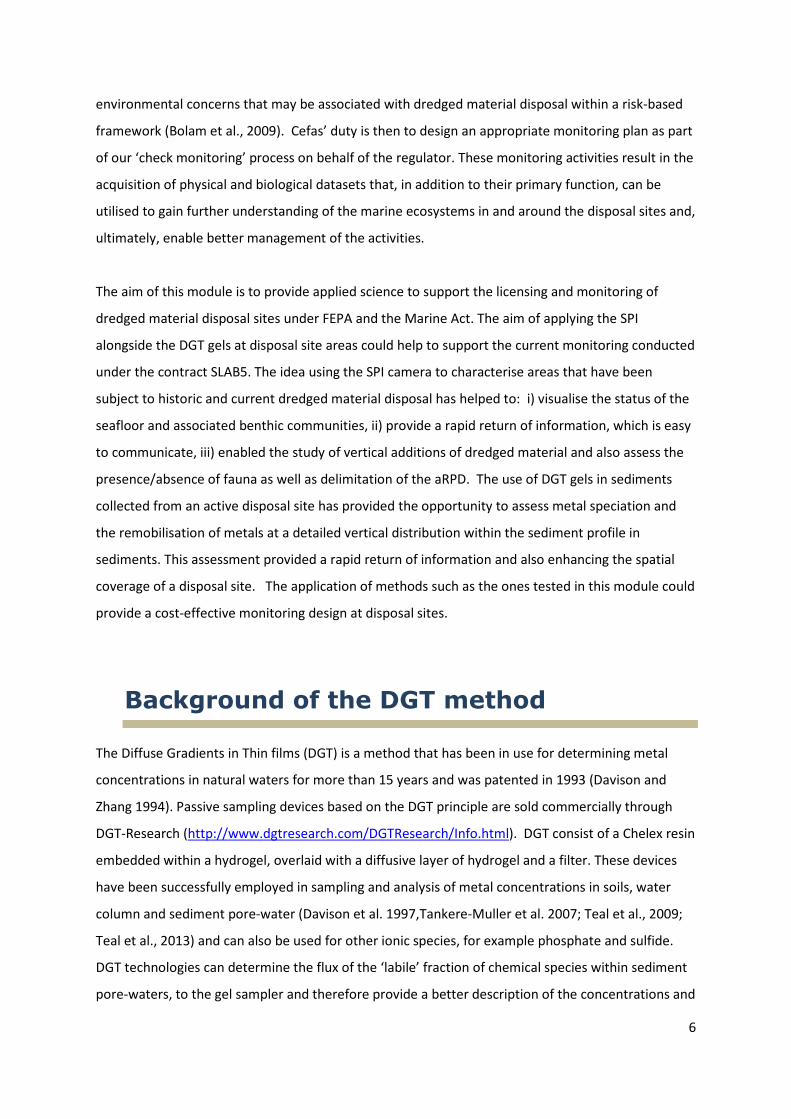
Background of the DGT method
The Diffuse Gradients in Thin films (DGT) is a method that has been in use for determining metal
concentrations in natural waters for more than 15 years and was patented in 1993 (Davison and
Zhang 1994). Passive sampling devices based on the DGT principle are sold commercially through
DGT-Research (http://www.dgtresearch.com/DGTResearch/Info.html). DGT consist of a Chelex resin
embedded within a hydrogel, overlaid with a diffusive layer of hydrogel and a filter. These devices
have been successfully employed in sampling and analysis of metal concentrations in soils, water
column and sediment pore-water (Davison et al. 1997,Tankere-Muller et al. 2007; Teal et al., 2009;
Teal et al., 2013) and can also be used for other ionic species, for example phosphate and sulfide.
DGT technologies can determine the flux of the ‘labile’ fraction of chemical species within sediment
pore-waters, to the gel sampler and therefore provide a better description of the concentrations and

7
supply of metal and other contaminant exposure to sediment pore-water and hence fauna. The
Figure 1 below illustrates the dynamics and steps involved in controlling metal partitioning between
the particulate phase (as described by total metal sediment concentrations), dissolved pore-water
and sampling by a DGT passive sampler.
Figure 1. Reactions of metal phases between DGT, dissolved pore-water and particulate phases
(From Ciffroy et al., 2011)
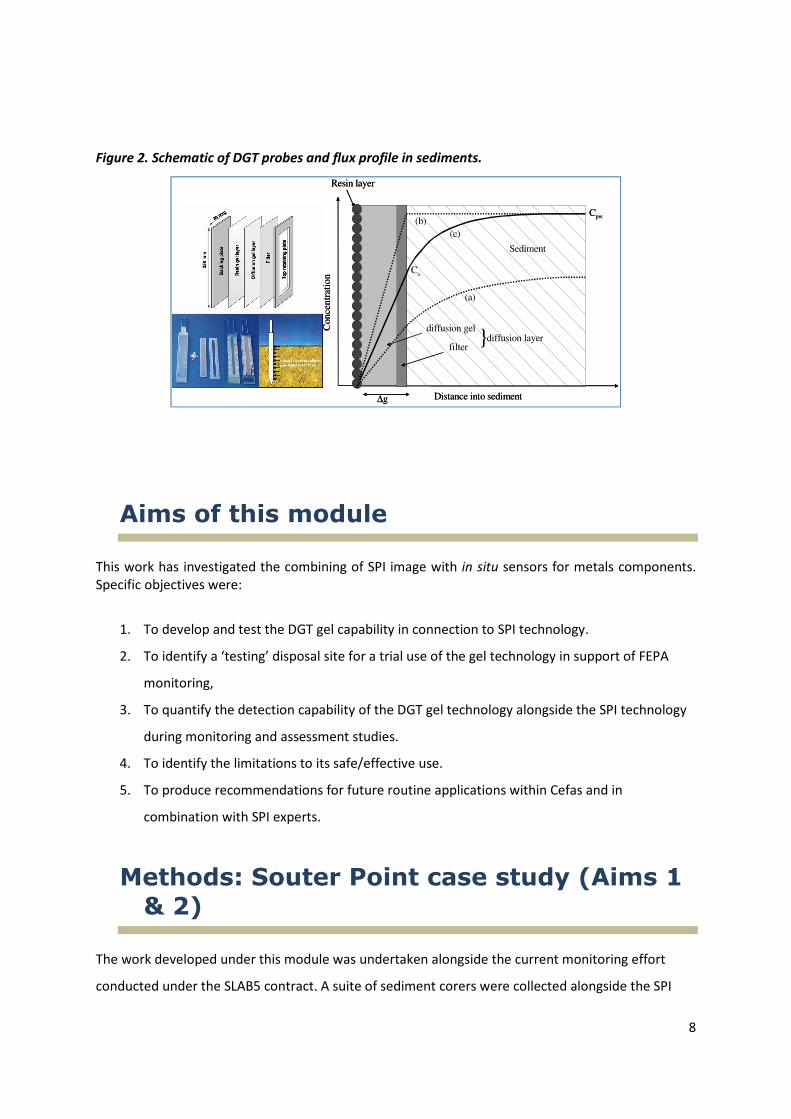
Figure 2 below shows the schematics with the concentration profiles of a DGT probe composition
whilst being deployed. The advantage of DGT probes is that they are reasonably priced (sediment
probes are ~£80-100 each) and concentrate the analyte into the gel, hence improving the amount of
metal available for analysis in relation to any given analytical detection limit. Their performance in
various sediment types is also increasingly well defined and studies have already linked biological
response using DGT labile metal, bioavailability and toxicity studies (King et al., 2005; Belzunce-
Segarra et al., 2009; Jolley et al., 2009; Rigaud et al., 2009; Roberts et al., 2013). Limited studies have
also applied these samplers to sediment in the context of contamination studies at capping sites
(Knox et al., 2012) or disposal sites (Fredette and French, 2004) and also linked metal cycles (Teal et
al., 2013).
8
Figure 2. Schematic of DGT probes and flux profile in sediments.
Aims of this module
This work has investigated the combining of SPI image with in situ sensors for metals components. Specific objectives were:
1. To develop and test the DGT gel capability in connection to SPI technology.
2. To identify a ‘testing’ disposal site for a trial use of the gel technology in support of FEPA
monitoring,
3. To quantify the detection capability of the DGT gel technology alongside the SPI technology
during monitoring and assessment studies.
4. To identify the limitations to its safe/effective use.
5. To produce recommendations for future routine applications within Cefas and in
combination with SPI experts.
Methods: Souter Point case study (Aims 1
& 2)
The work developed under this module was undertaken alongside the current monitoring effort
conducted under the SLAB5 contract. A suite of sediment corers were collected alongside the SPI
Sediment
Conce
ntr
atio
n
∆g Distance into sediment
Ca
Cpw
Resin layer
diffusion gel
filter}diffusion layer
(c)
(b)
(a)
Sediment
Conce
ntr
atio
n
∆g Distance into sediment
Ca
Cpw
Resin layer
diffusion gel
filter}diffusion layer
(c)
(b)
(a)

9
survey, mainly to test new the DGT gels in sediments to inform the vertical presence of metals
present in these areas alongside the SPI images (informing the sediments type, aRPD and faunal
presence). This overall approach is a cost-effective manner to survey sediment subject to dredged
material disposal. The results from this work are aimed to complement the current level of large
scale monitoring of the Souter point disposal site.
Background of Souter Point disposal site
The work conducted under this module has concentrated at the Souter Point (SP) disposal site. The
SP disposal site is located at a depth of approximately 40 m, but this shallows by up to 5 m at the
inshore end, due to historical accumulations of minestone and fly-ash material. Between December
2004 and April 2005, a trial level bottom-capping project was undertaken in the centre of the site.
The Port of Tyne disposed of 60,000 m3 of contaminated dredged material (CDM), which was then
capped with clean material (Blake, 2009; Birchenough et al., 2007). Cefas has continued to monitor
Souter Point disposal site prior to, during and post the capping trial. The monitoring program at
Souter point is based on impact hypotheses, which are set up for addressing important questions
such as: what is the fate of contaminants (including metals) imported to the site with the disposed
material and what effect does this have on ecological components? At present little is known
regarding metal speciation or detailed vertical distribution and partitioning of metal contaminants
within the sediments. The aim of this work was to apply diffusive gradient in thin films (DGT)
technology as a complementary tool to the routine monitoring conducted at the SP disposal site to
provide an improved understanding of metal behaviour and fate. While the established practise of
analysing trace metals in bulk sediment samples gives important information about absolute
concentrations and such associated potential hazards, the idea of looking at depth resolved profiles
of metal fluxes as measured by DGT might improve our understanding of how mobile and thus
available these metals are, or in other words what actual risk they might pose. This is the first time
that this type of detailed vertical work is undertaken at this disposal site, this work enabled a robust
level of information across all biological and physico-chemical variables.
Sampling approach
A total of four replicate samples with a 0.1 m2 NIOZ box-corer were collected at 3 stations: i)
Reference station 4 corers, located south of the disposal site and ii) station C and station S, 3 corer
replicates were taken from stations both located within the disposal site (Figure 3). Sub-coring for

10
DGT deployment was carried out before incubation of the sub-cores, the details of the DGT sampling
are provided in the sections below.
In parallel five replicate Sediment Profile Imagery (SPI, Rhoads and Germano, 1982, Germano et al.,
2011) images were taken at each of the stations where the DGT passive sampler was deployed.
Sediment Profile Imagery (SPI) is a rapid, in-situ technique, which takes vertical profile pictures of
the upper 20cm of the sediment system. The SPI camera works “like an inverted periscope”, the
camera possesses a wedge-shaped prism with a plexiglass faceplate and an internal light provided by
a flash strobe. The back of the prism has a mirror mounted at a 45° angle which reflects the image of
the sediment-water interface at the faceplate up to the camera. The imaging system (a Nikon D-100
camera) provides in situ information of sediment characteristics (i.e., physical description) and the
presence and location of large fauna and biological activity (e.g., burrows, tubes, oxic voids etc.) (as
indicated in Birchenough et al., 2006; Birchenough et al., 2012, Birchenough et al., 2013). Visual
assessment of sediment colour can be used to contrast sediment redox state, in particular iron
reduction (loss of brown) and pyrite formation (black) (Teal et al., 2009; 2012).
Figure 3. Souter Point disposal site displaying all of the stations sampled and stations on the
disposal sites (S, C) and reference (R)(station).
Supporting sediment characterisation:
Supporting measurements to complement the DGT probes and characterise the sediment at each of
the stations were also collected. They are described below.
R
SC

11
Oxygenation of the upper sediment layer was measured with oxygen pore water profiles obtained
with oxygen microelectrodes (Unisense) using a method adapted from Rabouille et al., (2001).
Sediment characteristics were derived from vertical slices of sub-cores from a NIOZ box-corer at
resolutions 0-0.5, 0.5 to 1 cm and then at 1 cm intervals, stored at -20 °C or analysed immediately.
These sample slices were analysed for particle size, porosity, chlorophyll and total organic carbon.
Particle size analysis (PSA) was derived using a method developed by Mason et al. (2011). In short, a
sub-sample of each sediment was screened at 1 mm and laser sized using a Malvern Mastersizer
2000. The remaining sample was wet split at 1 mm, and the > 1 mm sediment was oven dried and
then dry sieved over a range of test sieves down to 1 mm. Sediment < 1 mm was oven dried and
weighed. The results from these analyses were combined to provide a full distribution. Summary
statistics, including % gravel, % sand and % mud were derived from the full distribution dataset.
Total Organic Carbon (TOC) was analysed using broadly similar methodology described by Verado et
al., 1990. In short samples were freeze-dried. They were then ground to homogenise the sample.
Inorganic carbonate was removed from a 1.3 g sub-sample using sulphurous acid to excess. Sub-
samples (~0.5 g) were then weighed into tin cups and analysed using a Carlo Erba EA1108 Elemental
analyser.
Chlorophyll a and pigments were extracted in 90 % buffered acetone (Fisher Scientific) and
refrigerated before analysis. A Turner Designs Model 10AU filter fluorometer (Sunnyvale) was used
to measure extracted chlorophyll a fluorescence before and after acidification as described in Sapp
et al. 2010. The fluorometer was calibrated using a solution of pure chlorophyll a (Sigma-Aldrich, St.
Louis) with the concentration being determined spectrophotometrically. The percentage error of
chlorophyll a analyses was <2 % relative to Turner-certified reference material. Porosity was
calculated using the dry weights and wet weights of known volumes of sediment slices assuming a
sediment particle density of 2.7 g cm-3 and a seawater density of 1.035 g cm-3 (Sapp et al. 2010).
DGT probe deployment and retrieval and analysis
The DGT probes and procedural blanks were de-oxygenated in a 0.01 M NaCl solution overnight
using oxygen free-nitrogen. The cores were placed in the incubating tank filled with oxygenated
seawater and were stabilised for 2 hours before deployment of the probes. For each core, two
probes were used: the Chelex gel probe (for metals determination) and the AgI gel probe (for
sulphide determination). The probes were inserted into the sediment core, leaving 1-2 cm between

12
the top of the probe window and the sediment/water interface (as described in Roberts et al., 2013).
Furthermore, Chelex and AgI gel discs were deployed in the incubating tank in parallel with the
probes. The probes and discs were deployed for 24-28 h. The time and temperature were recorded
at the deployment and retrieval points. On removal, nano-pure water was used to rinse off any
sediment traces that remained on the surface of the probes/discs. They were stored in a labelled bag
and kept in the refrigerator prior to transfer to the laboratory for analysis.
Chelex gel: The gel was removed as per the practical guide provided by DGT Research Ltd. For the
probe, the gel was sliced at 0.5 cm resolution and eluted in 1 ml of 1 % HNO3 for 24 h before analysis
of Cd, Cr, Cu, Fe, Mn, Ni, Pb and Zn by Inductively Coupled Plasma-Mass Spectrometry (ICP-MS) and
Inductively Coupled Plasma –Atomic Emission Spectroscopy (ICP-AES). The results of each slice are
then combined to constitute the sediment profiles down the core.
AgI gel: The AgI gels were removed from the probes as per the practical guide provided by DGT
Research Ltd and covered with a hydrated plastic film. The gels were then scanned while wet in a
flat-bed scanner. The greyscale intensity of the scanned images will be analysed with the software
Image J. Using the calibration curve derived by Teasdale et al., 1999, total dissolved sulphides were
quantitatively measured in the gels.
Total Metals
A sub-core from each station was taken and sliced according to its visual description. Each slice was
subsequently analysed for total metals on the <63 µm sediment fraction. Typically, 0.2 g of the
sieved and freeze-dried sediment sample was digested in a mixture of hydrofluoric, hydrochloric and
nitric acids using enclosed vessel microwave. The hydrofluoric acid was then neutralised by the
addition of boric acid and the digest is made up in 1 % nitric acid and further diluted prior to analysis
by ICP-MS and ICP-AES. Quantification of Al, As, Cd, Cr, Cu, Fe, Li, Mn, Ni, Pb, Rb and Zn was done
using external calibration with Indium as internal standard. A certified reference material was run
within each sample batch for quality control. Results are reported in mg kg-1 (ppm).
13
Statistical approaches and analysis
Statistical analysis was undertaken on the metal plots for each station to examine any difference in
metal behaviour within or between the three stations. Initially, profile plots of all eight metals were
completed at all sites. For metals exhibiting the biggest differences between sites (Pb, Ni, Mn and
Fe), further modelling was done to tease out the statistical evidence for these differences. We
describe this modelling below.
The depth profiles for each of the metals at the three stations was smoothed by a Generalised
Additive Model (GAM) (Wood, 2006) using the R package mgcv (R Development Core Team, 2010).
We used thin plate regression splines to smooth the data and the degree of smoothing was set to
the minimum needed to explain the main fluctuations in the profile. Two different kinds of models -
one assuming independence and one assuming one-lag correlation were required to model the
depth profiles of the metals. Both models were used to fit a GAM model to the metal profile and
examine the variance (mid 95 % envelope) of points around the smoothed line. Using this model
within and between site differences could be examined. Full details of the modelling can be found in
Parker et al. (in prep).
Results (Aims 1 and 3)
The monitoring at Souter Point has been undertaking by Cefas (formerly MAFF) since the 1970’s. The
sediments in the disposal site, which is the immediate area where the contaminated dredged
material was disposed of in 2005, have been described as an admixture of sand and muddy sands in
the centre of the capped area (Cap1, Cap2 and Cap5) and sandy mud (at stations Cap 9 and Cap 7)
(see Figure 1). The reference station located to the north (TC2) was also observed to be a
combination of gravelly muddy sands, while those to the south of the disposal site (stations TC3 and
TC4) consisted of sandy muds (Birchenough et al. 2007). As part of the ‘check monitoring’
programme, zinc and mercury showed higher concentrations during 2005 at the stations located in
the centre of the disposal site. During earlier surveys conducted in the area zinc concentrations also
have been noted to be higher mainly to the west of the disposal site. Earlier surveys (e.g. in 2006)
showed an increased in copper concentrations, which was also observed at station Cap 7 (west of
the centre of the disposal site) (Birchenough et al. 2007). Previous work conducted under the large
monitoring effort in this area (e.g. work conducted under SLAB5) helped to inform and target a suite
of stations to test the DGT work alongside the SPI images.
14
A summary of sediment characteristics for the three stations is shown in Table 1 a and b and Figure
4. Bulk sediment and metal flux profiles are in Figure A1, Appendix 1. All stations were composed of
muddy sands. Porosity in the upper layers of the sediment at reference station was lowest (0.48
mg/m2) and elevated in the deeper sediment layers at the disposal stations. Total organic carbon
was lowest at the reference station with higher carbons at the two disposal stations. Porosity and
total organic carbon vertical profiles (Figure 4b-c) illustrate the difference between the reference
station which showed a background decrease in porosity with depth and decreasing carbon. In
contrast, the disposal stations exhibited complex silt/clay, porosity and carbon signatures down-core
related to disposal events. The heterogenous structure in vertical profiles illustrated the disposal
events at the impacted stations. The pigment profiles were similar across the stations and illustrate
the water column source with similar degradation profiles with depth (Figure 4 d-e). The oxygen
penetration and profiles were similar for all the stations, with diffusion-type profiles and with
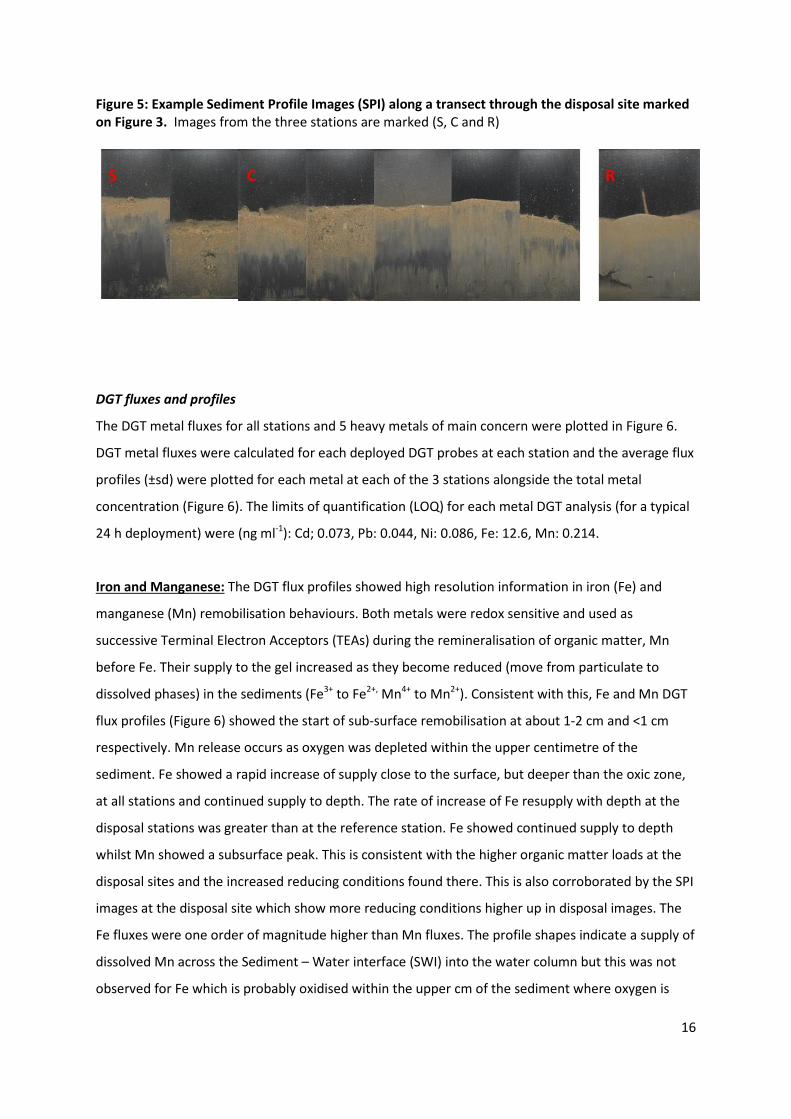
oxygen consumed within the upper 1 cm of the sediment. The deeper redox conditions
demonstrated by the SPI images using Fe3+ colour (Figure 5) were deepest at the reference station,
and shallowest at the disposal stations. The SPI images also showed the occurrence of sulphide
formation (black colouration) to be shallower in the disposal station sediments and more intense
when compared to the reference station.
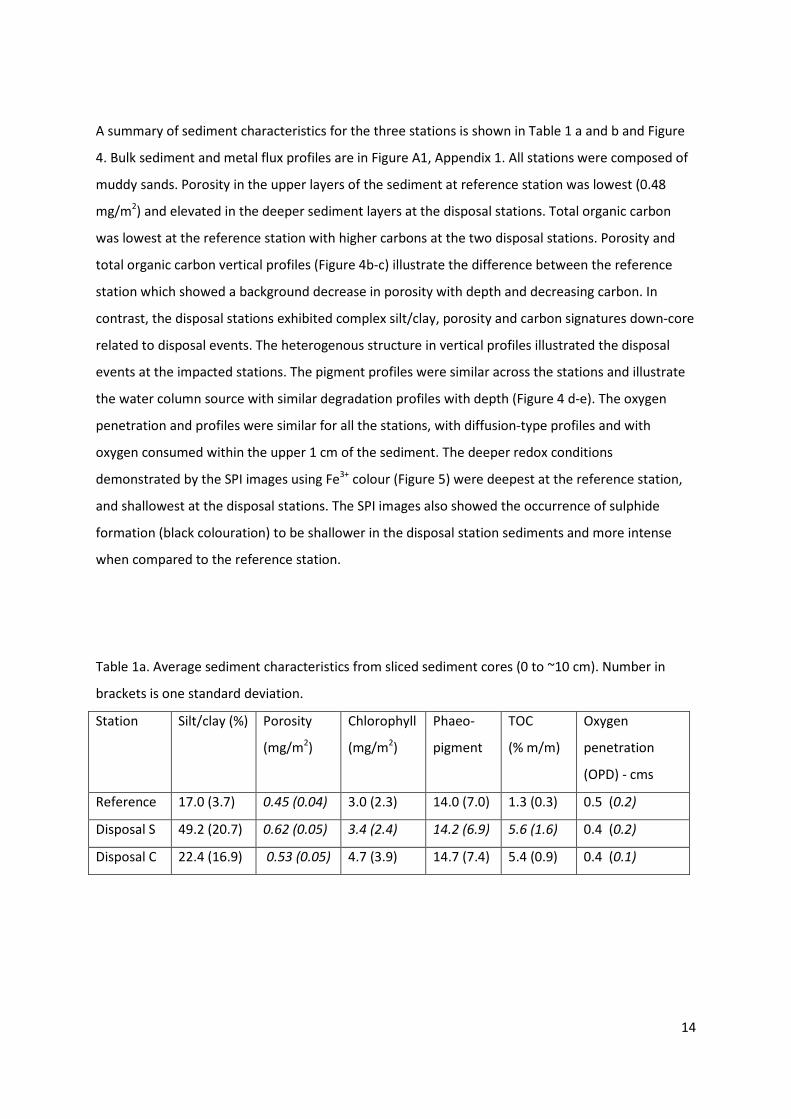
Table 1a. Average sediment characteristics from sliced sediment cores (0 to ~10 cm). Number in
brackets is one standard deviation.
Station Silt/clay (%) Porosity
(mg/m2)
Chlorophyll
(mg/m2)
Phaeo-
pigment
TOC
(% m/m)
Oxygen
penetration
(OPD) - cms
Reference 17.0 (3.7) 0.45 (0.04) 3.0 (2.3) 14.0 (7.0) 1.3 (0.3) 0.5 (0.2)
Disposal S 49.2 (20.7) 0.62 (0.05) 3.4 (2.4) 14.2 (6.9) 5.6 (1.6) 0.4 (0.2)
Disposal C 22.4 (16.9) 0.53 (0.05) 4.7 (3.9) 14.7 (7.4) 5.4 (0.9) 0.4 (0.1)
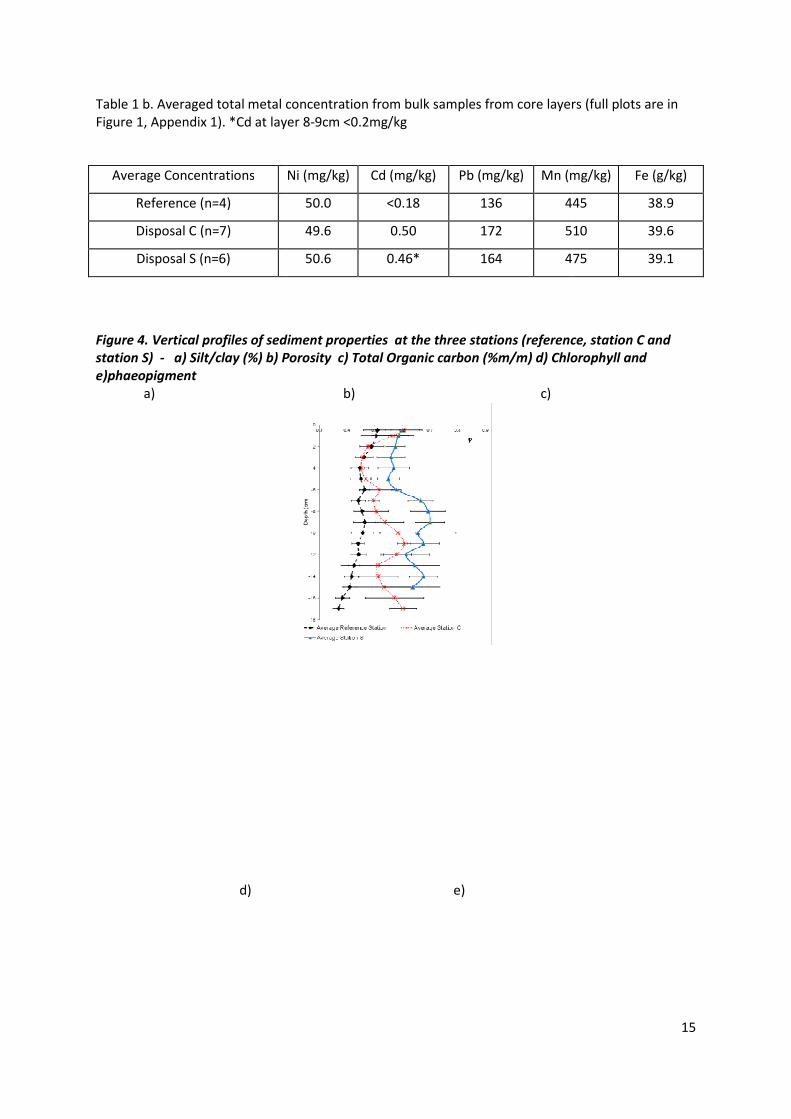
Table 1 b. Averaged total metal concentrationFigure 1, Appendix 1). *Cd at layer 8
Figure 4. Vertical profiles of sediment properties at the three stations (reference, station C and
station S) - a) Silt/clay (%) b) Porosity c) Total Orga
e)phaeopigment
a)
d) e)
Average Concentrations
Reference (n=4)
Disposal C (n=7)
Disposal S (n=6)
Table 1 b. Averaged total metal concentration from bulk samples from core layers (full plots are in *Cd at layer 8-9cm <0.2mg/kg
4. Vertical profiles of sediment properties at the three stations (reference, station C and
a) Silt/clay (%) b) Porosity c) Total Organic carbon (%m/m) d) Chlorophyll and
b) c)
d) e)
Ni (mg/kg) Cd (mg/kg) Pb (mg/kg) Mn (mg/kg)
50.0 <0.18 136 445
49.6 0.50 172 510
50.6 0.46* 164 475
15
from bulk samples from core layers (full plots are in
4. Vertical profiles of sediment properties at the three stations (reference, station C and
nic carbon (%m/m) d) Chlorophyll and
Mn (mg/kg) Fe (g/kg)
445 38.9
510 39.6
475 39.1
16
Figure 5: Example Sediment Profile Images (SPI) along a transect through the disposal site marked
on Figure 3. Images from the three stations are marked (S, C and R)
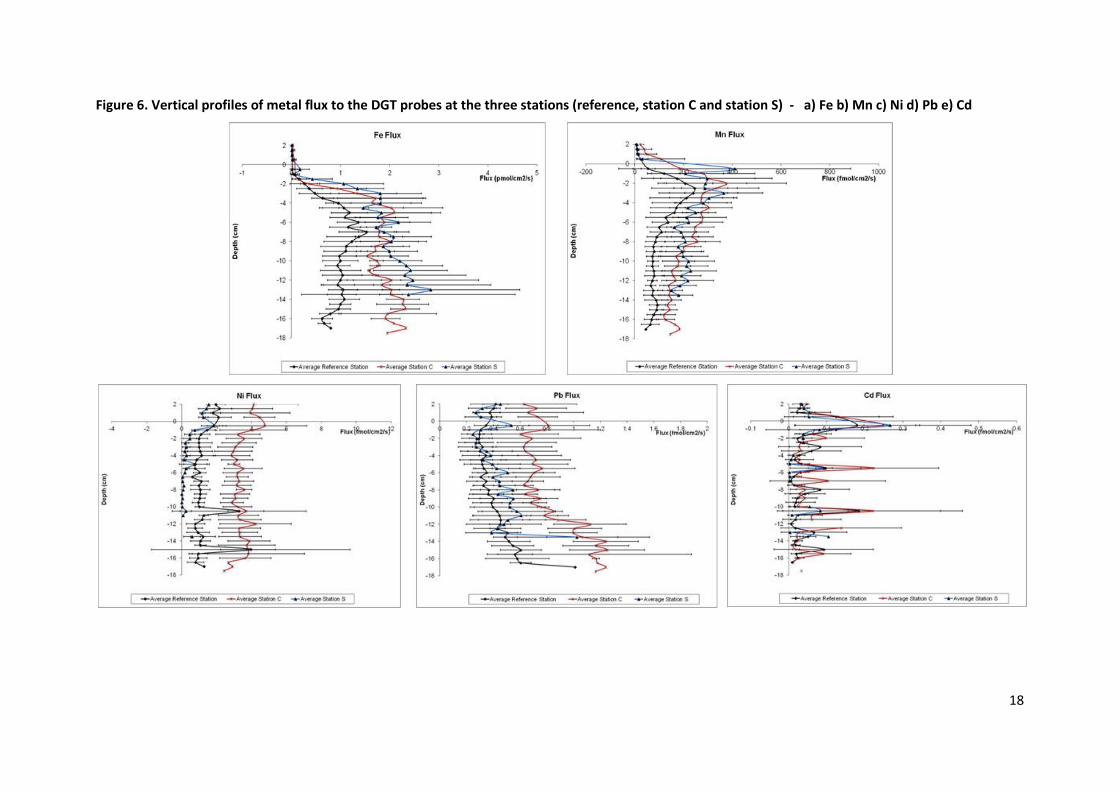
DGT fluxes and profiles
The DGT metal fluxes for all stations and 5 heavy metals of main concern were plotted in Figure 6.
DGT metal fluxes were calculated for each deployed DGT probes at each station and the average flux
profiles (±sd) were plotted for each metal at each of the 3 stations alongside the total metal
concentration (Figure 6). The limits of quantification (LOQ) for each metal DGT analysis (for a typical
24 h deployment) were (ng ml-1): Cd; 0.073, Pb: 0.044, Ni: 0.086, Fe: 12.6, Mn: 0.214.
Iron and Manganese: The DGT flux profiles showed high resolution information in iron (Fe) and
manganese (Mn) remobilisation behaviours. Both metals were redox sensitive and used as
successive Terminal Electron Acceptors (TEAs) during the remineralisation of organic matter, Mn
before Fe. Their supply to the gel increased as they become reduced (move from particulate to
dissolved phases) in the sediments (Fe3+ to Fe2+, Mn4+ to Mn2+). Consistent with this, Fe and Mn DGT
flux profiles (Figure 6) showed the start of sub-surface remobilisation at about 1-2 cm and <1 cm
respectively. Mn release occurs as oxygen was depleted within the upper centimetre of the
sediment. Fe showed a rapid increase of supply close to the surface, but deeper than the oxic zone,
at all stations and continued supply to depth. The rate of increase of Fe resupply with depth at the
disposal stations was greater than at the reference station. Fe showed continued supply to depth
whilst Mn showed a subsurface peak. This is consistent with the higher organic matter loads at the
disposal sites and the increased reducing conditions found there. This is also corroborated by the SPI
images at the disposal site which show more reducing conditions higher up in disposal images. The
Fe fluxes were one order of magnitude higher than Mn fluxes. The profile shapes indicate a supply of
dissolved Mn across the Sediment – Water interface (SWI) into the water column but this was not
observed for Fe which is probably oxidised within the upper cm of the sediment where oxygen is

17
present. The DGT flux profiles indicate that the resupply to the gel is higher at the disposal sites
despite similar bulk Fe and Mn levels across the sites.
Cadmium: All 3 stations showed a peak of DGT available Cd at the SWI. Below the SWI, levels of Cd
supply were low at all stations apart from distinct peaks of higher Cd supply at distinct depths (0.1 to
0.2 fmolcm-2 s-1). There was no trend of Cd release down core in any of the stations. The lack of
difference in Cd supply between the reference and disposal stations would imply that Souter Point
stations were not a significant source of Cd release into the pore-water, associated with material
disposal.
18
Figure 6. Vertical profiles of metal flux to the DGT probes at the three stations (reference, station C and station S) - a) Fe b) Mn c) Ni d) Pb e) Cd
19
Lead: Lead profiles showed increasing flux to the DGT gel down the station cores, with flux rate
increasing in all stations in the deeper sediment layers. The fluxes at the reference station and at the
disposal station S were similar, whilst disposal station C showed the highest fluxes (Figure 6). The
variance in Pb flux with depth was lower at the reference stations and highest at the disposal
stations. This variance was similar to other metals, illustrating the complexity in metal cycles
introduced by disposal operations. The total levels of particulate Pb were highest at the disposal
station C, but only slightly elevated in comparison to the highest supply rate observed. This
discrepancy showed that controls of metal release could be complex and therefore cannot be
determined from total sediment metal content alone. Both disposal stations could be acting as
sources of pore-water Pb to the water column in contrast to the reference station.
Nickel: All 3 stations showed an increase in Ni supply to the gel in the upper few centimetres of the
sediment, compared with consistent (and lower) supply rates with depths greater than 5cm. The
overall supply of Ni to the sediment pore-water throughout the profile at Disposal station C was
higher than the other two stations. Similar to Pb behaviour, both disposal stations could be acting as
sources of pore-water Ni to the water column in contrast to the reference station. For Ni this could
be driven by local release to pore-waters in the upper layers of the sediment (0 to 5 cm).
AgI gels – sulphide: Metal availability and mobility can be closely linked to the amount of free
sulphide ions in sediments. Deployment of AgI gel probes into the sediments cores revealed that
free sulphide was at or below the limit of detection for the DGT based method evaluated through
colour scanning. This correlated well with the high concentrations of free Fe and Mn ions observed
in the metal profiles, as any free sulphide would have reacted with the Fe and Mn to form insoluble
iron/manganese- sulphide complexes, which would have become unavailable to the gel.
A summary of the metal behaviour obtained at the 3 disposal stations as derived by DGT profiles and
comparison to total bulk metal reservoir is presented in Table 2.
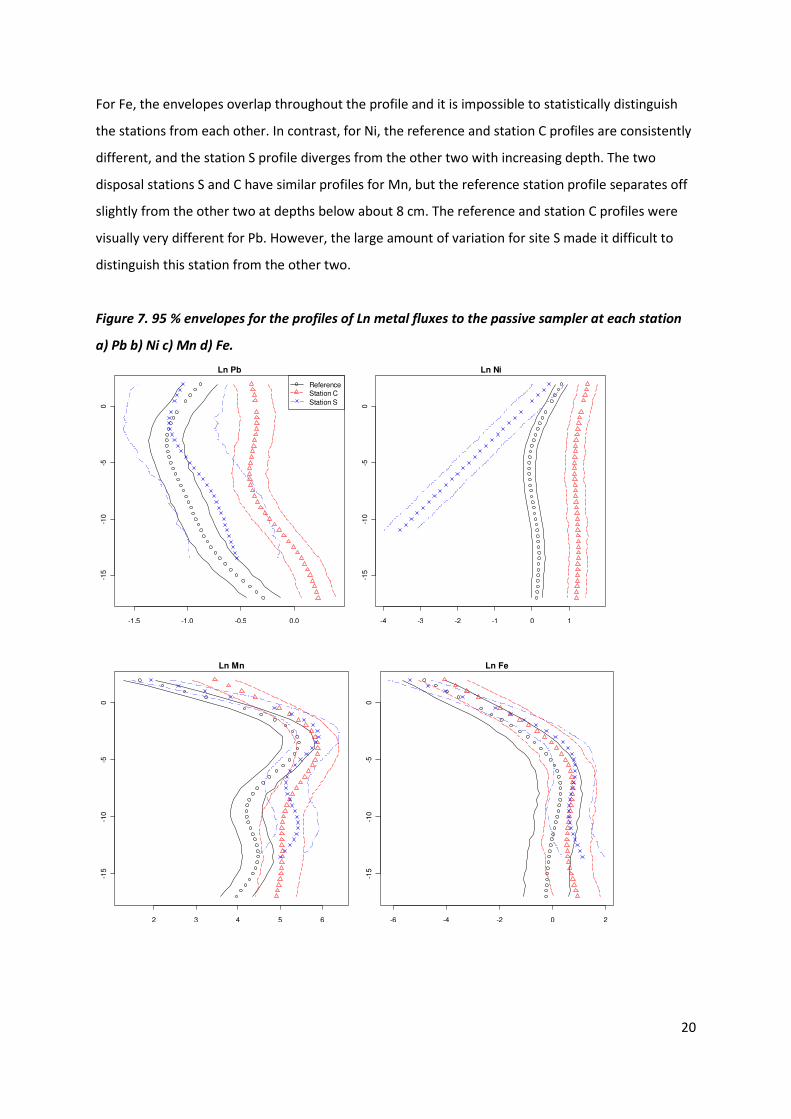
Metal flux profile modelling:
Figure 7 shows natural log depth profile plots for all eight metals. For Cd, Cr, Zn and Cu it is difficult
to distinguish the profiles between the references and disposal sites. For the remaining four metals
(Pb, Ni, Mn and Fe), the 95 % envelope plots in Figure 7 below illustrate the differences between the
stations.
20
For Fe, the envelopes overlap throughout the profile and it is impossible to statistically distinguish
the stations from each other. In contrast, for Ni, the reference and station C profiles are consistently
different, and the station S profile diverges from the other two with increasing depth. The two
disposal stations S and C have similar profiles for Mn, but the reference station profile separates off
slightly from the other two at depths below about 8 cm. The reference and station C profiles were
visually very different for Pb. However, the large amount of variation for site S made it difficult to
distinguish this station from the other two.
Figure 7. 95 % envelopes for the profiles of Ln metal fluxes to the passive sampler at each station
a) Pb b) Ni c) Mn d) Fe.
-1.5 -1.0 -0.5 0.0
-15
-10
-50
Ln Pb
ReferenceStation C
Station S
-4 -3 -2 -1 0 1
-15
-10
-50
Ln Ni
2 3 4 5 6
-15
-10
-50
Ln Mn
-6 -4 -2 0 2
-15
-10
-50
Ln Fe
21
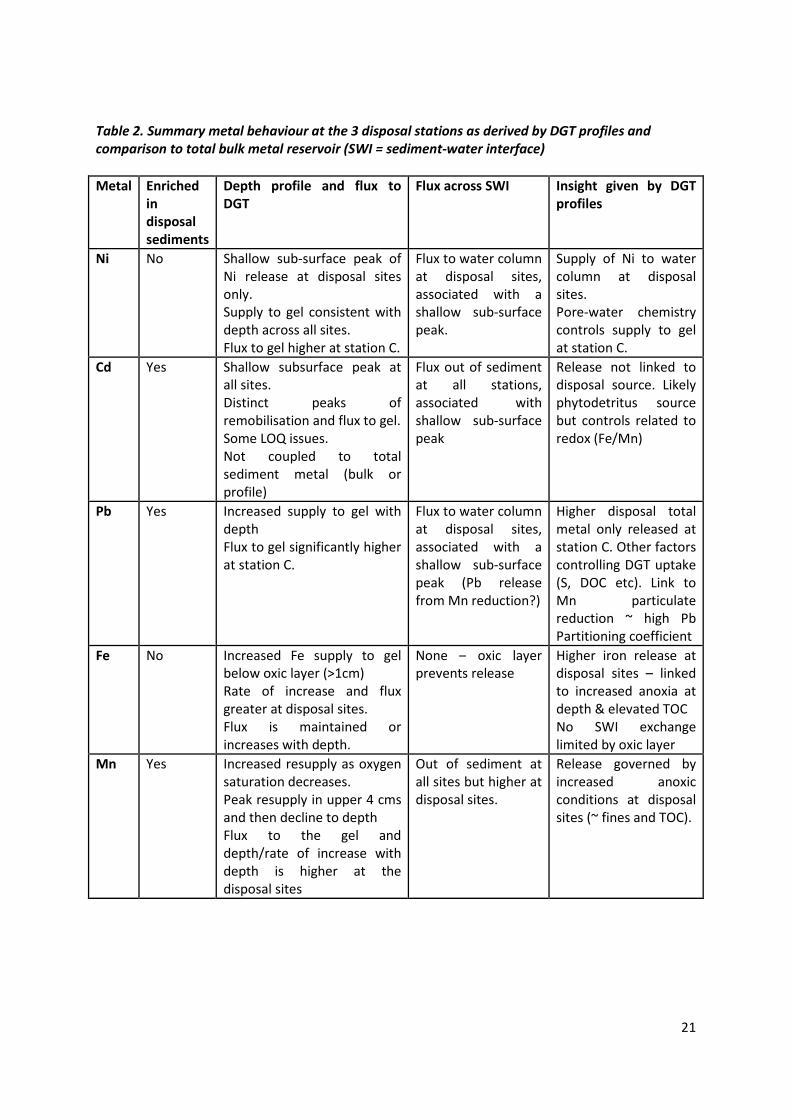
Table 2. Summary metal behaviour at the 3 disposal stations as derived by DGT profiles and
comparison to total bulk metal reservoir (SWI = sediment-water interface)
Metal Enriched
in
disposal
sediments
Depth profile and flux to
DGT
Flux across SWI Insight given by DGT
profiles
Ni No Shallow sub-surface peak of Ni release at disposal sites only. Supply to gel consistent with depth across all sites. Flux to gel higher at station C.
Flux to water column at disposal sites, associated with a shallow sub-surface peak.
Supply of Ni to water column at disposal sites. Pore-water chemistry controls supply to gel at station C.
Cd Yes Shallow subsurface peak at all sites. Distinct peaks of remobilisation and flux to gel. Some LOQ issues. Not coupled to total sediment metal (bulk or profile)
Flux out of sediment at all stations, associated with shallow sub-surface peak
Release not linked to disposal source. Likely phytodetritus source but controls related to redox (Fe/Mn)
Pb Yes Increased supply to gel with depth Flux to gel significantly higher at station C.
Flux to water column at disposal sites, associated with a shallow sub-surface peak (Pb release from Mn reduction?)
Higher disposal total metal only released at station C. Other factors controlling DGT uptake (S, DOC etc). Link to Mn particulate reduction ~ high Pb Partitioning coefficient
Fe No Increased Fe supply to gel below oxic layer (>1cm) Rate of increase and flux greater at disposal sites. Flux is maintained or increases with depth.
None – oxic layer prevents release
Higher iron release at disposal sites – linked to increased anoxia at depth & elevated TOC No SWI exchange limited by oxic layer
Mn Yes Increased resupply as oxygen saturation decreases. Peak resupply in upper 4 cms and then decline to depth Flux to the gel and depth/rate of increase with depth is higher at the disposal sites
Out of sediment at all sites but higher at disposal sites.
Release governed by increased anoxic conditions at disposal sites (~ fines and TOC).

22
Macrofaunal communities
Macrofaunal analysis collected from grab samples collected under the larger monitoring programme
SLAB5, identified a total of 2489 individuals and 61 taxa at Souter Point from the samples collected
during 2011 (Figure 8 a-b). The main taxonomic groups were represented by Annelida (56 %),
Mollusca (11 %), Miscellanea (5 %), Echinodermata (23 %), and Crustaceans (5 %) (Figure 8-c),
showing that the disposal site station are populated by a reduced number of benthic species when
these were compared to the stations located outside the disposal site (shown as reference stations
in Figure 1).
The total abundance of individuals ranged from 101 to 324 per 0.1 m2 across the study area in 2011.
Although some stations (e.g. CAP9, TC3, TC4) showed significantly higher total abundances than
others, many stations from within and outside the disposal site exhibited comparable numbers of
individuals, between 275 and 324 per 0.1 m2 (Figure 8a). The total number of species was doubled at
TC3 when compared to Cap 1, which was expected (Figure 8b).
Figure 8. Univariate measures collected for benthic communities at Souter Point disposal site in
2011, these are: a) total number of individuals, b) number of species and c) main taxonomic
groups.
0
50
100
150
200
250
300
350
CAP 1 CAP 2 CAP 5 CAP 9 TC 3 TC 4
No
of in
divi
dual
sN
o of
spe
cies
a)
Stations
0
10
20
30
40
50
60
70
80
90
CAP 1 CAP 2 CAP 5 CAP 9 TC 3 TC 4
b)
0 10 20 30 40 50 60
Echinodermata
Annelida
Mollusca
Crustacea
Miscelania
% contribution
Mai
n ta
xono
mic
grou
ps
c)

23
Sediment Profile imagery interpretation
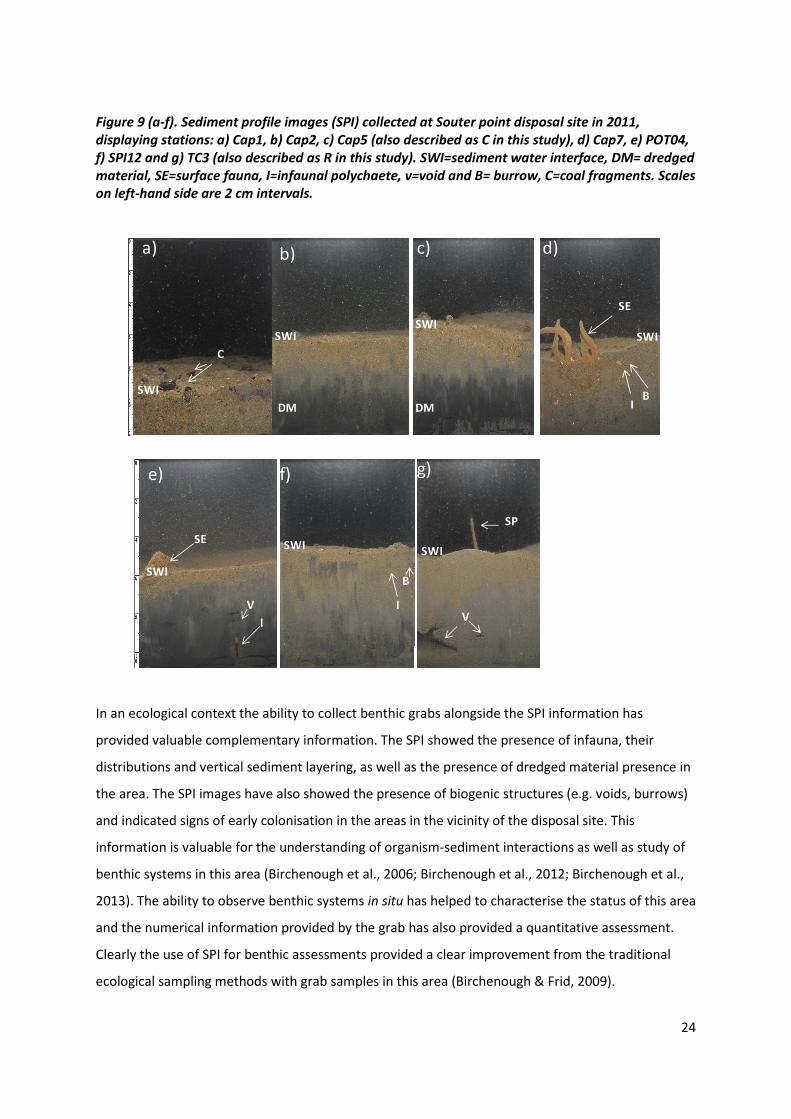
The SPI images obtained during the May 2011 survey confirmed the presence of dredged material
layers, showed as dark or black sediment presence and thin layers of silts and sand in the centre of
the disposal site (Figure 9b-c). There was a limited SPI penetration at station Cap1, mainly due to the
compacted nature of the sediment layers. Images indicated the presence of some coal fragments
observed on the surface of the sediment (Figure 9a). In contrast, at Cap7 (located immediate outside
the disposal site) showed also indication of muddy sediments with presence of surface fauna
(*tentative identification corresponds to the bryozoan Alcyonidium diaphanum). Some images also
showed indication of the burrowing echinoderm Ophiura sp. (Figure 9d).
The station POT6, located north of the disposal site showed clear evidence of the presence of
benthic burrowing infauna polychaetes and also attached Serpulids polychaetes (*tentative
identification corresponds to Pomatoceros sp.) (Figure 9e). At station SPI12 (which is one of the
southern reference stations) there was also indication infauna and burrowing activity in the top
surface of the image (Figure 9f). Data collected at northern stations further away from the centre
(TC3) showed the presence of fine sediments, surface fauna (e.g. sea pen *tentative identification
corresponds to Virgularia mirabilis) and feeding voids observed at 3-4 cm (Figure 9g).
The overall aRPD calculation ranged from 2.0 to 6.0 cm across the stations (Figure 9a-g), which
demonstrated shallow aRPD layers in the disposal site area, since there is some fauna observed in
the newly added material. There are clear deep aRPD layers at the stations located north and south
of the disposal area. The aRPD measured at the reference station was over 5 cm, which
corresponded to the biological activity (Figure 9 f-g). The aRPD depth values are the most routinely
measurable and defensible parameter in SPI images. The aRPD depth is base don the colour change
of the sediment profile from the brow colour tonnes at the surface (oxidative state; Lyle 1983) to the
grey-black colour tones at depth. The aRPD values provide a good estimate of the depth of oxidised
sediment and have important weighting on determining the condition of benthic community
(Germano et al., 2011).
24
Figure 9 (a-f). Sediment profile images (SPI) collected at Souter point disposal site in 2011,
displaying stations: a) Cap1, b) Cap2, c) Cap5 (also described as C in this study), d) Cap7, e) POT04,
f) SPI12 and g) TC3 (also described as R in this study). SWI=sediment water interface, DM= dredged
material, SE=surface fauna, I=infaunal polychaete, v=void and B= burrow, C=coal fragments. Scales
on left-hand side are 2 cm intervals.
In an ecological context the ability to collect benthic grabs alongside the SPI information has
provided valuable complementary information. The SPI showed the presence of infauna, their
distributions and vertical sediment layering, as well as the presence of dredged material presence in
the area. The SPI images have also showed the presence of biogenic structures (e.g. voids, burrows)
and indicated signs of early colonisation in the areas in the vicinity of the disposal site. This
information is valuable for the understanding of organism-sediment interactions as well as study of
benthic systems in this area (Birchenough et al., 2006; Birchenough et al., 2012; Birchenough et al.,
2013). The ability to observe benthic systems in situ has helped to characterise the status of this area
and the numerical information provided by the grab has also provided a quantitative assessment.
Clearly the use of SPI for benthic assessments provided a clear improvement from the traditional
ecological sampling methods with grab samples in this area (Birchenough & Frid, 2009).
a) b) c) d)
e) f) g)
SWI
SWISWI
SWI
SWISWI
SWI
DM DM
SE
SP
VV
C
I
I
B
IB
SE
25
Discussion
An effective monitoring plan needs to be fit for purpose and provide robust scientific evidence to
inform the regulators. The collective approaches of using the SPI (to provide a rapid spatial
technique to identify comparative site redox and disposal material) combined with DGT gel sampling
(and associated environmental variables) at Souter Point provided an improved assessment of the
sediments, mainly in relation to the direct metal release to the sediment pore-water (potential
bioavailability), across the sediment –water interface (source/sink). The combined techniques can be
readily linked within monitoring programmes in a cost-effective manner and targeted to site or
contaminant specific issues. The sections below also outline specific recommendations and lessons
learnt from this work.
Application of gel technology and SPI in
monitoring and assessment studies (Aim
3)
Current marine strategies are targeting our efforts to assess the status of marine systems. In UK
waters, the combination of complementary science (R&D, monitoring and current practices)
provides evidence-based advice to regulators (Bolam et al, 2006). The parallel approach undertaken
under this module will complement the current advice and, ultimately, provide further details during
a license application at dredged material disposal sites. Cefas’ work is aimed to obtain maximum
benefit from this work, providing cost-effective assessments in support of monitoring practices for
seafloor systems. The work undertaken in relation to the SPI technology and DGT has highlighted the
following topics:
• Application of high resolution DGT passive samplers to the three stations in this study has
revealed several new insights into the behaviour and controls of various metals within the
sediments associated with disposal as provided by the high resolution flux profiles. These
profiles showed comparative resupply of metal to pore-waters between different stations
(disposal and non-disposal), trends in fluxes with depth (notably Pb), fluxes across the
sediment-water interface (Mn, Cd) and changes in resupply for a metal between stations
(notably Ni, despite a consistent total Ni reservoir). The higher resolution understanding
provided by the gels and hence fuller understanding of metal resupply and availability within

26
sediment pore-waters provides new information on whether sediments are acting as
source/sink for metals and links to disposal activity.
• For some metals there doesn’t seem to be a strong disposal signature related to the total
metal reservoir (either profile or bulk levels). This is seen for Cd, where the release pattern is
unrelated to depth profiles of the total metal and also the total sediment levels which are
elevated in the disposal stations. This has also been identified for both Pb and Ni where
metal flux at station C is elevated despite contrasting total metal levels at this station in
comparison to the other two stations. It appears that this comparison between the total
metal reservoir and availability to the passive sampler also illustrates the complexity of
metal cycling within sediments once released to the pore-water. The availability or lack of
other pore-water chemical species (DOC, sulphur species) will also control metal availability.
The lack of detectable sulphide species in these sediments is likely to be the reason for high
comparative availability of metal ions to the passive sampler.
• The use of SPI has proven to be an effective and rapid tool for monitoring dredged material
disposal sites. The use of the SPI has helped under this work to monitor the presence of
dredged material, fauna, sediment type and aRPD. A full analysis of the monitoring effort
conducted at Souter Point under SALB5 auspices and this module is currently being
produced (Birchenough et al. in prep.)
Associated sediment modelling of DGT metal profiles:
Comparison of metal profiles between stations has usually occurred by visual comparisons.
However, this is not statistically robust and with higher variances induced by disturbance is is
essential to have a method which can detect metal differences within and between sites or changes
over time. The modelling of the DGT metal profiles has demonstrated;
• A new methodology which allows statistical analysis and investigation of high resolution
metal profiles.
• Provides increased confidence in an assessment of the differences between sites, processes
driving them and how disposal is affecting them.
• It provides increased power to statistically determine status and variances of conditions and
detect changes over time or space.
27
Capabilities
This study has been able to highlight various aspects of the SPI and DGT performance, capability and
limitations which are listed and discussed below and provide guidance on their future application
Capability of the DGT and SPI technology:
• Deployment of the gels can provide high resolution flux profiles of a suite of metals
• They can provide insight into areas of release of metal to sediment pore-waters (with depth
and between stations)
• The can provide estimates of fluxes into and from the sediments, and whether the sediment
could be acting as a source or sink post disposal or other management actions.
• When combined with other supporting information (organic matter, sediment type, redox,
metal loading, SPI) the metal profiles can highlight the changes in processes likely to be
driving metal behaviour and contrast between stations, in particular the heterogeneity
created through disposal events.
• The links between total sediment metal reservoir and release to the pore-water can be
investigated. As shown here metal resupply to pore-water often does not reflect the total
metal reservoir and disposal effects of total metal loading on biology may be more complex.
DGT fluxes can provide some insight into the potential bioavailable fraction and areas of
release/exposure within the sediment and with space.
• The gel metals (potentially bioavailable fraction) can improve links to biological effects &
toxicity monitoring.
• The SPI capability has proven their utility at Souter Point disposal site as it has helped to
monitor the presence of dredged material disposal layers, faunal presence ( in the disposal
and at reference stations), sediment types and the aRPD layers, which have helped to relate
to the status of the stations and overall area ( Birchenough et al., 2009)
• The overall combination of the SPI and DGT information has enabled us to obtain a more
detailed level of information from the disposal site. The ability to provide profiles of metals
and understand the depth of the metals alongside other measurements (e.g. chlorophyll a,
% silt/clay, porosity, phaeopigments, TOC and OPD) as well as the faunal presence,
sediments at stations were there was dredged material dispose of when compared to
reference stations has advantages, specially when trying to characterise the station
subjected to disposal activity. This level of information could help to identify future disposal
28
areas as well as improving current knowledge of exiting sites with higher contractions of
metals.
Methodology & application of DGT technology and SPI within monitoring programmes:
• Relatively easy technique to use and to build into the monitoring programme alongside
other measurements of total metals given coring equipment is available.
• Standard laboratory cleaning procedures are required – these are relatively inexpensive /
routine to set-up and easy to check with appropriate handling and DGT deployment method
blanks.
• Higher resolution measurements (i.e. a slicing resolution of 1cm or above, compared to
0.5cm resolution applied within this module) for sediment types and other key variables are
needed but this level of sampling depends on the question asked of this technique so costs
can be adapted accordingly.
• Incubation times for the gels range from 24 to 36 h to allow sufficient accumulation of
metal. Samples must be kept in appropriate conditions for this time (cool, dark, aerated) but
the ship-time required to collect such cores is comparatively short (~ 1-2 h). In-situ
deployments (i.e. having the gels on the face of the SPI camera) would require considerable
time for the vessel to be on station.
• In this study deployment of the gel samplers was standardised to 24-36 h and gave good
metal LoQs for most elements. Generally there are no standard or recommended
deployment times reported in the literature but future standardisation and determination of
optimum probe deployment time would be appropriate for varying sediment types and
matrices (DOC etc) to check flux calculation assumptions (see Chiffroy et al., 2011).
• Overall, DGT costs can be higher than analysis of a total metal. However, this can be cost-
effective when aimed at specific questions of metal release into pore-waters, depth
information and flux to water column that total metal information cannot supply.
• The use of SPI technology has proven it to be an effective and cost-effective tool for disposal
site monitoring, helping to target specific areas where there is presence of dredged and non-
dredged material areas. Some of these types of approaches could be ‘tailor’ to answer
specific monitoring questions for example, in areas were there is historic legacy of metals
and/or contaminants or to support future areas where there is a need to place localised
sediments with high presence of metals and /or contaminants ( e.g. capping areas)
29
• The rapid return of information from the SPI survey, helped to identify the
presence/absence of fauna as well as biogenic structures (e.g. burrowing activity, polychaete
tubes, etc.), provided a rapid assessment of the sediment types and redox layers in the
stations analysed.
• The SPI technique has been effectively applied in dredged material monitoring in the US
(Germano et al., 2011). The SPI technology has been also employed in the UK to monitor
dredged material disposal site, particularly at and specifically at Souter Point ( Birchenough
et al 2009)
• Overall the use of the SPI technology with DGT samplers could provide a rapid and cost-
effective monitoring design, helping to spatially cover large areas with the SPI technology
and then ground-truthing with a dedicated effort (e.g. sediment cores). A fit-for purpose
design could then enable the monitoring of metals, sediment and fauna to provide a rapid
baseline information where there is suspected high metal concentration, which could help
to keep localised disposal areas with an accurate knowledge of high concentrations of
metals.
Limitations of SPI and DGT technologies
(Aim 4)
The combination of techniques employed in this module has proven to be effective in providing a
rapid assessment for this area. The SPI survey provided additional details on the vertical layering of
the sediment and the fauna (e.g. showing early signs of colonisation in the disposal areas as well as
showing evidence of biogenic structures in the reference areas), this technique is widely accepted
for monitoring areas where dredged material disposal has taken place (Germano et al., 2011) and in
the UK the SPI technique has also become a routine sampling tool to assess sediment status. The
opportunity to complement the SPI work with the DGT gels has helped to advance our current
understanding on how the SPI technology could be deployed with additional DGT gels for disposal
site monitoring. The DGT trial has also highlighted some limitations of the technique which are
detailed below:
• To successfully deploy DGT gels, there is a need to undertake a sediment corer survey on
board (although a routine piece of equipment) as well as incubation equipment for gel
incubations (on-board or in the lab). Previous research conducted by Teal et al. (2009)
deployed the SPI camera and attached the DGT gels to the face plate of the camera. In this
30
study there were initial discussions to undertake a similar approach as conducted by Teal et
al. (2009). However, due to the logistic constraints (e.g. time, deployment and calibration ),
the option to collect SPI images and incubate sediment corers to aid DGT deployment was
deemed to be the best option under this module.
• Calculations of the metal fluxes (and approximate metal concentrations) rely on a number of
assumptions of performance of the sediment/pore-water matrix (Davison et al., 2007).
However, these are increasingly supported by a broad literature base and DGT user
community.
• Heterogeneity and complexity of sediment processes can make profiles and status
associated with area/stations difficult to interpret. However, this can be overcome by
focused sampling on appropriate spatial scales and resolution. Links to gels and more rapid
spatial techniques can provide a broader and more integrated application of DGT findings
(Teal et al., 2009; Teal et al., 2013).
• The Chelex DGT is only designed for a selected number of metals (Fe, Mn, Cu, Zn, Ni, Pb, Cr).
Future work would require several probes with different gel type to cover most of the
metals suite analysed for the conventional method (Al, As, Li, Hg, Rb). Samplers and resin
types for other metals and organic compounds (TBT) are under development.
• DGT profiles describe the amount of metal available to a gel from the pore-water but not
necessarily the dynamic between a total particulate metal level in sediment and the gel.
These complex dynamics (see Figure 1) can be controlled by other pore-water species (DOC,
AVS) and would be a topic for future work to aid determination of risk of metal
bioavailability from total metal levels in sediments.
• In relation to SPI, one aspect that will have to be considered is the colour changes in the
image, in relation to the aRPD measurement. At Souter Point, there has been some
additional sediment added to these areas (e.g. re-topping the capping material), hence in
some cases the additional material could not be a real aRPD, hence a good understanding of
the area and long-time series of SPI images could help to understand and characterise
accurately the aRPD measures at some of the stations in the disposal site.
• In relation to the SPI technology per se, image analysis requires training and QA. Cefas has a
good knowledge of SPI image analysis, and can rapidly help to identify areas subjected to
human activity.

31
Recommendations for future routine
application (Aim 5)
The monitoring of disposal sites in UK waters is a priority for the regulators, this work has
highlighted clear messages that are useful to consider when designing a monitoring survey. Firstly,
the use of SPI as a routine sampling tool to monitor dredged material disposal sites, has shown the
ability to provide a sound characterisation of the fauna, sediment types, presence and absence of
dredged material and allowed the delineation of the aRPD. Cefas has been monitoring the Souter
Point disposal site since 2005 with SPI and therefore the level of information that SPI can provide a
rapid provision of scientific evidence to characterise the status of the areas subject to dredged
material disposal as well as for assisting the design of a fit-for purpose monitoring. We have
highlighted some specific recommendation below:
• The use of SPI also helped to inform the collection of sediment corers, which were used in
this study (e.g. presence of dredged material and clean sediments) to target the area subject
to disposal of dredged material during the capping exercise. The continuous use of this
technique could help to design fit-for purpose benthic surveys, with detailed information on
the profile of sediments.
• The use of DGT gels helped to provide an informed profile of metals with depth in sediments
also provides a valuable method to consider alongside the SPI technique for rapid and
effective monitoring of areas subject to dredged material disposal. This method could be
adopted as complementary way to assess site legacy of metals or status of the areas
subjected to disposal activity.
• The use of the DGT gel technology has also proven it utility in helping to distil site specific
questions regarding metal source and sinks, which will help inform the management and
prevention of risks from dredged material disposal in these areas.
• Overall the combination of SPI and DGT can provide a detailed level of information to
support monitoring of these areas with a rapid spatial coverage and also alongside other
environmental characteristics for understanding the additional factors influencing these
marine environments (e.g. AVS/DOC).
32
• This work highlights the benefits of a dedicated SPI survey, enabling the rapid coverage of
seabed areas, and then a follow up DGT work could provide supplementary information for
further characterisation of a dredged material context or material which is suspected to
possess high metal concentrations.
• The techniques employed under this module could also be used to collect baseline
information to characterise new or existing disposal areas
The monitoring effort invested in the UK has concentrated on the quality and status of the marine
environment (Defra, 2010). However Charting Progress 2 also highlighted the lack of knowledge,
tools for assessment and data for characterising the state of shallow subtidal habitats (Foden et al.,
2011). At present, the UK has concentrated scientific monitoring efforts in support of the EU MSFD
which aims to protect and/or restore the European seas, ensuring that human activities are
conducted in a sustainable manner (Borja, 2006; Borja et al., 2010; Borja et al., 2011; Fleischer and
Zettler, 2009), targeting good environmental status (GES) by 2020. GES is defined as the
environmental status of marine waters where these provide ecologically diverse and dynamic oceans
and seas which are clean, healthy and productive within their intrinsic conditions and through its
sustainable use for current and future generations (Van Hoey et al., 2010). The assessment of GES is
based upon a series of 11 ecosystem descriptors covering aspects of biodiversity to energy/noise
parameters (Borja et al., 2011). Some of the information generated under this study can help to
support work on Descriptor 6 (seabed integrity) and Descriptor 8 (contaminants).
Conclusions and way forward
The work undertaken under this module has completed the parallel sampling and testing of SPI
technology with DGT gel techniques. This initial application of DGT passive sampler technology
alongside sediment bulk metal has highlighted the complex relationship found between contaminant
disposal load from particulates and metal availability to the pore-water. Furthermore it has
underlined the heterogeneity found in the sediments at disposals stations, both between stations
and with depth, which is clearly illustrated across the suite of measurements taken, from the visually
patchy nature of SPI images to the high variability observed in DGT depth profiles and flux rates.
Improved statistical modelling and detection technique, such as those presented here, will be
needed to determine disposal specific metal signatures, their controls and future changes.

33
While bulk sediment analysis for metals gives important information about the total quantity of
metals present, i.e. the size of the potentially available sediment metal reservoir and is indicative of
the potential hazard, it does not give information about the actual availability of these metals to the
various components of the ecosystem and thus the actual risk posed – either to the benthic
community or by flux into the overlying water column to the pelagic system. This is why
complementary methodologies such as DGT enable additional insights to understand some of these
questions. The clear differences in metal flux profiles recorded at different stations, which do not
strictly correlate with total metal concentrations in the corresponding slices, illustrate that
environmental parameters are influential in regulating flux and, by implication, availability/
bioavailability. This study evaluated a number of likely parameters, such as organic carbon content,
sediment particle size distribution, free sulphide concentration and chlorophyll a content and
highlighted some interesting relationships. An important example of this is found in the behaviour of
cadmium across all three stations – which while present at very different levels in the bulk sediments
showed similar release behaviour across stations, indicating that in this case its remobilisation is not
driven by input from disposal activities but rather down to biotic inputs (such as sedimented
phytoplankton blooms) that affected disposal and reference sites in equal measure and resulted in
more easily released metal reservoirs at corresponding depth. In contrast, one of the disposal
stations (C) did show increased release of lead and nickel into the water column likely linked to
metals brought to site with the disposed material.
In summary, the use of depth resolving passive samplers such as DGT is complementary to
conventional monitoring of disposal sites and can provide valuable additional information. Further
work to improve understanding of the controlling factors of metal release to pore-waters, and likely
exposure routes of biota within the receiving ecosystem as well as corresponding toxicological
implications would be beneficial in informing management decisions. Such studies could link spatial
surveys of total metal reservoir, pore-water flux (DGTs/gels) and controlling factors such as
DOC/sulphides (see Bull and Williamson; 2001; Knox et al. 2012). Better regional understanding of
the metal release pathways and controls may also help explain stations where total reservoir metals
do and do not tie up with observed biological effects and allow increased efficacy of management
measures through improved risk assessment. This regional approach and application of DGT passive
samplers (potentially combined with SPI) would be adaptable to a regional understanding of
contaminant behaviour and in particular MSFD descriptors (namely 6 and 8) which have linked
controlling processes (faunal presence, sediment type, organic carbon, redox)

34
Such increased understanding would not only enable more robust assessments of risks posed by
disposal of sediments with high contaminant loads or diffuse sediment contaminant issues and but
could also be used when assessing likely impact arising from sediment disturbance events, either
natural events such as storms or human activities such as fishing, dredging and construction.
8. Dissemination
The research developed under this module has been disseminated during a series of conferences
and working groups, these are indicated below:
8.1 Presentations meetings/Study groups or conferences
• R. Parker, T. Bolam, J. Barry, S. Kröger, C. Mason, S. Birchenough, B. Silburn, D. Sivyer, A. G. Mayes and G. R. Fones (2012) The application of passive sampler (DGT) technology for improved understanding of metal behaviour at a marine disposal site. 16th International conference on Heavy metals in the environment (ICHMET 16) Conference, 23-27th September at Rome, Italy.
• Thi Bolam, Ruth Parker, Claire Mason, Jon Barry, Silke Kröger, Briony Silburn, Dave Sivyer, Silvana Birchenough, Andrew Mayes and Gary Fones. The Application of Passive Sampler (DGT) Technology for Improved Understanding of Metal Behaviour at Marine Disposal Sites in the UK ICES Working Group on Marine Sediments 18-22nd March, Lowestoft.
• R. Parker, Thi Bolam, Claire Mason, Jon Barry, Stefan Bolam, Silke Kröger, Silvana Birchenough, Andrew Mayes and Gary Fones. The Application of Passive Sampler (DGT) Technology for Improved Understanding of Metal Behaviour at Marine Disposal Sites in the UK ICOBTE International Conference On Biogeochemistry of Trace Elements (Athens, Georgia, June 2013). Invited keynote.
• Thi Bolam, Ruth Parker, Claire Mason, Jon Barry, Silke Kröger, Briony Silburn, Dave Sivyer, Silvana Birchenough, Andrew Mayes and Gary Fones. The Application of Passive Sampler (DGT) Technology for Improved Understanding of Metal Behavior at Marine Disposal Sites. Conference on DGT and the environment (Lancaster, July 2013).
• Silvana Birchenough and Claire Mason. Fit for purpose monitoring: cost effective sampling to characterise a dredged material disposal site. Hyder consultancy LTD. Cefas, (Lowestoft, 18th September, 2012).
• Silvana Birchenough and Claire Mason. Monitoring and Assessment: An example of fit for purpose monitoring at Souter Point Dredged material disposal site. Environment Protection Agency Kuwait meeting Cefas, (Lowestoft, 1st May 2011).

35
• Silvana Birchenough. Application of the SPI Technology for application and development (Module 7, contract ME5403) MMO, (Date TBC)
8.2 Papers (in preparation)
1. R. Parker, T. Bolam, S. Kröger, C. Mason, S. Birchenough, B. Silburn, D. Sivyer, A. G. Mayes and G. R. Fones (in prep) The application of passive sampler (DGT) technology for improved understanding of metal behaviour at a marine disposal site. Environmental International.
2. S. Birchenough C. Mason. R. Parker, T. Bolam, S. Kröger, B. Silburn (in prep) Complimentary science to inform dredge disposal site monitoring – a holistic view of how to integrate different monitoring techniques. Marine Policy.

36
9. References
Aguilar-Martínez, R, Palacios-Corvillo MA, Greenwood R, Mills GA, Vrana B, Gómez-Gómez MM.
(2008). Calibration and use of the Chemcatcher passive sampler for monitoring organotin
compounds in water.Analytica Chimica Acta 618(2): 157-167
Birchenough, SNR, Boyd, SE, Coggan, RA, Limpenny, DS, Meadows, WL, Rees, HL (2006). Lights,
camera and acoustics: assessing macrobenthic communities at a dredged material disposal site off
the North East coast of the UK. Journal of Marine Systems 62, 204–216.
Birchenough, S N R, Blake, S J, Rees, J, Murray, L A, Mason, CE, Rees, HL, Vivian, C, Limpenny, DS
(2007) Contaminated dredged material: monitoring results from the first capping trial in the U.K. 4th
International Conference, Proceedings of the Port Development and Coastal Environment. Varna,
Bulgaria, pp. 107–119.
Birchenough, SNR, Frid, CLJ (2009) Macrobenthic succession following the cessation of sewage
sludge disposal. Journal of Sea Research 62, 258–267.
Birchenough, SNR, Parker, RE, Ware, S, Kroeger S, Mason, C, Bolam, T(2010). Development of
Sediment Profile Imagery (SPI) capability as a routine tool for monitoring marine environments.
Project ME1401 Final report for Defra. 60 pp.
Birchenough, SNR, Parker, ER, McManus, E, Barry, J (2012) Combining bioturbation and redox
metrics: potential tools for assessing seabed function. Ecological Indicators 12, 8-16
Birchenough, SNR, Parker, ER, Bolam, SG (2013) Assessing seasonal variability of benthic changes: In
situ observations using sediment profile imagery (SPI). Biogeochemistry Volume 113, Issue 1-3: 105-
117.
Blake, S (2009) The first UK offshore contaminated dredge material capping trial: Lessons Learned.
Defra report, 50pp.
Bolam, SG, Rees, HL, Somerfield, P, Smith, R, Clarke, KR, Warwick, RM, Atkins, M, Garnacho, E (2006)
Ecological consequences of dredged material disposal in the marine environment: A holistic
37
assessment of activities around the England and Wales coastline. Marine Pollution Bulletin 52, 415–
426.
Bolam, SG, Mason, C, Bolam, T, Whomersley, P, Birchenough, SNR, Curtis, M, Birchenough, A,
Vanstaen, K, Rumney, H, Barber, J, Law, R, Aldridge, J, Nye, V and Griffith, A (2009) Dredged material
disposal site monitoring across England and Wales: results of sampling under SLAB5 (2008-09). Cefas
contract report to Defra. 128 pp.
Bolam, SG, Mason, C, Bolam, T, Whomersley, P, Birchenough, SNR, Curtis, M, Birchenough, A.,
Rumney, H, Barber, J, Rance, J, Mc Ilwaine, P and Law, RLJ (2011) Dredged material disposal site
monitoring around the coast of England: results of sampling (2010). SLAB5 Project Report, Cefas, UK.
Borja, Á, Galparsoro, I, Irigoien, X, Iriondo, A, Menchaca, I, Muxika, I, Pascual, M, (2011) The
implementation of the European Marine Strategy Framework Directive: a methodological approach
for the assessment of the environmental status, from the Basque Country (Bay of Biscay). Marine
Pollution Bulletin, 62,889–904.
Borja, A, Elliott, M, Carstensen, J, Heiskanen, A, van de Bund, W, (2010) Marine management-
towards an integrated implementation of the european marine strategy framework and the water
framework V directives. Marine Pollution Bulletin, 60, 2175–2186.
Borja, A., (2006) The new European marine strategy directive: difficulties, opportunities and
challenges. Marine Pollution Bulletin 52, 239–242.
Bull, DC, and Williamson RB (2001) Prediction of principal metal-binding solid phases in estuarine
sediments from colour image analysis. Environmental Science and Technology, 35:1658-1662.
Ciffroy, P, Nia, Y and Garnier JM (2011) Probabilistic Multicompartmental Model for Interpreting
DGT Kinetics in Sediments. Environmental Science and Technology 45, 9558–9565
Davison W and Zhang H (2007) Progress in understanding the use of diffusive gradients in thin films
(DGT) – back to basics. Environmental Chemistry, 9: 1-13.
38
Davison W and Zhang H (1994) In situ speciation measurements of trace components in natural
waters using thin-film gels. Nature 367:546–8.
Davison, W, Fones GR, Grime GW. (1997) Dissolved metals in surface sediments and a microbial matt
at 100 micron resolution. Nature 387: 885-888.
Davison, W, Fones, GR, Harper, M, Teasdale, P, Zhang, H, 2000. Dialysis, DET and DGT: in situ
diffusional techniques for studying water, sediments and soils. In: Buffle, J., Horvai, G. (Eds.), In-Situ
Monitoring of Aquatic Systems: Chemical Analysis and Speciation. IUPAC. Wiley, New York, pp. 495–
569.
Defra (2010) Charting Progress 2 An assessment of the state of UK seas. Defra report x pp. (http://chartingprogress.defra.gov.uk/)
Eagle, R, Norton, M, Hardiman, P, Rolfe, M (1979) The field assessment of effects of dumping wastes
at sea: 5 disposals of solid wastes off the north east coast of England. Fish. Res. Tech. Rep. MAFF
Direct. Fish. Res., Lowestoft, vol. 51. 24 pp.
Fredette TJ and French GT (2004) Understanding the physical and environmental consequences of
dredged material disposal: history in New England and current perspectives Marine Pollution
Bulletin 49: 93–102.
Foden, J, Rogers, SI and Jones AP 2011. Human Pressures on UK seabed habitats: a cumulative impact assessment. Marine Ecology Progress Series, 428, 33-47.
Germano, JD,Rhoads, DC, Valente, RM, Carey, D and Solan, M (2011) The use of Sediment Profile
Imaging (SPI) for environmental impact assessments and monitoring studies: Lessons learned from
the past four decades. Oceanography and Marine Biology: An
Annual Review. Volume 49: 247-310.
King, CK, Simpson, SL, Smith, SV, Stauber, JL, Batley, GE (2005) Short-term accumulation of Cd and
Cu from water, sediment and algae by the amphipod Melita plumulosa and the bivalve Tellina
deltoidalis. Marine Ecology Progress Series, 287: 177–188.
Knox, A, Paller, M, and Roberts J (2012) Active Capping Technology—New Approaches for In Situ
Remediation of Contaminated Sediments. Remediation Journal 22:93-117
39
Manly F J (2008) Randomization, Bootstrap and Monte Carlo Methods in Biology: 2nd edition.
Chapman and Hall, London.
Mason, C (2011) NMBAQC’s Best Practice Guidance. Particle Size Analysis (PSA) for Supporting
Biological Analysis. National Marine Biological AQC Coordinating Committee, 72pp, Dec. 2011.
MEMG (2003) Group Co-ordinating Sea Disposal Monitoring. Final Report of the Dredging and
Dredged Material Disposal Monitoring Task Team. Science Series Aquatic Environmental
Monitoring Repoirts, CEFAS, Lowestoft, (55): 52pp.
Murray, LA (1994) Progress in England and Wales on the development of beneficial uses of dredged
material. In: Proceedings of the 2nd International Conference, Dredging 94, 13–6 November 1994,
Lake Buena Vista, Florida, USA, pp. 644–653.
R Development Core Team (2010) R: a language and environment for statistical computing. R
Foundation for Statistical Computing, Vienna, Austria. ISBN 3-900051-07-0, http://www.R-
project.org.
Rabouille C, Denis L, Dedieu K, Stora G, Lansard B, Grenz C (2001) Oxygen demand in coastal marine
sediments: comparing in situ microelectrodes and laboratory core incubations Journal of
Experimental Marine Biology and Ecology, 285/286:49–69
Rhoads DC, Germano JD (1982) Characterisation of organism-sediment relations using sediment
profile imaging:an efficient method of remote ecological monitoring of the seafloor Mar Ecol Prog
Ser 8:115-128
Roberts D, Birchenough SNR, Lewis C, Sanders B, Bolam T and Sheahan D (2013)
Ocean acidification increases the toxicity of contaminated sediments. Global Change Biology 19:
340–351.
Sapp M, Parker ER, Teal LR, Schratzberger M (2010) Advancing the understanding of biogeography-
diversity relationships of benthic microorganisms in the North Sea. FEMS Microbiol Ecol 74: 410-429

40
Simpson, S, Yverneau H, Cremazy, A, Jarolimek, CV, Price H and Jolley DF (2012) DGT-Induced Copper
Flux Predicts Bioaccumulation and Toxicity to Bivalves in Sediments with Varying Properties.
Environmental Science and Technology, 46, 9038−9046
Simpson, SL, Yverneau, H, Cremazy, A, Jarolimek, CV, Price, H, Jolley, DF (2012) DGT-induced copper
flux predicts bioaccumulation and toxicity to bivalves in sediments with varying properties.
Environmental Science and Technology (Washington), 46 (16), 9038-9046.
Stockdale, A, Davison W and Hao, Z (2009) Micro-scale biogeochemical heterogeneity in sediments:
A review of available technology and observed evidence. Earth-Science Reviews 92: 81-97.
Tankere-Muller, S, Zhang H, Davison W, Finke N, Larsen O, Stahld H, Gludd RN (2007) Fine scale
remobilisation of Fe, Mn, Co, Ni, Cu and Cd in contaminated marine sediment. Marine Chemistry
106(1-2): 192-207.
Teal, LR, Parker ER, Fones, GR, Solan, M (2009) Simultaneous determination of in situ vertical
transitions of color, pore-water metals, and visualisation of infaunal activity in marine sediments.
Limnology and Oceanography 54 (5): 1801-1810.
Teal, LR, Parker, ER; Solan, M (2013) Coupling bioturbation activity to metal (Fe and Mn) profiles in
situ. Biogeosciences 10: 2365 – 2378.
Teasdale, PR, Hayward, S, Davison, W. (1999) In situ, high-resolution measurement of dissolved
sulfide using diffusive gradients in thin films with computer-imaging densitometry. Analytical
Chemistry, 71, 2186–2191.
Van Hoey, G Borja, A, Birchenough, SNR, Degraer, S, Fleischer, D, Magni, P , Muxika, I, Reiss, H,
Rumohr, H, Schröder, A., Zettler, M (2010). The use of benthic indicators in Europe: from the Water
framework directive to the marine strategy framework directive. Marine Pollution Bulletin 60 (12),
2187–2196.
Verardo, DJ, Froelich, PN, McIntyre, A (1990) Determination of organic carbon and nitrogen in
marine sediments using the Carlo Erba NA-1500 analyzer. Deep-Sea Research, 37, 157–165

41
Waldock, R, Paipai, E, Bolam, SG (2003) New land from old, beneficial use of dredged material.
Dredging and Port Construction. DMG World Media Limited, Southwick, UK, pp. 26–29 (January).
Wood, SN, (2006) Generalized Additive Models: An Introduction with R. Chapman and Hall/CRC,
London.
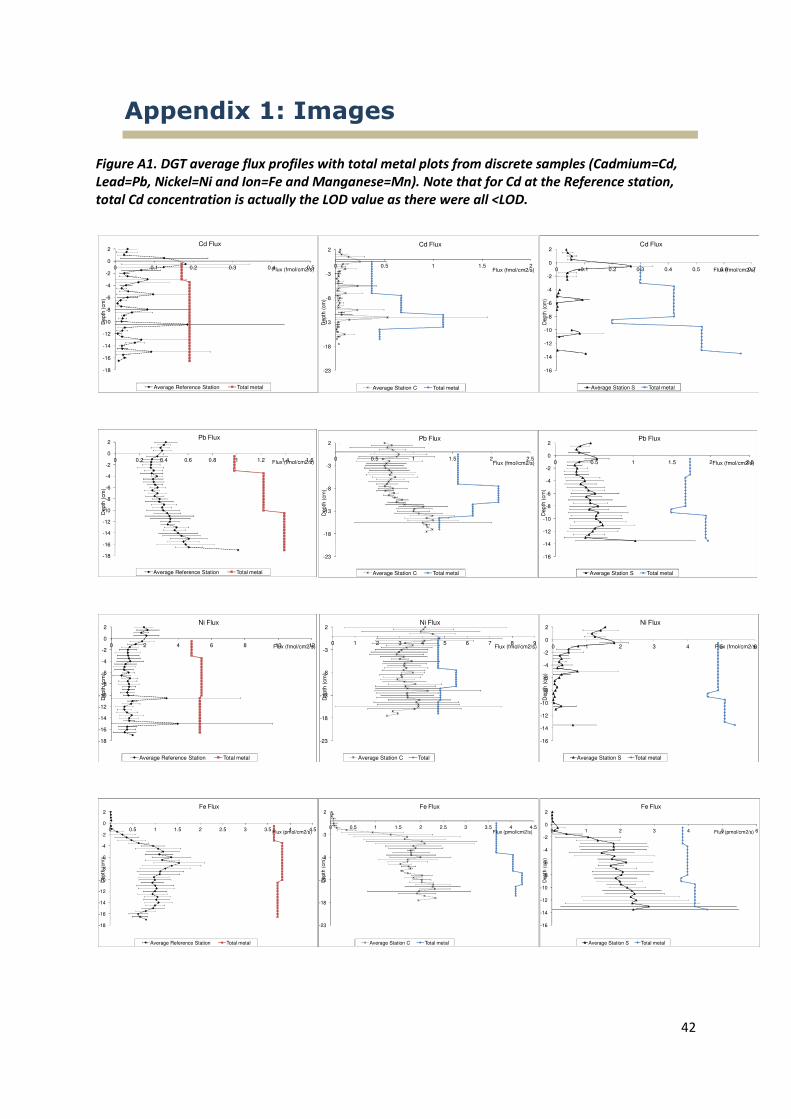
42
Appendix 1: Images
Figure A1. DGT average flux profiles with total metal plots from discrete samples (Cadmium=Cd,
Lead=Pb, Nickel=Ni and Ion=Fe and Manganese=Mn). Note that for Cd at the Reference station,
total Cd concentration is actually the LOD value as there were all <LOD.
-18
-16
-14
-12
-10
-8
-6
-4
-2
0
2
0 0.1 0.2 0.3 0.4 0.5
Depth
(cm
)
Flux (fmol/cm2/s)
Cd Flux
Average Reference Station Total metal
-23
-18
-13
-8
-3
2
0 0.5 1 1.5 2
Depth
(cm
)
Flux (fmol/cm2/s)
Cd Flux
Average Station C Total metal
-16
-14
-12
-10
-8
-6
-4
-2
0
2
0 0.1 0.2 0.3 0.4 0.5 0.6 0.7
Depth
(cm
)
Flux (fmol/cm2/s)
Cd Flux
Average Station S Total metal
-18
-16
-14
-12
-10
-8
-6
-4
-2
0
2
0 0.2 0.4 0.6 0.8 1 1.2 1.4 1.6
Depth
(cm
)
Flux (fmol/cm2/s)
Pb Flux
Average Reference Station Total metal
-23
-18
-13
-8
-3
2
0 0.5 1 1.5 2 2.5
Dep
th (
cm
)
Flux (fmol/cm2/s)
Pb Flux
Average Station C Total metal
-16
-14
-12
-10
-8
-6
-4
-2
0
2
0 0.5 1 1.5 2 2.5
Dep
th (
cm
)
Flux (fmol/cm2/s)
Pb Flux
Average Station S Total metal
-18
-16
-14
-12
-10
-8
-6
-4
-2
0
2
0 2 4 6 8 10 12
Depth
(cm
)
Flux (fmol/cm2/s)
Ni Flux
Average Reference Station Total metal
-23
-18
-13
-8
-3
2
0 1 2 3 4 5 6 7 8 9
Depth
(cm
)
Flux (fmol/cm2/s)
Ni Flux
Average Station C Total
-16
-14
-12
-10
-8
-6
-4
-2
0
2
0 1 2 3 4 5 6
Depth
(cm
)
Flux (fmol/cm2/s)
Ni Flux
Average Station S Total metal
-18
-16
-14
-12
-10
-8
-6
-4
-2
0
2
0 0.5 1 1.5 2 2.5 3 3.5 4 4.5
Depth
(cm
)
Flux (pmol/cm2/s)
Fe Flux
Average Reference Station Total metal
-23
-18
-13
-8
-3
2
0 0.5 1 1.5 2 2.5 3 3.5 4 4.5
Depth
(cm
)
Flux (pmol/cm2/s)
Fe Flux
Average Station C Total metal
-16
-14
-12
-10
-8
-6
-4
-2
0
2
0 1 2 3 4 5 6
Depth
(cm
)
Flux (pmol/cm2/s)
Fe Flux
Average Station S Total metal
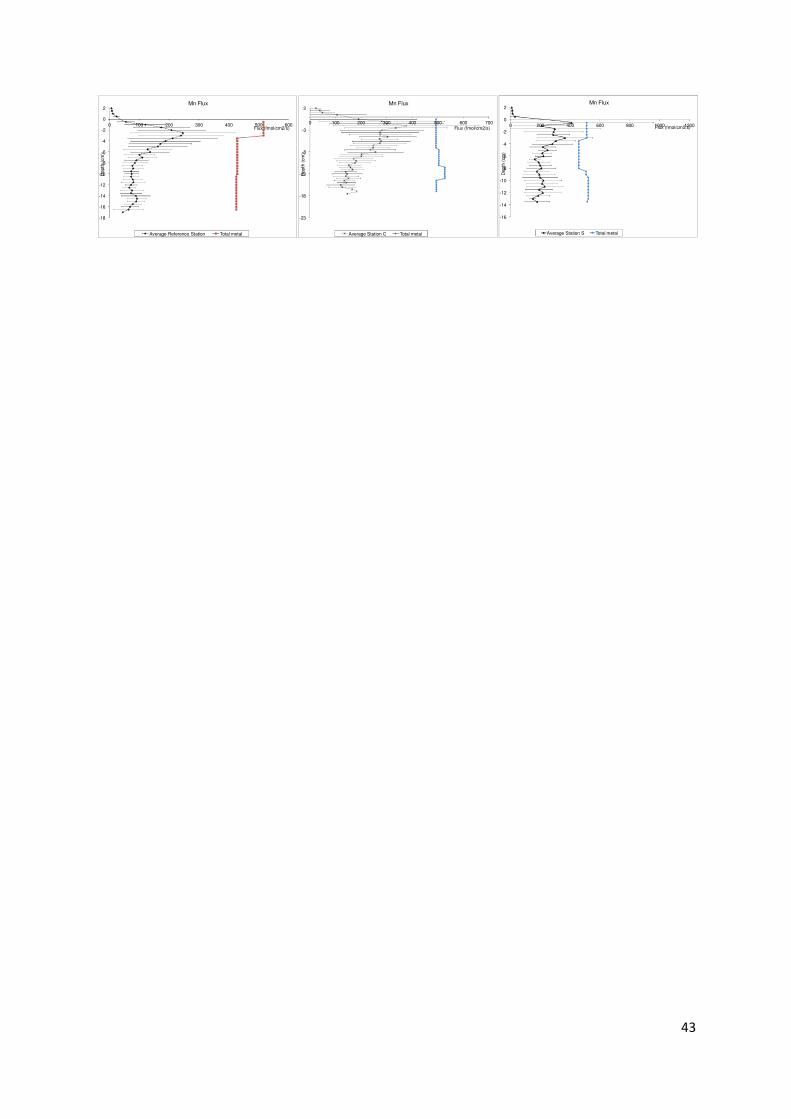
43
-18
-16
-14
-12
-10
-8
-6
-4
-2
0
2
0 100 200 300 400 500 600
Depth
(cm
)
Flux (fmol/cm2/s)
Mn Flux
Average Reference Station Total metal
-23
-18
-13
-8
-3
2
0 100 200 300 400 500 600 700
Depth
(cm
)
Flux (fmol/cm2/s)
Mn Flux
Average Station C Total metal
-16
-14
-12
-10
-8
-6
-4
-2
0
2
0 200 400 600 800 1000 1200
Depth
(cm
)
Flux (fmol/cm2/s)
Mn Flux
Average Station S Total metal
© Crown copyright 2011
About us Cefas is a multi-disciplinary scientific research and
consultancy centre providing a comprehensive range
of services in fisheries management, environmental
monitoring and assessment, and aquaculture to a large
number of clients worldwide.
We have more than 500 staff based in 2 laboratories,
our own ocean-going research vessel, and over 100 years
of fisheries experience.
We have a long and successful track record in
delivering high-quality services to clients in a confidential
and impartial manner.
(www.cefas.defra.gov.uk)
Cefas Technology Limited (CTL) is a wholly owned
subsidiary of Cefas specialising in the application of Cefas
technology to specific customer needs in a cost-effective
and focussed manner.
CTL systems and services are developed by teams that
are experienced in fisheries, environmental management
and aquaculture, and in working closely with clients to
ensure that their needs are fully met.
(www.cefastechnology.co.uk)
Customer focus With our unique facilities and our breadth of expertise in
environmental and fisheries management, we can rapidly put
together a multi-disciplinary team of experienced specialists,
fully supported by our comprehensive in-house resources.
Our existing customers are drawn from a broad spectrum
with wide ranging interests. Clients include:
• international and UK government departments
• the European Commission
• the World Bank
• Food and Agriculture Organisation of the United Nations
(FAO)
• oil, water, chemical, pharmaceutical, agro-chemical,
aggregate and marine industries
• non-governmental and environmental organisations
• regulators and enforcement agencies
• local authorities and other public bodies
We also work successfully in partnership with other
organisations, operate in international consortia and have
several joint ventures commercialising our intellectual
property
.
Head office
Centre for Environment, Fisheries & Aquaculture Science Centre for Environment, Fisheries & Aquaculture Science
Pakefield Road, Lowestoft, Barrack Road, The Nothe Suffolk NR33 0HT UK Weymouth, DT4 8UB
Tel +44 (0) 1502 56 2244 Tel +44 (0) 1305 206600
Fax +44 (0) 1502 51 3865 Fax +44 (0) 1305 206601
Web www.cefas.defra.gov.uk
printed on paper made from a minimum 75% de-inked post-consumer waste


